Superconductivity and topological aspects of the rock-salt carbides NbC and TaC
Abstract
Superconducting materials with a nontrivial band structure are potential candidates for topological superconductivity. Here, by combining muon-spin rotation and relaxation (SR) methods with theoretical calculations, we investigate the superconducting and topological properties of the rock-salt-type compounds NbC and TaC (with = 11.5 and 10.3 K, respectively). At a macroscopic level, the magnetization and heat-capacity measurements under applied magnetic field provide an upper critical field of 1.93 and 0.65 T for NbC and TaC, respectively. The low-temperature superfluid density, determined by transverse-field SR and electronic specific-heat data, suggest a fully-gapped superconducting state in both NbC and TaC, with a zero-temperature gap and 1.45 meV, and a magnetic penetration depth = 141 and 77 nm, respectively. Band-structure calculations suggest that the density of states at the Fermi level is dominated by the Nb - (or Ta -) orbitals, which are strongly hybridized with the C -orbitals to produce large cylinder-like Fermi surfaces, similar to those of high- iron-based superconductors. Without considering the spin-orbit coupling (SOC) effect, the first Brillouin zone contains three closed node lines in the bulk band structure, protected by time-reversal and space-inversion symmetry. When considering SOC, its effects in the NbC case appear rather modest. Therefore, the node lines may be preserved in NbC, hence proposing it as a potential topological superconductor.
I Introduction
Recently, the binary TMA materials have been widely studied due to their exotic physical properties. Here, TM represents an early transition metal (e.g., Cr, Nb, Mo, Ta, or W), while A represents a carbon-, pnictogen-, or chalcogen group element (e.g., C, P, or As). Some TMA materials are believed to exhibit unconventional superconductivity (SC). For instance, originally CrAs and MnP exhibit antiferromagnetic and ferromagnetic long-range order below 264 K and 290 K, respectively Cheng and Luo (2017). Under applied pressure, the magnetic order is suppressed and a dome-like superconducting phase appears near the magnetic quantum critical point, suggesting an unconventional SC pairing in these materials Wu et al. (2014); Kotegawa et al. (2015); Cheng et al. (2015); Cheng and Luo (2017); Park et al. (2019). Beyond superconductivity, TMAs are among the best candidate materials for studying topological phenomena. Weyl fermions, originally predicted in high-energy physics Weyl (1929), were recently discovered as quasiparticles in Ta(As,P) and Nb(As,P) crystals via angle-resolved photoemission experiments Xu et al. (2015a, b); Lv et al. (2015); Xu et al. (2016); Souma et al. (2016). Later on, three-component fermions were experimentally observed in MoP and WC Lv et al. (2017); Ma et al. (2018). Now, all the above mentioned TMA materials are known as Weyl- or topological semimetals.
The materials where superconductivity coexists with a nontrivial topological band structure may exhibit emergent phenomena, such as topological superconductivity and Majorana fermions Qi and Zhang (2011a); Kitaev (2001). By applying external pressure, the topological semimetal MoP becomes a superconductor, whose raises up to 4 K (above 90 GPa) Chi et al. (2018), thus representing a candidate topological superconductor. In contrast to MoP, the orthorhombic WP is a superconductor already at ambient pressure (below 0.8 K) Liu et al. (2019), but its topological nature is not yet known. In addition to MoP and WP, the transition-metal carbides (TMCs), too, can exhibit a large variety of band topologies in their different structural forms. The TMCs provide an exciting family of candidate materials for studying the rich physics of topological SC and Majorana bound states. Generally, TMCs with a 1:1 metal-carbon stoichiometric ratio adopt two types of crystal structures. One is the so-called -phase, a centrosymmetric cubic structure with space group (No. 225), also known as rock-salt phase. The other is the -phase, a noncentrosymmetric hexagonal structure with space group (No. 187). The above mentioned topological MoP and WC semimetals crystallize in the -phase. In case of MoC, although its SC has been reported in the 1970s Willens et al. (1967), its physical properties have been overlooked due to difficulties in synthesizing clean samples. Only recently, the carbon-defective - and -phase of MoC1-x (with = 14.3 and 8.5 K) could be synthesized under high-temperature high-pressure conditions (1700 ∘C, 6–17 GPa), and their crystal structures and physical properties be studied via different techniques Yamaura et al. (2006); Sathish et al. (2012, 2014). Moreover, in both - and -MoC, first-principle calculations could show the coexistence of SC with nontrivial band topology Huang et al. (2018).
Other TMCs, such as -type VC and CrC, are also predicted to be superconductors with nontrivial topological band structures and, therefore, are candidates for topological superconductivity Zhan and Luo (2019). Although both VC and CrC should exhibit relatively high critical temperatures Isaev et al. (2007); Tütüncü et al. (2012); Kavitha et al. (2016); Szymanski et al. (2019), to date experimental evidence is inconsistent. For VC, the experimentally reported value ( K) is an order of magnitude less than the theoretically predicted one (18 K) Ziegler and Young (1953); Szymanski et al. (2019). As for CrC, experimental evidence of SC is still missing. Besides MoC, also NbC and TaC show rock-salt type structures Kazumasa and Masatomo (2008) and become superconductors below 11 K Willens et al. (1967); Williams (1971); Toth (1971). Unlike MoP or MoC, where extremely high pressures are required to induce SC, either during synthesis or as an external tuning parameter Chi et al. (2018); Yamaura et al. (2006); Sathish et al. (2012, 2014), NbC and TaC are easy to synthesize and show SC already at ambient pressure. However, to the best of our knowledge, none of the early works had a follow-up regarding the microscopic investigation of their superconducting properties. Considering that -type VC and CrC show nontrivial topological band structures, we expect the isostructural NbC and TaC, too, to exhibit similar features.
In this paper, we report on an extensive study of the superconducting properties of the NbC and TaC carbides, carried out via magnetization, heat-capacity, and muon-spin relaxation/rotation (SR) measurements. In addition, we also present numerical density-functional-theory (DFT) band-structure calculations. We find that both NbC and TaC exhibit a fully-gapped superconducting state, while their electronic band structures suggest that, without considering spin-orbit coupling (SOC), both compounds are nodal line semimetals. After taking SOC into account, the degenerate bands are gapped out, except for six Dirac points on the high-symmetry lines. Therefore, these two carbides are potential candidates for studying topological SC and its associated Majorana bound states.
II Experimental and numerical methods
The samples consisted of high-purity NbC and TaC (99+%) powders acquired from ChemPUR. For the heat-capacity and SR measurements the powders were pressed into small pellets, while for the magnetization measurements loose powders were used. Room-temperature x-ray powder diffraction (XRD) measurements were performed on a Bruker D8 diffractometer using Cu K radiation. The magnetic susceptibility, and heat capacity measurements were performed on a 7-T Quantum Design magnetic property measurement system (MPMS-7) and a 9-T physical property measurement system (PPMS-9). The SR measurements were carried out at the general-purpose-surface-muon (GPS) spectrometer of the Swiss muon source at Paul Scherrer Institut, Villigen, Switzerland Amato et al. (2017). The SR data were analysed by means of the musrfit software package Suter and Wojek (2012).
The electronic band structures of NaC and TaC were calculated via the density functional theory, within the generalized gradient approximation (GGA) of Perdew-Burke-Ernzerhof (PBE) realization Perdew et al. (1996), as implemented in the Vienna ab-initio Simulation Package (VASP) Kresse and Furthmüller (1996, 1996). The projector augmented wave (PAW) pseudopotentials were adopted for the calculation Kresse and Joubert (1999); Blöchl (1994). Electrons belonging to the outer atomic configuration were treated as valence electrons, here corresponding to 5 electrons in Ta (), 11 electrons in Nb (), and 4 electrons in C (). The kinetic energy cutoff was fixed to 550 eV. For the self-consistent calculation, the Brillouin zone integration was performed on a -centered mesh of -points. The spin-orbit coupling was taken into account by using a scalar relativistic approximation. In our calculations we used the lattice parameters and the atomic positions experimentally determined from the Rietveld refinements.
III Results and discussion
III.1 Crystal structure
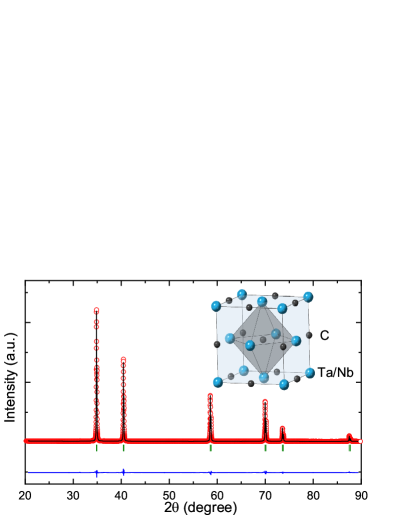
The phase purity and the crystal structure of NbC and TaC powders were checked via XRD at room temperature. Figure III.1 shows the XRD pattern of TaC (with NbC showing a similar pattern), analyzed by means of the FullProf Rietveld-analysis suite Rodríguez-Carvajal (1993). Consistent with previous neutron scattering results Kazumasa and Masatomo (2008), we find that NbC and TaC powders crystallize in the simple face-centered-cubic (FCC) NaCl-type structure, with space group (No. 225) (see crystal structure in the inset of Fig. III.1). There are only two atomic positions in the unit cell: (0, 0, 0) for the Nb/Ta atoms, and (0.5, 0.5, 0.5) for the C atoms. The refined lattice parameters, Å (NbC) and Å (TaC), are consistent with the values determined from neutron scattering Kazumasa and Masatomo (2008). No impurity phases could be detected in either case, thus indicating a good sample quality.
III.2 Magnetization measurements
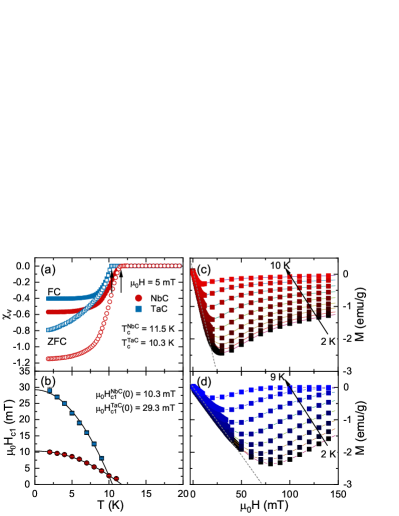
The superconductivity of the NbC and TaC powders was first characterized by magnetic susceptibility measurements, carried out in a 5-mT field, using both field-cooled (FC) and zero-field-cooled (ZFC) protocols. As indicated by the arrows in Fig. III.1(a), a clear diamagnetic signal appears below the superconducting transition at = 11.5 K and 10.3 K for NbC and TaC, respectively. The data for NbC and TaC are plotted in Fig. III.1(c) and Fig. III.1(d), respectively. In both cases, the field-dependent magnetization , collected at various temperatures up to , allowed us to determine the lower critical field . The estimated values as a function of temperature are summarized in Fig. III.1(b). The solid lines represent fits to and yield a lower critical field of 10.3(3) and 29.3(3) mT for NbC and TaC, respectively.
III.3 Upper critical fields
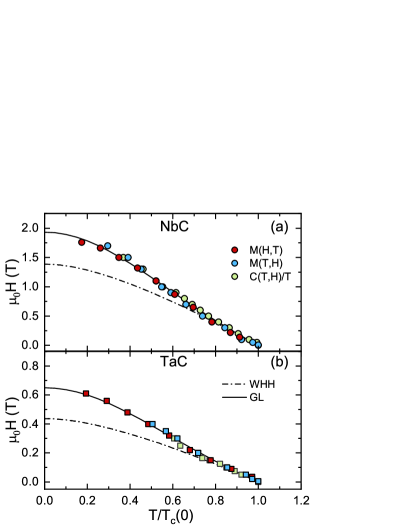
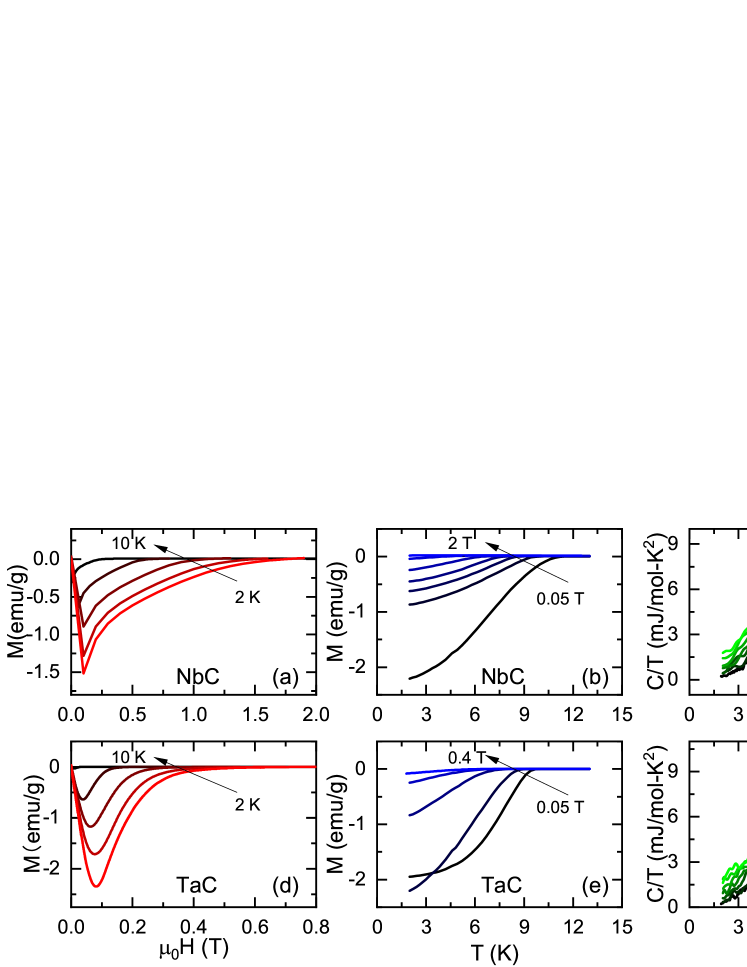
To estimate the upper critical field of NbC and TaC, temperature-dependent magnetization and specific-heat / measurements, at various applied magnetic fields, as well as field-dependent magnetization measurements, at various temperatures, were performed. As shown in Figs. III.2(a) and (d), in both samples, the diamagnetic signal progressively disappears as the applied magnetic field exceeds the upper critical field. In Figs. III.2(b)-(c) and in Figs. III.2(e)-(f), the superconducting transition in both and / datasets shifts towards lower temperatures as the applied field increases. In zero magnetic field, = 10.8 and 10.2 K, determined from / for NbC and TaC, are consistent with the values determined from magnetic susceptibility data [Fig. III.1(a)]. The upper critical fields determined from , , and data are summarized in Figs. III.3(a) and (b) as a function of the reduced superconducting transition temperature /(0) for NbC and TaC, respectively. The behavior was analyzed by means of the Werthamer-Helfand-Hohenberg (WHH) and Ginzburg-Landau (GL) models Werthamer et al. (1966); Zhu et al. (2008); Tinkham (1996). Both models describe the experimental data very well at low fields. However, at higher applied fields, the fits to the WHH model (dash-dotted lines) deviate significantly from the data, clearly providing underestimated values. Conversely, the GL model (solid lines) shows a remarkable agreement with the experimental data also at higher fields. Fits to the GL model, which reproduces the data very well across the full temperature range, provide = 1.93(1) T and 0.65(1) T for NbC and TaC, respectively.
III.4 Zero-field SR
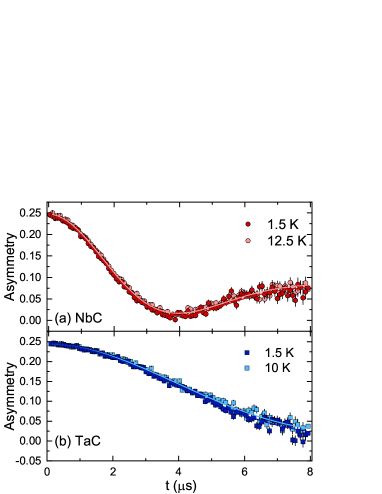
Zero-field (ZF) SR measurements are quite suited for detecting possible magnetic order or magnetic fluctuations, as well as time-reversal symmetry breaking in the superconducting state. Here, we performed ZF-SR measurements in both the normal- and the superconducting states of NbC and TaC, with representative spectra collected above and below being shown in Fig. III.3. In either case, neither coherent oscillations nor fast decays could be identified, hence implying the lack of any magnetic order or fluctuations. The weak muon-spin relaxation we detect in absence of an external magnetic field is mainly due to the randomly oriented nuclear moments, which can be modeled by a Gaussian Kubo-Toyabe relaxation function Kubo and Toyabe (1967); Yaouanc and de Réotier (2011). Here, is the zero-field Gaussian relaxation rate.
The solid lines in Fig. III.3 represent fits to the data by considering also an additional zero-field Lorentzian relaxation , i.e., . Here and represent the initial muon-spin asymmetries for muons implanted in the sample and sample holder (copper), respectively. In either carbide compound, the relaxations in both the normal- and the superconducting states are almost identical, as demonstrated by the practically overlapping ZF-SR spectra above and below . This lack of evidence for an additional SR relaxation below excludes a possible time-reversal symmetry breaking in the superconducting state of NbC or TaC and is supported also by the theoretical arguments discussed in Sec. III.7. The larger Gaussian relaxation rate of NbC ( s-1) compared to TaC ( = 0.183 s-1) reflects the larger nuclear magnetic moment of 93Nb (6.2 ) compared to 181Ta (2.4 ), the two ratios (in presence of similar structures) being almost the same, . Finally, both samples show a very small Lorentzian relaxation ( 0.011 s-1). Unlike in pure Nb, where there is a clear muon hopping (with a mobility minimum at 50 K) and where a dynamic Kubo-Toyabe function describes the ZF-SR spectra quite well Grassellino et al. (2013), in the NbC and TaC case, no dynamic features were observed.
III.5 Transverse-field SR
To investigate the superconducting properties of NbC and TaC at a microscopic level, we carried out systematic transverse-field (TF) SR measurements. Generally, performing such measurements on type-II superconductors requires an applied magnetic field which exceeds , thus allowing one to quantify the additional field-distribution broadening due to the flux-line lattice (FLL). Ideally, the optimal field value for such measurements is determined experimentally, via field-dependent SR depolarization-rate measurements in the superconducting state. To track the additional field-distribution broadening due to the FLL in the mixed superconducting state, a magnetic field (up to 780 mT) was applied in the normal state and then the sample was cooled down to 1.5 K, where the TF-SR spectra were collected.
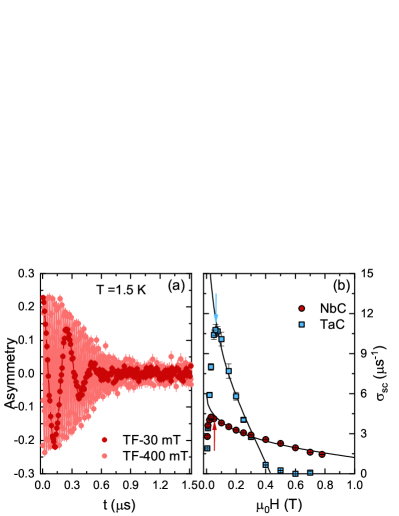
As an example, Fig. III.4(a) shows the spectra collected in an applied field of 30 and 400 mT in NbC, with TaC showing similar features. The solid lines are fits using the same model as described in Eq. (1) below.
The resulting superconducting Gaussian relaxation rates are summarized in Fig. III.4(b). For both NbC and TaC, the relaxation rate decreases continuously when the applied field is larger than the lower critical field . Therefore, as indicated in Fig. III.4(b), fields of 50 and 60 mT were chosen as suitable for the temperature-dependent TF-SR studies of NbC and TaC, respectively. The field-dependent Gaussian relaxation rate can be described by the expression Barford and Gunn (1988); Brandt (2003):
| (1) |
where is the magnetic penetration depth, MHz/T is the muon gyromagnetic ratio, and , with the applied magnetic field. The above expression is valid for type-II superconductors with in the 1 field range. With 13 and 5, and = 0.026 and 0.092 for NbC and TaC, both samples fulfill the above conditions. The solid lines in Fig. III.4(b) are fits to the above equation. The derived = 1.81(2) and 0.43(1) T and magnetic penetration depths = 134(2) and 67(1) nm for NbC and TaC are comparable with the measured upper critical field values (see Fig. III.3) and those determined via temperature-dependent TF-SR (see Fig. III.5).
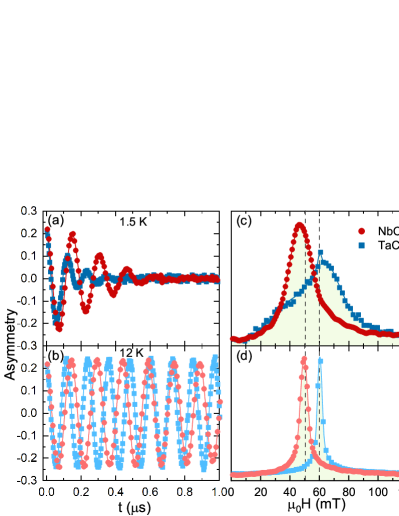
TF-SR spectra were also collected at various temperatures up to in a fixed applied field. Figures III.5(a) and (b) show representative TF-SR spectra, collected below (1.5 K) and above (12 K), for both NbC and TaC. The additional field distribution broadening due to FLL in the mixed state is clearly reflected in the enhanced muon-spin depolarization below . To describe the field distribution, the asymmetry of TF-SR spectra can be modelled using:
| (2) |
Here and are the same as in ZF-SR, with the latter term not undergoing any depolarization. and are the local fields sensed by implanted muons in the sample and sample holder, is a shared initial phase, and is the Gaussian relaxation rate of the th component.
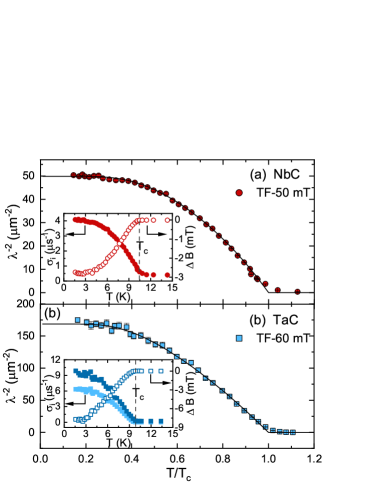
Figures III.5(c) and (d) show the fast Fourier transform (FFT) of the TF-SR spectra in Fig. III.5(a) and (b), respectively. As can be seen in Fig. III.5(c), the field distribution in TaC is much broader and asymmetric than in NbC, consistent with a larger muon-spin depolarization in TaC in Fig. III.5(a). Solid lines represent fits to Eq. (2) using a single oscillation (i.e., ) or two oscillations (i.e., ) for NbC and TaC, respectively. The derived Gaussian relaxation rates as a function of temperature are summarized in the insets of Fig. III.5, together with the diamagnetic shifts. Above the relaxation rate is small and temperature-independent, but below it starts to increase due to the formation of the FLL and the increase in superfluid density. In addition, a diamagnetic field shift appears in both samples below .
In case of multi-component oscillations, the first term in Eq. (2) describes the field distribution as the sum of Gaussian relaxations (here for TaC) Maisuradze et al. (2009):
| (3) |
The first- and the second moments of the field distribution can be calculated by Maisuradze et al. (2009):
| (4) | ||||
where . After subtracting the nuclear relaxation rate , according to , the superconducting Gaussian relaxation rate can be extracted. The is considered to be temperature independent, as confirmed also by the ZF-SR data in Fig. III.3.
For both NbC and TaC, the inverse-square of the magnetic penetration depth [proportional to the superfluid density ] is calculated by using Eq. (1) and shown in the main panels of Fig. III.5 vs. the reduced . Below , the superfluid density is almost constant, thus excluding the possibility of superconducting gap nodes and indicating a fully-gapped SC in NbC and TaC. To gain more quantitative insights into the superconductivity of NbC and TaC, the superfluid density was further analyzed by means of a fully-gapped -wave model:
| (5) |
Here and are the Fermi- and the superconducting-gap functions. The is assumed to follow Carrington and Manzano (2003), where is the zero-temperature superconducting gap value. The solid lines in the main panels of Fig. III.5 are fits to the above model with a single gap, which yield a zero-temperature gap values = 1.90(2) and 1.45(1) meV, and magnetic penetration depths = 141(2) and 77(1) nm for NbC and TaC, respectively. Since in NbC, the 1, the magnetic penetration depth can also be calculated using Brandt (2003), which gives a comparable = 162(2) nm.
According to the GL theory of superconductivity, the coherence length can be calculated by using = , where T nm2 is the quantum of magnetic flux. With a bulk = 1.93(1) T and 0.65(1) T, the calculated are 13.1(1) nm and 22.5(1) nm for NbC and TaC, respectively. A GL parameter 11 (NbC) and 3.4 (TaC), much larger than the threshold value, clearly confirms type-II superconductivity in both NbC and TaC, consistent with the magnetization results in Sec. III.2.
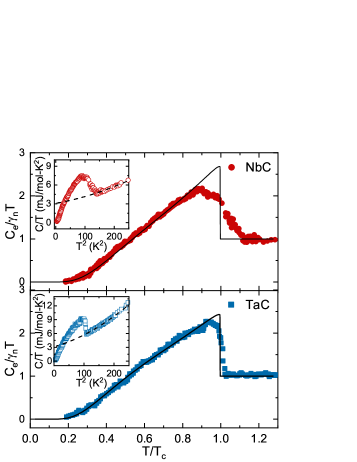
III.6 Zero-field specific heat
The zero-field electronic specific-heat data were further analyzed. As shown by the dashed lines in the insets of Fig. III.5, the normal-state specific heat was fitted to , where is the normal-state electronic specific heat coefficient, and the two other terms account for the phonon contribution to the specific heat. After subtracting the phonon contribution from the experimental data, the electronic specific heat divided by the electronic specific-heat coefficient, i.e., , is shown in the main panels of Fig. III.5 vs. the reduced temperature . The solid lines in Fig. III.5 represent fits with = 3.0(4) and 3.1(8) mJ/mol-K2 and a single isotropic gap and 1.54(2) meV for NbC and TaC, respectively. They reproduce very well the experimental data, while being comparable with the TF-SR results (see Fig. III.5).
The Debye temperature can be calculated by using , where J/mol-K is the molar gas constant and is the number of atoms per formula unit.
With = 8.0(8) and 19(2) J/mol-K4, the estimated are 790(20) and 590(20) K for NbC and TaC, respectively. The density of states (DOS) at the Fermi level was evaluated from the expression 1.3 states/eV-f.u. for both NbC and TaC Kittel (2005), where is the Boltzmann constant. The electron-phonon coupling constant was estimated from the and values by using the semi-empirical McMillan formula McMillan (1968):
| (6) |
The Coulomb pseudopotential , typically lying in the 0.09–0.18 range, was fixed here to 0.13, a commonly used value for transition metals. From the above expression, we obtain = 0.60(1) and 0.65(3) for NbC and TaC, both consistent with theoretical values Isaev et al. (2007). Finally, the band-structure density of states can be estimated from the relation ) Kittel (2005), which gives 0.8 states/eV-f.u. for both compounds.
III.7 Electronic band-structure calculations
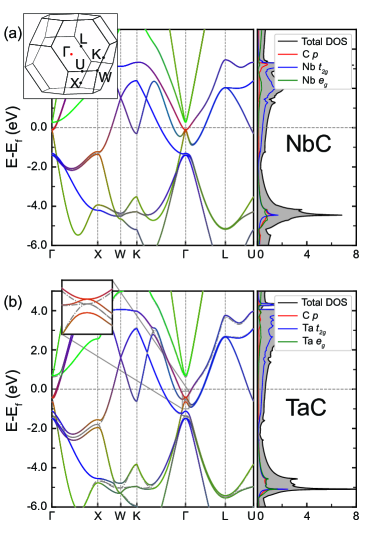
To further understand the electronic properties of NbC and TaC, we also performed DFT calculations. The electronic band structure results, as well as the density of states (DOS) are depicted in Fig. III.5. Since NbC and TaC adopt the same rock-salt structure (see Fig. III.1), it is natural that their band structures and DOS profiles are quite similar. Close to the Fermi level the bands are dominated by the -electrons of TMs (Nb or Ta), while the contribution from the C -electrons is quite modest. The - and -electrons are highly hybridized. The bands which cross the Fermi level are mainly occupied by the (, , and ) orbitals of TM, with marginal contributions from the - ( and ) or the -orbitals of C. The occupied bands are mainly located about 4.0 eV below the Fermi level, while the unoccupied bands extend from 0.5 eV to above 5.0 eV. In TaC, the sixfold degenerate point at the point below the Fermi level is split into one doubly-degenerate and one four-degenerate point by the spin-orbit coupling, as shown in the inset of Fig. III.5(b). In the lighter NbC, the SOC splitting is less evident. Also the bands along the - direction are split, the maximum band splitting being about 400 meV in TaC, which is much larger than 130 meV in NbC. In both cases, the band splitting is caused by the dominant SOC of the Ta or Nb -electrons. As shown in the right panels of Fig. III.5, the estimated DOS at the Fermi level is 0.74 states/eV-f.u. for NbC, slightly higher than 0.64 states/eV-f.u. in TaC. Both values are comparable to the experimental value calculated from the electronic specific-heat coefficient (see Sec. III.6 and Table IV).
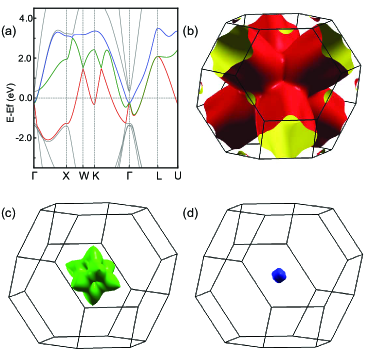
There are three bands crossing the Fermi level, highlighted by different colors in Fig. III.6(a) for the NbC case. We depict each Fermi surface (FS) of these three bands in Fig. III.6(b)-(d), respectively. Since TaC exhibits a similar band structure, here we show only the Fermi-surface plots of NbC. The three bands form three distinct electron FSs, one of which consists of three large cylinders along the , , and directions [see Fig. III.6(b)]. Such large cylinder-like FSs originate from the hybridization between the TM -orbitals and C -orbitals. The cylinder-like FSs are known to play an important role in the superconductivity of high- iron-based materials Mazin et al. (2008); Kuroki et al. (2009); Mazin et al. (2019). This might be also the case of NbC and TaC carbides, both of which exhibit relatively high superconducting temperatures. The other two small FSs shown in Figs. III.6(c) and (d) are more three-dimensional-like compared to the large FS in Fig. III.6(b).
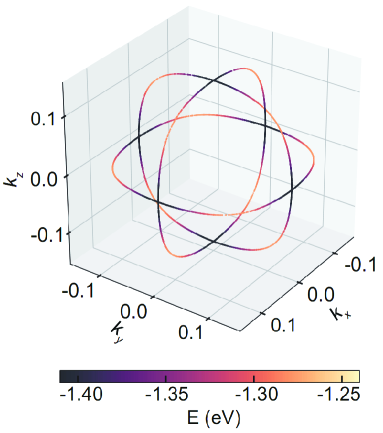
After checking the band structure (without SOC) across the whole Brillouin zone, we could identify three closed nodal loops, lying in the , , and planes and centered at the point. These are shown in Fig. III.7 for the NbC case, with TaC displaying similar features. We recall that NbC and TaC have the same rock-salt structure, with a space group (No. 225), characterized by three mirror planes, i.e., , , and . According to a symmetry analysis Zeng et al. (2015), the nodal loops are protected by the three mirror symmetries, since the crossing bands belong to different mirror eigenvalues. When considering SOC, the nodal loops become gapped, except for the six Dirac points , , and , which are protected by the and the combined space-time inversion symmetry. Clearly, this is consistent with the preserved time-reversal symmetry we find from the ZF-SR results. Since Nb atoms exhibit a weaker intrinsic SOC, we propose that NbC should be a good candidate for studying the exotic 2D surface states, as well as topological superconductivity Zhao et al. (2016).
IV Discussion
The possibilities offered by topological superconductors, ranging from hosting Majorana fermion quasiparticles to potential applications in topological quantum computing Qi and Zhang (2011a); Kitaev (2001); Qi and Zhang (2011b), have spurred the researchers to explore different routes in the search for materials that can realize them. One approach consists in combining conventional -wave superconductors with topological insulators to form heterostructures. The resulting proximity effect between the respective surface states can lead to a two-dimensional superconducting state with pairing, known to support Majorana bound states at the vortices Fu and Kane (2008). For instance, evidence of topological SC has been reported in NbSe2/Bi2(Se,Te)3 Xu et al. (2014a, b), where NbSe2 represents a typical fully-gapped superconductor, while Bi2(Se,Te)3 are both well known topological insulators. Regrettably, the complexity and difficulty of fabricating such heterostructures and their relatively low superconducting transition temperatures (typically below 4 K) limit further studies and possible applications. To achieve topological superconductivity, one can also consider introducing extra carries into a topological insulator, as e.g., in Cu intercalated Bi2Se3 Hor et al. (2010); Sasaki et al. (2011). Again, doping-induced inhomogeneities and disorder effects hinder further investigations of these doped topological insulators.
A more attractive route to attain topological superconductivity is by combining SC with a nontrivial electronic band structure into the same compound. Clearly, it is of fundamental interest to be able to identify such new superconductors with nontrivial band topology, yet with a simple composition and high transition temperatures. For example, topologically protected surface states have been found in superconducting -PdBi2 and PbTaSe2 Guan et al. (2016); Sakano et al. (2015), both representing good platforms for studying topological SC. Unfortunately, their transition temperatures are still relatively low ( K).
In this study, we found that both NaC and TaC could be potentially interesting materials, where a nontrivial topological band structure coexists with superconductivity. By using both macroscopic and microscopic techniques, we found that the rock-salt-type NbC and TaC exhibit relatively high superconducting transitions (at = 11.5 and 10.3 K). The low-temperature superfluid density and electronic specific-heat both suggest a fully-gapped superconducting state in NbC and TaC. The numerical band-structure calculations indicate that without considering the SOC effect, the first Brillouin zone contains three closed node lines in the bulk band structure, protected by time-reversal and space-inversion symmetry, which is consistent with the ZF-SR results (see Fig. III.3). When considering SOC, this picture might change. However, since SOC effects in the NbC case are rather weak, it is highly probable that the node lines are still preserved. Should this be confirmed by future investigations, considering also its relatively high , NbC would be a very interesting topological superconductor.
| Property | Unit | NbC | TaC |
|---|---|---|---|
| K | 11.5 | 10.3 | |
| K | 10.6 | 10.2 | |
| mT | 10.3(3) | 29.3(3) | |
| χ,C | T | 1.93(1) | 0.65(1) |
| μSR111Derived from a fit to Eq. (1) at 1.5 K. | T | 1.81(2) | 0.43(3) |
| nm | 13.1(1) | 22.5(1) | |
| mJ/mol-K2 | 3.0(4) | 3.1(8) | |
| K | 790(20) | 590(20) | |
| — | 0.60(1) | 0.65(3) | |
| states/eV-f.u. | 1.3(2) | 1.3(3) | |
| states/eV-f.u. | 0.8(1) | 0.8(1) | |
| states/eV-f.u. | 0.74 | 0.64 | |
| meV | 130 | 400 | |
| μSR | meV | 1.90(2) | 1.45(1) |
| meV | 1.73(2) | 1.54(2) | |
| 111Derived from a fit to Eq. (1) at 1.5 K. | nm | 134(2) | 67(1) |
| nm | 141(2) | 77(1) |
V Conclusion
To summarize, we studied the superconducting properties of the NbC and TaC superconductors by means of bulk- (magnetization and heat capacity) and local-probe (SR) techniques, as well as via numerical band-structure calculations. The superconducting state of NbC and TaC is characterized by = 11.5 K and 10.3 K, and upper critical fields = 1.93 T and 0.65 T, respectively. The temperature dependence of the superfluid density and the zero-field electronic specific heat reveal a nodeless superconducting state, which is well described by an isotropic -wave model. The lack of spontaneous magnetic fields below indicates that time-reversal symmetry is preserved in the superconducting state of NbC and TaC. Electronic band-structure calculations suggest that the density of states at the Fermi level stems primarily from the Nb (or Ta) -electrons and the C -electrons. The strong hybridization between the C -orbitals and Nb (or Ta) orbitals produces large cylinder-like Fermi surfaces, resembling those of high- iron-based superconductors. Three closed node lines are found in the first Brillouin zone, which are protected by time-reversal and inversion symmetry in the band structure of the bulk. In particular, we show that NbC is a potential candidate for future studies of topological superconductivity.
Acknowledgements.
This work was supported by the Schweizerische Nationalfonds zur Förderung der Wissenschaftlichen Forschung, SNF (Grants no. 200021-169455 and 206021-139082). The SR experiments were performed at the M3 beamline of the Paul Scherrer Institute. We thank the scientists of the GPS SR spectrometer for their support.References
- Cheng and Luo (2017) J. Cheng and J. Luo, J. Phys. Condens. Matter 29, 383003 (2017).
- Wu et al. (2014) W. Wu, J. Cheng, K. Matsubayashi, P. Kong, F. Lin, C. Jin, N. Wang, Y. Uwatoko, and J. Luo, Nat. Commun. 5, 5508 (2014).
- Kotegawa et al. (2015) H. Kotegawa, S. Nakahara, R. Akamatsu, H. Tou, H. Sugawara, and H. Harima, Phys. Rev. Lett. 114, 117002 (2015).
- Cheng et al. (2015) J.-G. Cheng, K. Matsubayashi, W. Wu, J. P. Sun, F. K. Lin, J. L. Luo, and Y. Uwatoko, Phys. Rev. Lett. 114, 117001 (2015).
- Park et al. (2019) S. Park, S. Shin, S.-I. Kim, S. Kim, C.-K. Park, J. D. Thompson, and T. Park, npj Quant. Mater. 4, 1 (2019).
- Weyl (1929) H. Weyl, Z. Phys. 56, 330 (1929).
- Xu et al. (2015a) S.-Y. Xu, I. Belopolski, N. Alidoust, M. Neupane, G. Bian, C. Zhang, R. Sankar, G. Chang, Z. Yuan, C.-C. Lee, S.-M. Huang, H. Zheng, J. Ma, D. S. Sanchez, B. Wang, A. Bansil, F. Chou, P. P. Shibayev, H. Lin, S. Jia, and M. Z. Hasan, Science 349, 613 (2015a).
- Xu et al. (2015b) S.-Y. Xu, N. Alidoust, I. Belopolski, Z. Yuan, G. Bian, T.-R. Chang, H. Zheng, V. N. Strocov, D. S. Sanchez, G. Chang, et al., Nat. Phys. 11, 748 (2015b).
- Lv et al. (2015) B. Q. Lv, H. M. Weng, B. B. Fu, X. P. Wang, H. Miao, J. Ma, P. Richard, X. C. Huang, L. X. Zhao, G. F. Chen, Z. Fang, X. Dai, T. Qian, and H. Ding, Phys. Rev. X 5, 031013 (2015).
- Xu et al. (2016) N. Xu, H. M. Weng, B. Q. Lv, C. E. Matt, J. Park, F. Bisti, V. N. Strocov, D. Gawryluk, E. Pomjakushina, K. Conder, N. C. Plumb, M. Radovic, G. Autés, O. V. Yazyev, Z. Fang, X. Dai, T. Qian, J. Mesot, H. Ding, and M. Shi, Nat. Commun. 7, 11006 (2016).
- Souma et al. (2016) S. Souma, Z. Wang, H. Kotaka, T. Sato, K. Nakayama, Y. Tanaka, H. Kimizuka, T. Takahashi, K. Yamauchi, T. Oguchi, K. Segawa, and Y. Ando, Phys. Rev. B 93, 161112(R) (2016).
- Lv et al. (2017) B. Q. Lv, Z.-L. Feng, Q.-N. Xu, X. Gao, J.-Z. Ma, L.-Y. Kong, P. Richard, Y.-B. Huang, V. N. Strocov, C. Fang, H.-M. Weng, Y.-G. Shi, T. Qian, and H. Ding, Nature 546, 627 (2017).
- Ma et al. (2018) J.-Z. Ma, J.-B. He, Y.-F. Xu, B. Q. Lv, D. Chen, W.-L. Zhu, S. Zhang, L.-Y. Kong, X. Gao, L.-Y. Rong, Y.-B. Huang, P. Richard, C.-Y. Xi, E. S. Choi, Y. Shao, Y.-L. Wang, H.-J. Gao, X. Dai, C. Fang, H.-M. Weng, G.-F. Chen, T. Qian, and H. Ding, Nat. Phys. 14, 349 (2018).
- Qi and Zhang (2011a) X.-L. Qi and S.-C. Zhang, Rev. Mod. Phys. 83, 1057 (2011a).
- Kitaev (2001) A. Y. Kitaev, Phys. Usp. 44, 131 (2001).
- Chi et al. (2018) Z. Chi, X. Chen, C. An, L. Yang, J. Zhao, Z. Feng, Y. Zhou, Y. Zhou, C. Gu, B. Zhang, Y. Yuan, C. Kenney-Benson, W. Yang, G. Wu, X. Wan, Y. Shi, X. Yang, and Z. Yang, npj Quant. Mater. 3, 28 (2018).
- Liu et al. (2019) Z. Liu, W. Wu, Z. Zhao, H. Zhao, J. Cui, P. Shan, J. Zhang, C. Yang, P. Sun, Y. Wei, S. Li, J. Zhao, Y. Sui, J. Cheng, L. Lu, J. Luo, and G. Liu, Phys. Rev. B 99, 184509 (2019).
- Willens et al. (1967) R. H. Willens, E. Buehler, and B. T. Matthias, Phys. Rev. 159, 327 (1967).
- Yamaura et al. (2006) K. Yamaura, Q. Huang, M. Akaishi, and E. Takayama-Muromachi, Phys. Rev. B 74, 184510 (2006).
- Sathish et al. (2012) C. I. Sathish, Y. Guo, X. Wang, Y. Tsujimoto, J. Li, S. Zhang, Y. Matsushita, Y. Shi, H. Tian, H. Yang, J. Li, and K. Yamaura, J. Solid State Chem. 196, 579 (2012).
- Sathish et al. (2014) C. I. Sathish, Y. Shirako, Y. Tsujimoto, H. L. Feng, Y. Sun, M. Akaogi, and K. Yamaura, Solid State Commun. 177, 33 (2014).
- Huang et al. (2018) A. Huang, A. D. Smith, M. Schwinn, Q. Lu, T.-R. Chang, W. Xie, H.-T. Jeng, and G. Bian, Phys. Rev. Mater. 2, 054205 (2018).
- Zhan and Luo (2019) R. Zhan and X. Luo, J. Appl. Phys. 125, 053903 (2019).
- Isaev et al. (2007) E. I. Isaev, S. I. Simak, I. A. Abrikosov, R. Ahuja, Y. K. Vekilov, M. I. Katsnelson, A. I. Lichtenstein, and B. Johansson, J. Appl. Phys. 101, 123519 (2007).
- Tütüncü et al. (2012) H. M. Tütüncü, S. Baǧcı, G. P. Srivastava, and A. Akbulut, J. Phys. Condens. Matter 24, 455704 (2012).
- Kavitha et al. (2016) K. Kavitha, G. Sudha Priyanga, R. Rajeswarapalanichamy, and K. Iyakutti, Mater. Chem. Phys. 169, 71 (2016).
- Szymanski et al. (2019) N. J. Szymanski, I. Khatri, J. G. Amar, D. Gall, and S. V. Khare, J. Mater. Chem. C 7, 12619 (2019).
- Ziegler and Young (1953) W. T. Ziegler and R. A. Young, Phys. Rev. 90, 115 (1953).
- Kazumasa and Masatomo (2008) N. Kazumasa and Y. Masatomo, Mater. Sci. Eng. B 148, 69 (2008).
- Williams (1971) W. S. Williams, Prog. Solid State Chem. 6, 57 (1971), and reference therein.
- Toth (1971) L. E. Toth, Transition metal carbides and nitrides (Academic Press, New York, 1971).
- Amato et al. (2017) A. Amato, H. Luetkens, K. Sedlak, A. Stoykov, R. Scheuermann, M. Elender, A. Raselli, and D. Graf, Rev. Sci. Instrum. 88, 093301 (2017).
- Suter and Wojek (2012) A. A. Suter and B. M. Wojek, Phys. Procedia 30, 69 (2012).
- Perdew et al. (1996) J. P. Perdew, K. Burke, and M. Ernzerhof, Phys. Rev. Lett. 77, 3865 (1996).
- Kresse and Furthmüller (1996) G. Kresse and J. Furthmüller, Phys. Rev. B 54, 11169 (1996).
- Kresse and Furthmüller (1996) G. Kresse and J. Furthmüller, Comput. Mater. Sci. 6, 15 (1996).
- Kresse and Joubert (1999) G. Kresse and D. Joubert, Phys. Rev. B 59, 1758 (1999).
- Blöchl (1994) P. E. Blöchl, Phys. Rev. B 50, 17953 (1994).
- Rodríguez-Carvajal (1993) J. Rodríguez-Carvajal, Physica B: Condens. Matter 192, 55 (1993).
- Werthamer et al. (1966) N. R. Werthamer, E. Helfand, and P. C. Hohenberg, Phys. Rev. 147, 295 (1966).
- Zhu et al. (2008) X. Zhu, H. Yang, L. Fang, G. Mu, and H.-H. Wen, Supercond. Sci. Technol. 21, 105001 (2008).
- Tinkham (1996) M. Tinkham, Introduction to Superconductivity, 2nd ed. (Dover Publications, Mineola, NY, 1996).
- Kubo and Toyabe (1967) R. Kubo and T. Toyabe, in Magnetic Resonance and Relaxation, edited by R. Blinc (North-Holland, Amsterdam, 1967) pp. 810–823.
- Yaouanc and de Réotier (2011) A. Yaouanc and P. D. de Réotier, Muon Spin Rotation, Relaxation, and Resonance: Applications to Condensed Matter (Oxford University Press, Oxford, 2011).
- Grassellino et al. (2013) A. Grassellino, C. Beard, P. Kolb, R. Laxdal, N. S. Lockyer, D. Longuevergne, and J. E. Sonier, Phys. Rev. ST Accel. Beams 16, 062002 (2013).
- Barford and Gunn (1988) W. Barford and J. M. F. Gunn, Physica C 156, 515 (1988).
- Brandt (2003) E. H. Brandt, Phys. Rev. B 68, 054506 (2003).
- Maisuradze et al. (2009) A. Maisuradze, R. Khasanov, A. Shengelaya, and H. Keller, J. Phys.: Condens. Matter 21, 075701 (2009), and references therein.
- Carrington and Manzano (2003) A. Carrington and F. Manzano, Physica C 385, 205 (2003).
- Kittel (2005) C. Kittel, Introduction to Solid State Physics, 8th ed. (John Wiley & Sons, Hoboken, NJ, 2005).
- McMillan (1968) W. L. McMillan, Phys. Rev. 167, 331 (1968).
- Mazin et al. (2008) I. I. Mazin, D. J. Singh, M. D. Johannes, and M. H. Du, Phys. Rev. Lett. 101, 057003 (2008).
- Kuroki et al. (2009) K. Kuroki, H. Usui, S. Onari, R. Arita, and H. Aoki, Phys. Rev. B 79, 224511 (2009).
- Mazin et al. (2019) I. I. Mazin, M. Shimizu, N. Takemori, and H. O. Jeschke, Phys. Rev. Lett. 123, 267001 (2019).
- Zeng et al. (2015) M. Zeng, C. Fang, G. Chang, Y.-A. Chen, T. Hsieh, A. Bansil, H. Lin, and L. Fu, e-print (2015), arXiv:1504.03492 [cond-mat.mes-hall] .
- Zhao et al. (2016) J. Zhao, R. Yu, H. Weng, and Z. Fang, Phys. Rev. B 94, 195104 (2016).
- Qi and Zhang (2011b) X.-L. Qi and S.-C. Zhang, Rev. Mod. Phys. 83, 1057 (2011b).
- Fu and Kane (2008) L. Fu and C. L. Kane, Phys. Rev. Lett. 100, 096407 (2008).
- Xu et al. (2014a) S.-Y. Xu, N. Alidoust, I. Belopolski, A. Richardella, C. Liu, M. Neupane, G. Bian, S.-H. Huang, R. Sankar, C. Fang, B. Dellabetta, W. Dai, Q. Li, M. J. Gilbert, F. Chou, N. Samarth, and M. Z. Hasan, Nat. Phys. 10, 943 (2014a).
- Xu et al. (2014b) J.-P. Xu, C. Liu, M.-X. Wang, J. Ge, Z.-L. Liu, X. Yang, Y. Chen, Y. Liu, Z.-A. Xu, C.-L. Gao, D. Qian, F.-C. Zhang, and J.-F. Jia, Phys. Rev. Lett. 112, 217001 (2014b).
- Hor et al. (2010) Y. S. Hor, A. J. Williams, J. G. Checkelsky, P. Roushan, J. Seo, Q. Xu, H. W. Zandbergen, A. Yazdani, N. P. Ong, and R. J. Cava, Phys. Rev. Lett. 104, 057001 (2010).
- Sasaki et al. (2011) S. Sasaki, M. Kriener, K. Segawa, K. Yada, Y. Tanaka, M. Sato, and Y. Ando, Phys. Rev. Lett. 107, 217001 (2011).
- Guan et al. (2016) S.-Y. Guan, P.-J. Chen, M.-W. Chu, R. Sankar, F. Chou, H.-T. Jeng, C.-S. Chang, and T.-M. Chuang, Sci. Adv. 2, e1600894 (2016).
- Sakano et al. (2015) M. Sakano, K. Okawa, M. Kanou, H. Sanjo, T. Okuda, T. Sasagawa, and K. Ishizaka, Nat. Commun. 6, 8595 (2015).