Measurements of and production in proton-proton interactions at = 17.3 GeV
in the \NASixtyOneexperiment
\PreprintIdNumberCERN-EP-2020-102
\ShineJournalEPJ C
\ShineAbstract The production of and hyperons in inelastic p+p interactions is studied in a fixed target experiment at a beam momentum of 158 . Double differential distributions in rapidity and transverse momentum are obtained from a sample of 33M inelastic events. They allow to extrapolate the spectra to full phase space and to determine the mean multiplicity of both and .
The rapidity and transverse momentum spectra are compared to transport model predictions. The
mean multiplicity in inelastic p+p interactions at 158 is used to quantify the strangeness enhancement in A+A collisions at the same centre-of-mass energy per nucleon pair.
1 Introduction
Hyperons are made up of one or more strange valence quarks. In p+p interactions the initial state has no constituent strange quarks. Thus, hyperons are excellent probes of the dynamics of p+p interactions. As a result hyperon production has been studied in a long series of experiments on elementary p+p interactions as well as proton-nucleus and nucleus-nucleus collisions. Nevertheless, the experimental data on hyperon production in p+p interactions are incomplete, and their interpretation is all but conclusive. At the same time rather impressive efforts have been invested into studies of hyperon production in nucleus-nucleus interactions, because strangeness carrying particles are expected to have different characteristics when produced in hadron-hadron and nucleus-nucleus collisions. These differences increase with the strangeness content of the particle. Thus hyperons containing two or three strange quarks are especially important. This subject has been first brought up in connection with the search for the Quark Gluon Plasma, a ”deconfined” state of matter in high energy nucleus-nucleus interactions [1]. The authors predict an enhanced production of strange particles, especially of doubly strange hyperons. In this context "enhanced" means that the multiplicity normalized to the number of nucleons participating in the collision is significantly greater in central A+A than in inelastic p+p collision at the same centre-of-mass energy per nucleon pair ().
In the absence of reliable results on multi-strange hyperon production in inelastic p+p interactions in the SPS energy range, however, such claims are often based on assumptions as e.g. the validity of an elementary reference extracted from hadron-nucleus data. A number of complex nuclear effects enter here which are difficult to control quantitatively. This is why \NASixtyOnehas embarked upon a systematic study of hyperon production in an experimental programme which covers hadron-proton, hadron-nucleus, and nucleus-nucleus collisions [2, 3, 4, 5]. These fixed target measurements employ the same detector and beam momenta from 13 to 158 per nucleon.
This publication presents measurements of and hyperon production in inelastic p+p interactions at 158 corresponding to =17.3 GeV. A total of 53 million minimum bias events were recorded.
2 The \NASixtyOnedetector
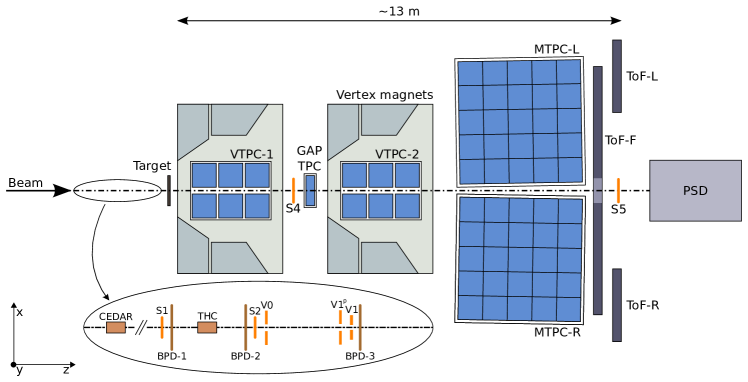
is a fixed target experiment employing a large acceptance hadron spectrometer situated in the North Area H2 beam-line of the CERN SPS [6]. A schematic layout is shown in Fig. 1. The main components of the detection system are four large volume Time Projection Chambers (TPC). Two of them, called Vertex TPCs (VTPC-1, VTPC-2), are located downstream of the target inside superconducting magnets with combined maximum bending power of 9 Tm. The MTPCs and two walls of pixel Time-of-Flight (ToF-L/R) detectors are placed symmetrically to the beamline downstream of the magnets. A GAP TPC between VTPC-1 and VTPC-2 improves the acceptance for high-momentum forward-going tracks.
A secondary beam of positively charged hadrons at a momentum of 158 was used to collect the data for the analysis presented in this paper. This beam was produced by 400 protons on a Be-target. The primary protons were extracted from the SPS in a slow extraction mode with a flat-top of 10 seconds. Protons produced together with other particles in the Be-target constitute the secondary hadron beam. The former are identified by two Cherenkov counters, a CEDAR [7] (either CEDAR-W or CEDAR-N) and a threshold counter (THC). A selection based on signals from the Cherenkov counters allowed to identify the protons in the beam with a purity of about 99% [8]. The beam momentum and intensity was adjusted by proper settings of the H2 beamline magnets and collimators. The current settings in the bending magnets have a precision of approximately 0.5%. Individual beam particles are detected by a set of scintillation counters. Their trajectories are precisely measured by three beam position detectors (BPD-1, BPD-2, BPD-3) [6].
A cylindrical target vessel of 20.29 cm length and 3 cm diameter was situated upstream of the entrance window of VTPC-1 (centre of the target z=-580 cm in the NA61/SHINE coordinate system, where =0 is at the centre of the magnet around VTPC-2). The vessel was filled with liquid hydrogen corresponding to an interaction length of 2.8%. The ensemble of vessel and liquid hydrogen constitute the "Liquid Hydrogen Target" (LHT). Data were taken with full and empty LHT.
Interactions in the target are selected with the trigger system by requiring an incoming beam proton and no signal from S4, a small 2 cm diameter scintillation counter placed on the beam trajectory between the two vertex magnets (see Fig. 1). This minimum bias trigger fires, if no charged particle is detected on the beam trajectory downstream of the target.
3 Event selection
Inelastic p+p events were selected using the following criteria:
-
(i)
no off-time beam particle detected within a time window of 2s around the time of the trigger particle,
-
(ii)
beam particle trajectory measured in at least three planes out of four of BPD-1 and BPD-2 and in both planes of BPD-3,
-
(iii)
the primary interaction vertex fit converged,
-
(iv)
position of the interaction vertex (fitted using the beam trajectory and TPC tracks) not farther away than 20 cm from the center of the LHT,
-
(v)
events with a single, positively charged track with laboratory momentum close to the beam momentum (see Ref. [8]) are rejected, which eliminates most of the elastic scattering reactions.
The data sample used in this paper was registered in 2009, 2010 and 2011. After the above selection of inelastic events it is reduced to 33 millions.
4 reconstruction method
Particle trajectories (tracks) were reconstructed using an appropriate selection of TPC-clusters. The corresponding momenta were calculated on the basis of the trajectories and the magnetic field values along the trajectory. Fits provided the momentum vectors at the main interaction vertex and at the first measured point. The (here and in the following the line of arguments holds also for the anti-particles) candidates are found by pairing tracks with appropriate mass and charge assignments. The corresponding particles are tracked backwards through the \NASixtyOnemagnetic field from the first track point, which is required to lie in one of the VTPCs. This backtracking is performed in 2 cm steps in the (beam) direction. At each step the separation in the transverse coordinates and is evaluated and the minimum is searched for. A pair is considered a candidate if the distances in the and directions at the minimum are both below 1 cm. Using the distances at the two neighbouring space points around the found minimum the point of closest approach is found by interpolation. This point is the first approximation of the decay point. Its position together with the momenta of the particles at this point are used as input for a 9 parameter fit using the Levenberg-Marquardt procedure [9]. It provides the momentum vectors of both decay particles and the final coordinates of the decay point.
To find the candidates, all candidates are combined with charged pion tracks of appropriate charge sign. A candidate fitting procedure with 13 parameters [9] is applied, using as parameters the decay position of the candidate, the momentum vectors of both decay particles, the momentum vectors of the daughter particles, and finally the position of the decay point. The and coordinates of the decay position are not subject of the minimization, as they are calculated using the fit results and momentum conservation. This procedure yields the decay position and the momentum vector of the candidate.
5 Selection of candidates
Several cuts are applied to track parameters and decay topologies in order to minimize the combinatorial background and to maximize the signal to background ratio. They represent a compromise between the size of the hyperon signal and the signal to background ratios in the various invariant mass distributions (see Section 6).
To ensure good track quality and well defined momenta tracks are accepted only if they have at least 10 clusters in either VTPC-1 or VTPC-2. The identification of charged pions and protons is based on the specific energy loss () recorded in the TPCs for the corresponding tracks. The appropriate mass is assigned, if the energy loss is within a window around the expectation value given by a Bethe–Bloch parametrization adjusted to the measurements.
A rapidity dependent cut is applied on the distance between the primary and the secondary vertex. Its values are shown in Table 1. Rapidity values in the paper are given in the centre-of-mass frame. Additionally, the decay vertex of the is requested to be located downstream in from the decay vertex. Also a mass window of around the nominal PDG value [10] is applied in the invariant mass distribution of the candidates to improve the selection of the candidates. The combinatorial background under the signal in the invariant mass distribution (see Section 6), formed by tracks originating from the main vertex is reduced by applying a cut on the distance of closest approach (DCA) of the trajectory at the position of the main vertex. Since the DCA resolution is approximately twice better in than in directions, the cut is implemented as: 1.0 cm. About half of the background is removed by this cut with the signal essentially unchanged. The charged pion daughter of the originates from a displaced vertex. Thus the background is further reduced by requiring that the DCA of the extrapolated daughter track at the position of the main vertex is 0.5 cm. This reduces the background by about 10%, while only approximately 2% of the signal is removed.
| rapidity | ||||
|---|---|---|---|---|
| minimum decay length | 0 cm | 5 cm | 12 cm | 20 cm |
6 Signal extraction
For each candidate the invariant mass was calculated assuming the and pion masses for the reconstructed candidate daughter particles in suitably selected (-) bins. A careful evaluation of the combinatorial background allows to determine the number of and in each bin. The corresponding procedure consists of a fit of a signal and background function to the experimental distribution using minimization. The signal is described by the Lorentzian function:
| (1) |
where is the center of the distribution and is a parameter specifying the width. The background is parametrized by a 2nd order polynomial (3th and 4th order polynomial for the estimation of the systematic uncertainty - see Section 8). The fit is performed over the mass range from 1.29 to 1.38 GeV. It is important to note that the extracted yield varies smoothly, when extending the mass range, and stabilizes beyond the above mentioned mass interval. The parameters describing the background were fixed using this interval. The signal is then determined by subtracting the background function from the experimental invariant mass spectrum. In order to limit the propagation of statistical background fluctuations into the signal, the mass range for this extraction is restricted to the base width of the hyperon mass distribution as given by the Lorentzian function with an additional extension of . Figure 2 shows the invariant mass distribution of and candidates for the central rapidity bin and transverse momenta around 0.5 . The black, blue, and magenta lines show the combined, background and signal fit functions, respectively.
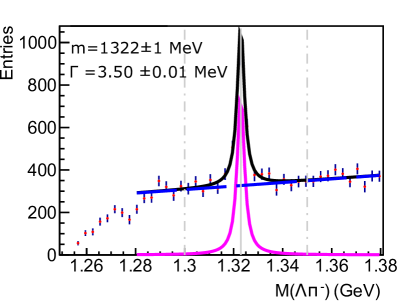
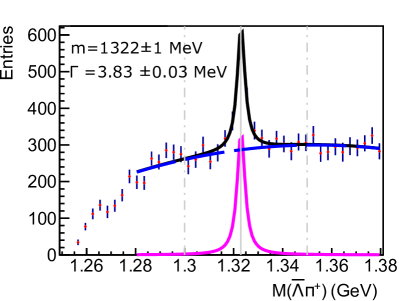
The extracted mass ( MeV) of the measured hyperons match the PDG value ( MeV) [10]. The fitted widths are close to expectations as given by the analysis of inelastic p+p interactions generated by Epos 1.99 with full detector simulation and standard track and reconstruction procedures.
7 Corrections factors for yield determination
In order to determine the true numbers of charged hyperons produced in inelastic p+p interactions a set of corrections was applied to the extracted raw results.
The triggered and accepted events comprise interactions with the target vessel and other material in the vicinity of the target. To estimate the fraction of those events about 10% of the data were collected without the liquid hydrogen in the target vessel. The signal extraction procedure described in Section 6 was applied to these events (1.3 millions events was selected), and the resulting suitably normalized yields were subtracted from the results of the analysis of the data sample with full target vessel. This correction was applied for each (, ) bin. The normalization of the empty target data was based on the fitted vertex distribution. The ratio of the numbers of events with the fitted vertex outside of the target (in the range from -400 cm to -200 cm) was calculated for full and empty target data and used subsequently as the normalization factor [11, 8].
A detailed Monte-Carlo simulation is performed to quantify the losses due to acceptance limitations, detector inefficiencies, reconstruction shortcomings, analysis cuts, and re-interactions in the target. This simulation used complete events produced by the Epos 1.99 [12] event generator hitting a hydrogen target of appropriate length. The generated particles in each Monte-Carlo event are tracked through the detector using a GEANT3 [13] simulation of the \NASixtyOneapparatus. They are then reconstructed with the same software as used for real events. Numerous variables are confirmed to be similar to data, such as residual distributions, widths of mass peaks, track multiplicities and their differential distributions, number of events with no tracks in the detector, as well the cut variables and others. The reconstructed Monte-Carlo events are then analyzed in the same way as the experimental data.
A correction factor is computed for each (, ) bin:
| (2) |
where is the number of reconstructed, selected and identified s normalized to the number of analyzed events, and is the number of s generated by Epos 1.99 normalized to the number of generated inelastic interactions. The raw multiplicity of extracted particles is multiplied by this correction in order to determine the true and yields. These correction factors also include the branching fraction of the decay into the non–measured in \NASixtyOnechannels (99.887% of the hyperons decay into registered channels).
The contribution of decays to the yield in the final state is neglected. Typically the multiplicity of s is approximately a factor of 10 lower than the multiplicity (at pp 7 TeV collisions [14]). The small branching fraction of decays into charged s and the small production probability imply that its contribution is significantly below 1%.
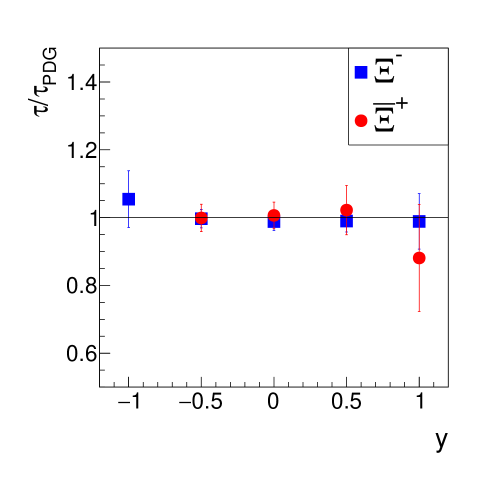
Additionally, analysis in rapidity and lifetime bins was performed. Obtained and lifetimes are consistent with the PDG ones: s and s for and , respectively. The resulting ratio as a function of center of mass rapidity is shown in Fig. 3.
8 Systematic uncertainties
Possible systematic biases of final results (spectra and mean multiplicities) are due to imperfectness of the Monte Carlo procedure - physics models and detector response simulation - used to calculate the correction factors.
To determine the magnitude of the different sources of possible biases several tests were done:
-
(i)
Methods of event selection.
Not all events which have tracks stemming from interactions of off-time beam particles are removed. A possible bias due to this effect was estimated by changing by the width of the time window in which no second beam particle is allowed with respect to the nominal value of 2s. The maximum difference of the results was taken as the bias due to the selection. It was estimated to be 2-4%.
Another source of a possible bias are losses of inelastic events due to the interaction trigger. The S4 detector trigger condition selects mainly inelastic interactions and vetoes elastic scattering events. However, it will miss some of the inelastic events. To estimate the possible loss of s, simulations were done with and without the S4 trigger condition. The difference between these two results was taken as another contribution to the systematic uncertainty. The bias due to the interaction trigger was calculated as the difference between these two results and it is 3-6
-
(ii)
Methods of and candidates selection.
To estimate the bias related to the and candidate selection the following cut parameters were varied independently: the distance cut between primary and secondary vertex was changed by 1 and 2 cm yielding a possible bias of 2-5%, the extrapolated impact parameter of s in the and direction at the main vertex position was changed from 1.0 cm to 0.5 and 2 cm yielding a possible bias of up to 10%, the DCA of the pion () daughter track to the main vertex was changed from 0.5 cm to 0.2 and 1 cm yielding a possible bias of up to 8%.
-
(iii)
Signal extraction.
The bias due to the signal extraction method were estimated by changing the order of the polynomials used to describe the background from second to third and fourth order yielding an uncertainty of up to 4%. Varying the invariant mass range used to determine the yields by a change of 12 MeV with respect to the nominal integration range yielded a possible bias of 2-7%.
The systematic uncertainty was calculated as the square root of the sum of squares of the described possible biases assuming that they are uncorrelated. The uncertainties are estimated for each (-) bin separately.
9 Experimental results
This section presents results on inclusive and hyperons spectra in inelastic p+p interactions at beam momentum 158 . The spectra refer to hyperons produced by strong interaction processes.
9.1 Spectra and mean multiplicities
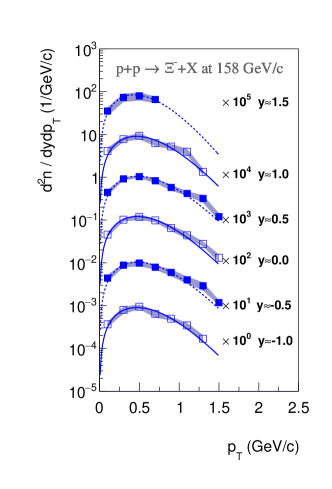
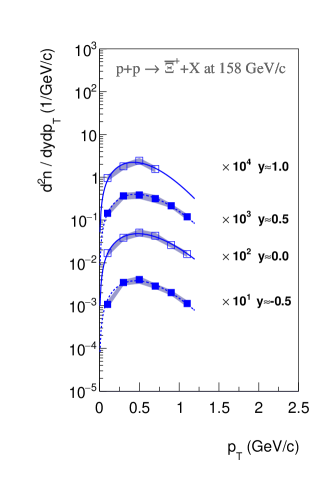
Double differential hyperon yields constitute the basic result of this paper. The () yields are determined in 6 (4) rapidity and between 4 (4) and 8 (7) transverse momentum bins. The former are 0.5 units and the latter 0.2 wide. The resulting (, ) yields are presented in Fig. 4 as function of . The transverse momentum spectra can be described by the exponential function [15, 16]:
| (3) |
where is the mass. The yields and the inverse slope parameters are determined by fitting the function to the data points in each rapidity bin. The resulting inverse slope parameters are listed in Table 4. The spectra from successive rapidity intervals are scaled by appropriate factors for better visibility. Statistical uncertainties are smaller than the symbol size, shaded bands correspond to systematic uncertainties. Tables 2 and 3 list the numerical values of the results shown in Fig. 4.
| : (1/) | |||
| () | =-1.0 | =-0.5 | =0.0 |
| 0.1 | 3.670.350.53 | 4.400.230.82 | 4.590.180.54 |
| 0.3 | 7.940.491.51 | 8.820310.94 | 10.200.310.87 |
| 0.5 | 9.410.551.13 | 9.900.361.60 | 11.80.351.77 |
| 0.7 | 6.430.411.19 | 7.900.360.95 | 9.80.380.93 |
| 0.9 | 4.960.350.48 | 5.940.361.08 | 6.520.300.97 |
| 1.1 | 3.450.380.49 | 4.000.290.75 | 4.390.330.74 |
| 1.3 | 1.680.280.35 | 2.890.660.62 | 2.770.540.36 |
| 1.5 | - | 1.170.140.16 | 1.310.220.26 |
| () | =0.5 | =1.0 | =1.5 |
| 0.1 | 4.430.240.66 | 4.120.340.79 | 3.520.600.79 |
| 0.3 | 9.180.310.69 | 7.750.421.00 | 7.350.821.60 |
| 0.5 | 10.30.330.82 | 9.270.481.58 | 7.950.991.72 |
| 0.7 | 8.30.300.94 | 6.310.350.93 | 6.550.941.14 |
| 0.9 | 5.760.290.87 | 5.200.410.75 | - |
| 1.1 | 4.170.260.51 | 3.960.440.66 | - |
| 1.3 | 3.180.340.63 | 1.340.250.24 | - |
| 1.5 | 1.200.170.24 | - | - |
| : (1/) | ||||
|---|---|---|---|---|
| () | =-0.5 | =0.0 | =0.5 | =1.0 |
| 0.1 | 1.070.140.21 | 1.690.140.28 | 1.440.120.24 | 0.960.150.15 |
| 0.3 | 3.490.160.52 | 3.850.160.57 | 3.670.230.66 | 1.800.190.31 |
| 0.5 | 4.070.280.81 | 5.100.230.91 | 3.850.230.71 | 2.430.210.39 |
| 0.7 | 2.860.180.39 | 4.290.240.78 | 3.170.180.65 | 1.560.160.26 |
| 0.9 | 2.010.210.28 | 2.600.200.33 | 2.160.180.25 | - |
| 1.1 | 1.120.150.20 | 1.600.180.23 | 1.190.150.19 | - |
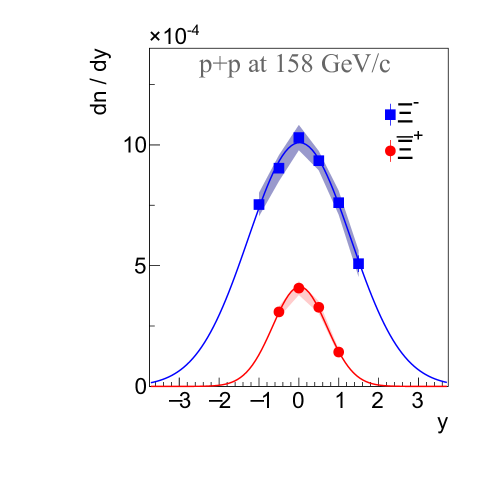
Rapidity distributions were then obtained by summing the measured transverse momentum spectra and extrapolating them into the unmeasured regions using the fitted functions given by Eq. 3. The resulting rapidity distributions are shown in Fig. 5. The statistical uncertainties are smaller than the symbol size. They were calculated as the square root of the sum of the squares of the statistical uncertainties of the contributing bins. The systematic uncertainties (shaded bands) were calculated as square root of squares of systematic uncertainty as described in Sec. 8 and half of the extrapolated yield. The numerical values of rapidity yields and their errors are listed in Table 4.
| : | : T (MeV) | : | : T (MeV) | |
|---|---|---|---|---|
| -1.0 | 7.53 0.22 0.48 | 159 6 11 | - | - |
| -0.5 | 9.19 0.21 0.53 | 168 5 10 | 3.08 0.09 0.22 | 150 7 10 |
| 0.0 | 10.3 0.20 0.52 | 162 4 6 | 4.07 0.10 0.28 | 146 4 7 |
| 0.5 | 9.34 0.16 0.40 | 169 4 8 | 3.27 0.09 0.25 | 134 4 8 |
| 1.0 | 7.60 0.21 0.49 | 154 6 11 | 1.42 0.07 0.12 | 135 15 16 |
| 1.5 | 5.08 0.34 0.55 | 136 22 15 | - | - |
Gaussian functions were fitted to the rapidity distributions and used to extrapolate into the unmeasured regions. The extrapolation factors for and are 1.24 and 1.33, respectively. Summing the data points and the extrapolated yield add up to the mean multiplicities (3.3 0.1 0.6) and (7.9 0.2 1.0). The Gaussian function used to determine the multiplicity is a rather arbitrary choice. To study the uncertainty introduced by this choice the same extrapolation factors were computed for the events generated by the two models mentioned in Sec. 10. The extrapolation factors obtained from the two models differ by only 5% and their shapes agree within uncertainties with the one of the experimental data. Thus the already assigned systematic error of 50% of the extrapolated yield is large compared to the uncertainty due to the function used for extrapolation, and no additional uncertainty was added.
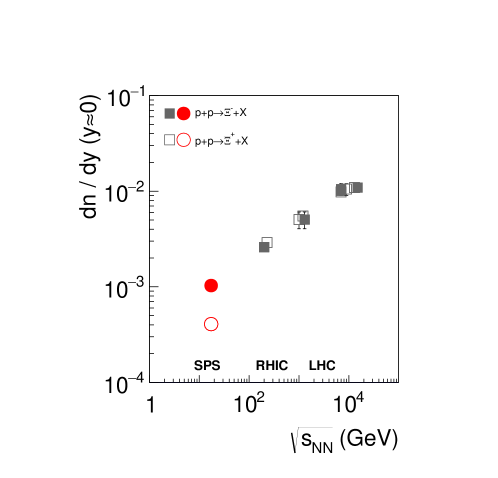
In Fig. 6 we compare the rapidity densities () at mid-rapidity of and in inelastic p+p interactions at GeV collisions with results from STAR at the BNL RHIC at = 200 GeV [17], from ALICE at CERN LHC measured at = 0.9, 7 and 13 TeV [18, 19, 20] and from CMS at the CERN LHC measured at = 0.9 and 7 TeV [21]. The yields increase with collision energy by more than an order of magnitude. At 17.3 GeV the mid-rapidity yield is almost two times smaller than yield. This difference vanishes already in the STAR data at 200 GeV and is negligible beyond.
9.2 Anti–baryon/baryon ratios
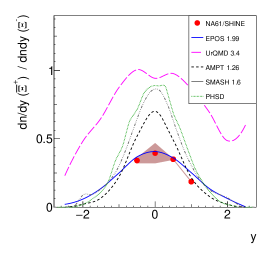
The production ratio of doubly strange anti-hyperons and hyperons is of special interest since simple string models predict values close to unity because both and stem from the pair production process. The double differential data presented in the previous subsection are therefore presented in the form of ratios (systematic errors were calculated with the procedure of Sec. 8 and not from the systematic uncertainties of the yields which may be correlated). The ratios as function of rapidity and transverse momentum are listed in Table 5. The ratio of the rapidity spectra are listed in Table 6 and drawn in Fig. 9(c). We observe little variation with a tendency for a weak maximum around 400 in and =0 in rapidity. The small value of the ratio of mean multiplicities 0.24 0.01 0.05 emphasizes the strong suppression of production.
| () | =-0.5 | =0.0 | =0.5 | =1.0 |
|---|---|---|---|---|
| 0.1 | 0.2430.0350.038 | 0.3680.0340.068 | 0.3240.0330.073 | 0.2330.0400.041 |
| 0.3 | 0.3950.0230.058 | 0.3780.0200.060 | 0.4000.0280.052 | 0.2330.0270.038 |
| 0.5 | 0.4110.0320.077 | 0.3780.0200.060 | 0.3720.0250.049 | 0.2620.0260.057 |
| 0.7 | 0.3620.0280.043 | 0.4320.0230.060 | 0.3810.0260.070 | 0.2470.0290.040 |
| 0.9 | 0.3390.0410.045 | 0.4380.0290.066 | 0.3740.0360.047 | - |
| 1.1 | 0.2800.0410.042 | 0.3640.0490.053 | 0.2850.0400.050 | - |
| -0.5 | 0.341 0.013 0.026 |
|---|---|
| 0.0 | 0.395 0.012 0.030 |
| 0.5 | 0.350 0.011 0.029 |
| 1.0 | 0.187 0.011 0.018 |
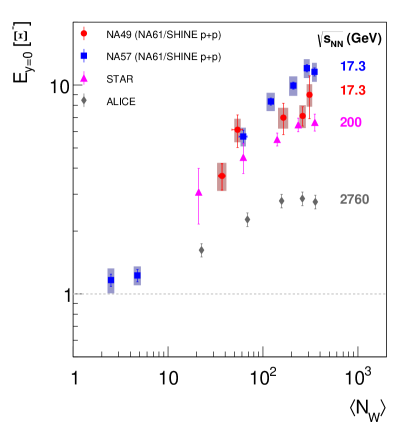
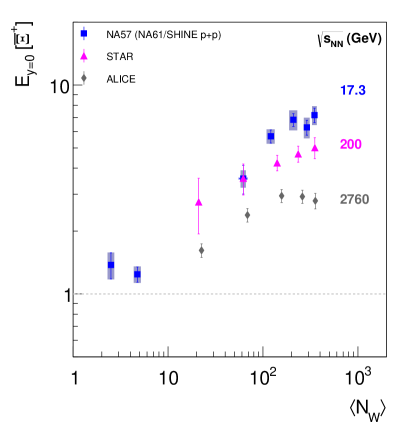
9.3 Enhancement factors
The predicted enhancement of strangeness production in nucleus-nucleus collisions (per participating nucleon) relative to proton-proton reactions was established experimentally 30 years ago [22, 23]. It was also found that this enhancement is increasing with the strangeness content of the studied particle[24, 25]. This subsection discusses the system size dependence of the strangeness enhancement in A+A collisions. The strangeness enhancement factor for a given particle species is defined as:
| (4) |
where is the number of wounded nucleons in the collision [26]. At SPS energies and above the number of wounded nucleons is close to or equal to the number of participating nucleons.
The mean multiplicities measured by \NASixtyOnein inelastic p+p interactions are used to calculate the enhancement factors of s observed in centrality selected Pb+Pb, in semi-central C+C, and in Si+Si collisions as measured by NA49 [27] at the CERN SPS. The results for mid-rapidity densities are shown in Fig. 7 (left) as a function of . The enhancement factor increases approximately linearly from 3.5 in C+C to 9 in central Pb+Pb collisions. This result is compared to data from the NA57 experiment at the SPS [25], the STAR experiment at the Relativistic Heavy Ion Collider (RHIC) [28] and the ALICE experiment at the Large Hadron Collider (LHC) [29]. The published enhancement factor reported by NA57 at the CERN SPS was computed using p+Be instead of inelastic p+p interactions. Since strangeness production is already slightly enhanced in p+A collisions [30], this is not a proper reference. With the advent of the \NASixtyOneresults on production in p+p interactions a new baseline reference becomes available and it is used here for the recalculation of the enhancement observed in the NA57 p+Be and A+A data. The STAR Collaboration published results on multi-strange hyperon production in Au+Au collisions at from 7.7 to 39 GeV [31], however the corresponding data on p+p and p+A interactions are missing. The agreement between the enhancement factors calculated using the NA49 and the NA57 A+A (p+Be) data is satisfactory. The STAR data show a slightly lower enhancement, but the enhancement observed by ALICE is significantly lower. Figure 7 (right) shows the rapidity densities of at mid-rapidity per mean number of wounded nucleons divided by the corresponding values for inelastic p+p collisions as a function of . Apart from a slightly flatter rise the overall picture remains unchanged.
Note that ALICE finds that the mid-rapidity yields of multi-strange hyperons in p+p interactions at the LHC, relative to pions, increase significantly with the charged-particle multiplicity [32]. \NASixtyOneresults on rapidity densities of charged hadrons in p+p interactions are published [11, 8] allowing to include the results from the CERN SPS in the studies of multiplicity dependence.
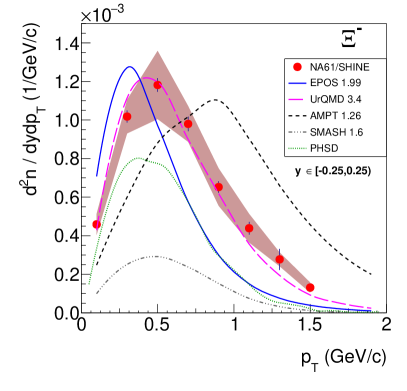
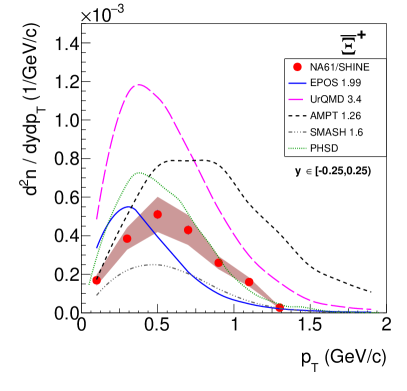
10 Comparison with models
The \NASixtyOnedata on charged production in inelastic p+p interactions are important for the understanding of multi-strange particle production in elementary hadron interactions. In particular, the new \NASixtyOneresults constitute essential input for theoretical concepts needed for the modelling of elementary hadron interactions and of more complex reactions involving nuclei like p+A and A+A collisions.
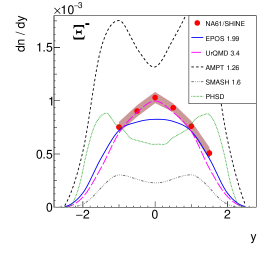
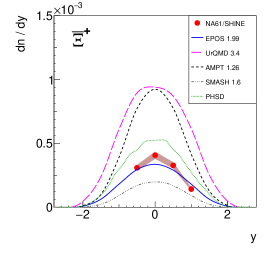
In this section the experimental results of \NASixtyOneare compared with predictions of the following microscopic models: Epos 1.99 [33], Urqmd 3.4 [34, 35], Ampt 1.26 [36, 37, 38], Smash 1.6 [39, 40, 41] and Phsd [42, 43]. In Epos the reaction proceeds from the excitation of strings according to Gribov-Regge theory to string fragmentation into hadrons. Urqmd starts with a hadron cascade on the basis of elementary cross sections for resonance production which either decay (mostly at low energies) or are converted into strings which fragment into hadrons (mostly at high energies). Ampt uses the heavy ion jet interaction generator (Hijing) for generating the initial conditions, Zhang’s parton cascade for modeling partonic scatterings, the Lund string fragmentation model or a quark coalescence model for hadronization. Smash uses the hadronic transport approach where the free parameters of the string excitation and decay are tuned to match the experimental measurements in elementary proton–proton collisions. Phsd is a microscopic off-shell transport approach that consistently describes the full evolution of a relativistic heavy-ion collision from the initial hard scatterings and string formation through the dynamical deconfinement phase transition to the quark-gluon plasma as well as hadronization and the subsequent interactions in the hadronic phase. The model predictions are compared with the \NASixtyOnedata in figs. 8 and 9. Epos 1.99 describes well the and rapidity spectra but fails on the shape of the transverse momentum distribution. The comparison of the Urqmd 3.4 calculations with the \NASixtyOnemeasurements reveals major discrepancies for the hyperons. The model output describes almost perfectly the rapidity and transverse momentum spectra of but strongly overestimates yields. Consequently also the ratio of to cannot be described by the Urqmd model, see Fig. 9(c). The Ampt, Smash and Phsd models fail in the description of both transverse momentum spectra and rapidity distributions. Ampt overestimates the and multiplicities while Smash underestimates them, both failing to describe the ratio. Phsd underestimates the yields and overestimates . Obviously Phsd also fails to describe the ratio. Epos differs from the Urqmd, Ampt, Smash and Phsd models in its treatment of Pomeron-Pomeron interactions and of the valence quark remnants at the string ends.
(a)
 (b)
(b)
 (c)
(c)
The statistical Hadron Resonance Gas Models (HGM) can be used to predict particle multiplicities in elementary and nucleus-nucleus collisions once parameters like the chemical freeze-out temperature , the baryochemical potential and strangeness saturation parameter are fixed by fits of selected mean multiplicities of hadrons. In Ref. [44] the HGM results for and multiplicities were calculated for two versions of the model fits. The first one, called fit B, allowed for strangeness deviation from the equilibrium introducing the free parameter . In the second fit, called A, the parameter was replaced by the mean number of strange quark pairs . The mean multiplicities of and hyperons were excluded from the fit B and the mean multiplicity of meson from the fit A. Table 7 shows the HGM predictions based on the fits A and B together with the experimental mean multiplicities of and produced in inelastic p+p interactions at 158 . The measurements are close to the HGM results for the fit A which excludes mean multiplicity of meson. The resulting yield of quark pairs is about two times lower than the equilibrium one.
| \NASixtyOne | 3.3 0.1 0.6 | 7.9 0.2 1.0 |
|---|---|---|
| HGM, Canonical Ensemble, fit A (no ) [44] | 2.85 | 9.18 |
| HGM, Canonical Ensemble, fit B (with ) [44] | 1.10 | 3.88 |
11 Summary
Measurements of and spectra in inelastic p+p interactions at 158 were performed by the \NASixtyOneexperiment at the CERN SPS. These measurements were compared with the results obtained at higher energies, and it was shown that the mid-rapidity / ratio in p+p at = 17.3 GeV is around 0.5, while at higher energies it becomes unity. The \NASixtyOneresults were also compared with the measurements in A+A collisions at the same energy. The ratio of rapidity densities of measured in nucleus-nucleus collisions and inelastic p+p collisions at 158, when normalised to the same averaged number of wounded nucleons , rises rapidly from p+p towards peripheral Pb+Pb collisions. This strangeness enhancement was found to decrease with increasing centre-of-mass energy. Furthermore, the \NASixtyOneresults were compared with Urqmd, Epos, Ampt, Smash and Phsd model predictions. It was concluded that the Epos string model provides the best description of the \NASixtyOnemeasurements. Finally, the mean multiplicities of and hyperons were compared with predictions of the Hadron Gas Model. It turned out that the HGM predictions are very close to the experimental results when the meson is excluded from the HGM fit.
Acknowledgments
We would like to thank the CERN EP, BE, HSE and EN Departments for the strong support of NA61/SHINE.
This work was supported by the Hungarian Scientific Research Fund (grant NKFIH 123842/123959), the Polish Ministry of Science and Higher Education (grants 667/N-CERN/2010/0, NN 202 48 4339 and NN 202 23 1837), the National Science Centre Poland (grants 2014/13/N/ST2/02565, 2014/14/E/ST2/00018, 2014/15/B/ST2/02537 and 2015/18/M/ST2/00125, 2015/19/N/ST2 /01689, 2016/23/B/ST2/00692, 2017/25/N/ST2/02575, 2018/30/A/ST2/00226, 2018/31/G/ST2/03910), the Russian Science Foundation, grant 16-12-10176 and 17-72-20045, the Russian Academy of Science and the Russian Foundation for Basic Research (grants 08-02-00018, 09-02-00664 and 12-02-91503-CERN), the Ministry of Science and Education of the Russian Federation, grant No. 3.3380.2017/4.6, the National Research Nuclear University MEPhI in the framework of the Russian Academic Excellence Project (contract No. 02.a03.21.0005, 27.08.2013), the Ministry of Education, Culture, Sports, Science and Technology, Japan, Grant-in-Aid for Scientific Research (grants 18071005, 19034011, 19740162, 20740160 and 20039012), the German Research Foundation (grant GA 1480/8-1), the Bulgarian Nuclear Regulatory Agency and the Joint Institute for Nuclear Research, Dubna (bilateral contract No. 4799-1-18/20), Bulgarian National Science Fund (grant DN08/11), Ministry of Education and Science of the Republic of Serbia (grant OI171002), Swiss Nationalfonds Foundation (grant 200020117913/1), ETH Research Grant TH-01 07-3 and the Fermi National Accelerator Laboratory (Fermilab), a U.S. Department of Energy, Office of Science, HEP User Facility managed by Fermi Research Alliance, LLC (FRA), acting under Contract No. DE-AC02-07CH11359 and the IN2P3-CNRS (France).
References
- [1] J. Rafelski and B. Muller Phys.Rev.Lett. 48 (1982) 1066. [Erratum: Phys.Rev.Lett. 56, 2334 (1986)].
- [2] A. Aduszkiewicz et al., [NA61/SHINE Collab.] Eur. Phys. J. C76 no. 4, (2016) 198, arXiv:1510.03720 [hep-ex].
- [3] N. Abgrall et al., [NA61/SHINE Collab.] Eur. Phys. J. C 76 no. 2, (2016) 84, arXiv:1510.02703 [hep-ex].
- [4] N. Abgrall et al., [NA61/SHINE Collab.] Phys.Rev. C89 no. 2, (2014) 025205, arXiv:1309.1997 [physics.acc-ph].
- [5] A. Aduszkiewicz et al., [NA61/SHINE Collab.] Phys. Rev. D 101 no. 5, (2020) 051101, arXiv:1912.12198 [hep-ex].
- [6] N. Abgrall et al., [NA61/SHINE Collab.] JINST 9 (2014) P06005, arXiv:1401.4699 [physics.ins-det].
- [7] C. Bovet, R. Maleyran, L. Piemontese, A. Placci, and M. Placidi CERN-82-13, CERN-YELLOW-82-13 (1982) .
- [8] N. Abgrall et al., [NA61/SHINE Collab.] Eur.Phys.J. C74 (2014) 2794, arXiv:1310.2417 [hep-ex].
- [9] W. Press, S. Teukolsky, W. Vetterling, and B. Flannery, Numerical Recipes in FORTRAN: The Art of Scientific Computing. Cambridge University Press, 2nd ed., 1992.
- [10] M. Tanabashi et al., [Particle Data Group Collab.] Phys. Rev. D 98 (Aug, 2018) 030001.
- [11] A. Aduszkiewicz et al., [NA61/SHINE Collab.] Eur. Phys. J. C77 no. 10, (2017) 671, arXiv:1705.02467 [nucl-ex].
- [12] T. Pierog and K. Werner Nucl.Phys.Proc.Suppl. 196 (2009) 102–105, arXiv:0905.1198 [hep-ph].
- [13] C. F. Brun R., “Geant detector description and simulation tool, cern program library long writeup w5013,” 1993. http://wwwasdoc.web.cern.ch/wwwasdoc/geant/geantall.html.
- [14] A. Abelev et al. Physics Letters B 712 no. 4, (2012) 309 – 318. http://www.sciencedirect.com/science/article/pii/S037026931200528X.
- [15] R. Hagedorn Nuovo Cim.Suppl. 6 (1968) 311–354.
- [16] W. Broniowski, W. Florkowski, and L. Y. Glozman Phys.Rev. D70 (2004) 117503, arXiv:hep-ph/0407290 [hep-ph].
- [17] B. Abelev et al., [STAR Collab.] Phys. Rev. C 75 (2007) 064901, arXiv:nucl-ex/0607033.
- [18] K. Aamodt et al., [ALICE Collab.] Eur. Phys. J. C 71 (2011) 1594, arXiv:1012.3257 [hep-ex].
- [19] B. Abelev et al., [ALICE Collab.] Phys. Lett. B 712 (2012) 309–318, arXiv:1204.0282 [nucl-ex].
- [20] S. Acharya et al., [ALICE Collab.] Eur. Phys. J. C 80 no. 2, (2020) 167, arXiv:1908.01861 [nucl-ex].
- [21] V. Khachatryan et al., [CMS Collab.] JHEP 05 (2011) 064, arXiv:1102.4282 [hep-ex].
- [22] J. Bartke et al., [NA35 Collab.] Z. Phys. C 48 (1990) 191–200.
- [23] T. Alber et al., [NA35 Collab.] Z. Phys. C 64 (1994) 195–207.
- [24] F. Antinori et al., [WA97 Collab.] Eur. Phys. J. C 11 (1999) 79–88.
- [25] F. Antinori et al., [NA57 Collab.] J. Phys. G 32 (2006) 427–442, arXiv:nucl-ex/0601021.
- [26] A. Bialas, M. Bleszynski, and W. Czyz Nucl. Phys. B111 (1976) 461.
- [27] T. Anticic et al., [NA49 Collab.] Phys. Rev. C 80 (2009) 034906, arXiv:0906.0469 [nucl-ex].
- [28] B. Abelev et al., [STAR Collab.] Phys. Rev. C 77 (2008) 044908, arXiv:0705.2511 [nucl-ex].
- [29] B. B. Abelev et al., [ALICE Collab.] Phys. Lett. B 728 (2014) 216–227, arXiv:1307.5543 [nucl-ex]. [Erratum: Phys.Lett.B 734, 409–410 (2014)].
- [30] T. Susa, [NA49 Collab.] Nucl. Phys. A 698 (2002) 491–494.
- [31] J. Adam et al., [STAR Collab.] arXiv:1906.03732 [nucl-ex].
- [32] J. Adam et al., [ALICE Collab.] Nature Phys. 13 (2017) 535–539, arXiv:1606.07424 [nucl-ex].
- [33] K. Werner Nucl. Phys. Proc. Suppl. 175-176 (2008) 81–87.
- [34] S. Bass et al. Prog.Part.Nucl.Phys. 41 (1998) 255–369, arXiv:nucl-th/9803035 [nucl-th].
- [35] M. Bleicher et al. J.Phys. G25 (1999) 1859–1896, arXiv:hep-ph/9909407 [hep-ph].
- [36] Z.-W. Lin, C. M. Ko, B.-A. Li, B. Zhang, and S. Pal Phys. Rev. C 72 (Dec, 2005) 064901.
- [37] Z.-W. Lin Phys. Rev. C 90 (Jul, 2014) 014904.
- [38] B. Zhang, C. M. Ko, B.-A. Li, and Z. Lin Phys. Rev. C 61 (May, 2000) 067901.
- [39] J. Mohs, S. Ryu, and H. Elfner J. Phys. G 47 no. 6, (2020) 065101, arXiv:1909.05586 [nucl-th].
- [40] J. Weil et al. Phys. Rev. C 94 no. 5, (2016) 054905, arXiv:1606.06642 [nucl-th].
- [41] D. Oliinychenko, V. Steinberg, J. Weil, M. Kretz, H. E. (Petersen), J. Staudenmaier, S. Ryu, A. Schäfer, J. Rothermel, J. Mohs, F. Li, L. Pang, D. Mitrovic, A. Goldschmidt, L. Geiger, L. Prinz, J.-B. Rose, and J. Hammelmann, “smash-transport/smash: Smash-1.6,” May, 2019.
- [42] W. Cassing and E. Bratkovskaya Nucl. Phys. A 831 (2009) 215–242, arXiv:0907.5331 [nucl-th].
- [43] W. Cassing and E. Bratkovskaya Phys. Rev. C 78 (2008) 034919, arXiv:0808.0022 [hep-ph].
- [44] F. Becattini, J. Manninen, and M. Gazdzicki Phys.Rev. C73 (2006) 044905, arXiv:hep-ph/0511092 [hep-ph].
The \NASixtyOneCollaboration
A. Aduszkiewicz 15, E.V. Andronov 21, T. Antićić 3, V. Babkin 19, M. Baszczyk 13, S. Bhosale 10, A. Blondel 4, M. Bogomilov 2, A. Brandin 20, A. Bravar 23, W. Bryliński 17, J. Brzychczyk 12, M. Buryakov 19, O. Busygina 18, A. Bzdak 13, H. Cherif 6, M. Ćirković 22, M. Csanad 7, J. Cybowska 17, T. Czopowicz 9,17, A. Damyanova 23, N. Davis 10, M. Deliyergiyev 9, M. Deveaux 6, A. Dmitriev 19, W. Dominik 15, P. Dorosz 13, J. Dumarchez 4, R. Engel 5, G.A. Feofilov 21, L. Fields 24, Z. Fodor 7,16, A. Garibov 1, M. Gaździcki 6,9, O. Golosov 20, V. Golovatyuk 19, M. Golubeva 18, K. Grebieszkow 17, F. Guber 18, A. Haesler 23, S.N. Igolkin 21, S. Ilieva 2, A. Ivashkin 18, S.R. Johnson 25, K. Kadija 3, N. Kargin 20, E. Kashirin 20, M. Kiełbowicz 10, V.A. Kireyeu 19, V. Klochkov 6, V.I. Kolesnikov 19, D. Kolev 2, A. Korzenev 23, V.N. Kovalenko 21, S. Kowalski 14, M. Koziel 6, A. Krasnoperov 19, W. Kucewicz 13, M. Kuich 15, A. Kurepin 18, D. Larsen 12, A. László 7, T.V. Lazareva 21, M. Lewicki 16, K. Łojek 12, V.V. Lyubushkin 19, M. Maćkowiak-Pawłowska 17, Z. Majka 12, B. Maksiak 11, A.I. Malakhov 19, A. Marcinek 10, A.D. Marino 25, K. Marton 7, H.-J. Mathes 5, T. Matulewicz 15, V. Matveev 19, G.L. Melkumov 19, A.O. Merzlaya 12, B. Messerly 26, Ł. Mik 13, S. Morozov 18,20, S. Mrówczyński 9, Y. Nagai 25, M. Naskręt 16, V. Ozvenchuk 10, V. Paolone 26, O. Petukhov 18, R. Płaneta 12, P. Podlaski 15, B.A. Popov 19,4, B. Porfy 7, M. Posiadała-Zezula 15, D.S. Prokhorova 21, D. Pszczel 11, S. Puławski 14, J. Puzović 22, M. Ravonel 23, R. Renfordt 6, D. Röhrich 8, E. Rondio 11, M. Roth 5, B.T. Rumberger 25, M. Rumyantsev 19, A. Rustamov 1,6, M. Rybczynski 9, A. Rybicki 10, A. Sadovsky 18, K. Schmidt 14, I. Selyuzhenkov 20, A.Yu. Seryakov 21, P. Seyboth 9, M. Słodkowski 17, P. Staszel 12, G. Stefanek 9, J. Stepaniak 11, M. Strikhanov 20, H. Ströbele 6, T. Šuša 3, A. Taranenko 20, A. Tefelska 17, D. Tefelski 17, V. Tereshchenko 19, A. Toia 6, R. Tsenov 2, L. Turko 16, R. Ulrich 5, M. Unger 5, D. Uzhva 21, F.F. Valiev 21, D. Veberič 5, V.V. Vechernin 21, A. Wickremasinghe 26,24, Z. Włodarczyk 9, K. Wojcik 14, O. Wyszyński 9, E.D. Zimmerman 25, and R. Zwaska 24
1 National Nuclear Research Center, Baku, Azerbaijan
2 Faculty of Physics, University of Sofia, Sofia, Bulgaria
3 Ruđer Bošković Institute, Zagreb, Croatia
4 LPNHE, University of Paris VI and VII, Paris, France
5 Karlsruhe Institute of Technology, Karlsruhe, Germany
6 University of Frankfurt, Frankfurt, Germany
7 Wigner Research Centre for Physics of the Hungarian Academy of Sciences, Budapest, Hungary
8 University of Bergen, Bergen, Norway
9 Jan Kochanowski University in Kielce, Poland
10 Institute of Nuclear Physics, Polish Academy of Sciences, Cracow, Poland
11 National Centre for Nuclear Research, Warsaw, Poland
12 Jagiellonian University, Cracow, Poland
13 AGH - University of Science and Technology, Cracow, Poland
14 University of Silesia, Katowice, Poland
15 University of Warsaw, Warsaw, Poland
16 University of Wrocław, Wrocław, Poland
17 Warsaw University of Technology, Warsaw, Poland
18 Institute for Nuclear Research, Moscow, Russia
19 Joint Institute for Nuclear Research, Dubna, Russia
20 National Research Nuclear University (Moscow Engineering Physics Institute), Moscow, Russia
21 St. Petersburg State University, St. Petersburg, Russia
22 University of Belgrade, Belgrade, Serbia
23 University of Geneva, Geneva, Switzerland
24 Fermilab, Batavia, USA
25 University of Colorado, Boulder, USA
26 University of Pittsburgh, Pittsburgh, USA