Fairness-Aware Explainable Recommendation
over Knowledge Graphs
Abstract.
There has been growing attention on fairness considerations recently, especially in the context of intelligent decision making systems. Explainable recommendation systems, in particular, may suffer from both explanation bias and performance disparity. In this paper, we analyze different groups of users according to their level of activity, and find that bias exists in recommendation performance between different groups. We show that inactive users may be more susceptible to receiving unsatisfactory recommendations, due to insufficient training data for the inactive users, and that their recommendations may be biased by the training records of more active users, due to the nature of collaborative filtering, which leads to an unfair treatment by the system. We propose a fairness constrained approach via heuristic re-ranking to mitigate this unfairness problem in the context of explainable recommendation over knowledge graphs. We experiment on several real-world datasets with state-of-the-art knowledge graph-based explainable recommendation algorithms. The promising results show that our algorithm is not only able to provide high-quality explainable recommendations, but also reduces the recommendation unfairness in several respects.
1. Introduction
Compared with traditional recommendation systems (RS), explainable recommendation is capable of not only providing high-quality recommendation results but also offering personalized and intuitive explanations (Zhang and Chen, 2020), which are important for e-commerce and social media platforms. However, current explainable recommendation models leave two major concerns in terms of fairness. First, the model discriminates unfairly among the users in terms of recommendation performance. And second, the model may further discriminate between users in terms of explanation diversity. In this paper, we consider the fairness issues of both performance imbalance and explanation diversity in explainable recommendation, which arises from the fact that there may be groups of users who are less noticeable on a platform, e.g., due to inactivity, making them less visible to the learning algorithms.
One reason for this relates to the issue of data imbalance. Some users are disinclined to make a large number of purchases, which leads to insufficient historical user–item interactions. For instance, on e-commerce platforms such as Amazon, eBay, or Taobao, economically disadvantaged groups often make fewer purchases in light of their limited income and credit opportunities (Ge et al., 2020). Under such circumstances, when making recommendation decisions, explainable RS models will be subject to algorithmic bias. The lack of user–item interactions implies that the corresponding user preferences are barely captured, causing weak visibility of such users to the RS model. This leads to the risk of such users being treated unfairly in terms of both recommendation performance and explanation diversity. In this paper, we aim at alleviating such algorithmic bias and improving the fairness of explainable recommendations.
Unfortunately, it is challenging to study fairness in recommendation systems due to the lack of unifying definitions and means of quantifying unfairness. Farnadi et al. (2018) claim that no model can be fair in every aspect of metrics. Previous work has explored the fairness problem in recommendation from the perspective of selection aspects (Geyik et al., 2020; Singh and Joachims, 2018; Schnabel et al., 2016), marketing bias (Wan et al., 2020), popularity bias (Yang et al., 2018), multiple stakeholders (Burke, 2017) in terms of consumers and providers, among others. Existing research on fairness has shown that protected groups111Chen et al. (2019b) summarizes the protected classes defined by the US Fair Housing Act (FHA) and Equal Credit Opportunity Act (ECOA)., defined as the population of vulnerable individuals in terms of sensitive features such as gender, age, race, religion, etc., are easily treated in a discriminatory way. However, it is generally not easy to obtain access to such sensitive attributes, as users often prefer not to disclose such personal information. In this study, we instead consider a directly observable property, the visibility of the user to the explainable RS model, which relates to a user’s level of activity on the platform, and may directly entail subpar treatment by the recommendation engine.
We are interested in solving the fairness problem on the user side specifically for knowledge graph (KG) enhanced explainable recommender systems. Since KGs preserve structured and relational knowledge, they make it easy to trace the reason for specific recommendations. KG-based approaches have thus grown substantially in popularity in explainable recommendation. Their explicit explanations take the form of reasoning paths, consisting of a sequence of relationships that start from a user and ultimately lead to a recommended item. State-of-the-art KG-based explainable RS methods (Ai et al., 2018; Xian et al., 2019; Wang et al., 2019; Wang et al., 2018; Zhang et al., 2016; Xian et al., 2020) utilize rich entity and relation information within the KG to augment the modeling of user–item interactions222We interchangeably use “user interactions” and “user–item interactions” in the paper., so as to better understand the user preferences to make satisfactory recommendation decisions, accompanied by explainable reasoning paths. However, due to the fundamental nature of collaborative filtering, current KG-based explainable recommendation methods heavily rely on users’ collective historical interactions for model learning, so the recommendations and corresponding explanations tend to be more consistent with the dominating historical user interactions. Because of this, current RS methods tend to neglect the user–item interactions of less visible, inactive users, since they are easily overwhelmed by more visible, active users.
Thus, we argue that it is critical for a RS to pay attention to inactive users as well, so that they can be served with high-quality recommendations and more diverse explanations. The connecting paths between users and recommended items are expected to be highly relevant and match past user interactions. Thus, a learning algorithm drawing on user–item path links is likely to yield better recommendation performance for users who have contributed more interactions. However, the remaining portion of users that are less visible to the model may end up not enjoying the same recommendation experience. In part, this can stem from a lack of a relevant user–item interaction history to accurately reveal the user preferences. However, even if a user is not entirely inactive, the model’s training on input data dominated by the more visible users can easily lead to it being biased towards the interactions made by the most active and privileged users.
In this work, we capture user–item interactions at both the individual and group level in terms of user–item paths. We particularly seek to understand 1) how to verify our concerns about the unfairness problems in explainable recommender systems and quantify such unfairness; 2) how to alleviate any potential algorithmic bias so as to improve the recommendation quality, while providing diverse explanations, especially for disadvantaged users, 3) whether our fairness-aware method is able to consider both group-level fairness and individual-level fairness, and whether it possesses generalizability to multiple KG-enhanced explainable RS methods.
Based on these, our main contributions include:
-
•
We study four e-commerce datasets from Amazon and conduct a data-driven observation analysis to assess their data imbalance characteristics. We identify unfairness owing to the difference in historical user–item interactions, and argue that current KG-based explainable RS algorithms neglect the discrepancy of user preferences, which gives rise to unfair recommendations. Additionally, we devise the group fairness and individual fairness criteria with regard to recommendation performance and explanation diversity.
-
•
Since there are intrinsic differences in user preferences among the users due to data imbalance, our goal is not to pursue an absolute parity of recommendations and explanation diversity. Rather, we propose a fairness-aware algorithm so as to provide fair explainable diversity leading to potential items of interest for recommendations. Specifically, we formalize this as a 0–1 integer programming problem and invoke modern heuristic solving techniques to obtain feasible solutions.
-
•
Our algorithm is expected to improve the recommendation quality while narrowing the disparity between different groups of users. Through extensive experiments and case studies, the quantitative results suggest that our fairness-aware algorithm provides significant improvements in both recommendation and fairness evaluation, at both the group level and individual level.
2. Related Work
Fairness in Decision Making. Growing interest in fairness has arisen in several research domains. Most notably, for data-driven decision-making algorithms, there are concerns about biases in data and models affecting minority groups and individuals (Corbett-Davies et al., 2017). Group fairness, also known as demographic parity, requires that the protected groups be treated equally to advantaged groups or the general population (Hardt et al., 2016; Pedreshi et al., 2008; Singh and Joachims, 2018). In contrast, individual fairness requires that similar individuals with similar attributes be treated similarly (Dwork et al., 2012; Biega et al., 2018; Kusner et al., 2017; Lahoti et al., 2018). Several prior works have sought to quantify unfairness both at the group and individual level (Kleinberg et al., 2017). Model bias has in fact been shown to amplify biases in the original data (Barocas and Selbst, 2016; Feldman et al., 2015; Zhao et al., 2017). For each specific domain, there is a need to design suitable metrics to quantify fairness and develop new debiasing methods to mitigate inequity for both groups and individuals.
Fairness-aware Ranking and Recommendation. In the field of recommendation systems, the concept of fairness has been extended to multiple stakeholders (Burke, 2017). Lin et al. (2017) defined fairness measures in recommendation and proposed a Pareto optimization framework for fair recommendation. Mehrotra et al. (2018) addresses the supplier fairness in two-sided marketplace platforms and proposed heuristic strategies to jointly optimize fairness and relevance. Different aspects of fairness have been explored. Beutel et al. (2019) investigated pairwise recommendation with fairness constraints. Celis et al. (2019) addressed the polarization in personalized recommendations, formalized as a multi-armed bandit problem. As for the fairness ranking, Zehlike et al. (2017) proposed a fair top- ranking task that ensures that the proportion of protected groups in the top- list remains above a given threshold. Singh and Joachims (2018) presented a conceptual and computational framework for fairness ranking that maximizes the utility for the user while satisfying specific fairness constraints. Geyik et al. (2020) developed a fairness-aware ranking framework that improves the fairness for individuals without affecting business metrics. Wu et al. (2018) draw on causal graphs to detect and remove both direct and indirect rank bias, and show that a casual graph approach outperforms statistical parity-based approaches in terms of the identification and mitigation of rank discrimination. In our work, we are particular interested in the disparity of user visibility to modern ranking algorithms in recommendation systems.
Explainable Recommendation with Knowledge Graphs. Explainable recommendation (Zhang and Chen, 2020) has been an important direction in recommender system research. Past work has considered explaining latent factor models (Zhang et al., 2014), explainable deep models (Gao et al., 2019), social explainable recommendations (Ren et al., 2017), visual explanations (Chen et al., 2019a), sequential explanations (Chen et al., 2018), and dynamic explanations (Chen et al., 2019c). An important line of research leverages entities, relationships, and paths in knowledge graphs to make explainable decisions. Within this field, Ai et al. (2018) incorporated TransE-based knowledge graph representations for explainable recommendation. Wang et al. (2019) proposed an attention-based knowledge-aware model to infer user preferences over KGs for recommendation. Xian et al. (2019) adopted reinforcement learning for path inference in knowledge graphs. Chen et al. (2020) improved the efficiency of KG-based recommendation based on non-sampling learning. However, none of these works considered model bias, which may lead to both recommendations and explanations that fail to satisfy basic principles of fairness.
3. PRELIMINARIES
In this section, we introduce the relevant concepts regarding explainable recommendation over knowledge graphs.
A knowledge graph is defined as a set of triples with , where is a set of entities and is a set of relations connecting two different entities. A relationship between a head entity and tail entity through relation in the graph can be represented as the triple . In standard recommendation scenarios, the subset stands for the User entities, while represents item entities (). Each relation uniquely determines the candidate sets for its head and tail entities. For example, a “purchase” in e-commerce recommendation, denoted by , always has .
A pattern of length in is defined as the sequential composite of relations, , where ”” denotes the composition operator on relations. A path with respect to a pattern , denoted by , is a sequence of entities and relations, defined as . In the context of KG-based recommendation, we specifically consider user–item paths of path pattern , denoted by as a connecting path from user to item , which satisfies that and .
We also define the user–item path distribution over user and item set , denoted by , to be , where denotes the occurrence frequency of user–item paths with respect to pattern , i.e., . The original problem of explainable recommendation over KGs is formally defined as:
Definition 3.1.
(Explainable Recommendation over KGs) Given an incomplete knowledge graph , the goal is to recover missing facts such that each fact is associated with a user–item path , where item is the recommendation for user and the path is the explanation for the recommendation.
4. Motivating Fairness Concerns
4.1. Data Imbalance
The traditional unfairness problem arises based on sensitive intrinsic attributes that distinguish different demographic groups (Ekstrand et al., 2018; Chen, 2018). In this paper, we consider the visibility of users with regard to their activities in terms of user interactions. E.g, economically disadvantaged customers tend to make fewer purchases, leading to imbalanced data. Current explainable models remain oblivious of such disparities in user–item interaction data. Such imbalances, however, may lead to biased models that exhibit unfairness with respect to the recommendation quality and explanation diversity.
To assess the distribution empirically, we consider Amazon datasets for 4 item categories: CDs and Vinyl, Clothing, Cell Phones, and Beauty. Further details of this data are given in Sec. 7.
Table 1 shows the distribution of the number of items purchased in the four datasets. We observe that although the most active users tend to purchase more items, the majority of consumers are inactive users who are easily disregarded by commercial recommendation engines. Therefore, it is indispensable to devise techniques to better serve such users, and it can indeed also make sense economically to serve higher-quality recommendations to them with the hope of enticing them to make further purchases.
4.2. Path Distributions as a Cause of Unfairness
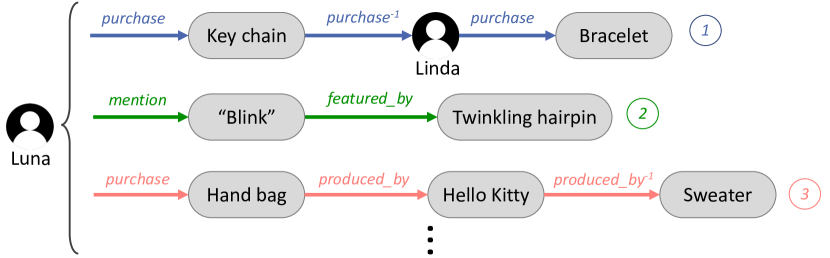
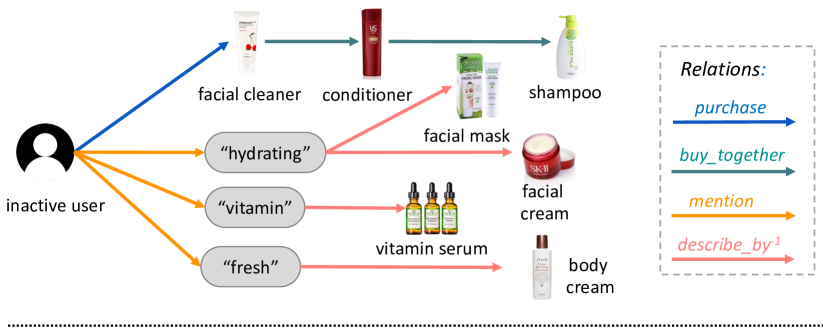
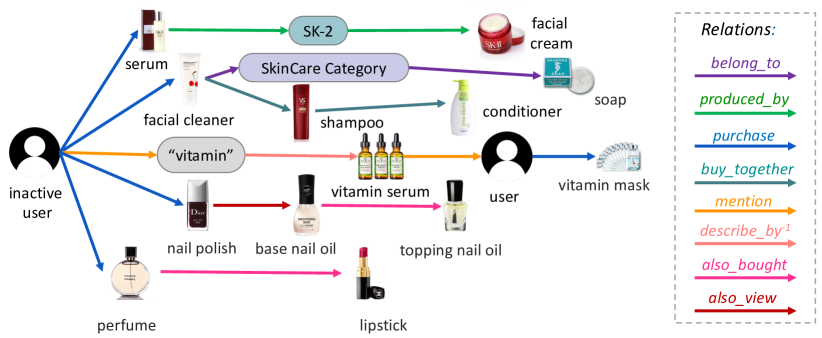
Imbalanced data can easily lead to biased models. For explainable recommendation over KGs, the models generally consider paths along nodes in the KG as pertinent signals for recommendation (Hu et al., 2018). User–item paths in the KG can directly serve as explanations that provide the reason why an item is recommended (Xian et al., 2019). For instance, in Fig. 1, in the first path pattern, Luna may wish to purchase the same bracelet as another user, since both have purchased the same key chain. Luna might also appreciate the twinkling hairpin, since its shiny feature overlaps with her review comment. Finally, Luna may consider purchasing a sweater because it matches the brand of a previous purchase, as in the rd path.
Instead of considering particular paths along specific nodes, we can also consider just the relations involved in the paths to observe which general relational structures are serving as explanations across different paths with similar semantics. The three specific paths in Fig. 1 can be viewed as instances of three different path patterns as defined in Section 3. Thus, the distribution of user–item paths with regard to different path patterns can shed light on the diversity of explanations.
We claim that the divergence of user–item path distributions between two groups is an essential factor leading to unfair recommendation performance and a disparity in the diversity of explanations. To investigate this, we compute a series of statistics pertaining to the path distributions and recommendation quality on the aforementioned Amazon data as follows:
-
(1)
Fig. 2 (a) plots the path distribution over the top- most frequent path patterns. We consider the top 5% of users with the largest number of purchases for each category in the training set as the active group, while the remaining users are considered inactive users. We observe divergent distributions between active and inactive users according to this group division. Although the inactive group constitutes the majority of users, their user–item path patterns lack diversity. We shall see that this can lead to unfair recommendation performance.
-
(2)
Table 2, described later in further detail, provides experimental results for a number of recommendation algorithms, with separate columns for active vs. inactive users. We observe that the inactive group obtains far lower scores compared to the active group, which consists of only 5% of users. Thus, the performance for the vast majority of users is sacrificed.
However, current KG-based recommendation approaches (Ai et al., 2018; Wang et al., 2019; Xian et al., 2019) neglect the distribution of paths connecting users and items. Their heuristic sampling strategy fits the overall path distribution, which is highly skewed.
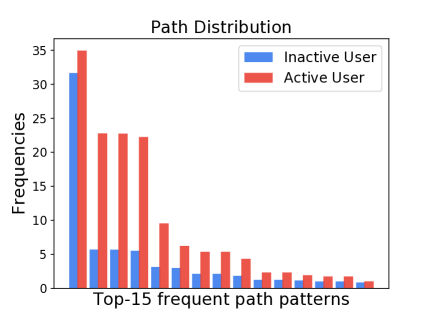
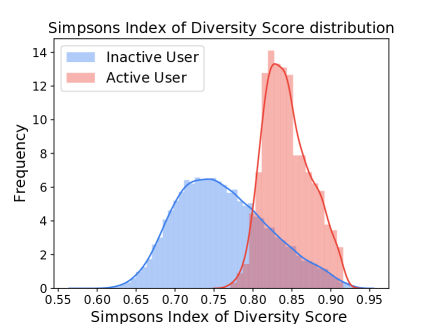
(a) Path distribution over patterns (b) score distribution
4.3. Quantifying Diversity
To better assess the difference in path distribution between two groups, we introduce Simpson’s Index of Diversity () (Simpson, 1949) as a metric that quantifies the unfairness. is often used to quantify the biodiversity of a habitat in ecological science, taking into account the number of types (e.g., species) present, as well as the abundance of each type. Specifically, the two main factors taken into account to measure diversity are richness and evenness. Richness is the number of different species present and evenness compares the similarity of the population size of each of the species present. A habitat or community dominated by one or two species is considered to be less diverse than one in which several different species are similarly abundant. Note that the alternative Shannon index is more sensitive to the size of species. Conversely, Simpson’s index emphasizes the dominant species more compared to the Shannon index (also called Shannon entropy). In other words, Shannon entropy is a proper manifestation mainly for species richness, while takes into account both richness and evenness measuring both absolute diversity of species and relative abundance of species.
We conduct the corresponding analysis of our Amazon data assuming each user represents a unique community, while the patterns of corresponding user–item paths denote the species within such a community. Formally, the measures the probability that two randomly selected individual user–item paths belong to the same user–item path pattern. The probability of obtaining the same pattern in two random draws is defined as333If the size of dataset is very large, sampling without replacement provides approximately the same result, however, when the size of dataset is small, the difference can be substantial.:
| (1) |
where represents the number of path patterns for the specified user to the item , denotes the number of such paths belonging to the -th path pattern, and is the total number of user–item paths originating from the user. The value ranges between 0 and 1, with larger values indicating a greater path pattern diversity. In our setup, we compute for each user based on sampling without replacement. The distribution plotted in Fig. 2 (b) shows that the inactive group of users have less diversity in their path patterns compared to the active users. We shall later invoke Simpson’s Index of Diversity in our fairness algorithm.
| Dataset | CDs & Vinyl | Clothing | Cell Phones | Beauty |
|---|---|---|---|---|
| 0 | 0 | 0 | 0 | |
| 18.1K | 15.3K | 12.0K | 7.1K | |
| 20.0K | 13.6K | 0.9K | 6.9K | |
| 16.4K | 7.3K | 4.7K | 4.7K | |
| 11.2K | 2.3K | 1.1K | 2.5K | |
| 3.5K | 445 | 267 | 886 | |
| 2.1K | 36 | 55 | 233 |
5. Fairness Objectives
In this section, we formally define the problem of fairness-aware explainable recommendation, considering both group and individual level fairness. The group unfairness measurement over the entire population can be viewed as a between-group unfairness component. We approximate such parity across a divided set of subgroups of the population, e.g., in accordance with user visibility. The individual unfairness component is computed as an average sum of inequality in benefits received by individuals overall. We also formalize similar metrics in terms of individual-level fairness.
5.1. Group Unfairness Metrics
Group fairness holds when users from two groups maintain the same probability of a positive decision (Dwork and Ilvento, 2018). In our setting, we consider a group of active users vs. a group of inactive users , defined according to the number of purchased items from historical records, such that .
Suppose there are users associated with top- recommended items . In the following part, we take and to index users and items. We use , where denotes whether item is selected for recommendation to user . Let represent the selection vector for the top- recommendation list of user under the constraints , . We use the notation to refer to a metric that scores the recommendation quality such that denotes the recommendation quality for user , invoking a metric such as or F1 score.
The group recommendation unfairness is defined as follows:
Definition 5.1.
Group Recommendation Unfairness:
| (2) |
As we have discussed in the previous section, it is the disparity in the diversity of the path distribution which leads to the performance disparity. In explainable recommendation over KGs, we also define group-level unfairness of the explanation path diversity by applying Simpson’s Index of Diversity () to the user–item path distribution. In this context, we define:
Definition 5.2.
Group Explanation Diversity Unfairness:
| (3) |
where reflects the explanation fairness score in terms of the diversity of historical interactions of user with explainable paths (defined later in Eq. 10). We adopt the averaging strategy to represent the user–item explanation diversity of two groups.
5.2. Individual Unfairness Metrics
The concept of individual fairness was first introduced by Dwork et al. (2012) to address the inability of group fairness to reflect individual merits. The underlying notion is that similar individuals ought to be treated similarly. In our recommendation setting, it is not possible to meet the strict criteria of individual fairness, since we focus on solving the algorithm bias, not the inherent data imbalance. However, we can follow this idea to measure the individual unfairness with regard to both recommendation performance and explanation diversity.
For this, we invoke the Gini coefficient (Gini, 1921), which is commonly used in sociology and other fields to measure the inequality dispersion. It ranges from 0 to 1, where 1 represents maximal inequality in the sense that one single person has all the income or consumption, and all others have none, while 0 means perfect equality, where everyone has the same income value. In our setting, the Gini coefficient is adopted to quantify the individual recommendation performance unfairness as follows:
Definition 5.3.
Individual Recommendation Unfairness:
| (4) |
where denotes two random users. Similarly, considering the explanation diversity in terms of fairness, we also define a measure of explanation diversity disparity among different individual users:
Definition 5.4.
Individual Explanation Diversity Unfairness:
| (5) |
5.3. Problem Formulation
We can now proceed to formalize the problem of explainable recommendation under fairness constraints. The original KG-based explainable recommendation problem aims to recover missing user–item interactions from an incomplete KG along with a set of paths that serve as the corresponding explanations for the recommendations. Instead of imposing fairness constraints in the path-finding process, which would require substantial computational effort to retrain existing models, we seek a fairness-aware path reranking for explainable recommendation. Given a candidate set of user–item paths selected by an existing model, our goal is to rank the paths to obtain high-quality recommendations while satisfying fairness constraints. Formally, we define the problem as follows.
Definition 5.5.
Group Fairness-aware Explainable Recommendation Given a set of users from different groups , each user having a set of user–item paths, and an integer , the goal is to maximize the overall top recommendation quality by ranking these paths for each user under the fairness constraints that and , where and implying the -th candidate path is selected among top outputs for the -th user by the algorithm.
Similarly, we can define the task of individual fairness-aware explainable recommendation by treating each user as belonging to a group and using Eq. 5.3 and Eq. 5.4 in the fairness constraints. One important application is to quantify the unfairness of an algorithm, particularly assessing how different the outcomes are between different groups when using current state-of-the-art algorithms. Thus, we will attempt to minimize the unfairness while retaining the recommendation quality to the extent possible.
6. Fairness-Aware Algorithm
| Dataset | CDs & Vinyl | Clothing | ||||||||||||||
|---|---|---|---|---|---|---|---|---|---|---|---|---|---|---|---|---|
| Measures () | Overall | Inactive Users | Active Users | GRU | Overall | Inactive Users | Active Users | GRU | ||||||||
| NDCG | F1 | NDCG | F1 | NDCG | F1 | NDCG | F1 | NDCG | F1 | NDCG | F1 | NDCG | F1 | NDCG | F1 | |
| HeteroEmbed | 6.992 | 3.576 | 6.526 | 3.373 | 15.843 | 7.429 | 9.317 | 4.056 | 3.221 | 1.404 | 3.121 | 1.348 | 5.130 | 2.461 | 2.009 | 1.113 |
| Fair HeteroEmbed | 8.094 | 4.019 | 7.674 | 3.820 | 16.074 | 7.801 | 8.400 | 3.981 | 3.494 | 1.536 | 3.484 | 1.482 | 3.691 | 2.556 | 0.207 | 1.074 |
| PGPR | 6.947 | 3.571 | 6.526 | 3.373 | 14.943 | 7.324 | 8.417 | 3.951 | 2.856 | 1.240 | 2.787 | 1.198 | 4.197 | 2.036 | 1.410 | 0.833 |
| Fair PGPR | 8.045 | 4.019 | 7.675 | 3.820 | 15.074 | 7.801 | 7.399 | 3.261 | 3.101 | 1.314 | 3.089 | 1.274 | 3.322 | 2.078 | 0.233 | 0.804 |
| KGAT | 5.411 | 3.357 | 5.038 | 3.162 | 12.498 | 7.046 | 7.460 | 3.884 | 3.021 | 1.305 | 2.931 | 1.254 | 4.741 | 2.259 | 1.810 | 1.005 |
| Fair KGAT | 5.640 | 3.492 | 5.295 | 3.318 | 12.366 | 6.791 | 7.081 | 3.473 | 3.206 | 1.393 | 3.119 | 1.347 | 4.843 | 2.262 | 1.724 | 0.915 |
| Dataset | Beauty | Cell Phones | ||||||||||||||
| Measures () | Overall | Inactive Users | Active Users | GRU | Overall | Inactive Users | Active Users | GRU | ||||||||
| NDCG | F1 | NDCG | F1 | NDCG | F1 | NDCG | F1 | NDCG | F1 | NDCG | F1 | NDCG | F1 | NDCG | F1 | |
| HeteroEmbed | 6.371 | 3.125 | 6.078 | 2.756 | 11.933 | 10.132 | 5.855 | 7.376 | 5.833 | 2.537 | 5.645 | 2.311 | 9.395 | 6.829 | 3.750 | 4.518 |
| Fair HeteroEmbed | 6.740 | 3.181 | 6.451 | 2.924 | 12.229 | 9.853 | 5.778 | 6.929 | 6.199 | 2.678 | 6.037 | 2.466 | 9.284 | 6.648 | 3.247 | 4.182 |
| PGPR | 5.456 | 2.544 | 5.219 | 2.291 | 9.766 | 7.349 | 4.547 | 5.148 | 5.079 | 2.116 | 4.945 | 1.972 | 7.626 | 4.846 | 2.681 | 2.874 |
| Fair PGPR | 5.717 | 2.680 | 5.504 | 2.430 | 9.766 | 7.431 | 4.262 | 5.001 | 5.380 | 2.193 | 5.252 | 2.076 | 7.807 | 4.409 | 2.555 | 2.333 |
| KGAT | 6.108 | 3.169 | 5.863 | 2.761 | 10.763 | 10.929 | 4.900 | 8.168 | 5.111 | 2.265 | 4.958 | 2.100 | 8.026 | 5.391 | 3.068 | 3.297 |
| Fair KGAT | 6.241 | 3.228 | 6.001 | 2.832 | 10.785 | 10.752 | 4.784 | 7.920 | 5.304 | 2.391 | 5.159 | 2.240 | 8.057 | 5.256 | 2.898 | 3.016 |
In this paper, we propose a general fairness-aware ranking framework, which can be applied on top of several state-of-the-art explainable recommendation algorithms based on knowledge graphs. With an understanding of the fairness goals, the question that arises is: How could an explainable recommendation model be able to yield a fair recommendation list while maintaining explanation diversity? The original explainable paths provided by the original algorithms provide compelling arguments for why a given item is recommended based on historical user interactions. It would not make sense to completely ignore all of them. At the same time, fairness constraints raise path diversity as an additional concern. On the basis of this, our fairness-aware algorithm should consider both historical user interactions and the diversity of generated explainable paths.
We introduce two fairness scores: the path score and the diversity score .
Path Score.
The path score weights the quality of paths. According to the motivation of fairness concerns in Sec. 4, we wish to consider a more varied set of paths rather than just the kinds that dominate the historic user–item interaction data. Therefore, our path score incorporates an explicit debiasing weighting to adjust the bias of user–item path patterns in historical records:
| (6) |
where is the vector of recommended items as defined in Sec. 5. For a path pattern and a user , we use as the coefficient expressing the preference adjustment for the user .
| (7) |
Here, is the set of all positive user–item paths starting from user with respect to path pattern to item . (where and ) is the score of a path , which can easily be computed following the methods proposed for current KG-based explainable recommendation systems. represents the weight of the path pattern in generated explainable paths:
| (8) |
Finally, is the weight of path pattern in the training set defined in Sec. 3. On the one hand, we retain the existing weights of path scores as , while on the other hand striving to break the intrinsic explainable path patterns assigned to different groups of users. For the latter, serves as a regularization factor to minimize the path diversity bias between the groups.
Diversity Score.
Additionally, we also consider the fairness with regard to explainable path diversity. For each user–item pair , we get access to the user–item path distribution based on the retrieved explainable paths of the original algorithm (Ai et al., 2018; Xian et al., 2019), as . Let be a number of valid user–item path patterns in the KG. Then we are able to calculate Simpson’s Index of Diversity of such pairs as , as defined in Sec. 4.3, where denotes the total number of retrieved paths starting from user and ending up at item as . We can then define our diversity score, which can be regarded as introducing regularization for explainable path diversity:
| (9) |
Fairness score.
By aggregating the personalization and diversity scores, we can calculate the fairness score for user defined as:
| (10) |
where is the weighting factor of path score , compared to the diversity score . is a scaling factor so that and can be normalized onto the same scale.
Recommendation score
We follow the baseline method of calculating the preference score between user and item . Our goal becomes to find a selection strategy for each user to recommend items that meet the group fairness constraints. Therefore, we can formulate the optimization recommendation problem as follows:
| (11) | ||||
| (12) | s.t. | |||
| (13) | ||||
| (14) |
Here, Eqs. 13 and 14 refer to the GRU and GEDU proposed in Def. 5.1 and 5.2, respectively, with and representing recommendation performance and fairness disparity of baselines, correspondingly. Moreover, the optimization could also be extended to individual fairness constraints. We are able to take the constraints of the Gini coefficient difference as proposed in Defs. 5.3 and 5.4. In this case, we replace Eqs. 13 and 14 with following:
| (15) | |||
| (16) |
Here, and are the individual recommendation and fairness disparity of the corresponding baselines.
The optimization of Eq. 11 can be cast as a 0-1 integer programming optimization problem. Although it is NP-complete, we can use fast heuristics444We use the Gurobi solver, https://www.gurobi.com/. to find feasible solutions. While these may converge to a local optimum rather than a global one, our empirical findings show that the fairness-aware top- selection obtained is superior enough compared to the baseline methods. Further details will be given in Sec. 7.
Ranking Score
After solving the optimization problem and selecting which items to recommend under fairness constraints for each user as , we still need to rank the items to determine in which order they are presented. This also allows us to better compare the results against the baseline methods. Specifically, we create a top-k recommendation list with items ranked in descending order by the optimized recommendation score and the fairness score, defined as:
| (17) |
where is the weighting factor of the ranking fairness score. Similar to the above, we also add a factor , which achieves the scaling effect.
7. Experiments
In this section, we first briefly describe the four real-world e-commerce datasets used for experiments. Then, we evaluate our proposed fairness-aware algorithm on top of existing explainable recommendation approaches. A series of quantitative and qualitative analyses demonstrate the positive effects on both fairness metrics and the recommendation performance.
7.1. Dataset and Experimental Setup
Datasets
All of our experiments are based on Amazon item e-commerce datasets (He and McAuley, 2016). The collection consists of four different domains: CDs and Vinyl, Clothing, Cell Phones, and Beauty. It should be noted that each dataset is considered as an independent benchmark that constitutes a respective knowledge graph with entities and relations crawled from Amazon555https://www.amazon.com/. Thus, the evaluation results are not comparable over different domains. The statistical details and train/test split correspond exactly to those of previous work in this area (Ai et al., 2018; Xian et al., 2019). Note that following Xian et al. (2019), there is no constraint on possible path patterns, so any path between a user and the recommended item is considered to be valid. However, since shorter paths are more reliable for users as explanation for recommendation, we only consider user–item paths with a length of up to . We utilize the path patterns extracted from the KG dataset by the baselines for an equal comparison.
Experimental Setup
As a prior investigation to verify the rationality of the unfairness, we first study the user interaction difference in terms of path distribution and the recommendation performance disparity over three state-of-art explainable RSs over KGs (Ai et al., 2018; Xian et al., 2019; Wang et al., 2019). They rank the recommendation list by calculating the relevance scores of user–item pairs. Ai et al. (2018) picks items using translational entity embeddings, while Xian et al. (2019) computes the score as a path reward via reinforcement learning. Wang et al. (2019) propose an attention-based collaborative knowledge graph method.
Following previous work, we consider as metrics the Normalized Discounted Cumulative Gain (NDCG) and F1 scores, two popular metrics to evaluate the recommendation performance. F1 scores provide the harmonic mean of precision and recall, while NDCG evaluates the ranking by considering the position of correctly recommended items. We evaluate the group fairness and individual fairness in terms of the recommendation quality and explanation diversity, with the metric defined in Sec. 5.
(a) Gini of (b) Gini of Rec. Metrics (c) Gap of
(d) Gini of (e) Gap of Rec. Metrics (f) Gap of
(a) Gini of (b) Gini of Rec. Metrics (c) Gap of
(d) Gini of (e) Gap of Rec. Metrics (f) Gap of
(a) Gini of (b) Gini of Rec. Metrics (c) Gap of
(d) Gini of (e) Gap of Rec. Metrics (f) Gap of
(a) Gini of (b) Gini of Rec. Metrics (c) Gap of
(d) Gini of (e) Gap of Rec. Metrics (f) Gap of
7.2. Main Results
First, we show both the recommendation improvements and fairness effectiveness of our fairness-aware algorithm compared to state-of-the-art explainable RS models over KGs in terms of NDCG and F1 scores as well as Group Recommendation Unfairness () between active group users and inactive group users.
The main results on the four Amazon datasets are provided in Table 2. Note that the Difference is calculated by the defined in Eq. 5.2 through abstraction of corresponding metric scores between inactive users and active users. The overall performance is calculated by the 95% of inactive users scores with the addition of 5% of active users scores, which matches the ratio of the group split.666We report the results of the baselines with our own implementation. There is a slight discrepancy compared to original results. Our method outperforms all the baseline approaches for recommendation by a large margin in all settings. All of our fairness-aware algorithms take uniform parameters with and . The overall performance of both approaches with fairness constraints even got boosted, while shrinking the fairness disparity between the groups. For example, on the Clothing dataset, our fairness-aware algorithm over PGPR achieves 3.101% in NDCG, which is higher than 2.856% of vanilla PGPR, and the group unfairness decreases to a great extent, from 1.410% to 0.233%. Similar trends can be observed for the other datasets. Although we sacrifice some of the performance for the most active users, we substantially boost the performance for the inactive users. The disparity between inactive and active users gets closed for group fairness.
It is fairly remarkable that after adopting the fairness-aware algorithm over two recent state-of-the-art baseline methods, we are able to retrieve substantially better recommendation results than the original methods. We conjecture that our algorithm better harnesses the potential of current explainable recommendation methods by adapting the path distribution so that more diverse reasoning paths can be served to the users. Since the inactive users undergo a prejudiced treatment due to the homogeneous user interactions with lower user visibility, they tend to benefit more under our fairness-aware algorithm.
7.3. Ablation Study
Besides recommendation performance, we also study how different weights for the fairness scores influence the fairness results regarding to the diversity metrics in Def. 5.2 and the individual fairness metrics using the Gini coefficient defined in Defs. 5.3 and 5.4.
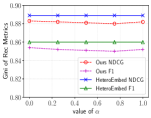
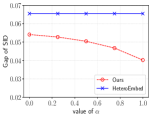
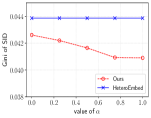
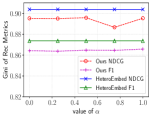
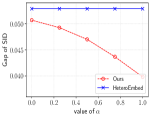
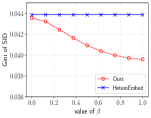
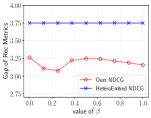
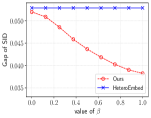
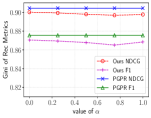
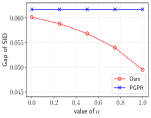
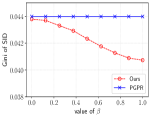
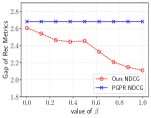
7.3.1. Study of fairness weight
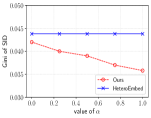
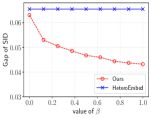
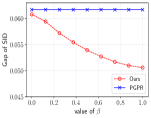
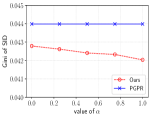
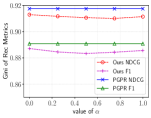
We first show how the choice of personalization weight from Eq. 10 affects the recommendation performance, group fairness, and individual fairness. The results are plotted as (a-c) in Figs. 3, 4, 5, and 6, including both our fairness-aware performance (red and purple curves) and the baselines (blue and green curves).
We observe that our model consistently outperforms vanilla HeteroEmbed and PGPR baselines under all settings of in terms of Group Explainable Diversity Unfairness () and individual Recommendation Unfairness (), as shown in parts (a) and (c) of the aforementioned figures. The unfairness is minimized at the point of , i.e., when not accounting for historical path distributions, but focusing solely on debiasing the intrinsic user preferences, our model can achieve a high degree of fairness. However, with an apt choice of , we can not only benefit the in (b) figures, but also maintain the more reliable and .
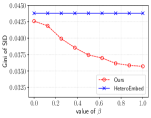
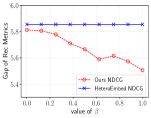
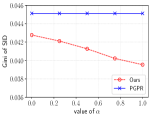
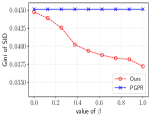
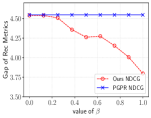
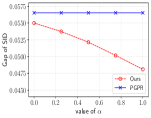
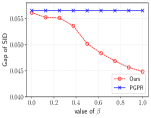
7.3.2. Study of ranking weight
Next, we consider the effect of the ranking weight from Eq. 17. Since we already obtain the items from the filtered original top- list, the factor does not change the F1 score. We provide results on the Cellphones and Beauty datasets, first fixing , which was shown to give strong results in the main results.
Subfigures (d-f) in Figs. 3, 4, 5, and 6 plot the results. We observe, first of all, that as the weight of increases, our fairness-aware algorithm is able to consistently reduce the and . For , there is no external fairness weight incorporated into the overall ranking score, which obtains slightly better results than the baselines owing to the optimization process. In contrast, represents only considering the fairness weights but ignoring the original recommendation scores. The optimal choice for minimizing the is when is around 0.2 for Fair HeteroEmbed, while for Fair PGPR, obtains better results. This might be because the PGPR method prunes away some less salient word features via TF-IDF scoring. In such cases, paths containing the feature word will be eliminated. Also, some inactive users prefer making comments on items rather than purchasing them. Such preprocessing will make the inactive users hold even less interactions. Therefore, our fairness-aware explainable algorithm yields strong fairness improvements when for the PGPR baseline.
7.4. Study of Recommendation Quality under Fairness-Aware Algorithm
After studying the fairness metrics, we next study how the recommendation quality is affected by the parameter choices. From Eqs. 10 and 17, we can infer that changes of can exert more influence than . As we fix the path fairness weight , the right side of Table 3 indicates the recommendation performance of inactive users initially is boosted as grows, and then the performance starts to drop as approaches . Similar conclusions can be drawn: If there is less weight on the recommendation score as a guide to create a proper ranking of recommended lists and balance the fairness effects, the role of generated explainable paths would gradually diminish, leading the model towards making inappropriate ranking decisions.
The left part of Table 3 reflects the recommendation performance variance in terms of path fairness weight . As we discussed before, suggests the fairness-aware algorithm is no longer taking advantage of the user debiasing. As the ratio of increases, the larger the effect of the self adjustment regularization, which leads to a decreasing . However, when , both the recommendation performance and the decrease at a small rate. We can conclude that the zero score of path diversity mean that the weight of the generated path diversity has been eliminated, which leads to fairness scores only coming from the path ranking component. Thus, the recommendation performance degrades to a small extent. The results appear reasonable because the model naturally will behave less intelligently if it either completely ignores the user’s historical interactions or if it considers only the path debiasing. Any extreme regularization of one particular side may harm the recommendation performance. Therefore, it is indispensable to choose the proper hyper-parameters for robust performance.
Still, note that no matter how we change or , in Table 3, we can observe that the group unfairness metric is always better than for the baselines.
| Beauty | Cell Phones | ||||||||
|---|---|---|---|---|---|---|---|---|---|
| Metric() | Inactive (IA) | Active (A) | GRU | IA | A | GRU | |||
| NDCG | F1 | NDCG | F1 | NDCG | F1 | NDCG | NDCG | NDCG | |
| (*) | 6.075 | 2.756 | 11.930 | 10.132 | 5.855 | 7.376 | 5.645 | 9.395 | 3.75 |
| 0.0 | 6.317 | 2.916 | 12.088 | 9.765 | 5.771 | 6.949 | 5.658 | 8.821 | 3.163 |
| 0.125 | 6.354 | 2.926 | 12.088 | 9.790 | 5.734 | 6.864 | 5.782 | 8.888 | 3.106 |
| 0.25 | 6.407 | 2.930 | 12.089 | 9.800 | 5.682 | 6.870 | 5.924 | 8.999 | 3.075 |
| 0.375 | 6.459 | 2.933 | 12.206 | 9.802 | 5.747 | 6.869 | 6.033 | 9.254 | 3.221 |
| 0.5 | 6.470 | 2.935 | 12.232 | 9.808 | 5.762 | 6.873 | 6.037 | 9.284 | 3.247 |
| 0.625 | 6.462 | 2.928 | 12.230 | 9.834 | 5.768 | 6.906 | 5.974 | 9.216 | 3.242 |
| 0.75 | 6.451 | 2.924 | 12.229 | 9.853 | 5.778 | 6.929 | 5.782 | 9.093 | 3.211 |
| 0.875 | 6.398 | 2.872 | 12.191 | 9.776 | 5.793 | 6.904 | 5.479 | 8.667 | 3.188 |
| 1.0 | 6.368 | 2.836 | 12.145 | 9.732 | 5.777 | 6.891 | 5.217 | 8.373 | 3.156 |
7.5. Case study
Figure 7 illustrates the real effects of our fairness-aware algorithm in terms of path diversity and the accuracy of predicted items. The example comes from the Beauty dataset. The upper part illustrates the outputs of the original vanilla PGPR explainable RS method, which neglects path diversity. It is filled with “user–mention” paths connecting to the predicted items with only 4 items appearing in the top- list. For comparison, after adding our fairness-aware algorithm, the model predicts 6 correct items that users are willing to purchase, associating them with diverse explainable paths. Hence, our approach is able to invoke more items, finding alternative kinds of user–item paths. At the same time, considering the “facial cleaner” example, our fairness-aware algorithm considers two further items connecting with it, so that the user is able to buy further related items. This shows how our fairness-aware method not only is capable of considering a more diverse and comprehensive set of explainable paths, but also ends up finding more correct recommendations.
8. Conclusions
In this work, we study the prominent problem of fairness in the context of state-of-the-art explainable recommendation algorithms over knowledge graphs. We first quantify unfairness at both the individual level and the group level. Based on this, we propose fairness metrics in terms of path diversity as well as the recommendation performance disparity. We then present a generalized fairness-aware algorithm that is capable not only of reducing the disparity but also of maintaining the recommendation quality. We extensively evaluate our model on several real-world datasets, and demonstrate that our approach reduces unfairness by providing diverse path patterns and strong explainable recommendation results. The source code of our work at https://github.com/zuohuif/FairKG4Rec is publicly available.
9. Acknowledgement
The authors thank Dr. Longqi Yang for many enlightening conversations and the reviewers for the valuable comments and constructive suggestions. This work was supported in part by NSF IIS-1910154. Any opinions, findings, conclusions or recommendations expressed in this material are those of the authors and do not necessarily reflect those of the sponsors.
References
- (1)
- Ai et al. (2018) Qingyao Ai, Vahid Azizi, Xu Chen, and Yongfeng Zhang. 2018. Learning Heterogeneous Knowledge Base Embeddings for Explainable Recommendation. Algorithms (2018).
- Barocas and Selbst (2016) Solon Barocas and Andrew D Selbst. 2016. Big data’s disparate impact. California Law Review 104 (2016), 671.
- Beutel et al. (2019) Alex Beutel, Jilin Chen, Tulsee Doshi, Hai Tao Qian, Li Hao Wei, Yi Wu, Lukasz Heldt, Zhe Zhao, Lichan Hong, Ed Huai hsin Chi, and Cristos Goodrow. 2019. Fairness in Recommendation Ranking through Pairwise Comparisons. In ACM SIGKDD. 2212–2220.
- Biega et al. (2018) Asia J. Biega, Krishna P. Gummadi, and Gerhard Weikum. 2018. Equity of Attention: Amortizing Individual Fairness in Rankings. In ACM SIGIR. 405–414.
- Burke (2017) Robin D. Burke. 2017. Multisided Fairness for Recommendation. ArXiv abs/1707.00093 (2017).
- Celis et al. (2019) L. Elisa Celis, Sayash Kapoor, Farnood Salehi, and Nisheeth K. Vishnoi. 2019. Controlling Polarization in Personalization: An Algorithmic Framework. In ACM Proceedings of the Conference on Fairness, Accountability, and Transparency. 160–169.
- Chen et al. (2020) Chong Chen, Min Zhang, Weizhi Ma, Yiqun Liu, and Shaoping Ma. 2020. Jointly Non-Sampling Learning for Knowledge Graph Enhanced Recommendation. In SIGIR.
- Chen (2018) Jiahao Chen. 2018. Fair lending needs explainable models for responsible recommendation. ArXiv abs/1809.04684 (2018).
- Chen et al. (2019b) Jiahao Chen, Nathan Kallus, Xiaojie Mao, Geoffry Svacha, and Madeleine Udell. 2019b. Fairness Under Unawareness: Assessing Disparity When Protected Class Is Unobserved. In FAT*.
- Chen et al. (2019a) Xu Chen, Hanxiong Chen, Hongteng Xu, Yongfeng Zhang, Yixin Cao, Zheng Qin, and Hongyuan Zha. 2019a. Personalized Fashion Recommendation with Visual Explanations based on Multimodal Attention Network: Towards Visually Explainable Recommendation. In SIGIR. 765–774.
- Chen et al. (2018) Xu Chen, Hongteng Xu, Yongfeng Zhang, Jiaxi Tang, Yixin Cao, Zheng Qin, and Hongyuan Zha. 2018. Sequential recommendation with user memory networks. In ACM WSDM. 108–116.
- Chen et al. (2019c) Xu Chen, Yongfeng Zhang, and Zheng Qin. 2019c. Dynamic Explainable Recommendation based on Neural Attentive Models. In AAAI.
- Corbett-Davies et al. (2017) Sam Corbett-Davies, Emma Pierson, Avi Feller, Sharad Goel, and Aziz Huq. 2017. Algorithmic decision making and the cost of fairness. In SIGKDD.
- Dwork et al. (2012) Cynthia Dwork, Moritz Hardt, Toniann Pitassi, Omer Reingold, and Richard Zemel. 2012. Fairness Through Awareness. In Proceedings of the 3rd Innovations in Theoretical Computer Science Conference.
- Dwork and Ilvento (2018) Cynthia Dwork and Christina Ilvento. 2018. Group fairness under composition. In FAT*.
- Ekstrand et al. (2018) Michael D Ekstrand, Mucun Tian, Ion Madrazo Azpiazu, Jennifer D Ekstrand, Oghenemaro Anuyah, David McNeill, and Maria Soledad Pera. 2018. All the cool kids, how do they fit in?: Popularity and demographic biases in recommender evaluation and effectiveness. In FAT*.
- Farnadi et al. (2018) Golnoosh Farnadi, Pigi Kouki, Spencer K. Thompson, Sriram Srinivasan, and Lise Getoor. 2018. A Fairness-aware Hybrid Recommender System. at the 2nd FATRec Workshop on Responsible Recommendation held at RecSys (2018).
- Feldman et al. (2015) Michael Feldman, Sorelle A Friedler, John Moeller, Carlos Scheidegger, and Suresh Venkatasubramanian. 2015. Certifying and removing disparate impact. In Proceedings of the 21th ACM SIGKDD.
- Gao et al. (2019) Jingyue Gao, Xiting Wang, Yasha Wang, and Xing Xie. 2019. Explainable recommendation through attentive multi-view learning. In Proceedings of the AAAI.
- Ge et al. (2020) Yingqiang Ge, Shuyuan Xu, Shuchang Liu, Zuohui Fu, Fei Sun, and Yongfeng Zhang. 2020. Learning Personalized Risk Preferences for Recommendation. SIGIR (2020).
- Geyik et al. (2020) Sahin Cem Geyik, Stuart Ambler, and Krishnaram Kenthapadi. 2020. Fairness-Aware Ranking in Search & Recommendation Systems with Application to LinkedIn Talent Search. In SIGKDD.
- Gini (1921) Corrado Gini. 1921. Measurement of inequality of incomes. The Economic Journal 31, 121 (1921), 124–126.
- Hardt et al. (2016) Moritz Hardt, Eric Price, and Nathan Srebro. 2016. Equality of Opportunity in Supervised Learning. In Proceedings of the 30th NeurIPS (Barcelona, Spain).
- He and McAuley (2016) Ruining He and Julian McAuley. 2016. Ups and downs: Modeling the visual evolution of fashion trends with one-class collaborative filtering. In WWW.
- Hu et al. (2018) Binbin Hu, Chuan Shi, Wayne Xin Zhao, and Philip S Yu. 2018. Leveraging meta-path based context for top-n recommendation with a neural co-attention model. In ACM SIGKDD.
- Kleinberg et al. (2017) Jon M. Kleinberg, Sendhil Mullainathan, and Manish Raghavan. 2017. Inherent Trade-Offs in the Fair Determination of Risk Scores. In ITCS.
- Kusner et al. (2017) Matt J. Kusner, Joshua R. Loftus, Chris Russell, and Ricardo Silva. 2017. Counterfactual Fairness. In Proceedings of the 31st NeurIPS.
- Lahoti et al. (2018) Preethi Lahoti, Gerhard Weikum, and Krishna P Gummadi. 2018. iFair: Learning Individually Fair Data Representations for Algorithmic Decision Making. arXiv preprint arXiv:1806.01059 (2018).
- Lin et al. (2017) Xiao Lin, Min Zhang, Yongfeng Zhang, Zhaoquan Gu, Yiqun Liu, and Shaoping Ma. 2017. Fairness-aware group recommendation with pareto-efficiency. In Proceedings of the Eleventh ACM Conference on Recommender Systems. 107–115.
- Mehrotra et al. (2018) Rishabh Mehrotra, James McInerney, Hugues Bouchard, Mounia Lalmas, and Fernando Diaz. 2018. Towards a Fair Marketplace: Counterfactual Evaluation of the Trade-off Between Relevance, Fairness & Satisfaction in Recommendation Systems. In Proceedings of the 27th ACM CIKM (Torino, Italy). New York, NY, USA, 2243–2251.
- Pedreshi et al. (2008) Dino Pedreshi, Salvatore Ruggieri, and Franco Turini. 2008. Discrimination-aware Data Mining. In Proceedings of the 14th ACM SIGKDD (Las Vegas, Nevada, USA). 560–568.
- Ren et al. (2017) Zhaochun Ren, Shangsong Liang, Piji Li, Shuaiqiang Wang, and Maarten de Rijke. 2017. Social collaborative viewpoint regression with explainable recommendations. In Proceedings of the 10th ACM WSDM.
- Schnabel et al. (2016) Tobias Schnabel, Adith Swaminathan, Ashudeep Singh, Navin Chandak, and Thorsten Joachims. 2016. Recommendations as Treatments: Debiasing Learning and Evaluation. In ICML.
- Simpson (1949) Edward H Simpson. 1949. Measurement of diversity. Nature 163, 4148 (1949).
- Singh and Joachims (2018) Ashudeep Singh and Thorsten Joachims. 2018. Fairness of Exposure in Rankings. In ACM SIGIR. 2219–2228.
- Wan et al. (2020) Mengting Wan, Jianmo Ni, Rishabh Misra, and Julian J. McAuley. 2020. Addressing Marketing Bias in Product Recommendations. In WSDM.
- Wang et al. (2018) Hongwei Wang, Fuzheng Zhang, Jialin Wang, Miao Zhao, Wenjie Li, Xing Xie, and Minyi Guo. 2018. Ripplenet: Propagating user preferences on the knowledge graph for recommender systems. In CIKM. 417–426.
- Wang et al. (2019) Xiang Wang, Xiangnan He, Yixin Cao, Meng Liu, and Tat-Seng Chua. 2019. KGAT: Knowledge Graph Attention Network for Recommendation. In KDD.
- Wu et al. (2018) Yongkai Wu, Lu Zhang, and Xintao Wu. 2018. On Discrimination Discovery and Removal in Ranked Data Using Causal Graph. In SIGKDD. 2536–2544.
- Xian et al. (2020) Yikun Xian, Zuohui Fu, Qiaoying Huang, Shan Muthukrishnan, and Yongfeng Zhang. 2020. Neural-Symbolic Reasoning over Knowledge Graph for Multi-Stage Explainable Recommendation. AAAI DLGMA Workshop (2020).
- Xian et al. (2019) Yikun Xian, Zuohui Fu, S. Muthukrishnan, Gerard de Melo, and Yongfeng Zhang. 2019. Reinforcement knowledge graph reasoning for explainable recommendation. In Proceedings of the 42nd International ACM SIGIR (Paris, France).
- Yang et al. (2018) Longqi Yang, Yin Cui, Yuan Xuan, Chenyang Wang, Serge Belongie, and Deborah Estrin. 2018. Unbiased offline recommender evaluation for missing-not-at-random implicit feedback. In RecSys. 279–287.
- Zehlike et al. (2017) Meike Zehlike, Francesco Bonchi, Carlos Castillo, Sara Hajian, Mohamed Megahed, and Ricardo Baeza-Yates. 2017. FA*IR: A Fair Top-k Ranking Algorithm. In Proceedings of the 2017 ACM on CIKM (Singapore, Singapore). 1569–1578.
- Zhang et al. (2016) Wei Zhang, Quan Yuan, Jiawei Han, and Jianyong Wang. 2016. Collaborative Multi-Level Embedding Learning from Reviews for Rating Prediction. In IJCAI.
- Zhang and Chen (2020) Yongfeng Zhang and Xu Chen. 2020. Explainable Recommendation: A Survey and New Perspectives. Foundations and Trends® in Information Retrieval 14, 1 (2020), 1–101. https://doi.org/10.1561/1500000066
- Zhang et al. (2014) Yongfeng Zhang, Guokun Lai, Min Zhang, Yi Zhang, Yiqun Liu, and Shaoping Ma. 2014. Explicit Factor Models for Explainable Recommendation Based on Phrase-level Sentiment Analysis. In ACM SIGIR (Gold Coast, Queensland, Australia).
- Zhao et al. (2017) Jieyu Zhao, Tianlu Wang, Mark Yatskar, Vicente Ordonez, and Kai-Wei Chang. 2017. Men Also Like Shopping: Reducing Gender Bias Amplification using Corpus-level Constraints. In EMNLP.