Predicting Mortality Risk in Viral and Unspecified Pneumonia to Assist Clinicians with COVID-19 ECMO Planning
Abstract
Respiratory complications due to coronavirus disease COVID-19 have claimed tens of thousands of lives in 2020. Many cases of COVID-19 escalate from Severe Acute Respiratory Syndrome (SARS-CoV-2) to viral pneumonia to acute respiratory distress syndrome (ARDS) to death. Extracorporeal membranous oxygenation (ECMO) is a life-sustaining oxygenation and ventilation therapy that may be used for patients with severe ARDS when mechanical ventilation is insufficient to sustain life. While early planning and surgical cannulation for ECMO can increase survival, clinicians report the lack of a risk score hinders these efforts. In this work, we leverage machine learning techniques to develop the PEER score, used to highlight critically ill patients with viral or unspecified pneumonia at high risk of mortality or decompensation in a subpopulation eligible for ECMO. The PEER score is validated on two large, publicly available critical care databases and predicts mortality at least as well as other existing risk scores. Stratifying our cohorts into low-risk and high-risk groups, we find that the high-risk group also has a higher proportion of decompensation indicators such as vasopressor and ventilator use. Finally, the PEER score is provided in the form of a nomogram for direct calculation of patient risk, and can be used to highlight at-risk patients among critical care patients eligible for ECMO.
1 Introduction
Coronavirus disease COVID-19 has spread globally, resulting in millions of infections. Many cases of COVID-19 progress from Severe Acute Respiratory Syndrome (SARS-CoV-2) to viral pneumonia to acute respiratory distress syndrome (ARDS) to death. Extracorporeal membrane oxygenation (ECMO) can temporarily sustain patients with severe ARDS to bridge periods of time when oxygenation via the lungs cannot be achieved via mechanical ventilation. However, ECMO is expensive and applicable only for patients healthy enough to recover and return to a high functional status. While ECMO is more effective when planned in advance (Combes et al., 2018), applicable risk scores remain unavailable (Liang et al., 2020; American College of Cardiology, 2020).
This paper introduces the Viral or Unspecified Pneumonia ECMO-Eligible Risk Score, or PEER score for short. This risk score focuses on a critical care population eligible for ECMO and uses measurements acquired at the time of would-be planning—early in the critical care stay. While other pneumonia-based risk scores exist (Fine et al., 1997; Marti et al., 2012; Charles et al., 2008; Lim et al., 2003a), our PEER score specifically addresses risks associated with viral or unspecified pneumonia in the critical care setting and the cohort potentially eligible for ECMO. Inclusion of unspecified pneumonia broadens the population studied, and is chosen because the infectious etiology of pneumonia often cannot be determined.
Though limited by geographic availability, ECMO usage has increased 4-fold in the last decade (Ramanathan et al., 2020). COVID-19 guidelines suggest ECMO as a late option in the escalation of care in severe ARDS secondary to SARS-CoV-2 infection (Liang et al., 2020; Alhazzani et al., 2020). However, early evidence from epidemiological studies of coronavirus (Wang et al., 2020; Yang et al., 2020; Zhou et al., 2020) has been insufficient to establish ECMO’s utility. A pooled analysis of four studies (Henry, 2020) showed mortality rates of 95% with the use of ECMO vs. 70% without, but the number of patients receiving ECMO was small, and none of these studies were controlled nor did they specify indications for ECMO.
In this paper, to better understand the role of ECMO as a rescue for ventilation non-responsive, SARS-CoV-2 ARDS, we study risk of death in ARDS among ECMO-eligible patients. Treatment guidelines for ARDS suggest ECMO use in severe ARDS alongside other advanced ventilation strategies (Matthay et al., 2020). World Health Organization interim guidance also suggests ECMO for ARDS (World Health Organization et al., 2020), citing effectiveness in ARDS and mortality reductions in Middle East Respiratory Syndrome (MERS). Despite these recommendations and the resources allocated to ECMO for these situations (Ramanathan et al., 2020), risk scores tailored to ECMO consideration are lacking. Our study addresses this need by drawing from viral and source unidentified cases of pneumonia that escalate to critical care admissions, guided by the intuition that ARDS associated with these pneumonia are expected to better resemble COVID-19 ARDS than all-comer ARDS.
We develop and evaluate a risk score for critical care patients with viral or unspecified pneumonia and who are eligible for ECMO. Our risk score is validated on two large, publicly available critical care databases and predicts mortality at least as well as other existing risk scores. We stratify our cohorts into low-risk and high-risk groups, and find that the high-risk group also has a higher proportion of decompensation indicators such as vasopressor and ventilator use. Finally, we provide the risk score in the form of a nomogram for direct calculation of patient risk. We provide this risk score as an assistive tool to highlight at-risk patients among critical care patients eligible for ECMO.
Related Work
There are a number of pneumonia (Lim et al., 2003b; Fine et al., 1997; Charles et al., 2008; Lim et al., 2003a; Guo et al., 2019), COVID-19 (Gong et al., 2020b; Jiang et al., 2020; Gong et al., 2020a), hospitalization mortality (Zimmerman et al., 2006), and ECMO risk scores (Schmidt et al., 2015), but none are focused around the time of risk evaluation for ECMO candidacy. The pneumonia and COVID-19 risk scores are assessed on populations with lower acuity, while APACHE is not focused on patients with respiratory illness. Our risk score focuses at the stage of ECMO planning rather than among patients already receiving ECMO.
Registry-based studies have also considered expected mortality variation in SARS-CoV-2 compared to that of other viral infections, including MERS, H1N1 flu, and seasonal flu. One MERS-related ARDS study of critically ill patients demonstrated a higher mortality rate than those in studies on COVID-related ARDS, but may be attributed to more severely ill patients at enrollment (Arabi et al., 2017). A similar study of H1N1 reported lower mortality rates (12-17%), albeit considering a younger population with average age of 40 (Aokage et al., 2015).
Physiologic concerns have also been raised about the use of ECMO for SARS-CoV-2. While ECMO is primarily beneficial for respiratory recovery, some argue that a spike in all-cause death but not ARDS-related death could indicate a limited role of ECMO (Henry and Lippi, 2020). In addition, COVID-associated lymphopenia might be exacerbated by ECMO-induced lymphopenia which could mechanistically affect a healthy immune response to infection. Inflammatory cytokines and specifically interleukin 6 elevation is associated with COVID-19 mortality and rises with the use of ECMO (Henry, 2020; Bizzarro et al., 2011). These expert voices do not argue for the avoidance of ECMO, but rather call for additional study.
2 Data
The eICU Collaborative Research Database (Pollard et al., 2018) contains data for 200,859 admissions to intensive care units (ICU) across multiple centers in the United States between 2014 and 2015. The MIMIC-III clinical database (Johnson et al., 2016) consists of data from 46,476 patients who stayed in critical care units of the Beth Israel Deaconess Medical Center between 2001 and 2012. Our analysis and model development is done primarily using data derived from eICU, and externally validated on data derived from MIMIC-III.
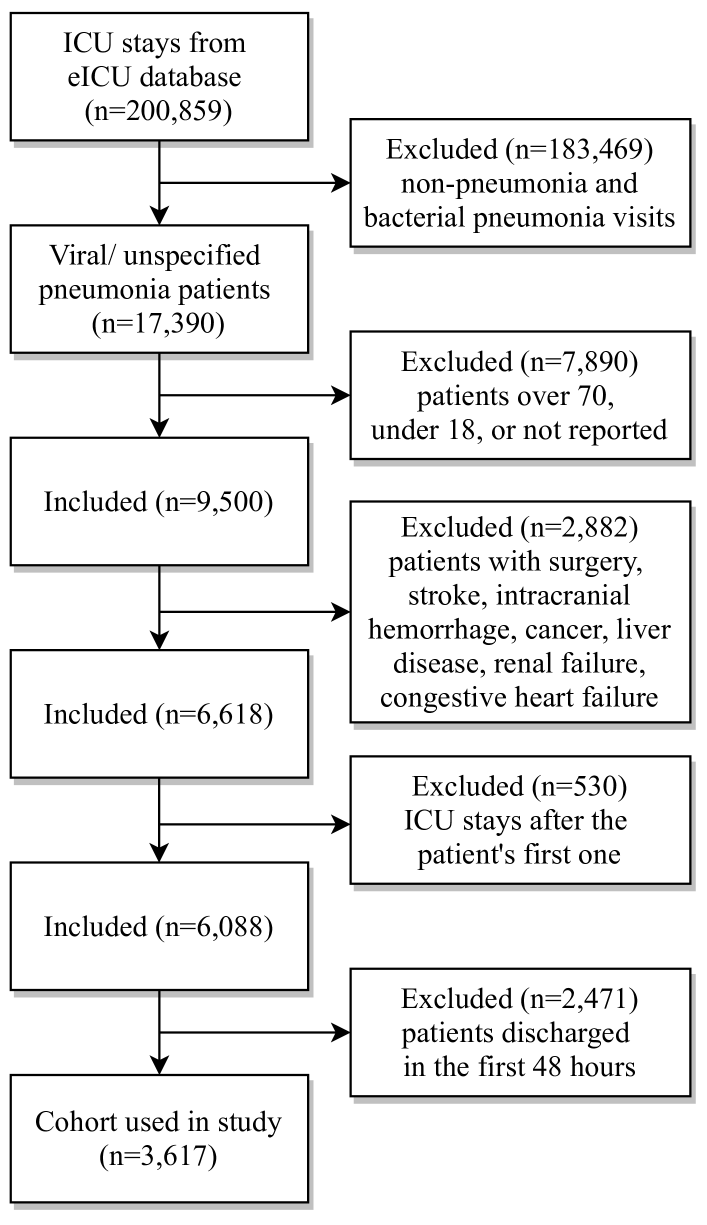
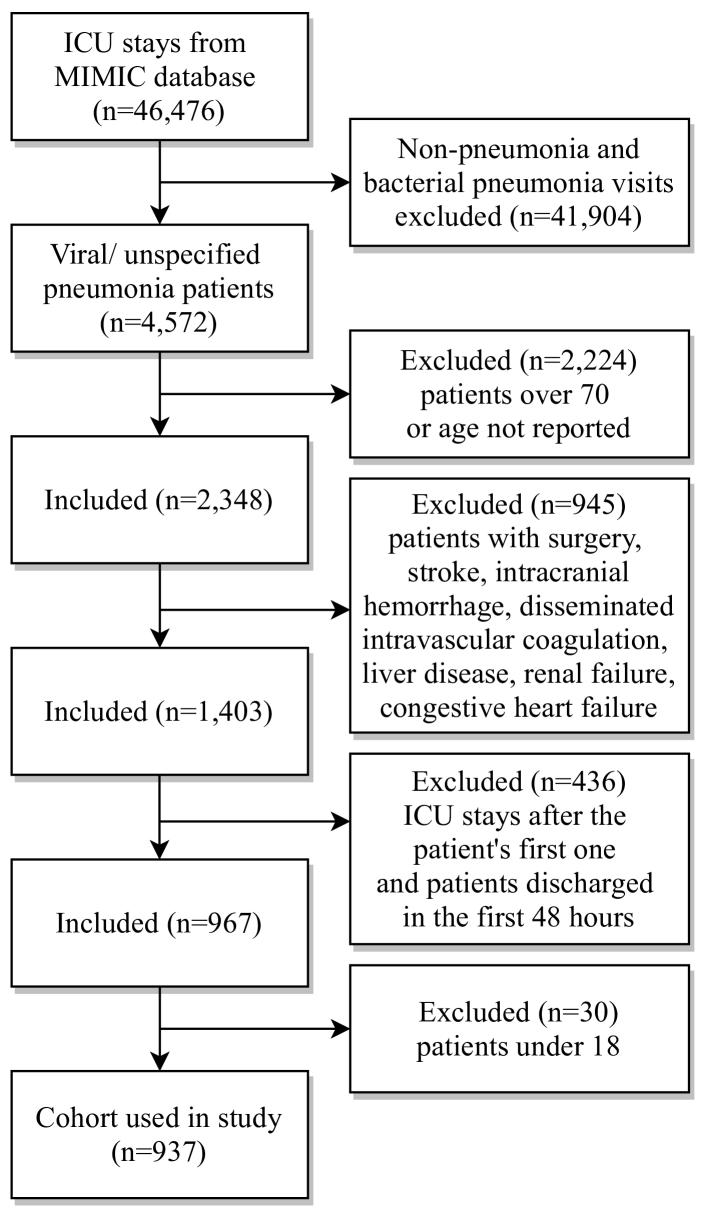
Cohort Selection Data for the study cohort were extracted according to the inclusion and exclusion criteria summarized in Figure 2.1. Our population of interest is patients with viral or otherwise unspecified non-bacterial, non-fungal, non-parasitic, and non-genetic pneumonia. While there are no absolute contraindications of ECMO, the therapy is reserved for patients likely to have functional recovery. Thus, patients over 70 years old were excluded since they would not be good candidates for ECMO, and patients under 18 were excluded because SARS-CoV-2 pneumonia progressing to hypoxic respiratory failure is exceedingly rare in this age group. Other relative contraindications to ECMO include stroke, intracranial hemorrhage, disseminated intravascular coagulation, cancer, liver disease, renal failure, patients undergoing surgery, and congestive heart failure. Over the course of each patient’s hospital stay, the first ICU stay was analyzed. Patients who died or were discharged within the first 48 hours of being admitted were excluded to focus on the stage of critical care after initial entry when lower-risk oxygen supplementation strategies (e.g., ventilation) are being performed, and, methodologically, to provide a richer set of features for prediction. Table 1 summarizes demographics and outcomes of the cohorts.
| Variable | eICU (n = 3617) | MIMIC (n = 937) |
|---|---|---|
| Demographics | ||
| Age, years | 58.0 (48.0-64.0) | 54.5 (44.1-62.7) |
| Age range, years | ||
| 18-30 | 225 (6.2%) | 83 (8.9%) |
| 30-39 | 277 (7.7%) | 94 (10.0%) |
| 40-49 | 500 (13.8%) | 159 (17.0%) |
| 50-59 | 1064 (29.4%) | 281 (30.0%) |
| 60-70 | 1546 (42.7%) | 320 (34.2%) |
| Gender | ||
| Male | 1949 (53.9%) | 542 (57.8%) |
| Female | 1663 (46.0%) | 395 (42.2%) |
| Physical exam findings | ||
| Orientation | ||
| oriented | 1121 (31.0%) | 411 (43.9%) |
| confused | 1287 (35.6%) | 76 (8.1%) |
| Temperature (°C) | 36.9 (36.6-37.3) | 37.2 (36.6-37.7) |
| Heart rate (beats per minute) | 89.0 (77.0-101.0) | 90.0 (78.0-104.0) |
| Respiratory rate (breaths per minute) | 20.0 (17.0-25.0) | 20.0 (16.0-25.0) |
| Systolic blood pressure (mmHg) | 120.0 (106.0-136.0) | 118.0 (104.0-134.0) |
| Diastolic blood pressure (mmHg) | 66.0 (57.0-76.0) | 63.0 (54.0-72.0) |
| Mean arterial pressure (mmHg) | 81.0 (72.0-93.0) | 79.0 (71.0-90.0) |
| Glasgow Coma Scale | 14.0 (10.0-15.0) | 14.0 (9.0-15.0) |
| Laboratory findings | ||
| Hemotology | ||
| Red blood cells (millions/L) | 3.5 (3.0-4.0) | 3.4 (3.0-3.8) |
| White blood cells (thousands/L) | 11.0 (7.9-15.6) | 11.0 (8.0-15.1) |
| Platelets (thousands/L) | 193.0 (136.0-261.0) | 199.0 (128.8-276.0) |
| Hematocrit (%) | 31.1 (27.2-35.6) | 30.2 (27.0-33.6) |
| Red blood cell dist. width (%) | 15.2 (14.0-16.8) | 14.8 (13.8-16.4) |
| Mean corpuscular volume (fL) | 90.4 (86.0-95.0) | 89.0 (85.0-93.0) |
| Mean corpuscular hemoglobin/ MCH (pg) | 29.7 (27.9-31.2) | 30.2 (28.7-31.6) |
| MCH concentration (g/dL) | 32.7 (31.7-33.6) | 33.8 (32.8-34.8) |
| Neutrophils (%) | 82.0 (73.3-89.0) | 82.3 (73.8-88.5) |
| Lymphocytes (%) | 8.4 (5.0-14.0) | 9.5 (5.8-15.7) |
| Monocytes (%) | 6.0 (3.7-8.6) | 4.0 (2.7-5.9) |
| Eosinophils (%) | 0.1 (0.0-1.0) | 0.4 (0.0-1.2) |
| Basophils (%) | 0.0 (0.0-0.3) | 0.1 (0.0-0.3) |
| Band cells (%) | 8.0 (3.0-17.0) | 0.0 (0.0-5.0) |
| Chemistry | ||
| Sodium (mmol/L) | 139.0 (136.0-142.0) | 139.0 (136.0-142.0) |
| Potassium (mmol/L) | 3.9 (3.6-4.3) | 3.9 (3.6-4.3) |
| Chloride (mmol/L) | 105.0 (101.0-109.0) | 105.0 (101.0-109.0) |
| Bicarbonate (mmol/L) | 25.0 (22.0-28.0) | 26.0 (23.0-29.0) |
| Blood urea nitrogen (mg/dL) | 19.0 (12.0-33.0) | 17.0 (11.0-28.0) |
| Creatinine (mg/dL) | 0.8 (0.6-1.4) | 0.8 (0.6-1.3) |
| Glucose (mg/dL) | 131.0 (105.0-165.0) | 124.0 (104.5-151.5) |
| Aspartate aminotransferase (units/L) | 30.0 (19.0-57.0) | 37.0 (22.0-70.0) |
| Alanine aminotransferase (units/L) | 27.0 (16.0-47.0) | 28.0 (18.0-52.0) |
| Alkaline phosphatase (units/L) | 84.0 (62.0-117.0) | 85.0 (62.0-121.0) |
| C-reactive protein (mg/L) | 19.6 (8.8-42.2) | 35.9 (8.3-98.8) |
| Direct bilirubin (mg/L) | 0.2 (0.1-0.5) | 0.6 (0.2-2.2) |
| Total bilirubin (mg/L) | 0.5 (0.3-0.8) | 0.6 (0.4-1.1) |
| Total protein (g/dL) | 6.0 (5.3-6.7) | 6.1 (5.3-7.0) |
| Calcium (mg/dL) | 8.2 (7.7-8.6) | 8.2 (7.8-8.6) |
| Albumin (g/dL) | 2.6 (2.2-3.1) | 3.0 (2.6-3.5) |
| Troponin (ng/mL) | 0.1 (0.0-0.2) | 0.0 (0.0-0.3) |
| Coagulation | ||
| Prothrombin time (sec) | 14.5 (12.7-16.7) | 13.9 (13.0-15.3) |
| Partial thromboplastin time (sec) | 33.0 (28.5-41.0) | 30.2 (26.6-36.9) |
| Blood gas | ||
| pH | 7.39 (7.33-7.43) | 7.41 (7.36-7.45) |
| Partial pressure of oxygen (mmHg) | 83.0 (68.0-111.0) | 97.0 (73.5-127.5) |
| Arterial oxygen saturation (mmHg) | 96.0 (94.0-99.0) | 97.0 (95.0-98.0) |
| Outcomes | ||
| Deceased | 270 (7.5%) | 94 (10.0%) |
| Vasopressors administered | 589 (16.3%) | 389 (41.5%) |
| Ventilator used | 1835 (50.7%) | 758 (80.9%) |
Data Extraction The eICU and MIMIC cohorts were extracted using string matching on diagnosis codes and subsequent clinician review of the descriptors (provided in Appendix A). Features were manually merged from several tables into their corresponding elements based on a process of visualization, query, and physician review. This involved harmonizing feature units (e.g. Farenheit to Celsius), removing impossible values (e.g. negative blood pressures), and merging redundant data fields (e.g., filling in the sum of the individual Motor, Verbal, and Eye Opening Score fields for the Glasgow Coma Score Total when it was missing). We provide additional feature and outcome extraction details in Appendix B.
All features were combined into a fixed-length vector, using the most recent value prior to 48 hours after ICU admission. Before imputation, approximately half of the features had missingness below 5%, and 80% of the features had missingness below 30%, however several variables have high missingness (Appendix C). Missing values were imputed using MissForest (Stekhoven and Bühlmann, 2011) and our model was not sensitive to MissForest imputation (Appendix F).
Features Features were extracted from demographics, comorbidities, vitals, physical exam findings, and laboratory findings routinely collected in critical care settings. Numerical features were normalized, and categorical features were converted into binary features (one less than the number of categories). The 52 features provided to the model are listed in Appendix B.
Outcomes Our primary outcome of interest is in-ICU mortality. Secondary outcomes indicating decompensation include (1) vasopressor use and (2) mechanical ventilation use. For each outcome, we define the time to event as the time to first outcome or censorship, where censorship corresponds to discharge from the ICU. For details, see Appendix B.
3 Methods
Lasso-Cox To predict patients’ survival time, we use the Cox proportional hazards model (Cox, 1972) with L1 regularization, referred to as Lasso-Cox (Simon et al., 2011). We choose Lasso-Cox for its ease of interpretation and calculation, owing to its selection of sparse models.***We also tried the Cox model with elastic-net regularization (combined L1 and L2 regularization) but found little to no gain in concordance. In particular, for a patient with covariates , the predicted log hazard of the patient is (higher log hazard is associated with shorter survival time), where is the vector of Cox regression coefficients that can be interpreted as log hazard ratios. During model fitting, L1 regularization is used to encourage only a few features to have nonzero value, where is a user-specified hyperparameter.
Evaluation Metrics To evaluate model performance, we consider concordance and calibration. Concordance (c-index) is a common measure of goodness-of-fit in survival models (Harrell and et al., 1982), defined as the fraction of pairs of subjects whose survival times are correctly ordered by a prediction algorithm, among all pairs that can be ordered.
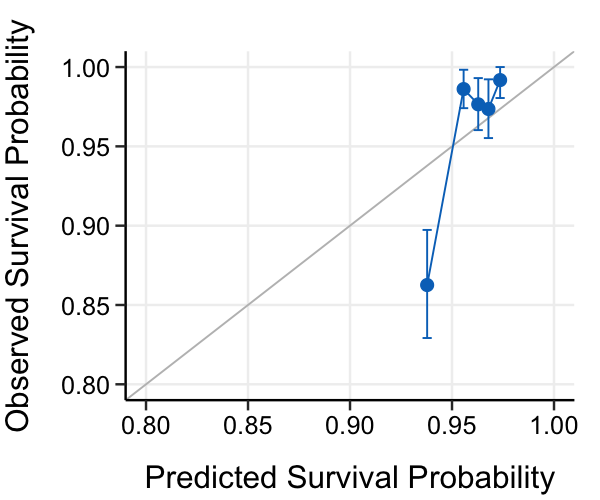
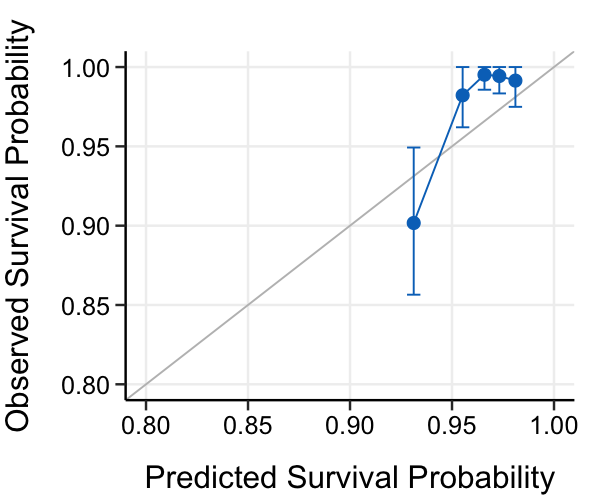
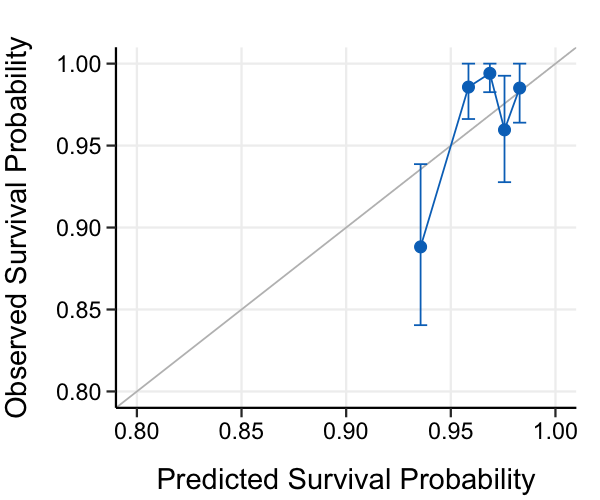
To compute concordance confidence intervals we use 1000 bootstrapped replicates, each the size of the dataset and sampled with replacement. Calibration is evaluated by plotting the Kaplan-Meier observed survival probability versus the predicted survival probability. Using the R package hdnom (Xiao et al., 2016), we construct our calibration plots (Figure 4.2) with 1000 bootstrap resamplings for internal calibration, using groups and a prediction time of days.
Experimental Setup We divided the eICU cohort into a training set (70% of the data, n=2537) and test set (30%, n=1080). The eICU training set is used for model selection and analysis, whereas the eICU test set and entirety of the MIMIC cohort are used for model evaluation. Throughout our analysis, we compare our risk score (PEER) to three pneumonia risk scores: CURB-65 (Lim et al., 2003b), PSI/PORT (Fine et al., 1997), and SMART-COP (Charles et al., 2008); and one COVID-19 risk score: GOQ (Gong et al., 2020b).
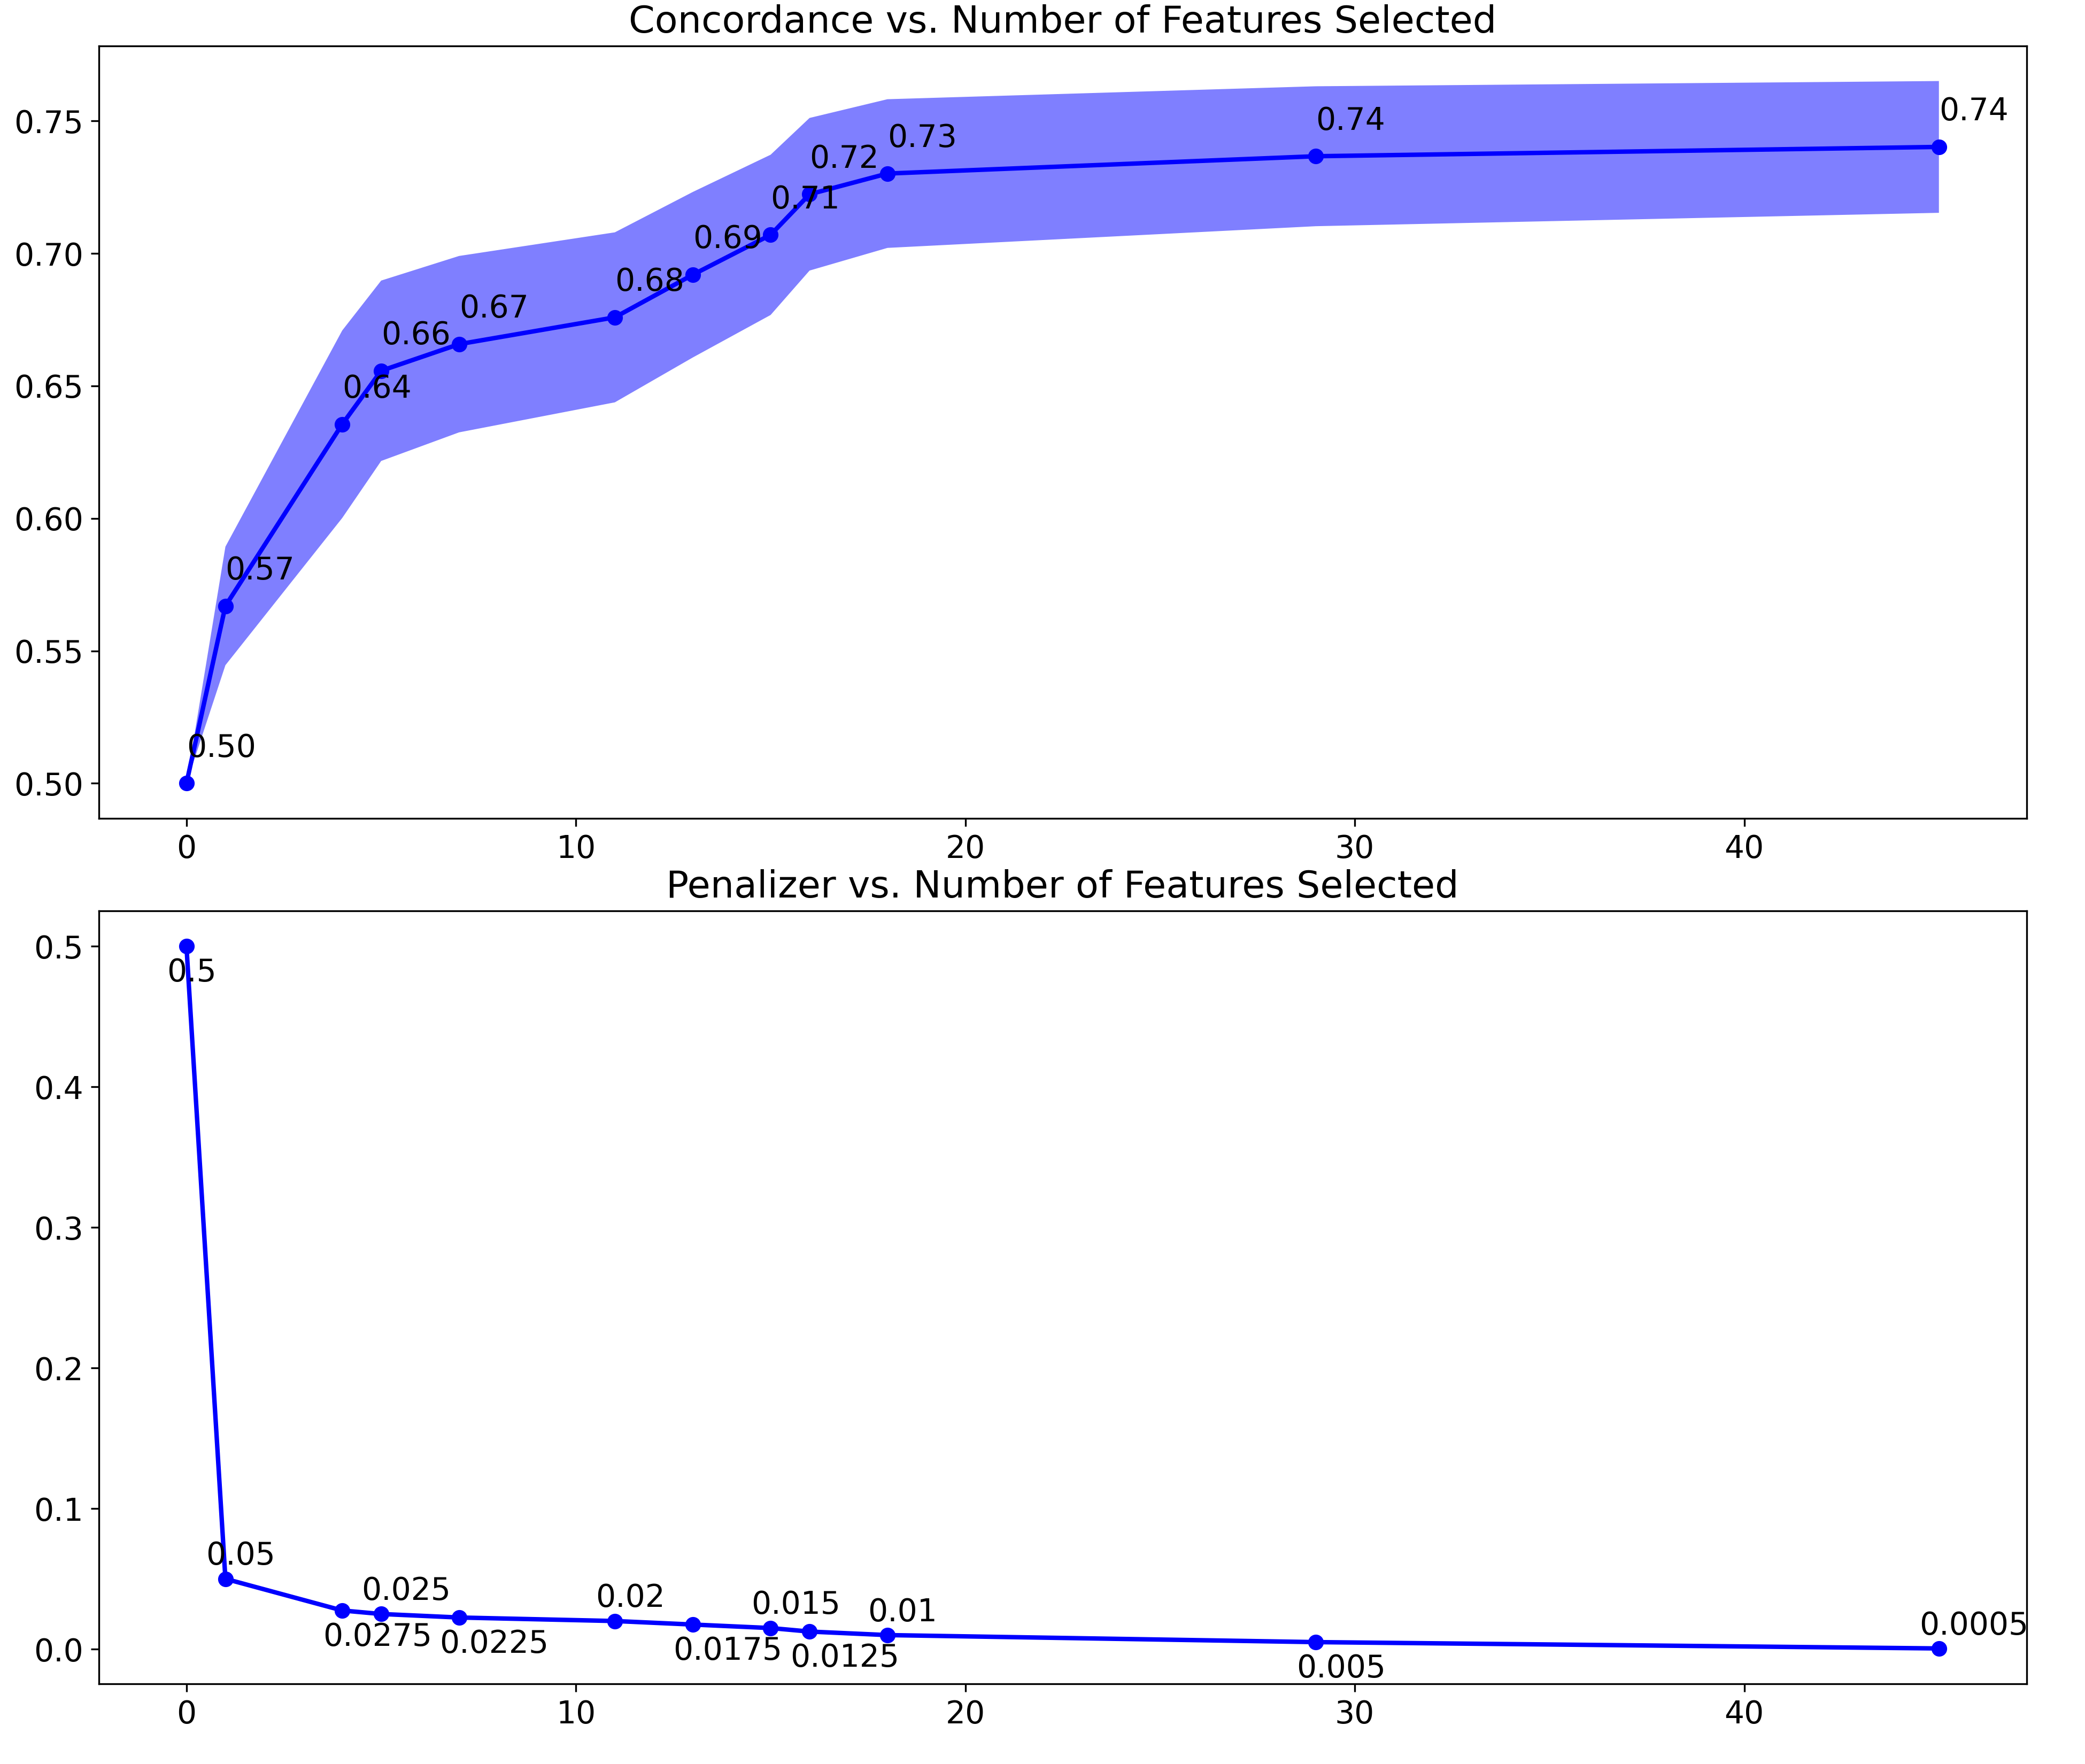
Model selection We select via 10-fold cross validation and grid search on the eICU training set to maximize concordance subject to sufficient sparsity. We observe that gives the best trade-off between concordance () and number of features selected (), as a increase in concordance corresponds to 10 additional non-zero features. To check the stability of this hyperparameter choice, we imputed our data using ten random seeds and ran 10-fold cross validation on the resulting datasets. Across all runs, achieved concordance of approximately and selected similar features and coefficients. Additional details about grid search, the concordance and sparsity tradeoff, and robust selection of coefficients can be found in Appendix D, Appendix Figure F.1, and Appendix Figure F.2.
Code for data extraction and all model results is available at https://github.com/hlzhou/peer-score.
4 Results
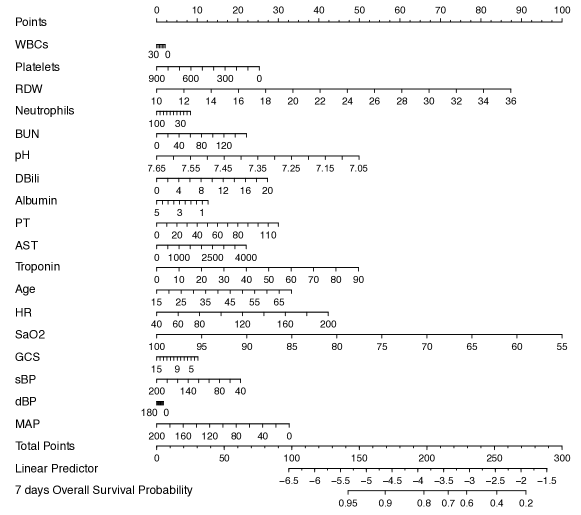
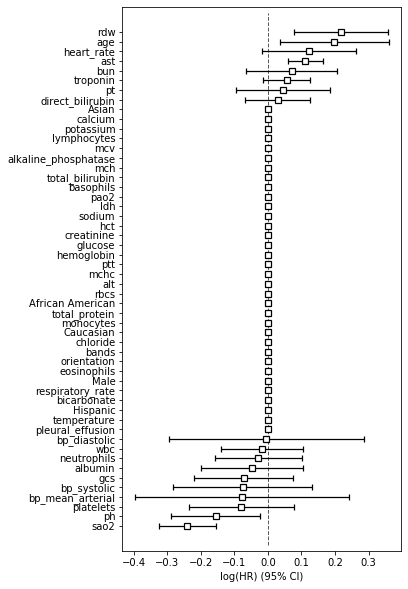
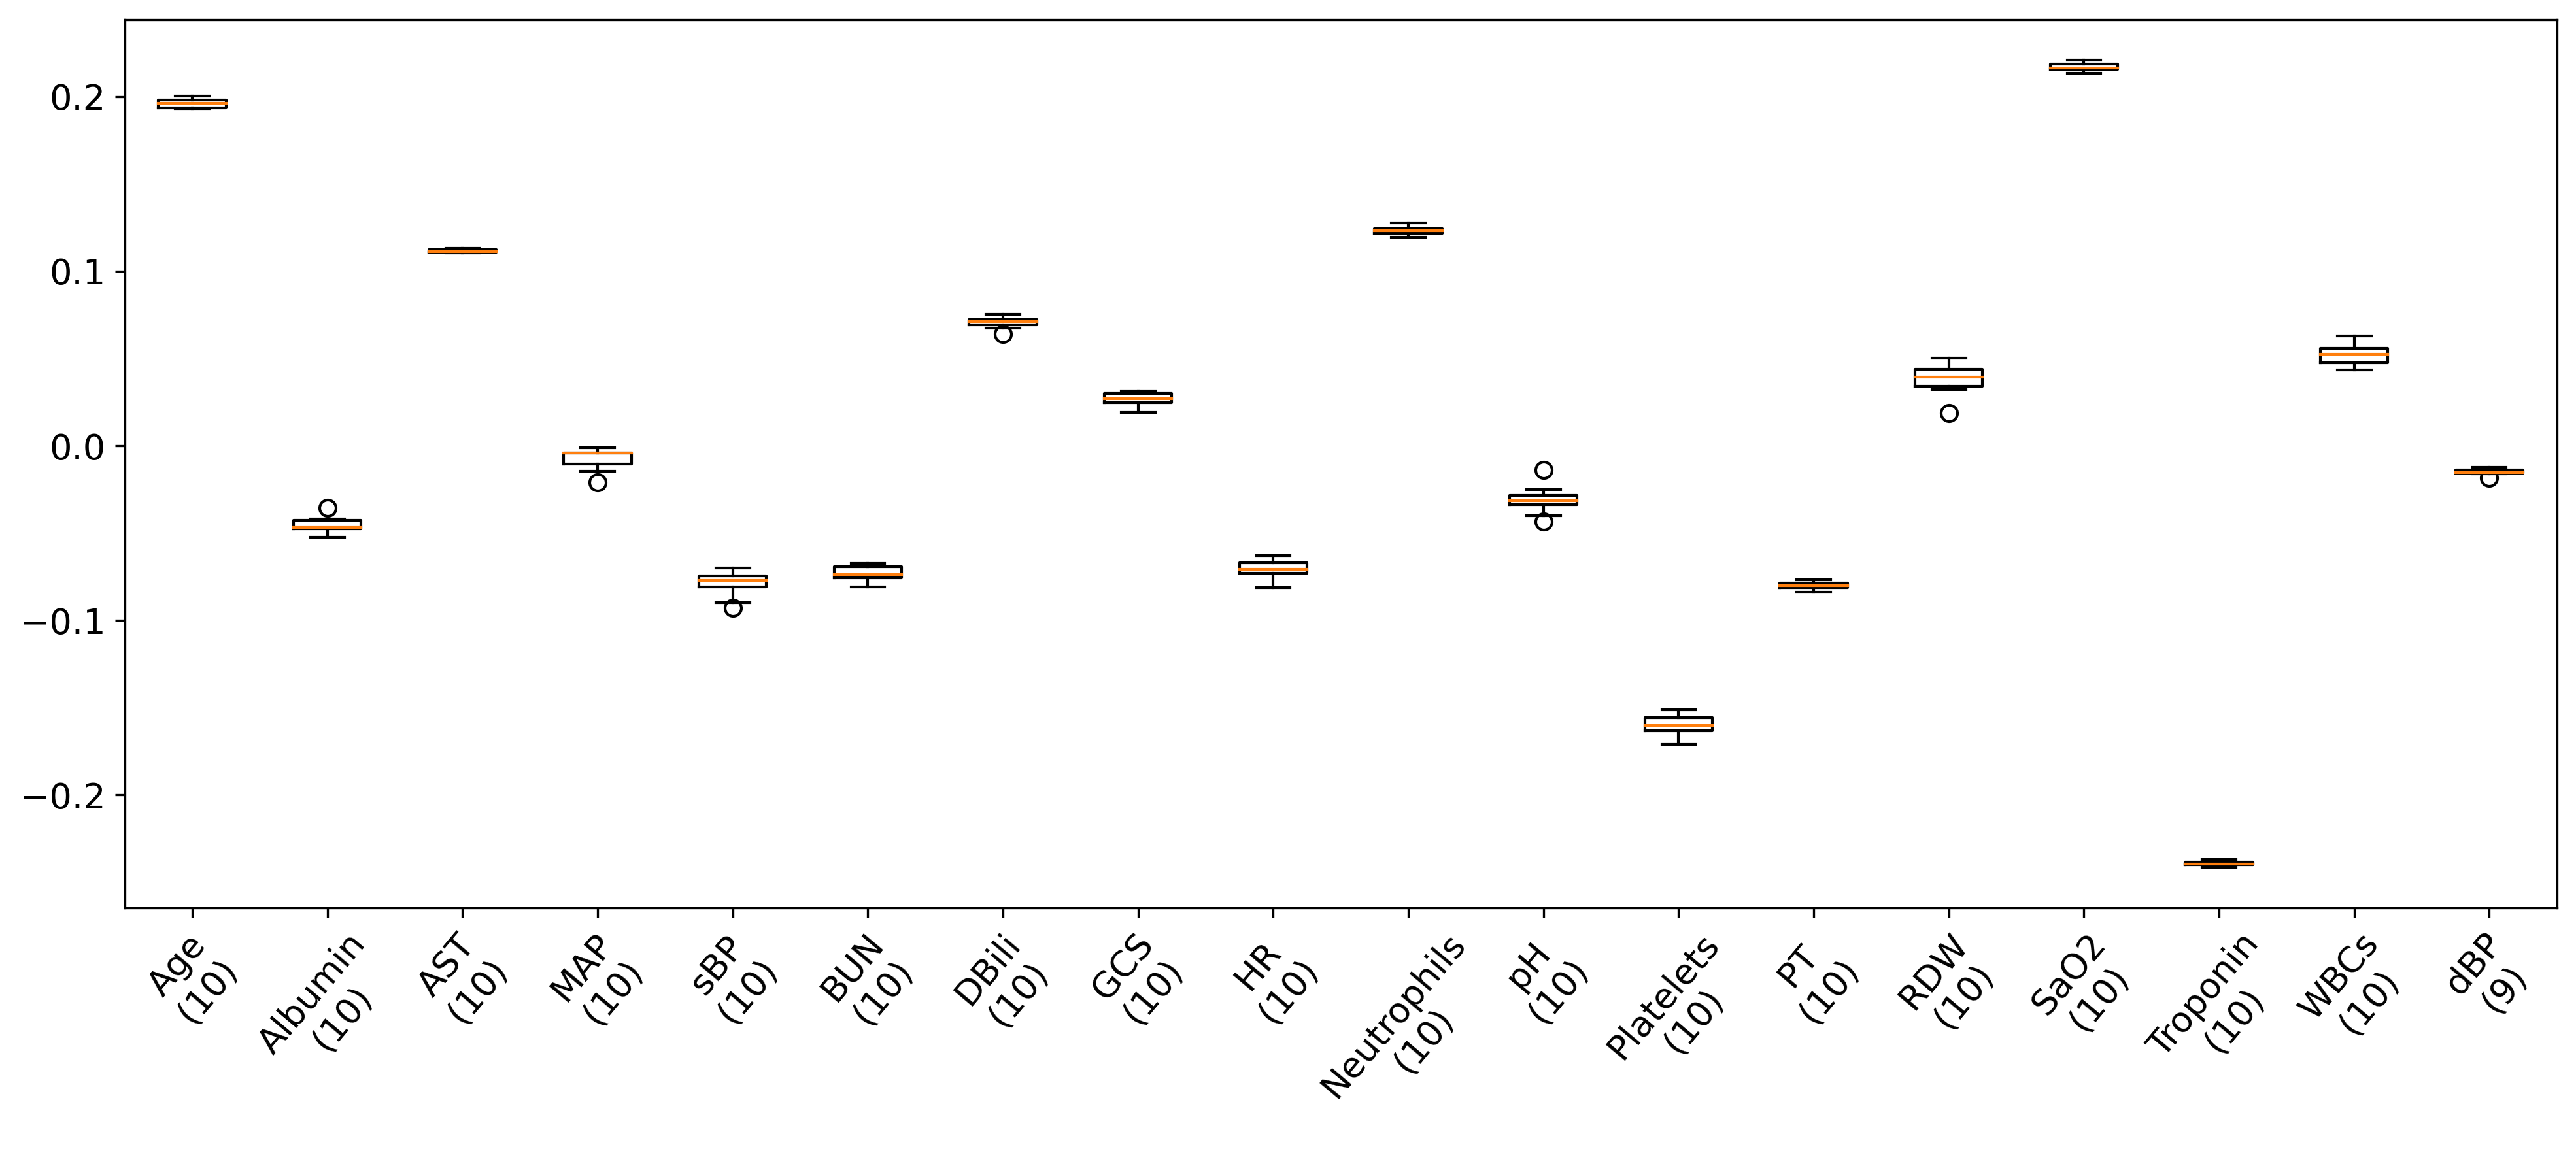
As explained in Section 3, model selection yielded a L1-regularized Cox model with . The learned hazard ratios, i.e. the PEER score, for normalized data are displayed in Table 2 and as a boxplot in Appendix Figure E.1. For reference, Appendix E contains the standard deviation and mean of each feature in the model. To assist with easy risk score calculation, we also provide a nomogram (Xiao et al., 2016) in Figure 4.1†††To use this nomogram, look up a patient’s original (pre-normalization) values, match it to a number of points listed across the top, and look up the sum of that patient’s points in the scale across the bottom..
| Feature | HR (95% CI) |
|---|---|
| Age (years) | 1.22 (1.04 – 1.43) |
| Heart rate (beats per minute) | 1.13 (0.984 – 1.3) |
| Systolic blood pressure (mmHg) | 0.928 (0.755 – 1.14) |
| Diastolic blood pressure (mmHg) | 0.996 (0.745 – 1.33) |
| Mean arterial pressure (mmHg) | 0.926 (0.673 – 1.27) |
| Glasgow Coma Scale | 0.93 (0.803 – 1.08) |
| White blood cells (thousands/L) | 0.984 (0.871 – 1.11) |
| Platelets (thousands/L) | 0.924 (0.79 – 1.08) |
| Red blood cell dist. width (%) | 1.24 (1.08 – 1.43) |
| Neutrophils (%) | 0.972 (0.853 – 1.11) |
| Blood urea nitrogen (mg/dL) | 1.07 (0.937 – 1.23) |
| Aspartate aminotransferase (units/L) | 1.12 (1.06 – 1.18) |
| Direct bilirubin (mg/L) | 1.03 (0.935 – 1.13) |
| Albumin (g/dL) | 0.954 (0.82 – 1.11) |
| Troponin (ng/mL) | 1.06 (0.985 – 1.14) |
| Prothrombin time (sec) | 1.05 (0.909 – 1.2) |
| pH | 0.856 (0.75 – 0.977) |
| Arterial oxygen saturation (mmHg) | 0.787 (0.723 – 0.856) |
| Score | Train eICU | Test eICU | MIMIC |
|---|---|---|---|
| concordance | concordance | concordance | |
| PEER (ours) | 0.77 (0.72 - 0.81) | 0.77 (0.69 - 0.83) | 0.66 (0.57 - 0.74) |
| CURB-65 (Lim et al., 2003b) | 0.66 (0.61 - 0.70) | 0.62 (0.55 - 0.69) | 0.59 (0.52 - 0.66) |
| PSI/PORT (Fine et al., 1997) | 0.71 (0.66 - 0.76) | 0.71 (0.63 - 0.78) | 0.62 (0.55 - 0.69) |
| SMART-COP (Charles et al., 2008) | 0.69 (0.64 - 0.73) | 0.73 (0.67 - 0.80) | 0.66 (0.59 - 0.72) |
| GOQ (Gong et al., 2020b) | 0.67 (0.63 - 0.71) | 0.62 (0.54 - 0.70) | 0.58 (0.50 - 0.66) |
To evaluate discriminative ability, we use concordance. On both the eICU and MIMIC datasets, our Lasso-Cox model (which we name the PEER score) achieves concordance greater than or comparable to that of existing risk scores (Table 3). On the eICU test set, the PEER score achieves the highest concordance among the risk scores, , with the second highest, , attained by SMART-COP. On the MIMIC dataset, PEER and SMART-COP again achieve the highest concordances, but concordance degrades to for both scores. One possible reason for this degradation is that arterial oxygen saturation (SaO2) is a significant feature and only of these values are missing in eICU, but in MIMIC of these values are missing (Appendix C).
From the PEER score calibration curves (Figure 4.2), we see one high risk group separate from the other low risk groups. While predicted survival probability of the high risk group is overestimated in the training set, it is estimated within confidence intervals in both test sets.
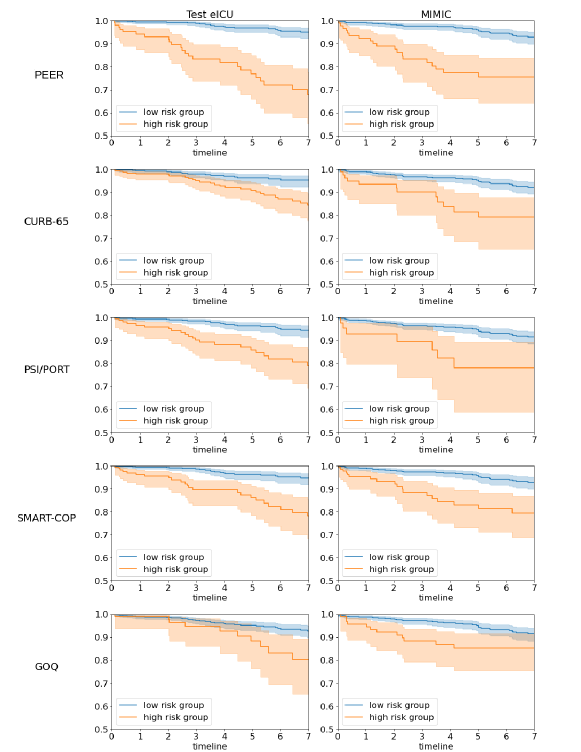
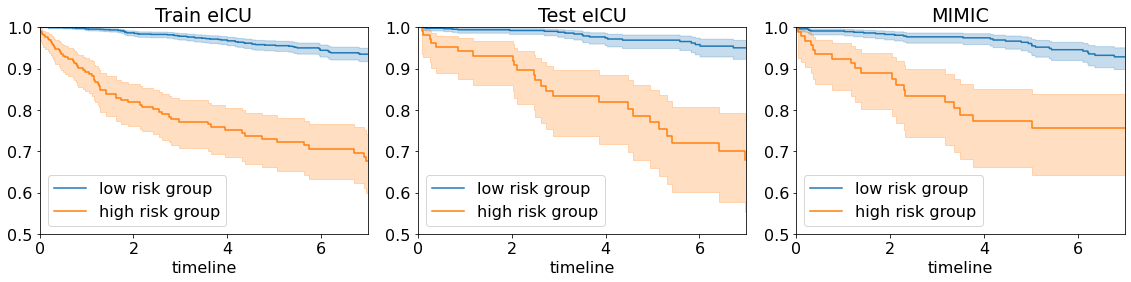
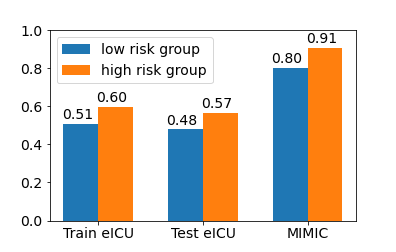
To compare low-risk and high-risk populations (as defined by our model), we set a threshold at the 90th percentile of the predicted risk value from the training set. We find that over a 7 day time period, the Kaplan-Meier survival curves for the high and low risk subpopulations are clearly distinct Figure 4.3) (Davidson-Pilon et al., 2020). At 7 days, the high risk and low risk groups in the eICU test set have survival proportions and , respectively. The gap is smaller in MIMIC with survival probabilities of and , respectively. In each case, the difference in survival is larger for the PEER score than for other risk scores (Appendix Figure G.1, with stratification details in Appendix G).
In addition to mortality, decompensation can be indicated by vasopressor and ventilator use. As expected, vasopressors and ventilators are more commonly used in the high risk group (Figure 4.4).

5 Discussion
Our PEER score achieves greater or comparable concordance to baselines on the eICU (in-domain) and MIMIC (out-of-domain) test sets. The Lasso-Cox model selects 18 features, making it easy to calculate. We find that lower SaO2, which is associated with poorer oxygenation status, is predictive of decompensation. As expected, we also find that old age is predictive of death. Red blood cell distribution width, associated with expanded release of immature red blood cells as a response to insufficient oxygen delivery to tissues, is also a strong risk factor for death in patients with COVID-19 (Gong et al., 2020a). Three variables (pH, prothrombin time, and age) violate the proportional hazards assumption of the Cox model, and Lasso-Cox models shrink coefficients towards , so the hazard ratios themselves should be interpreted with caution.
Stratifying each cohort into low risk and high risk subpopulations based the PEER score, there is a clear separation in their survival curves (Figure 4.3) across all three datasets, with the low risk group observing a survival of 0.9 or greater after 7 days and the high risk group observing a survival of 0.75 or less. The mortality-based high risk groups also are associated with our proximate indicators of decompensation: vasopressor and ventilator use (Figure 4.4). Compared to the survival curves for low and high risk subpopulations derived from other risk scores, the survival curves from the PEER score are the most distinctly separated (Appendix G Figure G.1).
Calibration plots for the PEER score also show a high risk group clearly separated from the rest (Figure 4.2). While the survival probability of the high risk group is overestimated in the training set, it is within error bars in the test set.
For ECMO allocation, practically, accurate ranking of risk, as measured by concordance, may be more important than the probabilities predicted. While the PEER score outperformed other risk scores in the eICU test set, there was a decline in performance on the MIMIC test set, and the performance of the PEER score was comparable to that of SMART-COP. We also note that in MIMIC, arterial oxygen saturation (SaO2) has missingness yet is an important feature of the PEER score. In contrast, it has missingness in eICU. This demonstrates the importance of thinking critically about how our risk score, which was trained on the eICU cohort and depends on specific features, generalizes to the population to which the score is being applied.
Limitations and Future Work Importantly our cohort is defined not by COVID-19 positive pneumonia patients but instead by viral or unspecified pneumonia patients who are ECMO-eligible. While our risk score demonstrates good discriminative ability and is interpretable, there are several additional decision-making considerations beyond the scope of this paper. Clinicians interested in applying the risk score to COVID-19 pneumonia should consider how representative this population is of their own. Because ECMO is a constrained resource, there are also ethical questions about who should get treatment. This risk score does not attempt to address these questions, but simply provides relevant information to those making such decisions. More broadly, we hope to provide this risk score as a potential resource for future SARS-like diseases that require ECMO consideration.
References
- Alhazzani et al. [2020] W. Alhazzani, M. H. Møller, Y. M. Arabi, M. Loeb, M. N. Gong, E. Fan, S. Oczkowski, M. M. Levy, L. Derde, A. Dzierba, et al. Surviving sepsis campaign: guidelines on the management of critically ill adults with coronavirus disease 2019 (COVID-19). Intensive Care Medicine, pages 1–34, 2020.
- American College of Cardiology [2020] American College of Cardiology. ACC’s COVID-19 Hub, 2020.
- Aokage et al. [2015] T. Aokage, K. Palmér, S. Ichiba, and S. Takeda. Extracorporeal membrane oxygenation for acute respiratory distress syndrome. Journal of Intensive Care, 3(1), 2015. ISSN 20520492.
- Arabi et al. [2017] Y. M. Arabi, A. Al-Omari, Y. Mandourah, F. Al-Hameed, A. A. Sindi, B. Alraddadi, S. Shalhoub, A. Almotairi, K. Al Khatib, A. Abdulmomen, et al. Critically ill patients with the Middle East Respiratory Syndrome: a multicenter retrospective cohort study. Critical Care Medicine, 45(10):1683–1695, 2017.
- Bizzarro et al. [2011] M. J. Bizzarro, S. A. Conrad, D. A. Kaufman, P. Rycus, et al. Infections acquired during extracorporeal membrane oxygenation in neonates, children, and adults. Pediatric Critical Care Medicine, 12(3):277–281, 2011.
- Charles et al. [2008] P. G. P. Charles, R. Wolfe, M. Whitby, M. J. Fine, A. J. Fuller, R. Stirling, A. A. Wright, J. A. Ramirez, K. J. Christiansen, G. W. Waterer, et al. SMART-COP: A Tool for Predicting the Need for Intensive Respiratory or Vasopressor Support in Community-Acquired Pneumonia. Clinical Infectious Diseases, 47(3):375–384, 2008.
- Combes et al. [2018] A. Combes, A. S. Slutsky, and D. Brodie. ECMO for severe acute respiratory distress syndrome. NEJM, 378(21):1965–1975, 2018.
- Cox [1972] D. R. Cox. Regression models and life-tables. Journal of the Royal Statistical Society. Series B (Methodological), 34(2):187–220, 1972.
- Davidson-Pilon et al. [2020] C. Davidson-Pilon, J. Kalderstam, P. Zivich, et al. Lifelines: v0.24.5, May 2020.
- Fine et al. [1997] M. J. Fine, T. E. Auble, D. M. Yealy, B. H. Hanusa, L. A. Weissfeld, D. E. Singer, C. M. Coley, T. J. Marrie, and W. N. Kapoor. A prediction rule to identify low-risk patients with community-acquired pneumonia. NEJM, 336(4):243–250, 1997.
- Gong et al. [2020a] J. Gong, J. Ou, X. Qiu, Y. Jie, Y. Chen, L. Yuan, J. Cao, M. Tan, W. Xu, F. Zheng, et al. Multicenter development and validation of a novel risk nomogram for early prediction of severe 2019-novel coronavirus pneumonia. Available at SSRN 3551365, 2020a.
- Gong et al. [2020b] J. Gong, J. Ou, X. Qiu, Y. Jie, Y. Chen, L. Yuan, J. Cao, M. Tan, W. Xu, F. Zheng, et al. A tool to early predict severe 2019-novel coronavirus pneumonia (covid-19): a multicenter study using the risk nomogram in wuhan and guangdong, china. medRxiv, 2020b.
- Guo et al. [2019] L. Guo, D. Wei, Y. WU, M. Zhou, X. Zhang, Q. Li, and J. Qu. Clinical Features Predicting Mortality Risk in Patients With Viral Pneumonia: The MuLBSTA Score. Frontiers in Microbiology, 10(December):1–10, 2019. ISSN 1664302X.
- Harrell and et al. [1982] J. Harrell, Frank E. and et al. Evaluating the Yield of Medical Tests. JAMA, 247(18):2543–2546, 05 1982. ISSN 0098-7484.
- Henry [2020] B. M. Henry. COVID-19, ECMO, and lymphopenia: a word of caution. The Lancet Respiratory Medicine, 2020.
- Henry and Lippi [2020] B. M. Henry and G. Lippi. Poor survival with extracorporeal membrane oxygenation in acute respiratory distress syndrome due to coronavirus disease 2019: Pooled analysis of early reports. Journal of Critical Care, 2020.
- Jiang et al. [2020] X. Jiang, M. Coffee, A. Bari, J. Wang, X. Jiang, J. Shi, J. Dai, J. Cai, T. Zhang, Z. Wu, et al. Towards an Artificial Intelligence Framework for Data-Driven Prediction of Coronavirus Clinical Severity. Computers, Materials & Continua, 2020.
- Johnson et al. [2016] A. E. Johnson, T. J. Pollard, L. Shen, H. L. Li-wei, M. Feng, M. Ghassemi, B. Moody, P. Szolovits, L. A. Celi, and R. G. Mark. MIMIC-III, a freely accessible critical care database. Scientific Data, 3(1):160035, 2016.
- Liang et al. [2020] T. Liang et al. Handbook of COVID-19 prevention and treatment. The First Affiliated Hospital, Zhejiang University School of Medicine. Compiled According to Clinical Experience, 2020.
- Lim et al. [2003a] W. S. Lim, M. Van der Eerden, R. Laing, W. Boersma, N. Karalus, G. Town, S. Lewis, and J. Macfarlane. Defining community acquired pneumonia severity on presentation to hospital: an international derivation and validation study. Thorax, 58(5):377–382, 2003a.
- Lim et al. [2003b] W. S. Lim, M. M. Van der Eerden, R. Laing, W. G. Boersma, N. Karalus, G. I. Town, S. A. Lewis, and J. T. Macfarlane. Defining community acquired pneumonia severity on presentation to hospital: An international derivation and validation study. Thorax, 58(5):377–382, 2003b.
- Marti et al. [2012] C. Marti, N. Garin, O. Grosgurin, A. Poncet, C. Combescure, S. Carballo, and A. Perrier. Prediction of severe community-acquired pneumonia: A systematic review and meta-analysis. Critical Care, 16(4), 2012. ISSN 13648535.
- Matthay et al. [2020] M. Matthay, J. Aldrich, and J. Gotts. Treatment for severe ARDS from COVID-19. The Lancet Respiratory Medicine, 2020.
- Pollard et al. [2018] T. J. Pollard, A. E. Johnson, J. D. Raffa, L. A. Celi, R. G. Mark, and O. Badawi. The eICU collaborative research database, a freely available multi-center database for critical care research. Scientific Data, 5:1–13, 2018. ISSN 20524463.
- Ramanathan et al. [2020] K. Ramanathan, D. Antognini, A. Combes, M. Paden, B. Zakhary, M. Ogino, G. MacLaren, D. Brodie, and K. Shekar. Planning and provision of ECMO services for severe ARDS during the COVID-19 pandemic and other outbreaks of emerging infectious diseases. The Lancet Respiratory Medicine, 2020. ISSN 2213-2619.
- Schmidt et al. [2015] M. Schmidt, A. Burrell, L. Roberts, M. Bailey, J. Sheldrake, P. T. Rycus, C. Hodgson, C. Scheinkestel, D. J. Cooper, R. R. Thiagarajan, et al. Predicting survival after ECMO for refractory cardiogenic shock: The survival after veno-arterial-ECMO (SAVE)-score. European Heart Journal, 36(33):2246–2256, 2015. ISSN 15229645.
- Simon et al. [2011] N. Simon, J. Friedman, T. Hastie, and R. Tibshirani. Regularization paths for Cox’s proportional hazards model via coordinate descent. Journal of Statistical Software, 39(5):1, 2011.
- Stekhoven and Bühlmann [2011] D. J. Stekhoven and P. Bühlmann. MissForest—non-parametric missing value imputation for mixed-type data. Bioinformatics, 28(1):112–118, 10 2011. ISSN 1367-4803.
- Wang et al. [2020] D. Wang, B. Hu, C. Hu, F. Zhu, X. Liu, J. Zhang, B. Wang, H. Xiang, Z. Cheng, Y. Xiong, et al. Clinical characteristics of 138 hospitalized patients with 2019 novel coronavirus-infected pneumonia in Wuhan, China. JAMA - Journal of the American Medical Association, 323(11):1061–1069, 2020. ISSN 15383598.
- World Health Organization et al. [2020] World Health Organization et al. Clinical management of severe acute respiratory infection (sari) when COVID-19 disease is suspected: interim guidance, 13 March 2020, 2020.
- Xiao et al. [2016] N. Xiao, Q.-S. Xu, and M.-Z. Li. hdnom: Building nomograms for penalized Cox models with high-dimensional survival data. bioRxiv, 2016.
- Yang et al. [2020] X. Yang, Y. Yu, J. Xu, H. Shu, H. Liu, Y. Wu, L. Zhang, Z. Yu, M. Fang, T. Yu, et al. Clinical course and outcomes of critically ill patients with SARS-CoV-2 pneumonia in Wuhan, China: a single-centered, retrospective, observational study. The Lancet Respiratory Medicine, 2020.
- Zhou et al. [2020] F. Zhou, T. Yu, R. Du, G. Fan, Y. Liu, Z. Liu, J. Xiang, Y. Wang, B. Song, X. Gu, et al. Clinical course and risk factors for mortality of adult inpatients with COVID-19 in Wuhan, China: a retrospective cohort study. The Lancet, 2020.
- Zimmerman et al. [2006] J. E. Zimmerman, A. A. Kramer, D. S. McNair, and F. M. Malila. Acute physiology and chronic health evaluation (apache) iv: hospital mortality assessment for today’s critically ill patients. Critical Care Medicine, 34(5):1297–1310, 2006.
Appendix A Cohort Selection
The cohort for model development and analysis on a held-out set was extracted from the eICU Collaborative Research Database Version 2.0. A cohort was also extracted from MIMIC-III Version 1.4 for external validation.
For both the eICU and MIMIC cohorts, viral or unspecified pneumonia patients were included by string matching of International Classification of Disease (ICD 9) diagnosis code descriptions and subsequent clinician review of these descriptors. Using the patient and demographics tables, patients over 70 or under 18 were excluded. Other relative contraindications to ECMO were likewise excluded by string matching and clinician review of the resulting descriptors.
A.1 eICU Cohort
Below are the iagnosisstring ’s use to select patients with viral or unspecified pneumonia.
    ’infectious diseases|chest/pulmonary infections|pneumonia|ventilator-associated’,
    ’surgery|respiratory failure|ARDS|pulmonary etiology|pneumonia’,
    ’infectious diseases|chest/pulmonary infections|pneumonia|community-acquired|viral’,
    ’infectious diseases|chest/pulmonary infections|pneumonia’,
    ’infectious diseases|chest/pulmonary infections|lung abscess|secondary to pneumonia’,
    ’pulmonary|pulmonary infections|pneumonia|community-acquired|viral|respiratory syncytial’,
    ’pulmonary|pulmonary infections|pneumonia|community-acquired’,
    ’surgery|infections|pneumonia|hospital acquired (not ventilator-associated)’,
    ’infectious diseases|chest/pulmonary infections|empyema|associated with pneumonia’,
    ’pulmonary|pulmonary infections|pneumonia|hospital acquired (not ventilator-associated)’,
    ’pulmonary|pulmonary infections|pneumonia|hospital acquired (not ventilator-associated)’,
    ’infectious diseases|chest/pulmonary infections|pneumonia|opportunistic’,
    ’surgery|respiratory failure|acute lung injury|pulmonary etiology|pneumonia’,
    ’pulmonary|respiratory failure|acute lung injury|pulmonary etiology|pneumonia’,
    ’infectious diseases|chest/pulmonary infections|pneumonia|community-acquired’,
    ’surgery|infections|pneumonia’,
    ’pulmonary|pulmonary infections|pneumonia|community-acquired|viral’,
    ’infectious diseases|chest/pulmonary infections|pneumonia|hospital acquired
        (not ventilator-associated)’,
    ’pulmonary|respiratory failure|ARDS|pulmonary etiology|pneumonia’,
    ’pulmonary|pulmonary infections|pneumonia|hospital acquired (not ventilator-associated)
        |viral’,
    ’transplant|s/p bone marrow transplant|idiopathic pneumonia syndrome - bone marrow
        transplant’,
    ’pulmonary|pulmonary infections|lung abscess|secondary to pneumonia’,
    ’infectious diseases|chest/pulmonary infections|pneumonia|community-acquired|viral|
        respiratory syncytial’,
    ’pulmonary|pulmonary infections|pneumonia’,
    ’pulmonary|pulmonary infections|pneumonia|ventilator-associated’,
    ’pulmonary|pulmonary infections|pneumonia|opportunistic’,
    ’surgery|infections|pneumonia|community-acquired’
In addition to filtering for patients between 18-70 years old, the following code was used to exclude other contraindications based on ICD codes. All resulting descriptors were clinician-reviewed:
A.2 MIMIC Cohort
Here is the R code used to extract the MIMIC cohort:
Appendix B Features and Outcomes
Features and outcomes in eICU were extracted from tables containing patient ICU stays, demographics, diagnoses, nurse charting, nurse assessments, periodic vitals, laboratory findings, and treatment information. In MIMIC, this data were extracted from tables describing patient demographics, hospital encounters, ICU encounters, diagnoses, laboratory measurements, nurse charting events, event monitoring, and procedures.
Features
Features were manually merged into their corresponding elements based on a process of visualization, query, and physician review. For example, both eICU and MIMIC store the Glasgow Coma Score as a Total and as individual Motor, Verbal, and Eye Opening Scores respectively which requires a merge.
The full list of 52 features our model had access to (prior to model selection):
A slightly larger set of features relevant to COVID-19 was initially considered (including smoking, C-reactive protein, discharge to nursing home), but due to unreliable extraction and high missingness, these were excluded in both our model’s training and in calculation of existing risk scores.
Outcomes
Vasopressor use was defined by use of norepinephrine, epinephrine, phenylephrine, vasopressin, milrinone, dobutamine, or dopamine. Mechanical ventilation was defined by the documentation of mechanical ventilator use in the treatment table (eICU) or nurse charting (MIMIC).
Appendix C Amount of Missing Data in eICU and MIMIC Cohorts
| Variable | eICU (n = 3617) | MIMIC (n = 937) |
|---|---|---|
| Age | 0.001 (5) | 0.0 (0) |
| Gender | 0.001 (5) | 0.0 (0) |
| Pleural effusion | 0.0 (0) | 0.0 (0) |
| Orientation | 0.334 (1209) | 0.48 (450) |
| Temperature (°C) | 0.006 (20) | 0.182 (171) |
| Heart rate (beats per minute) | 0.009 (32) | 0.018 (17) |
| Respiratory rate (breaths per minute) | 0.001 (3) | 0.017 (16) |
| Systolic blood pressure (mmHg) | 0.063 (229) | 0.023 (22) |
| Diastolic blood pressure (mmHg) | 0.063 (229) | 0.023 (22) |
| Mean arterial pressure (mmHg) | 0.079 (287) | 0.018 (17) |
| Glasgow Coma Scale | 0.27 (977) | 0.016 (15) |
| Red blood cells (millions/L) | 0.012 (44) | 0.01 (9) |
| White blood cells (thousands/L) | 0.006 (22) | 0.009 (8) |
| Platelets (thousands/L) | 0.014 (49) | 0.01 (9) |
| Hematocrit (%) | 0.006 (23) | 0.01 (9) |
| Red blood cell dist. width (%) | 0.057 (207) | 0.012 (11) |
| Mean corpuscular volume (fL) | 0.025 (91) | 0.011 (10) |
| Mean corpuscular hemoglobin/ MCH (pg) | 0.074 (269) | 0.011 (10) |
| MCH concentration (g/dL) | 0.025 (91) | 0.01 (9) |
| Neutrophils (%) | 0.24 (869) | 0.152 (142) |
| Lymphocytes (%) | 0.167 (603) | 0.15 (141) |
| Monocytes (%) | 0.177 (641) | 0.152 (142) |
| Eosinophils (%) | 0.209 (755) | 0.152 (142) |
| Basophils (%) | 0.256 (925) | 0.152 (142) |
| Band cells (%) | 0.752 (2720) | 0.454 (425) |
| Sodium (mmol/L) | 0.004 (13) | 0.01 (9) |
| Potassium (mmol/L) | 0.008 (29) | 0.009 (8) |
| Chloride (mmol/L) | 0.009 (33) | 0.009 (8) |
| Bicarbonate (mmol/L) | 0.057 (207) | 0.009 (8) |
| Blood urea nitrogen (mg/dL) | 0.004 (14) | 0.01 (9) |
| Creatinine (mg/dL) | 0.007 (27) | 0.01 (9) |
| Glucose (mg/dL) | 0.006 (23) | 0.011 (10) |
| Aspartate aminotransferase (units/L) | 0.174 (628) | 0.218 (204) |
| Alanine aminotransferase (units/L) | 0.177 (640) | 0.219 (205) |
| Alkaline phosphatase (units/L) | 0.184 (665) | 0.223 (209) |
| C-reactive protein (mg/L) | 0.946 (3420) | 0.916 (858) |
| Direct bilirubin (mg/L) | 0.808 (2923) | 0.82 (768) |
| Total bilirubin (mg/L) | 0.185 (670) | 0.227 (213) |
| Total protein (g/dL) | 0.184 (664) | 0.841 (788) |
| Calcium (mg/dL) | 0.021 (77) | 0.027 (25) |
| Albumin (g/dL) | 0.16 (577) | 0.279 (261) |
| Troponin (ng/mL) | 0.591 (2138) | 0.505 (473) |
| Prothrombin time (sec) | 0.396 (1431) | 0.035 (33) |
| Partial thromboplastin time (sec) | 0.545 (1973) | 0.038 (36) |
| pH | 0.244 (883) | 0.104 (97) |
| Partial pressure of oxygen (mmHg) | 0.223 (807) | 0.134 (126) |
| Arterial oxygen saturation (mmHg) | 0.015 (54) | 0.726 (680) |
| Deceased | 0.0 (0) | 0.0 (0) |
| Vasopressors administered | 0.0 (0) | 0.0 (0) |
| Ventilator used | 0.0 (0) | 0.0 (0) |
Appendix D Grid Search Values for
The grid search values for : [0.5, 0.375, 0.25, 0.125, 0.10, 0.075, 0.05, 0.0225, 0.025, 0.0275, 0.02, 0.0175, 0.015, 0.0125, 0.01, 0.005, 0.0005]. Also, Figure F.2 shows the tradeoff between concordance versus the number of features selected with different .
Appendix E Nonzero Coefficients in the Model
Figure E.1 is a boxplot of the coefficients of the model learned on the normalized data.
For reference, the means and standard deviations of the nonzero features are in Table 5.
| Feature | mean | std. dev. |
|---|---|---|
| wbc | 12.9 | 8.91 |
| platelets | 208 | 108 |
| rdw | 15.8 | 2.47 |
| neutrophils | 79.1 | 13 |
| bun | 25.1 | 19.5 |
| ph | 7.38 | 0.0713 |
| direct_bilirubin | 0.385 | 0.816 |
| albumin | 2.65 | 0.636 |
| pt | 16.6 | 6.75 |
| ast | 143 | 774 |
| troponin | 1.07 | 3.85 |
| age | 54.4 | 12.5 |
| heart_rate | 89.4 | 17.8 |
| sao2 | 95.8 | 4.12 |
| gcs | 11.3 | 3.26 |
| bp_systolic | 122 | 22 |
| bp_diastolic | 67.7 | 15.1 |
| bp_mean_arterial | 83.7 | 17.9 |
Appendix F Sensitivity to MissForest Imputation
MissForest [Stekhoven and Bühlmann, 2011] is a non-parametric missing value imputation technique which iteratively fits random forests to impute missing values in each column, starting with the column with the fewest missing values. The process repeats itself until the difference between imputed arrays over successive iterations meets a stopping criterion. Our experiments use the missingpy package to perform MissForest imputation.
To check the sensitivity of model selection to MissForest imputation, we re-ran the imputation algorithm with 10 different seeds and re-ran grid search to find the best set of parameters on each of these 10 datasets. As discussed in the paper, Lasso-Cox with a penalty () level of 0.01 consistently achieved high concordance (around 0.73) while only selecting approximately 18 same features out of a total of 52 features across the 10 different seeds. Selecting additional features by lowering the penalty level did not yield substantial gains in performance (Figure F.1).
With a penalty level of 0.01, Lasso-Cox was consistent in the features selected and coefficients it learned. Figure F.2 shows that across all except one of the ten random forest imputations of the dataset (in which it selected one less feature), all 18 features were selected and the model learned relatively consistent coefficients.
Appendix G Survival Curves for High and Low Risk Groups
Figure G.1 contains survival curves for high and low risk groups derived from the PEER score (our model), CURB-65, PSI/PORT, SMART-COP, and GOQ. The high/low risk groups for CURB-65 and PSI/PORT were created by following the criteria listed in their respective papers where former one to greater or equal to 3 and the later one to higher or equal to 130. For SMART-COP and GOQ, since we did not find a cutoff criterion in their papers, we just follow our criterion to set the cutoff point as the 90th percentitle of the train set risk.