11email: husemann@mpia.de 22institutetext: Landessternwarte, Zentrum für Astronomie der Universität Heidelberg, Königstuhl 12, 69117 Heidelberg, Germany 33institutetext: INAF – Istituto di Astrofisica e Planetologie Spaziali, Via Fosso del Cavaliere, 00133 Rome, Italy 44institutetext: Dipartimento di Fisica e Astronomia, Alma Mater Studiorum, Università degli Studi di Bologna, Via Gobetti 93/2,40129 Bologna, Italy 55institutetext: INAF - Osservatorio di Astrofisica e Scienza dello Spazio di Bologna, Via Gobetti 93/3, I-40129 Bologna, Italy 66institutetext: Dipartimento di Matematica e Fisica, Università degli Studi Roma Tre, via della Vasca Navale 84, I-00146 Roma, Italy 77institutetext: Center for Relativistic Astrophysics, School of Physics, Georgia Institute of Technology, 837 State Street, Atlanta, GA 30332-0430 88institutetext: Max-Planck-Institut für Radioastronomie, Auf dem Hügel 69, 53121 Bonn, Germany 99institutetext: Joint Institute for VLBI ERIC (JIVE), Oude Hoogeveensedijk 4, 7991PD Dwingeloo, Netherlands
Revisiting dual AGN candidates with spatially resolved LBT spectroscopy††thanks: The LBT is an international collaboration among institutions in the United States, Italy and Germany. LBT Corporation partners are: The University of Arizona on behalf of the Arizona Board of Regents; Istituto Nazionale di Astrofisica, Italy; LBT Beteiligungsgesellschaft, Germany, representing the Max-Planck Society, The Leibniz Institute for Astrophysics Potsdam, and Heidelberg University; The Ohio State University, and The Research Corporation, on behalf of The University of Notre Dame, University of Minnesota and University of Virginia.
Abstract
Context. The merging of supermassive black holes (SMBHs) is a direct consequence of our hierarchical picture of galaxy evolution. It is difficult to track the merging process of SMBHs during mergers of galaxies as SMBHs are naturally difficult to observe.
Aims. We want to characterise and confirm the presence of two independent active galactic nuclei (AGN) separated by a few kiloparsec in seven strongly interacting galaxies previously selected from the Sloan Digital Sky Survey (SDSS) as Seyfert-Seyfert pairs based on emission-line ratio diagnostics.
Methods. Optical slit spectra taken with MODS at the Large Binocular Telescope (LBT) are presented to infer the detailed spatial distribution of optical emission lines, and their line ratios and AGN signatures with respect to the host galaxies, thereby quantifying the impact of beam smearing and large fibre apertures on the spectra captured by the SDSS.
Results. We find that at most two of the seven targets actually retain a Seyfert-Seyfert dual AGN, whereas the others may be more likely powered by post-AGB stars in retired galaxies or through shocks in the ISM based on spatially resolved optical line diagnostics. The major cause of this discrepancy is a bias caused by the spillover of flux from the primary source in the secondary SDSS fibre which can be more than an order of magnitude at 3″ separations. Previously reported extremely low X-ray–to–[O iii] luminosity ratios may be explained by this misclassification, as can heavily obscured AGN for the primaries. We also find that the nuclei with younger stellar ages host the primary AGN.
Conclusions. Studies of close dual AGN selected solely from fibre-based spectroscopy can create severe biases in the sample selection and interpretation of the results. Spatially resolved spectroscopy should ideally be used in the future to characterise such compact systems together with multi-wavelength follow-up observations.
Key Words.:
Galaxies:active - Galaxies:interactions - Galaxies:nuclei - Galaxies:Seyfert1 Introduction
If galaxies merge hierarchically and most galactic bulges contain supermassive black holes (SMBHs), the formation of dual or multiple SMBHs is a natural phenomenon (Begelman et al. 1980). Multiple mergers offer a potential physical mechanism linking star formation on a galaxy-wide scale with the feeding and evolution of active galactic nuclei (AGN) (e.g. Hopkins et al. 2008). The evolution of merging SMBH systems from several kiloparsec to smaller separations is determined by gravitational interactions of the SMBHs with their environment (Mayer 2013), mainly dynamical friction (e.g. Escala et al. 2004), and the scattering of the SMBHs by massive gas clouds and spiral arms produced during the merger phase (Fiacconi et al. 2013).
Active galactic nuclei trace the active easily observable phase of SMBHs, and are therefore the ideal objects where SMBHs can be discovered. Since dual SMBHs (i.e. with a separation of 100 pc up to 10 kpc) are a natural consequence of galaxy mergers, their search received great attention (see Bogdanović et al. 2009; De Rosa et al. 2019, and references therein). Evidence of such systems has proven elusive until now. In particular, only a small number of dual AGN have been successfully identified at the centres of single-host galaxies so far. Some of the clearest examples are NGC 6240 (Komossa et al. 2003), 0402+379 (Rodriguez et al. 2006), SDSS J15360441 (Bondi & Pérez-Torres 2010), LBQS 01032753 (Shields et al. 2012), Mrk 463 (Bianchi et al. 2008), and SDSS J13230159 (Woo et al. 2014). However, the number of confirmed dual or multiple AGN remains small, and advances in this field have been meager so far.
Large fibre-based optical surveys such as the Sloan Digital Sky Survey (SDSS, York et al. 2000) and the Large Sky Area Multi-Object Fibre Spectroscopic Telescope (LAMOST, Cui et al. 2012) have enabled large systematic searches for close dual AGN candidates selected as double-peaked emitters in the [O iii] 4960,5007 emission (Wang et al. 2009; Liu et al. 2010; Smith et al. 2010; Ge et al. 2012; Barrows et al. 2013; Shi et al. 2014; Wang et al. 2019). The assumption is that double-peaked [O iii] emitters are potentially caused by the presence of two independent AGN narrow-line regions (NLRs) around distinct AGN because of the large velocity offset required to produce two line peaks (several 100 km/s). A few hundred double-peaked [O iii] emitters have been discovered this way, which represent roughly 1% of the screened parent AGN population. However, dual AGN are not the only explanation for the double-peaked [O iii] emission. Bi-polar AGN-driven outflows (Rosario et al. 2010; Shen et al. 2011; Fu et al. 2012; Müller-Sánchez et al. 2015; McGurk et al. 2015; Nevin et al. 2016), rotating gas discs (Smith et al. 2012), or a single AGN photo-ionising the interstellar media of both galaxies in a merger (Xu & Komossa 2009) can also explain the line shapes, which emphasises the need for spatially resolved spectroscopic follow-up of each candidate to understand the exact nature of the kinematics.
A much more robust detection of dual AGN candidates is expected if the nuclei exhibit AGN signatures from distinct spectra rather than double-peaked emission in a single spectrum. Such a catalogue of projected AGN pairs in the range from 5 to 100 kpc was established by Liu et al. (2011) from the SDSS data release 7 (Abazajian et al. 2009). They reported that 3.6% of AGN are projected and that 30% of the pairs show morphological disturbances. However, Hou et al. (2019) was able to confirm two of the five targets from this catalogue as dual AGN based on X-ray follow-up observation with Chandra, while the non-detection would imply extreme X-ray–to–[O iii] flux ratios if they are still genuine dual AGN.
In this paper we present spatially resolved optical long-slit spectroscopy with the Large Binocular Telescope (LBT) of seven dual AGN with angular separations of 9″ from the Liu et al. (2011) catalogue. We specifically explore here how light spillover between distinct SDSS fibres can arise at close separations due to the relatively large fibre diameters (3″), poor seeing, and positional uncertainties, which could artificially boost the observed emission line fluxes of a secondary nucleus. These observational issues could naturally lead to the reported extreme X-ray–to–[O iii] flux ratios as the [O iii] flux of the putative secondary nuclei could be significantly overestimated for such misclassified dual AGN at small separations.
Throughout the paper we assume a concordance cosmological model with , , and .
| Namea𝑎aa𝑎aIdentifier from the Sloan Digital Sky Survey of one of the nuclei. | b𝑏bb𝑏bAngular distance between the two nuclei as inferred from the optical continuum light. | instrument | date | airmass | seeingc𝑐cc𝑐cInferred FWHM of the seeing during the observations at 6000 Å. | ||
|---|---|---|---|---|---|---|---|
| SDSS J031722.06004801.8 | 0.15722 | 28 | MODS1 | 2016-02-05 | sec | 1.5 | 20 |
| SDSS J080523.29281815.8 | 0.12844 | 23 | MODS1 | 2016-02-04 | sec | 1.1 | 13 |
| SDSS J085837.68182223.4 | 0.05894 | 26 | MODS1 | 2016-02-04 | sec | 1.1 | 11 |
| SDSS J094741.58633939.2 | 0.13973 | 22 | MODS1 | 2016-02-05 | sec | 1.2 | 12 |
| SDSS J111519.98542316.7 | 0.07043 | 83 | MODS1 | 2016-02-04 | sec | 1.1 | 11 |
| SDSS J160933.41283058.4 | 0.16960 | 27 | MODS2 | 2016-05-26 | sec | 1.2 | 12 |
| SDSS J164658.48241134.1 | 0.08728 | 21 | MODS2 | 2016-05-26 | sec | 1.2 | 11 |
2 Small-separation dual AGN candidates
2.1 Sample selection
The Sloan Digital Sky Survey (SDSS, York et al. 2000) provides a large collection of galaxy spectra from which close pairs of AGN can be drawn. However, the tiling of the plates requires a minimum distance of 55″ between the fibres (Blanton et al. 2003). Hence, spectroscopy of two targets with smaller separations can only be obtained if neighbouring fibre-plate fields are overlapping on the sky or if repeated observations of the same field are taken with different fibre positions for small-separation targets. Mining SDSS data release 7 (DR7, Abazajian et al. 2009), Liu et al. (2011) collected a sample of 1286 candidate multiple AGN systems with physical separations 100 kpc from SDSS-DR7 in the redshift range . They selected obscured (narrow-line) AGN following an emission-line diagnostics classification (Kauffmann et al. 2003a) based on MPA-JHU value-added emission-line catalogues (Brinchmann et al. 2004; Tremonti et al. 2004). They further complemented the sample with narrow-line quasars from Reyes et al. (2008) and unobscured (broad-line) AGN from Hao et al. (2005), and Schneider et al. (2010) within the same redshift range as the narrow-line AGN.
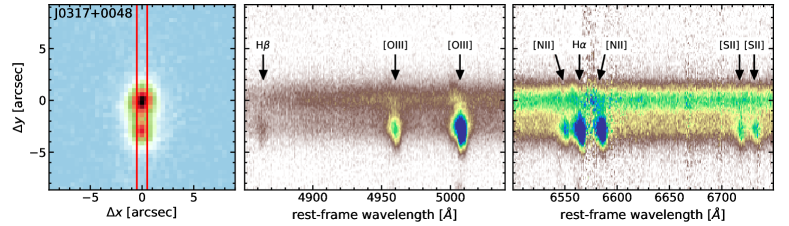
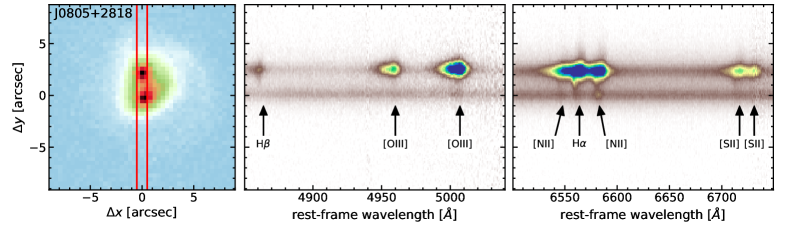
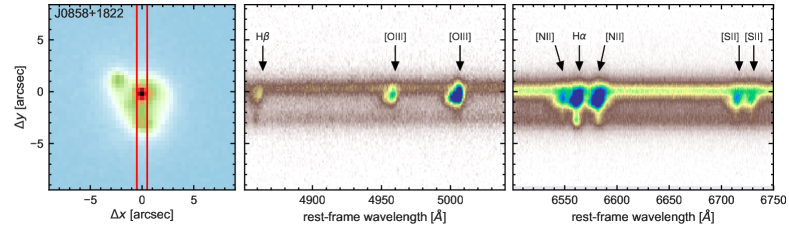
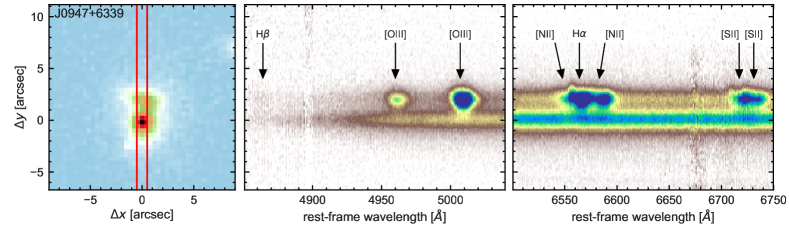
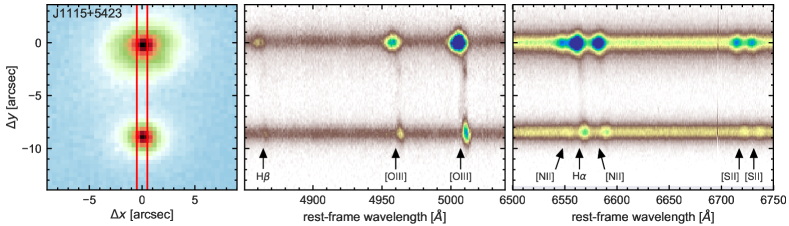
Here, we focus on narrow-line AGN pairs where emission-line diagnostic clearly identified Seyfert-like ionisation, and we exclude pairs with LINER-like emission following the demarcation line of Stasińska et al. (2008). Since LINERs can also be powered by other mechanisms than AGN photo-ionisation, such as shocks (e.g. Heckman 1980) or post-AGB stars (e.g. Singh et al. 2013), we want to avoid this additional confusion in the ionisation mechanisms and select a clean obscured AGN pair sample based on the recorded fibre spectra. Excluding as well the very wide pairs with 60 kpc separation, which are not necessarily bound systems, leads to a subsample of only 17 potential Seyfert-Seyfert pairs. We selected 6 of the 17 pairs with separations smaller than corresponding to 10 kpc separation at the corresponding redshifts. All these dual AGN candidates are clearly associated with interacting systems that display at least two independent nuclei and tidal features (see Fig. 1). In addition, we selected one target at a slightly larger separation of 8″ in a pair of galaxies as a control galaxy for our study. The selected sample and the separations of the apparent nuclei are listed in Table 1.
2.2 Predictions of light spillover and line flux biases
Although a dual AGN is a compelling hypothesis for these sources, two additional possibilities are usually overlooked: (1) only one AGN is ionising gas out to the kpc-scale distances (e.g. Husemann et al. 2014) seen in the secondary fibre, or (2) the large SDSS fibres can be significantly contaminated by the flux from the primary source due to the extended wings of the point-spread function (PSF). In both cases the secondary fibre may contain emission-line ratios consistent with AGN ionisation, but significantly lower in absolute flux than the primary spectrum. In particular the last point is important for very close dual AGN candidates when the separation of the putative nuclei is getting close to the fibre diameters and seeing of the spectroscopic SDSS observations. It is important to note that SDSS spectroscopic observations are often taken during relatively poor seeing 17 (e.g. Abazajian et al. 2003) as the good seeing conditions were preferentially used for the imaging.
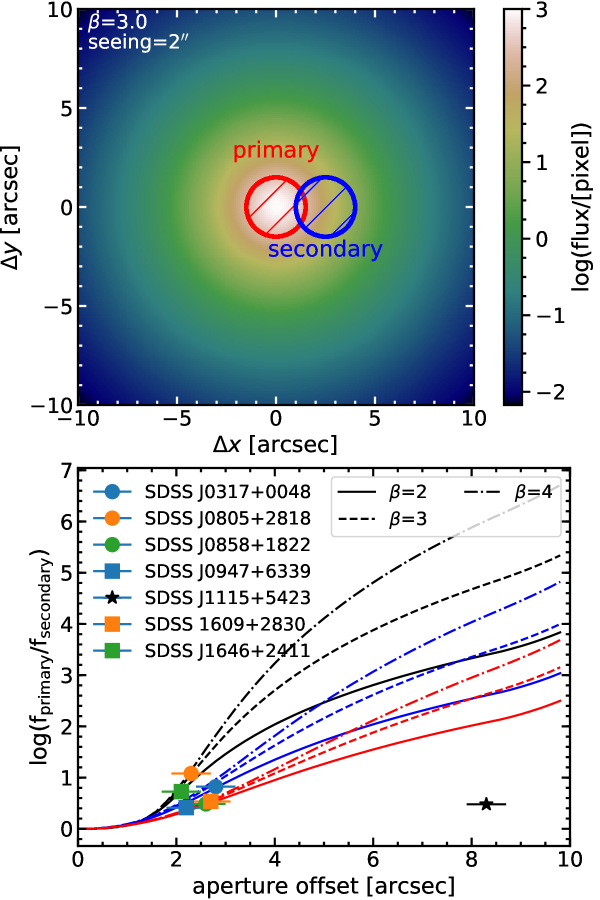
The relatively poor seeing of the SDSS observations can cause a significant flux spillover of a point source into an offset fibre. The quantitative strength of this spillover can in principle be accurately calculated if the shape of the PSF and the light distribution of the source is accurately known. Unfortunately, this is usually not the case for fibre-based spectroscopic observations, but rough predictions of the effect can be obtained by making reasonable assumptions. Here, we assume a simple circular 2D Moffat function for the PSF
| (1) |
where is the peak intensity, is the radial distance, controls the slope of the wings, and is a scale factor for the width that scales as . The light distribution for and a width of (FWHM) is shown in Fig. 2 (top panel) where the area covered by a central fibre and an offset fibre with a displacement of 25 are highlighted for comparison. The corresponding flux ratio as a function of offset distance of the secondary fibre, parameter, and seeing is shown in the bottom panel of Fig. 2.
These predictions are compared against the measured flux ratios of the bright [O iii] line as obtained from the SDSS spectra for our dual AGN candidate sample (Fig. 2, bottom panel). Nearly all the objects could in principle be explained entirely by this spillover effect depending on the exact shape of the PSF and fibre position uncertainties during the observations. Only the dual AGN with a separation of more than 5″ should not be significantly affected by spillover under realistic conditions. For the others a severe complication with respect to our simple assumption is that these spectra are obtained on different nights and therefore the PSF shape will not necessarily be the same and there is a known uncertainty in the exact position of each fibre of a few 01. Hence, it is indispensable to obtain proper spatially resolved spectroscopy of these dual AGN candidates to confirm their original classifications based on the SDSS fibre spectra.
3 Observations and data reduction
We obtained spectroscopic observation of the seven candidate dual AGN with the Multi-Object Double Spectrograph (MODS, Pogge et al. 2010) mounted to the Large Binocular Telescope (LBT) at Mount Graham. The data were taken in February and May 2016 using MODS1 and MODS2 in multi-slit mode. Custom masks with 20″1″ slits were designed to simultaneously observe the primary dual AGN target, some reference stars for simultaneous PSF estimation and sky background together with some filler targets. Observations were split into two or three exposures per mask with a total integration time ranging between 600 s and 2700 s. All observations were performed with 1″ wide slits in the dual beam G400L/G670L grating mode covering the full optical wavelength range from 3200Å to 10000Å. The spectral resolution is for the blue channel and for the red channel. Details of the observations are given in Table 1.
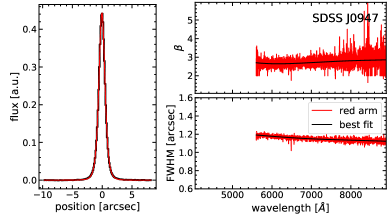
We performed the primary detector calibrations such as bias subtraction and flat-fielding with the publicly available python package modsCCDRed222Available at http://www.astronomy.ohio-state.edu/MODS/Software/modsCCDRed/. Afterwards we masked and cleaned cosmic ray hits on individual detector frames with PyCosmic (Husemann et al. 2012) and processed the science and calibration data with custom-made python scripts. The tracing of the slits along the wavelength axis was achieved through an edge detection in the continuum lamp flat observations, if available, or alternatively using sky background in the science data itself. A wavelength solution was established by tracing various lines of arc lamps along the slit after slit extraction. However, the arc lamps were taken through the wrong slit mask for the target field of SDSS J09476333. We traced the wavelength solution through sky lines for the red channel instead, but simply lacked enough bright sky line to derive the solution for the blue channel. Hence, the blue channel data could not be properly reduced for SDSS J09476333.
The science spectra were then rectified in spatial and spectral dimension. The background was subtracted by fitting a first-order polynomial in cross-dispersion direction at each wavelength after masking out the target signal. The same processing was also applied to a standard star observations obtained through a fixed long slit with the same slit width to measure the spectrophotometric sensitivity for both spectrograph arms. Finally, we roughly corrected the science spectra for telluric absorption by measuring the strength of the absorption features in the star spectra obtained in the same mask as our target galaxies.
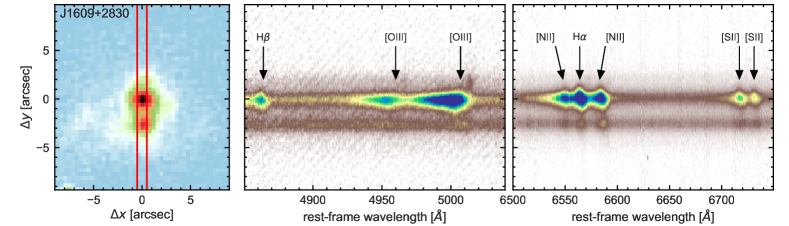
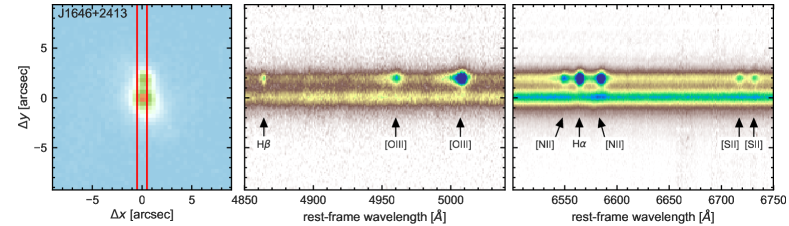
In Fig. 1 we provide an overview of the observation for each dual AGN candidate system. The slits are always oriented such that the two putative AGN within the galaxies are covered simultaneously. The cutouts of the 2D spectra focused on most prominent emission lines in the H/[O iii] and the H/[N ii]/[S ii] region already reveal very different strength of ionised emission at the two nuclei. Surprisingly, the target SDSS J08581822 already sticks out from the sample since the light distribution of [O iii] does not have its peak at one of the optical continuum peaks of the galaxy.
4 Analysis and results
4.1 Characterisation of the point-spread function
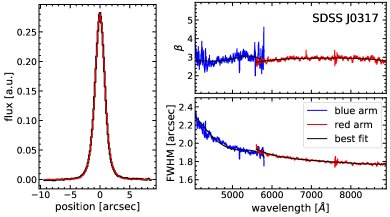
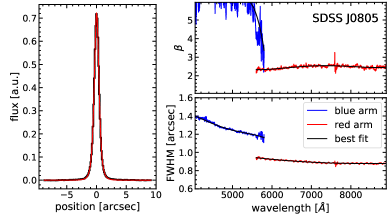
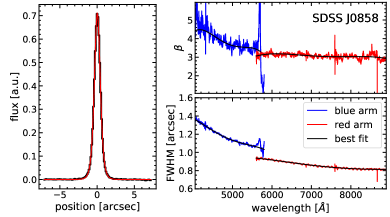
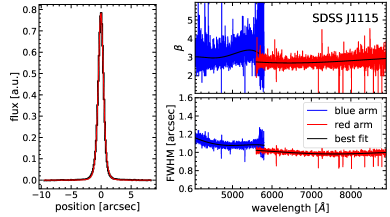
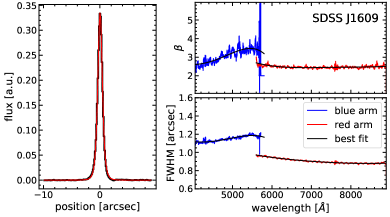
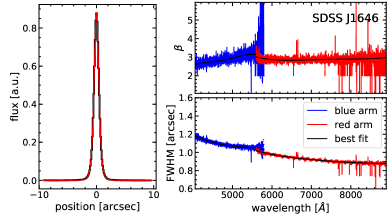
As a first step in the analysis of the slit spectra, we characterise the wavelength-dependent PSF from the star observed close to the science target in the same mask observations. Again we assume a Moffat profile as described by Eq. 1, but we replace the radial distance with the 1D position along the slit where is the position of the star in the slit.
After smoothing the 2D star spectra with a 30 pixel wide median filter in the dispersion direction, we fitted each wavelength slice with a Moffat profile to obtain best-fit parameters for , , , and as a function of wavelength. Afterwards, we describe the wavelength dependence of , , and with a best-fitting fourth-order polynomial separately for the blue and red channel of the spectrograph. In Fig. 3 we show the cross-dispersion profile of the star at 6000 Å and the measured wavelength dependence of the FWHM and for all the science fields. Since the blue and red channels are independent spectrographs, their parameters are not necessarily consistent, likely due to a different spectrograph focus setup and/or optical path depending on the observations data and location on the sky.
The PSF shape is an important characteristics of the observations because it is crucial to properly disentangle the emission of the two galaxies and galaxy nuclei. The FWHM of the PSF at 6000Å is listed in Table 1 as a reference for the overall seeing during the observations. All observations except for SDSS J03170040 are taken during good seeing conditions with 1″ (FWHM). In the following analysis steps we always take the measured wavelength-dependence PSF for each science field into account. If the [O iii] and H lines fall in the spectral overlap region between the two spectrograph arms, we do not combine the overlapping spectra and analyse only the data from the arm providing the highest S/N for those lines to ensure that the intrinsic PSF remains well characterised.
| Name | ||||||||||
|---|---|---|---|---|---|---|---|---|---|---|
| [″] | [″] | [] | [″] | [ | ||||||
| SDSS J03170048 | 2.8 | |||||||||
| SDSS J08052818 | 2.3 | |||||||||
| SDSS J08581822 | 2.6 | |||||||||
| SDSS J09476339 | 2.2 | … | … | |||||||
| SDSS J11155423 | 8.3 | |||||||||
| SDSS J16092830 | 2.7 | |||||||||
| SDSS J16462411 | 2.1 |
| Name | |||||||||||||
|---|---|---|---|---|---|---|---|---|---|---|---|---|---|
| [] | [Å] | [] | [Å] | [] | |||||||||
| SDSS J03170048 | |||||||||||||
| SDSS J08052818 | |||||||||||||
| SDSS J08581822 | |||||||||||||
| SDSS J09476339 | … | … | |||||||||||
| SDSS J11155423 | |||||||||||||
| SDSS J16092830 | |||||||||||||
| SDSS J16462411 | |||||||||||||
4.2 Stellar continuum modelling
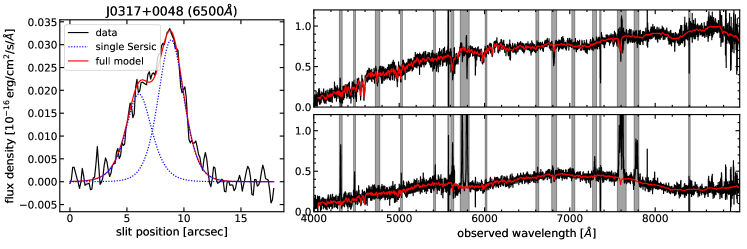
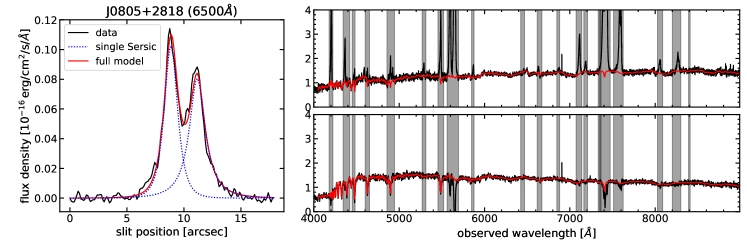
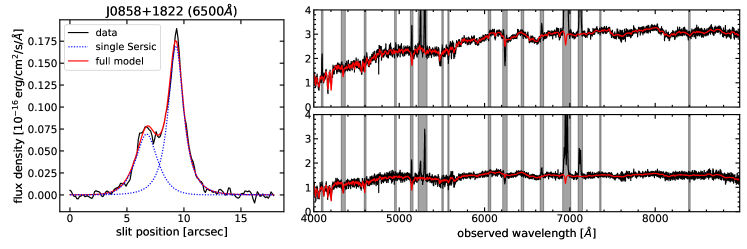
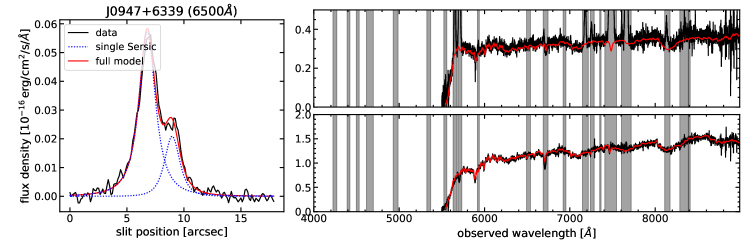
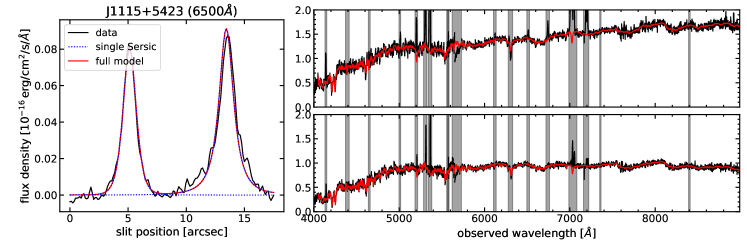
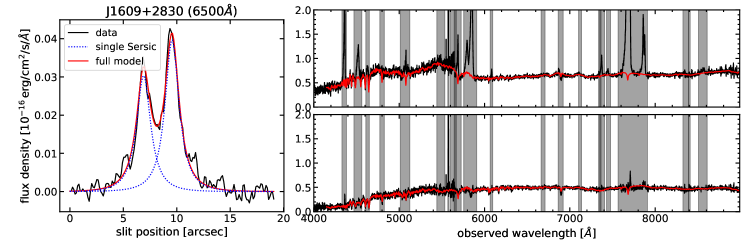
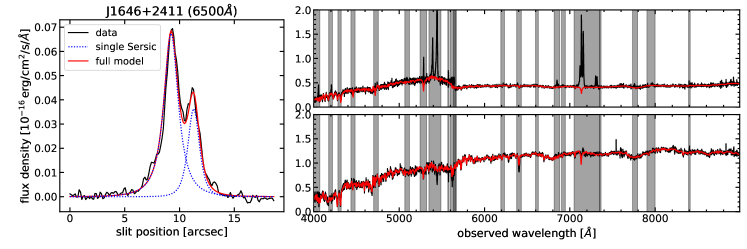
Although we are mainly interested in the emission line fluxes and ratios to study the narrow-line AGN characteristics of the two galaxy nuclei, it is crucial to subtract the stellar continuum beforehand for accurate measurements. The stellar continuum is usually modelled independently along the slit for galaxies, but our data suffer from a strong blending of the two nuclei and low S/N in the continuum already a few pixels away from the galaxy nuclei. Here we chose to obtain integrated spectra of the two galaxy components which can be properly deblended through modelling the 1D light distribution along the slit with two Sersic profiles convolved with wavelength-dependent PSF. This process ensures an accurate separation of the continuum light of both galaxies and a maximum S/N for the continuum spectra.
A single 1D Sersic profile along the slit has four free parameters, the central position in the slit (), the effective radius (), the Sersic index (), and the integrated flux (). In our case we have a superposition of two Sersic profiles with eight free parameters which are convolved with the PSF. Since the , , and should only vary smoothly with wavelength, we performed the fitting in three steps: 1) we fit the slit profile for each wavelength with all eight free parameters of the two Sersic model; 2) we repeat the fitting with fixed Sersic indices and at all wavelengths which are set to the median within the rest-frame wavelength range 5200–6200Å; 3) in the final iteration, we only fit the intensities and and fix the position and radius as defined by the best-fit fourth-order polynomial to the wavelength dependence seen in the previous iteration.
In Fig. 4 we show the profile along the slit at 6500Å and PSF-convolved two Sersic component model as well as the obtained spectra for each component. An optimal spectrum is extracted for each component by fitting a linear superposition of the two PSF-convolved Sersic models (with fixed parameters) to the 1D light distribution along the slit at each wavelength. The characteristic parameters of the Sersic models are also listed in Table 2. Subsequently, we model each optimally extracted spectrum with a superposition of stellar spectra from the INDO-US spectra library (Valdes et al. 2004) using PyParadise (see Walcher et al. 2015; Weaver et al. 2018; De Rosa et al. 2018). PyParadise has the advantage that it fits the spectra after normalising, which deals much better with the systematic residuals at the wavelength of the beam splitter than adding a polynomial function to the fitting. All emission lines are masked out during fitting because their spatial distribution does not necessarily follow that of the stars, and unphysical residuals of the spatial modelling are imprinted in the spectra at their emission-line wavelengths. The best-fit continuum model is shown in Fig. 4 and we also report the velocity dispersion and the (4000) spectral index as useful stellar age indicators (e.g. Bruzual A. 1983; Poggianti & Barbaro 1997; Kauffmann et al. 2003b) in Table 2.
Based on the noise-free best-fit continuum we reconstruct the 2D stellar continuum spectra using the best-fit spatial profiles as a function of wavelength. We then subtract this 2D continuum signal from the original data which leads to emission-line spectra along the slit. We remove any remaining faint continuum signal due to substructure in the galaxy light profile by running a wide median filter over 300 pixels in wavelength direction and subtract the filter continuum signal from the 2D spectra. The pure emission-line spectra are then ready for further analysis.
4.3 Emission-line measurements
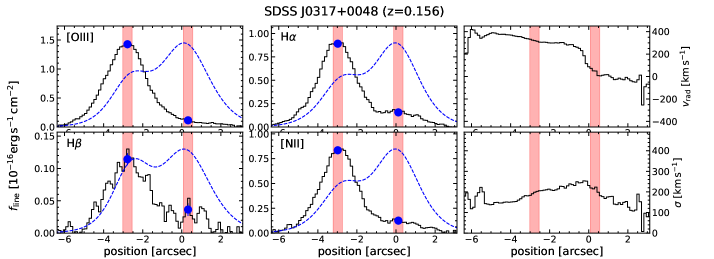
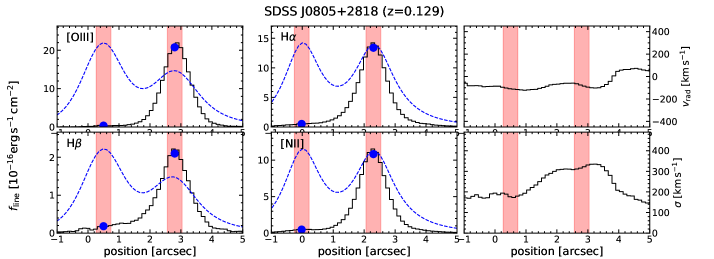
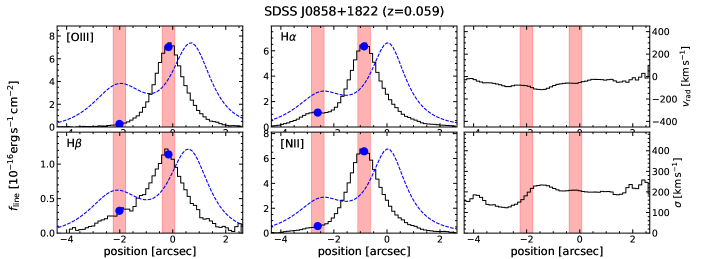
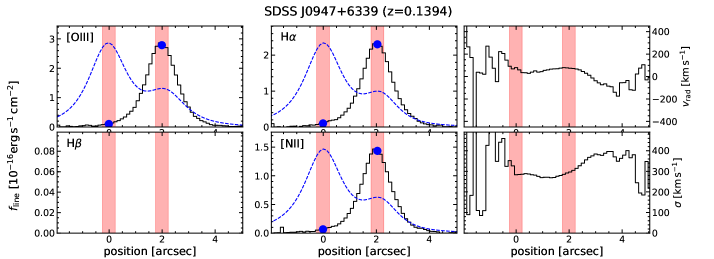
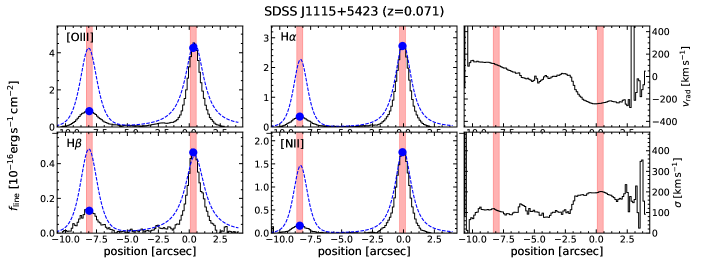
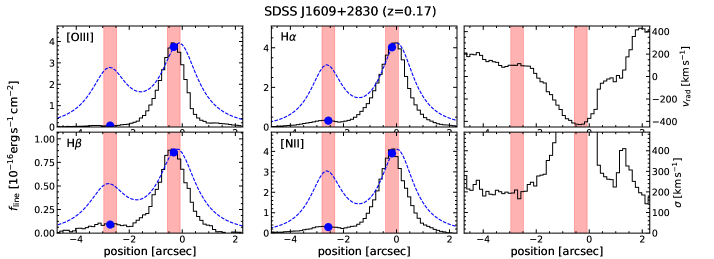
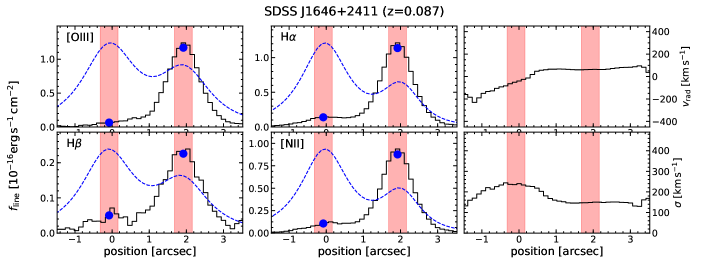
After the stellar continuum subtraction, we proceed to fit the emission lines along the slit. We used a single-Gaussian line profile for all the lines and couple their radial velocities and velocity dispersions during the fitting. The different spectral resolutions of the blue and red channel were taken into account when modelling the intrinsic velocity dispersion. The kinematical coupling drastically reduced the number of free parameters and ensures a robust flux estimates of the faintest lines. It allows us to construct line ratios in a meaningful way as the line fluxes for each emission line are emitted from the same physical association of clouds. The resulting 1D flux distributions for the H, [O iii], H, and [N ii] lines along the slit are shown in Fig. 5 together with the radial velocity and intrinsic velocity dispersion.
Here, we are mainly interested in the line ratios at the position of the two independent nuclei to be able to infer the true classification. Ideally, we would also fit the 1D flux distribution as a super-position of two PSF convolved functions. However, the emission line flux distribution exhibits much more substructure, unlike the smooth stellar continuum emission, and can therefore not be easily expressed with a simple analytic function. We therefore simply compute the average in line fluxes and kinematics within an aperture of 04 around the centroid of each nucleus. The resulting measurements of peak line fluxes and the associated kinematics are listed in Table 3. Due to the wavelength-dependent PSF, the Balmer decrement of the peak-line fluxes cannot be robustly used to measure extinctions so we do not correct the emission lines for intrinsic dust attenuation. Therefore, we only provide relative flux with respect to [O iii] and H flux of the brightness nuclei for the blue and red part of the spectra.
Our observations reveal that the brighter nucleus in the stellar continuum is not necessarily the more luminous emission-line source. Only in one of the seven cases (SDSS J1609+2830) does the brighter emission-line source coincide with the brighter continuum nucleus. Surprisingly, the emission-line peak for SDSS J0858+1822 is clearly offset by 1″ from the position of the two apparent stellar nuclei of the ongoing merger system. This already calls into question the initial dual AGN nature of this galaxy as the SDSS fibres were positioned at the two continuum nuclei, which means that a high fraction of the flux from the brightest emission-line source is captured by both fibres simultaneously.
The emission-line kinematics at the position of the two nuclei are significantly different, which suggest that local emission is dominating even for the secondary nuclei. An exception is SDSS J09476339, where the radial velocity and velocity dispersion are consistent within the errors. This means that the PSF-smeared emission of the primary may even dominate the emission at the location of the second nucleus. This should be taken into account when interpreting the emission-line ratios. The emission lines are very broad for the primary AGN nucleus in SDSS J16092830 with a velocity dispersion of 600 km/s and a blue shift of more than 600 km/s with respect to the secondary nucleus. This suggests that a powerful outflow is released by the AGN which is interesting by itself, but outside the scope of this paper.
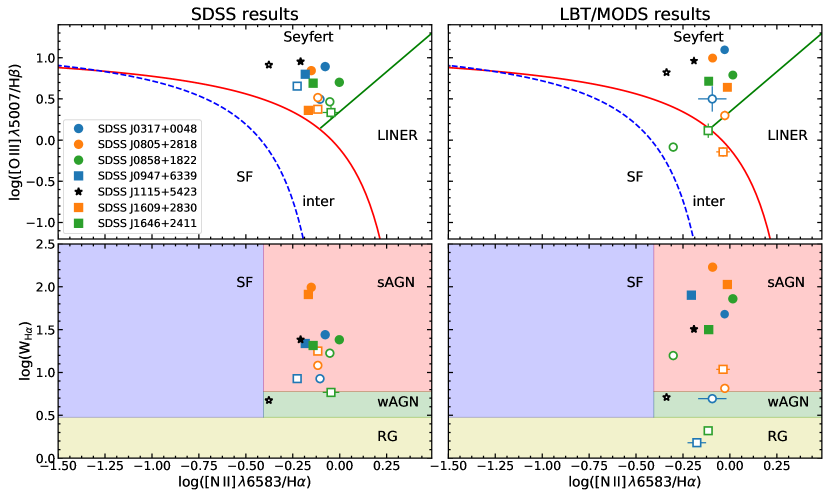
4.4 Emission-line diagnostics for the nuclei
Based on the obtained emission line measurements from the original SDSS spectra and the LBT long-slit analysis presented here, we construct two emission-line diagnostic diagrams (see Fig. 6). The first is the classical [O iii]/H versus [N ii]/H emission-line diagnostics diagram (BPT diagram, Baldwin et al. 1981; Veilleux & Osterbrock 1987) and the second replaces the [O iii]/H ratio by the equivalent width of H (), as proposed by Cid Fernandes et al. (2010), the so-called WHAN diagram. The Seyfert-Seyfert pre-selection from SDSS of the two nuclei is confirmed by the BPT diagram shown in Fig. 6 (upper left panel), although the second nucleus of SDSS J11155423 and SDSS J1646+2411 is in the weak AGN regime following the WHAN diagram. Hence, all seven systems have been assumed as dual AGN in interacting galaxy systems based on these optical diagnostics.
However, the MODS spatially resolved spectroscopy reveals a significantly different picture, as shown in the right panels of Fig. 6. Except for SDSS J1115+5423, all the fainter secondary nuclei, which were initially classified clearly as Seyfert-like AGN, are changing their apparent emission-line classification. The secondary nuclei of SDSS J09476339 and SDSS J16462411 clearly fall into a lower ionisation regime which are likely ionised by the stellar population instead of an AGN given the low equivalent width of H in the WHAN classification. SDSS J08581822 is the system where the peak in the [O iii] emission is located between the two continuum nuclei making the dual AGN signature of the SDSS fibre obsolete, and shows that one of the nuclei is dominated by star formation, as confirmed by the BPT diagram, which cannot be properly distinguished in the WHAN diagram in the transition zone. While SDSS J03170048 and SDSS J08052818 remain in the Seyfert/AGN classification in the BPT, the equivalent width of H is very low and certainly in the weak AGN regime. Only SDSS J16092830 seems to retain an unambiguous dual AGN classification although the BPT diagnostic reveals a significant SF or LINER-like contribution to the emission inconsistent with the previous Seyfert-Seyfert classification based solely on SDSS.
5 Discussion
5.1 Interpretation of dual AGN signatures in very close systems from SDSS
A key result of this work is that nearly all of the six putative AGN systems with separations of less than 3″ change their initial Seyfert–Seyfert classification from the SDSS fibre spectra. One of the targets turns out to be completely offset with respect to the fibre positions targeting optically bright continuum knots. This means that the unambiguous (Seyfert 2–Seyfert 2) dual AGN fraction at the closest separations (3″) reported by Liu et al. (2011) is overestimated by a larger factor. However, given the complex selection function and completeness of the SDSS for obtaining spectra so close together, which avoids merging or neighbouring galaxies, we do not attempt to extrapolate our findings on the dual AGN fraction from our sample to the overall population.
Another big complication is the actual classification of galaxies based solely on the emission-line diagnostic diagrams which are often ambiguous to clearly identify AGN signatures. In particular, the LINER-like emission-line ratios may not be necessarily produced by AGN and are shown to be often produced by post-AGB stars in galaxies with old stellar populations (e.g. Cid Fernandes et al. 2011; Singh et al. 2013). Also emission-line ratios in the intermediate region between the star forming and AGN classification could be entirely powered by a starburst or an actual mix of star formation and AGN photo-ionisation. In both cases the AGN signature of the corresponding nucleus needs to be verified at other wavelengths, for example radio (e.g. Bondi & Pérez-Torres 2010; Fu et al. 2015; Müller-Sánchez et al. 2015; Bondi et al. 2016) or X-rays (e.g. Koss et al. 2012; Comerford et al. 2015; Ellison et al. 2017; Hou et al. 2019). For LINERs it may be more likely to detect the radio emission of a jet if the accretion disc is in a radiatively inefficient mode.
While it has often been highlighted that double-peaked [O iii] emitters require spatially resolved spectroscopy and multi-wavelength follow-up to confirm the dual AGN nature, our study reveals that spatially resolved spectroscopy is also indispensable for verifying the dual AGN at separations of even if the separate spectra were taken with fibre spectroscopy such as SDSS, LAMOST, and 4MOST (de Jong et al. 2019), or WEAVE (Dalton et al. 2014) in the near future. While we only studied the spillover effect for obscured dual AGN candidates, we note that the same effect will also impact unobscured dual AGN candidates at close separation. In that case, the light of broad emission lines would also be detected in fibres placed a few arcsec away depending on brightness and seeing conditions. While the detection of broad Balmer lines is a much less questionable AGN signature than the emission-line ratios, it may suffer from the same spillover effects and also requires spatially resolved spectroscopy for confirmation.
5.2 X-ray–to–[O iii] line ratios in close dual AGN candidates
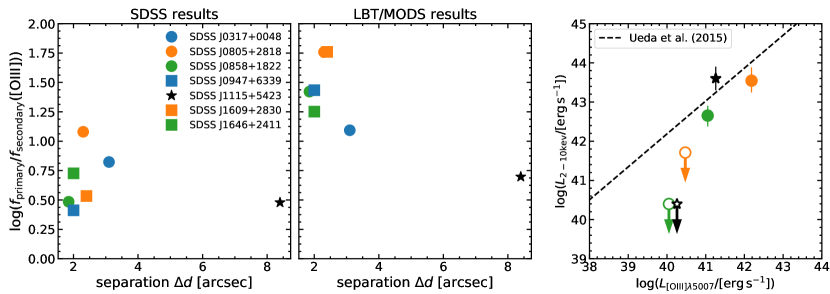
A systematic study of X-ray follow-up observations with Chandra was presented by Hou et al. (2019) for five of the compact dual AGN candidates selected from SDSS, including SDSS J0805+2818. Only two of the five putative dual AGN candidates could be confirmed with clear X-ray detection in both nuclei despite the unobscured AGN classifications from the SDSS spectroscopy. Hou et al. (2019) interpret their results as an indication for systematically lower X-ray–to–[O iii] luminosity ratios in those systems. Based on our analysis, we suggest that the measured [O iii] luminosities are strongly biased in the SDSS spectra. As we show in Fig. 7, the [O iii] luminosity can be overestimated by an order of magnitude for the secondary nucleus at 3″ separations.
Chandra X-ray observations are available for SDSS J08052818 (Barrows et al. 2016; Hou et al. 2019), SDSS J08581822 (Proposal ID: 14700279, PI: Liu, unpublished), and SDSS J11155423 (Barrows et al. 2016). In all Chandra images the primary nuclei are always detected, while the secondary nuclei are usually undetected. We derived a upper limit on the 2–10 keV flux based on the background noise, which corresponds to , , and for the three sources, respectively, adopting a and a power-law index of . The X-ray fluxes of the primary nuclei for SDSS J08052818 and SDSS J11155423 are published in Barrows et al. (2016), but we re-visit the spectra and adjust luminosity estimates based on spectral shape. For SDSS J08581822 we found that the bulk of X-ray emission is located between the optical nuclei in the SDSS images, which is fully consistent with our LBT spectroscopy. Furthermore, the X-ray spectra of SDSS J08052818 and SDSS J08581822 are rather soft, which could be due to a heavy obscuration of the primary nuclear component up to 4–5 keV (and potentially up to the Compton-thick level of 10 keV when the spectrum is dominated by the disc reflected component) and leaving a soft X-ray scattered component dominating at low energies.
At the S/N of the X-ray spectra a detailed modelling of the reflection spectrum is difficult. To obtain the upper limit to the X-ray luminosity, we assume that the direct X-ray radiation is totally absorbed by a Compton-thick medium () and that we are observing the reflected component in the 2–10 keV energy band. We apply a mean correction factor of 70 to obtain the intrinsic 2–10 keV luminosity (e.g. Lamastra et al. 2009; Marinucci et al. 2012), which is close to an absolute upper limit for the intrinsic X-ray luminosity.
In Fig. 7 (right panel) we compare the 2–10 keV X-ray luminosities against the [O iii] luminosities. For the secondary nuclei we adopt the [O iii] flux ratios from the LBT data and applied it to the flux measured for the primary by SDSS. This avoids potential aperture losses in the slit spectra for the absolute luminosities. We see that the primary nuclei closely follow the X-ray–to–[O iii] correlation by Ueda et al. (2015), but only if the correction factors are applied for the reflection-dominated spectra. The secondary nuclei fall short of correlation by 2 orders of magnitude even if a correction factor is applied to the upper limits for reflection except for SDSS J08051822. Hence our data is consistent with normal X-ray–to–[O iii] ratios considering the updated emission-line ratio diagnostics which show that the secondary nuclei are not necessarily genuine obscured type 2 AGN. The interpretation of exceptional X-ray–to–[O iii] ratios by Hou et al. (2019) was based on the SDSS line fluxes which simply need to be significantly revised. SDSS J08051822 could be a dual AGN consistently inferred from the emission lines, but the corresponding X-ray source is quite faint and only consistent with an AGN interpretation if the X-ray luminosity is scaled up by a factor of 70 for a Compton-thick source. The X-ray observations of SDSS J08581822 also confirm the non-AGN nature of the secondary nucleus which appears to be dominated by star formation in the LBT spectra. SDSS 11155432 shows AGN ionised gas along the entire slit between the galaxies, which is a clear indication that the ionisation cone of the primary is pointing towards the companion galaxy. This opens the possibility that the ionised gas in the secondary neighbouring galaxy is actually illuminated by the primary AGN (Xu & Komossa 2009) as the narrow-line region is known to extend out to scales of several kiloparsec at this AGN luminosity (e.g. Hainline et al. 2013; Husemann et al. 2014). This may also explain the low equivalent width of H for the secondary nucleus in SDSS J11155423 despite the clear Seyfert-like emission-line ratios. Only 3D spectroscopy would allow us to map the entire ENLR structure.
5.3 AGN triggering in interacting systems
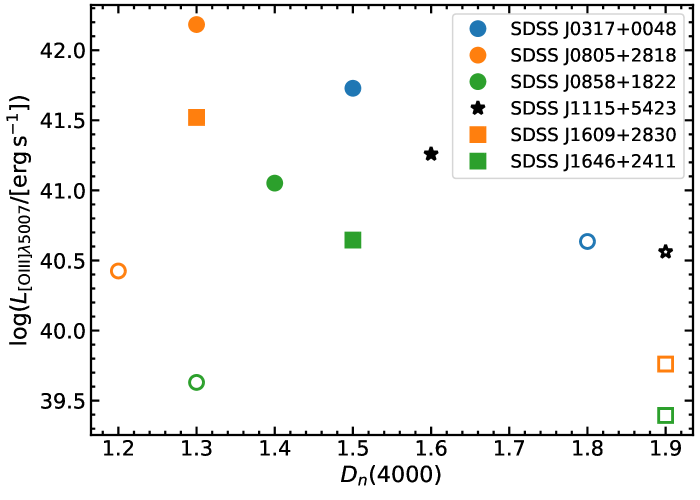
While it is difficult to explain the triggering of AGN, it has been suggested that radiatively efficient AGN are often associated with recent star formation activity in their host galaxies (e.g. Canalizo & Stockton 2000; González Delgado et al. 2001; Kauffmann et al. 2003a; Davies et al. 2007; Wild et al. 2010). One potential explanation for this connection is the common gas reservoir necessary for the two processes (e.g. Maiolino et al. 2007; Netzer 2009; Rosario et al. 2012; Mullaney et al. 2012; Chen et al. 2013; Hickox et al. 2014; Husemann et al. 2018). We therefore explore whether the nuclear activity in our interacting galaxies is linked to the star formation history in their host galaxies. Here we use the stellar index as a luminosity-weighted age indicator of the stellar population (e.g. Hamilton 1985; Poggianti & Barbaro 1997; Kauffmann et al. 2003b). Values correspond to stellar ages of Gyr and to Gyr adopting solar metallicities. In Fig. 8, we compare the [O iii] luminosity with the index.
We find that all primary nuclei with unambiguous signatures of an obscured Seyfert-like AGN are associated with very young stellar populations indicating recent or ongoing star formation activity. The secondary nuclei with ambiguous ionisation classifications exhibit significantly older stellar populations sometimes close to passive galaxies. The only exceptions are the secondary nuclei of SDSS J08052818 and SDSS J0858+1822, which can be explained by a weak, heavily obscured AGN in the first case and a star formation dominated region in the second case. On the other hand, the old stellar populations for the other secondary nuclei support the notion that post-AGB stars or shock-ionisation are likely the primary reasons for the gas excitation and not necessarily an embedded AGN. Overall, the stellar ages support the diversity of the emission-line diagnostics from the LBT spectra which challenge the original classification of dual AGN system from SDSS spectroscopy.
6 Conclusions
In this paper we analysed follow-up spatially resolved slit spectroscopy taken with MODS at the LBT of seven dual candidates with separations of a few arcsec previously identified in SDSS by Liu et al. (2011). Classical emission-line diagnostics based on the SDSS spectra suggest unambiguous obscured Seyfert-Seyfert pair classification in all cases, but our slit spectra reveal a much more diverse nature of the activity in the nuclei of the ongoing merging systems. We attribute the diagnostic difference between the SDSS and LBT observations due to the relatively large SDSS fibres. The spectra of the secondary nuclei are contaminated by spillover light from the primary nuclei due to the seeing at the time of observations and small separation of the nuclei. Considering multiple emission-line diagnostic diagrams together with age indicators of the stellar population shows that nearly all of the secondary nuclei are likely not AGN, but rather consistent with pure star formation or LINER-like emission potentially powered by post-AGB stars (e.g. Singh et al. 2013).
X-ray follow-up observations usually identified only one AGN in such SDSS-selected interacting systems, even for the large-separation source SDSS J11155423. Based on the original dual AGN classification the low X-ray fluxes for the secondary nuclei have been interpreted as a systematically lower X-ray–to–[O iii] ratio in interacting systems. We propose an alternative explanation that the secondary nuclei are not necessarily AGN, and therefore actually do not need to follow the classical X-ray–to–[O iii] correlations of AGN. In addition, heavy obscuration of the primary nuclei could also play a significant role in the interpretation of the ratio which require deep X-ray spectra to correct properly.
This study highlights the need for spatially resolved spectroscopy of such compact interacting galaxy systems to properly classify the activity in the independent nuclei. Hence, special care needs to be taken when interpreting fibre-based spectroscopy of small separation sources due to seeing effects, which also remains an issue for the ongoing and upcoming fibre-based surveys such as LAMOST, WEAVE, and 4MOST. In addition, a multi-wavelength approach is necessary to verify the activity types that are often ambiguous, even from high-quality rest-frame optical spectroscopy.
Acknowledgements.
We thank the anonymous referee for constructive feedback that improved the quality and clarity of the presented work. BH would like to thanks the European Space Agency (ESA) for the hospitality and financial support for a science visit at ESA/ESTEC in Noordwijk (Netherlands) part of this work has been conducted. SB and ADR acknowledges financial support from the Italian Space Agency (ASI) under grant ASI-INAF 2017-14-H.O. CV is grateful for financial support from ASI under the contracts ASI-INAF I/037/12/0 and ASI-INAF n.2017-14-H.0. This paper used data obtained with the MODS spectrographs built with funding from NSF grant AST-9987045 and the NSF Telescope System Instrumentation Program (TSIP), with additional funds from the Ohio Board of Regents and the Ohio State University Office of Research. All authors are members of the MAGNA team (www.issibern.ch/teams/agnactivity/Home.html) and acknowledge support from the International Space Science Institute (ISSI) in Bern, Switzerland. Funding for SDSS-III has been provided by the Alfred P. Sloan Foundation, the Participating Institutions, the National Science Foundation, and the U.S. Department of Energy Office of Science. The SDSS-III web site is http://www.sdss3.org/. SDSS-III is managed by the Astrophysical Research Consortium for the Participating Institutions of the SDSS-III Collaboration including the University of Arizona, the Brazilian Participation Group, Brookhaven National Laboratory, Carnegie Mellon University, University of Florida, the French Participation Group, the German Participation Group, Harvard University, the Instituto de Astrofisica de Canarias, the Michigan State/Notre Dame/JINA Participation Group, Johns Hopkins University, Lawrence Berkeley National Laboratory, Max Planck Institute for Astrophysics, Max Planck Institute for Extraterrestrial Physics, New Mexico State University, New York University, Ohio State University, Pennsylvania State University, University of Portsmouth, Princeton University, the Spanish Participation Group, University of Tokyo, University of Utah, Vanderbilt University, University of Virginia, University of Washington, and Yale University.References
- Abazajian et al. (2003) Abazajian, K., Adelman-McCarthy, J. K., Agüeros, M. A., et al. 2003, AJ, 126, 2081
- Abazajian et al. (2009) Abazajian, K. N., Adelman-McCarthy, J. K., Agüeros, M. A., et al. 2009, ApJS, 182, 543
- Baldwin et al. (1981) Baldwin, J. A., Phillips, M. M., & Terlevich, R. 1981, PASP, 93, 5
- Barrows et al. (2016) Barrows, R. S., Comerford, J. M., Greene, J. E., & Pooley, D. 2016, ApJ, 829, 37
- Barrows et al. (2013) Barrows, R. S., Sandberg Lacy, C. H., Kennefick, J., et al. 2013, ApJ, 769, 95
- Begelman et al. (1980) Begelman, M. C., Blandford, R. D., & Rees, M. J. 1980, Nature, 287, 307
- Bianchi et al. (2008) Bianchi, S., Chiaberge, M., Piconcelli, E., Guainazzi, M., & Matt, G. 2008, MNRAS, 386, 105
- Blanton et al. (2003) Blanton, M. R., Lin, H., Lupton, R. H., et al. 2003, AJ, 125, 2276
- Bogdanović et al. (2009) Bogdanović, T., Eracleous, M., & Sigurdsson, S. 2009, New A Rev., 53, 113
- Bondi & Pérez-Torres (2010) Bondi, M. & Pérez-Torres, M. A. 2010, ApJ, 714, L271
- Bondi et al. (2016) Bondi, M., Pérez-Torres, M. A., Piconcelli, E., & Fu, H. 2016, A&A, 588, A102
- Brinchmann et al. (2004) Brinchmann, J., Charlot, S., White, S. D. M., et al. 2004, MNRAS, 351, 1151
- Bruzual A. (1983) Bruzual A., G. 1983, ApJ, 273, 105
- Canalizo & Stockton (2000) Canalizo, G. & Stockton, A. 2000, AJ, 120, 1750
- Chen et al. (2013) Chen, C.-T. J., Hickox, R. C., Alberts, S., et al. 2013, ApJ, 773, 3
- Cid Fernandes et al. (2011) Cid Fernandes, R., Stasińska, G., Mateus, A., & Vale Asari, N. 2011, MNRAS, 413, 1687
- Cid Fernandes et al. (2010) Cid Fernandes, R., Stasińska, G., Schlickmann, M. S., et al. 2010, MNRAS, 403, 1036
- Comerford et al. (2015) Comerford, J. M., Pooley, D., Barrows, R. S., et al. 2015, ApJ, 806, 219
- Cui et al. (2012) Cui, X.-Q., Zhao, Y.-H., Chu, Y.-Q., et al. 2012, Research in Astronomy and Astrophysics, 12, 1197
- Dalton et al. (2014) Dalton, G., Trager, S., Abrams, D. C., et al. 2014, Society of Photo-Optical Instrumentation Engineers (SPIE) Conference Series, Vol. 9147, Project overview and update on WEAVE: the next generation wide-field spectroscopy facility for the William Herschel Telescope, 91470L
- Davies et al. (2007) Davies, R. I., Müller Sánchez, F., Genzel, R., et al. 2007, ApJ, 671, 1388
- de Jong et al. (2019) de Jong, R. S., Agertz, O., Berbel, A. A., et al. 2019, The Messenger, 175, 3
- De Rosa et al. (2019) De Rosa, A., Vignali, C., Bogdanović, T., et al. 2019, New A Rev., 86, 101525
- De Rosa et al. (2018) De Rosa, A., Vignali, C., Husemann, B., et al. 2018, MNRAS, 480, 1639
- Ellison et al. (2017) Ellison, S. L., Secrest, N. J., Mendel, J. T., Satyapal, S., & Simard, L. 2017, MNRAS, 470, L49
- Escala et al. (2004) Escala, A., Larson, R. B., Coppi, P. S., & Mardones, D. 2004, ApJ, 607, 765
- Fiacconi et al. (2013) Fiacconi, D., Mayer, L., Roškar, R., & Colpi, M. 2013, ApJ, 777, L14
- Fu et al. (2015) Fu, H., Myers, A. D., Djorgovski, S. G., et al. 2015, ApJ, 799, 72
- Fu et al. (2012) Fu, H., Yan, L., Myers, A. D., et al. 2012, ApJ, 745, 67
- Ge et al. (2012) Ge, J.-Q., Hu, C., Wang, J.-M., Bai, J.-M., & Zhang, S. 2012, ApJS, 201, 31
- González Delgado et al. (2001) González Delgado, R. M., Heckman, T., & Leitherer, C. 2001, ApJ, 546, 845
- Hainline et al. (2013) Hainline, K. N., Hickox, R., Greene, J. E., Myers, A. D., & Zakamska, N. L. 2013, ApJ, 774, 145
- Hamilton (1985) Hamilton, D. 1985, ApJ, 297, 371
- Hao et al. (2005) Hao, L., Strauss, M. A., Tremonti, C. A., et al. 2005, AJ, 129, 1783
- Heckman (1980) Heckman, T. M. 1980, A&A, 87, 152
- Hickox et al. (2014) Hickox, R. C., Mullaney, J. R., Alexander, D. M., et al. 2014, ApJ, 782, 9
- Hopkins et al. (2008) Hopkins, P. F., Hernquist, L., Cox, T. J., & Kereš, D. 2008, ApJS, 175, 356
- Hou et al. (2019) Hou, M., Liu, X., Guo, H., et al. 2019, ApJ, 882, 41
- Husemann et al. (2014) Husemann, B., Jahnke, K., Sánchez, S. F., et al. 2014, MNRAS, 443, 755
- Husemann et al. (2012) Husemann, B., Kamann, S., Sandin, C., et al. 2012, A&A, 545, A137
- Husemann et al. (2018) Husemann, B., Worseck, G., Arrigoni Battaia, F., & Shanks, T. 2018, A&A, 610, L7
- Kauffmann et al. (2003a) Kauffmann, G., Heckman, T. M., Tremonti, C., et al. 2003a, MNRAS, 346, 1055
- Kauffmann et al. (2003b) Kauffmann, G., Heckman, T. M., White, S. D. M., et al. 2003b, MNRAS, 341, 33
- Kewley et al. (2001) Kewley, L. J., Dopita, M. A., Sutherland, R. S., Heisler, C. A., & Trevena, J. 2001, ApJ, 556, 121
- Komossa et al. (2003) Komossa, S., Burwitz, V., Hasinger, G., et al. 2003, ApJ, 582, L15
- Koss et al. (2012) Koss, M., Mushotzky, R., Treister, E., et al. 2012, ApJ, 746, L22
- Lamastra et al. (2009) Lamastra, A., Bianchi, S., Matt, G., et al. 2009, A&A, 504, 73
- Liu et al. (2010) Liu, X., Shen, Y., Strauss, M. A., & Greene, J. E. 2010, ApJ, 708, 427
- Liu et al. (2011) Liu, X., Shen, Y., Strauss, M. A., & Hao, L. 2011, ApJ, 737, 101
- Maiolino et al. (2007) Maiolino, R., Shemmer, O., Imanishi, M., et al. 2007, A&A, 468, 979
- Marinucci et al. (2012) Marinucci, A., Bianchi, S., Nicastro, F., Matt, G., & Goulding, A. D. 2012, ApJ, 748, 130
- Mayer (2013) Mayer, L. 2013, Classical and Quantum Gravity, 30, 244008
- McGurk et al. (2015) McGurk, R. C., Max, C. E., Medling, A. M., Shields, G. A., & Comerford, J. M. 2015, ApJ, 811, 14
- Mullaney et al. (2012) Mullaney, J. R., Daddi, E., Béthermin, M., et al. 2012, ApJ, 753, L30
- Müller-Sánchez et al. (2015) Müller-Sánchez, F., Comerford, J. M., Nevin, R., et al. 2015, ApJ, 813, 103
- Netzer (2009) Netzer, H. 2009, ApJ, 695, 793
- Nevin et al. (2016) Nevin, R., Comerford, J., Müller-Sánchez, F., Barrows, R., & Cooper, M. 2016, ApJ, 832, 67
- Pogge et al. (2010) Pogge, R. W., Atwood, B., Brewer, D. F., et al. 2010, in Proc. SPIE, Vol. 7735, Ground-based and Airborne Instrumentation for Astronomy III, 77350A
- Poggianti & Barbaro (1997) Poggianti, B. M. & Barbaro, G. 1997, A&A, 325, 1025
- Reyes et al. (2008) Reyes, R., Zakamska, N. L., Strauss, M. A., et al. 2008, AJ, 136, 2373
- Rodriguez et al. (2006) Rodriguez, C., Taylor, G. B., Zavala, R. T., et al. 2006, ApJ, 646, 49
- Rosario et al. (2012) Rosario, D. J., Santini, P., Lutz, D., et al. 2012, A&A, 545, A45
- Rosario et al. (2010) Rosario, D. J., Shields, G. A., Taylor, G. B., Salviand er, S., & Smith, K. L. 2010, ApJ, 716, 131
- Schneider et al. (2010) Schneider, D. P., Richards, G. T., Hall, P. B., et al. 2010, AJ, 139, 2360
- Shen et al. (2011) Shen, Y., Liu, X., Greene, J. E., & Strauss, M. A. 2011, ApJ, 735, 48
- Shi et al. (2014) Shi, Z.-X., Luo, A. L., Comte, G., et al. 2014, Research in Astronomy and Astrophysics, 14, 1234
- Shields et al. (2012) Shields, G. A., Rosario, D. J., Junkkarinen, V., et al. 2012, ApJ, 744, 151
- Singh et al. (2013) Singh, R., van de Ven, G., Jahnke, K., et al. 2013, A&A, 558, A43
- Smith et al. (2010) Smith, K. L., Shields, G. A., Bonning, E. W., et al. 2010, ApJ, 716, 866
- Smith et al. (2012) Smith, K. L., Shields, G. A., Salviander, S., Stevens, A. C., & Rosario, D. J. 2012, ApJ, 752, 63
- Stasińska et al. (2008) Stasińska, G., Vale Asari, N., Cid Fernandes, R., et al. 2008, MNRAS, 391, L29
- Tremonti et al. (2004) Tremonti, C. A., Heckman, T. M., Kauffmann, G., et al. 2004, ApJ, 613, 898
- Ueda et al. (2015) Ueda, Y., Hashimoto, Y., Ichikawa, K., et al. 2015, ApJ, 815, 1
- Valdes et al. (2004) Valdes, F., Gupta, R., Rose, J. A., Singh, H. P., & Bell, D. J. 2004, ApJS, 152, 251
- Veilleux & Osterbrock (1987) Veilleux, S. & Osterbrock, D. E. 1987, ApJS, 63, 295
- Walcher et al. (2015) Walcher, C. J., Coelho, P. R. T., Gallazzi, A., et al. 2015, A&A, 582, A46
- Wang et al. (2009) Wang, J.-M., Chen, Y.-M., Hu, C., et al. 2009, ApJ, 705, L76
- Wang et al. (2019) Wang, M. X., Luo, A. L., Song, Y. H., et al. 2019, MNRAS, 482, 1889
- Weaver et al. (2018) Weaver, J., Husemann, B., Kuntschner, H., et al. 2018, A&A, 614, A32
- Wild et al. (2010) Wild, V., Heckman, T., & Charlot, S. 2010, MNRAS, 405, 933
- Woo et al. (2014) Woo, J.-H., Cho, H., Husemann, B., et al. 2014, MNRAS, 437, 32
- Xu & Komossa (2009) Xu, D. & Komossa, S. 2009, ApJ, 705, L20
- York et al. (2000) York, D. G., Adelman, J., Anderson, Jr., J. E., et al. 2000, AJ, 120, 1579