Hydrodynamic Simulations of Classical Novae; CO and ONe White Dwarfs are Supernova Ia Progenitors
Abstract:
Cataclysmic Variables (CVs) and Symbiotic Binaries are close (or not so close) binary star systems which contain both a white dwarf (WD) primary and a larger cooler secondary star that typically fills its Roche Lobe. The cooler star is losing mass through the inner Lagrangian point of the binary and a fraction of this material is accreted by the WD. Here we report on our hydrodynamic studies of the thermonuclear runaway (TNR) in the accreted material that ends in a Classical Nova explosion. We have followed the evolution of the TNRs on both carbon-oxygen (CO) and oxygen-neon (ONe) WDs. We report on 3 studies in this paper. First, simulations in which we accrete only solar matter using NOVA (our 1-D, fully implicit, hydro code). Second, we use MESA for similar studies in which we accrete only Solar matter and compare the results. Third, we accrete solar matter until the TNR is ongoing and then switch the composition in the accreted layers to a mixed composition: either 25% WD and 75% solar or 50% WD and 50% Solar. We find that the amount of accreted material is inversely proportional to the initial 12C abundance (as expected). Thus, accreting solar matter results in a larger amount of accreted material to fuel the outburst; much larger than in earlier studies where a mixed composition was assumed from the beginning of the simulation. Our most important result is that all these simulations eject significantly less mass than accreted and, therefore, the WD is growing in mass toward the Chandrasekhar Limit.
1 Introduction
The two major suggestions for the stars that explode as a Supernova of Type Ia (SN Ia) are the single degenerate (SD) scenario and the double degenerate (DD) scenario. In the SD scenario, a white dwarf (WD) in a close binary system accretes material from its companion and grows to the Chandrasekhar Limit. As it nears the Limit, an explosion is initiated in the core. The DD scenario assumes a merger or collision of two WDs occurs and the resulting explosion is observed as a SN Ia outburst. Although the SD scenario is capable of explaining most of the observed properties of SN Ia explosions via the delayed detonation hypothesis (Khokhlov, 1991; Kasen et al., 2009; Woosley & Kasen, 2011; Howell et al., 2009, and references therein), there are still no binary systems that have been confirmed as progenitors. It is also the case that the “zoo” of SNe Ia types is increasing as surveys find more and more members (e.g., White et al., 2015; Ruiter, 2020). Recent results (Cao et al., 2015; Olling et al., 2015), in the same issue of Nature, both favor and disfavor the SD scenario. Therefore, there are likely multiple channels of SN Ia progenitors and continuing study of the SD channel is warranted.
Reviews of the various proposals for SN Ia progenitors (Branch et al., 1995; Ruiter, 2020) producing a SN Ia, and the implications of their explosions can be found in Hillebrandt & Niemeyer (2000), Leibundgut (2000, 2001), Nomoto et al. (2003), and Howell (2011). More recently, a tremendous effort has gone into studies of their observed properties (cf., Hillebrandt & Leibundgut, 2003; Howell, 2010; Maoz et al., 2014; Ruiz-Lapuente, 2014).
New evidence in favor of continuing the studies of the SD scenario comes from the observations of SNIa 2011fe in M101. The exploding star was likely a carbon-oxygen (CO) WD (Nugent et al., 2011) with a companion that was probably on or near the main sequence (Li et al., 2011; Bloom et al., 2012). However, EVLA (Chomiuk et al., 2012) and optical (Bloom et al., 2012) observations have ruled out many types of cataclysmic variable (CV). Moreover, Schaefer & Pagnotta (2012) find no star (to stringent but not impossible limits) at the “center” of a SN Ia remnant in the LMC while Edwards et al. (2012) find a large number of stars near the “center” of a second LMC SN Ia remnant. In addition, HST studies of the spatial region from which SN 2011fe exploded, suggest that the progenitor had a luminosity less than erg s-1 (Graur et al., 2014), and Lundqvist et al. (2015) find no evidence for a remnant companion in late time observations of SN 2011fe and SN 2014J. While these observations rule out typical Supersoft X-ray sources (Kahabka & van den Heuvel, 1997), recent studies suggest that a CV progenitor could be fainter than that value (Newsham et al., 2014; Starrfield et al., 2012; Starrfield, 2014).
Further support for the SD channel, arises from the observations of V445 Pup (Nova Puppis 2000). There were no signs of hydrogen in the spectrum at any time during the outburst, especially just after discovery, but there were strong lines of carbon, helium, and other elements in the optically thick spectra (Wagner et al., 2001a, b; Henden et al., 2001; Lyke et al., 2001; Woudt & Steeghs, 2005; Woudt et al., 2009). Unfortunately, no one has yet done an abundance analysis of the early spectra to determine an upper limit to the amount of hydrogen that could be present in the ejected gases. Nevertheless, it is probably extremely small. Because the system was extremely luminous before the outburst, the secondary is thought to be a hydrogen deficient carbon star (Woudt et al., 2009). Since one of the defining characteristics of a SN Ia explosion is the absence of hydrogen or helium in the spectrum at any time during the outburst or decline, the existence of V445 Pup implies that mass transferring binaries exist in which hydrogen is absent at the time of the explosion and most of the helium is converted to carbon during the nova phase of evolution. The latest spectra show that this system is still in outburst and, therefore, it has not been possible to study the underlying system (Tomov et al., 2015).
In the next section (Section 2) we briefly discuss the two stellar evolution codes used in this study. We follow that with a discussion of the results with NOVA (Section 3) and MESA (Section 4). We continue with a discussion of the implications of our results for SN Ia progenitors (Section 5), discuss studies with a mixed composition (Section 6), and end with Conclusions (Section 7).
2 The Stellar Evolution Codes: NOVA and MESA
This section describes the two codes used in the studies presented in this paper. They are NOVA (Starrfield et al., 2009, 2016, 2019, and references therein) and MESA (Paxton et al., 2011, 2013, 2015, 2018, 2019, and references therein). NOVA is a one-dimensional (1-D), implicit, hydrodynamic, computer code which includes a nuclear reaction network that has been extended to 187 nuclei (up to 64Ge and including the reaction), the OPAL opacities (Iglesias & Rogers, 1996, and references therein), the Starlib nuclear reaction rates (Sallaska et al., 2013), the Timmes equations of state (Timmes & Arnett, 1999; Timmes & Swesty, 2000), and the nuclear reaction network solver developed by Hix & Thielemann (1999). NOVA also includes the Arnett et al. (2010) algorithm for mixing-length convection and the Potekhin electron conduction opacities described in (Cassisi et al., 2007, and references therein). These improvements have had the effect of changing the initial structures of the WDs so that they have smaller radii and larger surface gravities.
MESA solves the 1D fully coupled structure and composition equations governing stellar evolution. It is based on an implicit finite difference scheme with adaptive mesh refinement and sophisticated time step controls. State-of-the-art modules provide the equation of state, opacity, nuclear reaction rates, element diffusion, boundary conditions, and changes to the mass of the star (Paxton et al., 2011, 2013, 2015, 2018, 2019). MESA employs contemporary numerical approaches, supports shared memory parallelism based on OpenMP, and is written with present and future multi-core and multi-thread architectures in mind. MESA combines the robust, efficient, thread-safe numerical and physics modules for simulations of a wide range of stellar evolution scenarios ranging from very-low mass to massive stars. The equation of state is the 2005 update of the OPAL EOS (Rogers & Nayfonov, 2002) with an extension to lower temperatures and densities of the SCVH EOS (Saumon et al., 1995). This EOS is supplemented with the HELM EOS (Timmes & Swesty, 2000) and the PC EOS (Potekhin & Chabrier, 2010) for the regimes where they are valid. The choice of opacity is the OPAL opacities (Iglesias & Rogers, 1996) with the low temperature opacities of Ferguson et al. (2005) and the electron conduction opacities of Cassisi et al. (2007).
3 Simulations with NOVA
In this section we report on the first of two studies that investigated the consequence of a WD accreting stellar material with a solar composition from a secondary donor star. Many types of close binary systems with a WD primary have been suggested as the progenitors for SN Ia explosions, thus we have modeled accretion onto a wide range of WD masses with a wide range of accretion rates. NOVA was used to study the consequences of accretion onto WDs with masses of 0.4M⊙, 0.7M⊙, 1.0M⊙, 1.25M⊙, and 1.35M⊙ assuming only material with a solar composition. Two initial WD luminosities ( L⊙ and L⊙) and seven mass accretion rates ranging from M⊙ yr-1 to M⊙ yr-1 were used.
These fully implicit, time-dependent, calculations show that the sequences exhibit the Schwarzschild & Härm (1965) thin shell instability. All simulations resulted in a TNR which, in only a few cases, ejected some material, while the WD radius grew to cm. In general, the low mass WDs did not eject any material while the high mass WDs ejected a small fraction of their accreted material (a maximum of for the 1.25M⊙ sequences and ranging down to for the 0.7M⊙ sequences). Therefore, the WDs are growing in mass as a result of the accretion of solar composition material and no enrichment from core material.

Figure 1 shows the accretion time to the TNR for the sequences with accretion times short enough to simulate the inter-outburst times of recurrent novae. Note that Ṁ increases downward. As is well known, as the WD mass increases, the accretion time decreases for the same Ṁ. This is because higher mass WDs initiate the TNR with a smaller amount of accreted mass. Given the existence of recurrent novae and Symbiotic Novae with recurrence times ranging from a few years (U Sco) to about 20 years (RS Oph) or longer (T Pyx, V407 Cyg, and T CrB), Figure 1 shows that it is possible for recurrent novae to occur on WDs with masses as low as 0.7M⊙. Although it is often claimed that only the most massive WDs have recurrence times short enough to agree with the observations of recurrent novae, this is not the case and basing WD mass determinations for recurrent novae purely on short recurrence times is incorrect. Figure 1 demonstrates that it is also possible for a recurrent nova outburst to occur on a high mass WD for an extremely broad range of Ṁ. Finally, for the most massive WDs, the recurrence period can be less than a year which suggests that the “rapidly recurring” recurrent nova in M31 (M31N 2008-12a) which is outbursting about once per year and has opened up a large cavity in the ISM surrounding the system (Darnley et al., 2016, 2017b, 2017a, 2019; Henze et al., 2015, 2018) can be explained by our simulations. This system is neither X-ray nor UV luminous between outbursts and its existence argues against those investigators disparaging the SD scenario because they expect bright UV surroundings after a SN Ia outburst .
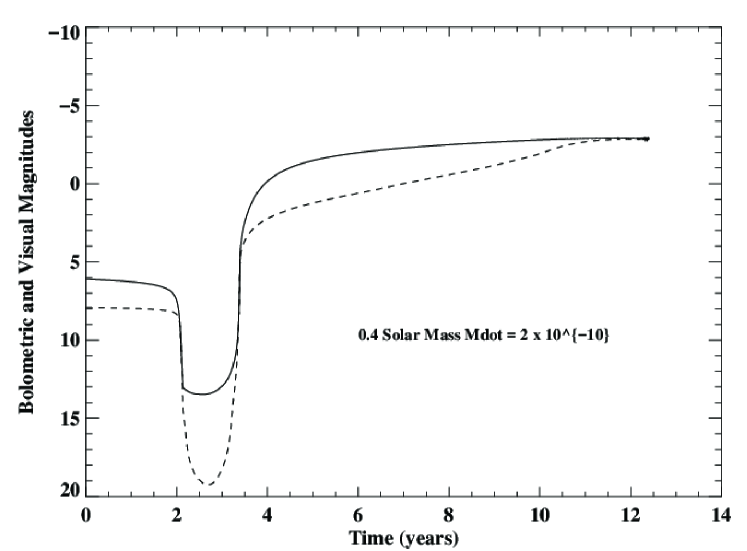
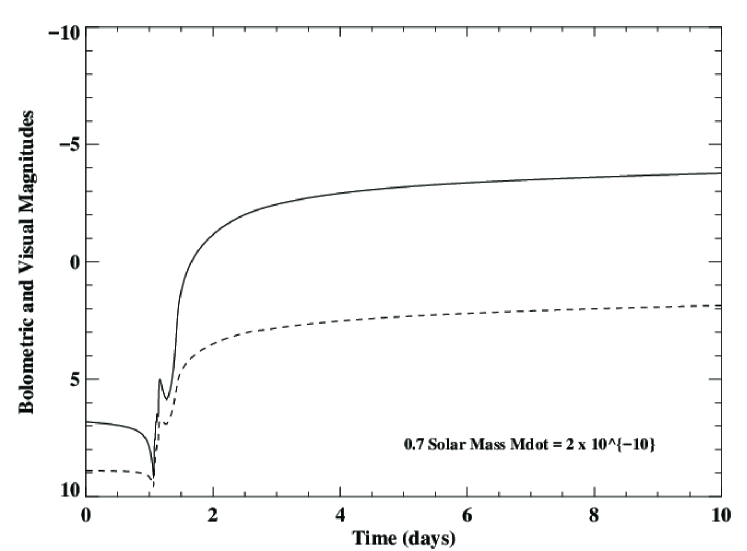
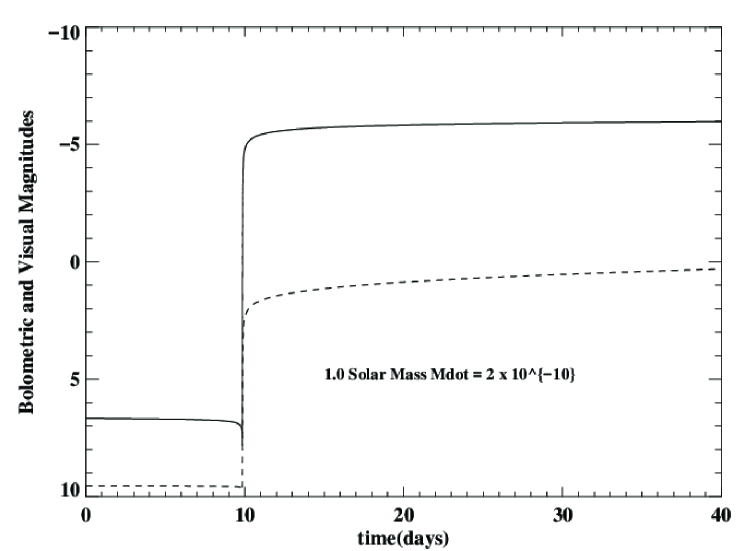
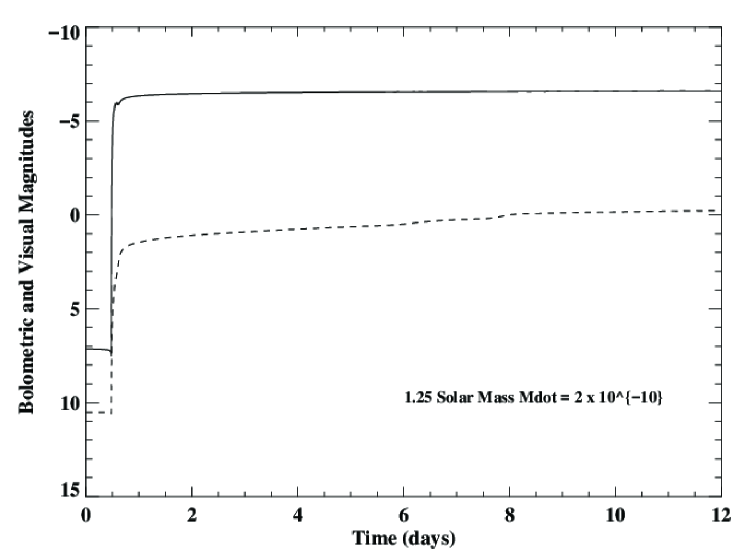
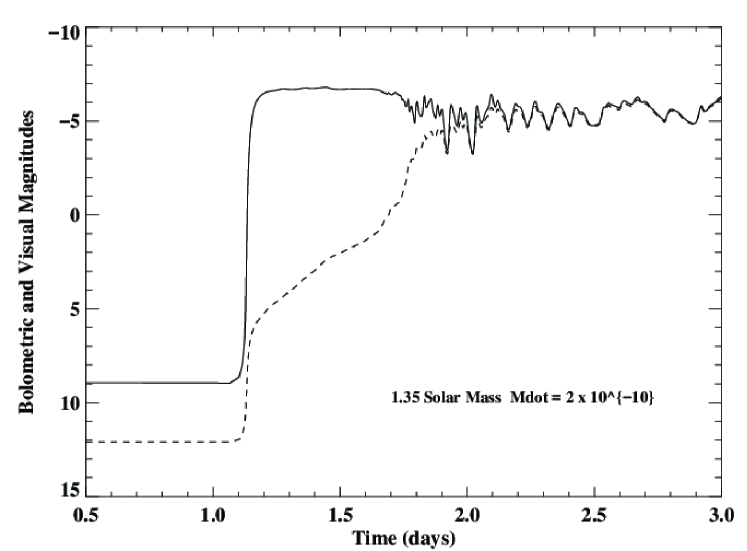
Figures 2 (0.4M⊙), 3 (0.7M⊙), 4 (1.0M⊙), 5 (1.25M⊙), and 6 (1.35M⊙), show the light curves for 5 simulations with the same Ṁ but different WD mass. The WD mass is given on each plot. In all cases shown, the mass accretion rate is M⊙yr-1. This value of Ṁ was chosen to obtain the largest amount of matter on the surface of the WD before the onset of the TNR which, in turn, should produce the highest temperatures, highest densities, highest energy generation rates, and eject the largest amount of material. The solid line in each plot is the evolution of the bolometric magnitude and the V magnitude is shown as the dashed line. While the initial models all had luminosities L⊙, because of their different radii, their effective temperatures ranged from 11,500 K for the 0.4M⊙ WD to 32,000 K for the 1.35M⊙ WD which can be seen in the initial differences between the values of the bolometric and visual magnitudes.
We stop the evolution when the outer radius reaches cm and the expanding material has become optically thin. The lower mass WD takes years to evolve to cm while the higher mass WDs take only days. The initial long decline and slow recovery in Figure 2 is caused by the conversion of some of the internal energy, produced by ongoing nuclear burning near the surface, into the potential energy necessary for the material to climb out of the gravitational well of the WD. The most extreme result is for the 0.4M⊙ WD for which it takes more than one year for the expanding material to recover and begin to become more luminous and hotter. As the mass of the WD increases, the time scale to the TNR decreases which can be seen in the accreted mass necessary to reach the TNR which ranges from M⊙ (0.4M⊙) to M⊙ (1.35M⊙).
While the simulations with NOVA were done with fully 1-D hydrodynamics, NOVA is only able to follow the first outburst on the WD. In all cases a TNR occurred and caused the outer layers to begin expanding to large radii. In a few cases the outermost mass zones reached escape velocity and became optically thin. The amount of material lost, if any, was tabulated but the escaping zones were not removed from the mass zoning because, even if they were escaping, they still exerted a numerical pressure on the underlying layers. If this ejected material were removed, excessive mass loss would have occurred. In summary, the NOVA results imply strongly that the WD is growing in mass as a result of accretion.
Nevertheless, it is important to do simulations that allow repeated outbursts on the WD and follow the secular evolution to see if the WD continues to grow in mass. We do this in the next section with MESA because it is capable of following multiple outbursts on an accreting WD and, thereby, determining if the WD is gaining in mass.
4 Simulations with MESA
The MESA (Paxton et al., 2011, 2013, 2015, 2018, 2019) studies followed the long term evolution of the WD as it accreted stellar material with a solar composition and experienced a large number of TNRs resulting in ejection, mass loss, and then the renewal of accretion. Therefore, the treatment of mass loss is important in following the long term behavior of the WDs, determining if mass growth occurs and, if so, how rapidly. In order to determine the effects of different mass loss prescriptions, the evolution of a 1.35M⊙ WD accreting at a rate of M⊙yr-1 was followed using three different mass loss prescriptions. These were (1) Eddington wind mass loss as described in Shaviv (2002); (2) determining the amount of mass ejected when the outer layers exceed the escape velocity, are optically thin, and the surface radius exceeds cm (this is the prescription in NOVA); and (3) Roche Lobe overflow with an assumed ejection rate of M⊙yr-1 at a radius of 1.0 R⊙. Two different atmospheres were used for the Eddington wind method. One was a grey atmosphere and the other was a WD atmosphere; both with an optical depth of twenty-five. A grey atmosphere was used for the other mass loss prescriptions.
The major differences in the results using these 3 mechanisms was that the accretion efficiency (defined as the mass accreted minus the mass lost divided by the mass accreted over a flash cycle) was 13% for the Eddington wind prescription (with little effect of the chosen atmosphere), 15% to 20% for Roche lobe overflow, and 90% for the method used in NOVA. Therefore, in comparison with the NOVA studies, the Eddington wind method ejects a larger amount of the accreted mass than NOVA so that the WD grows in mass more slowly. The Eddington wind method was used in the MESA calculations because it is more easily implemented for following repeated TNRs.
Initial WD masses of 0.7 M⊙, 1.0 M⊙ and 1.35 M⊙ were used. All WDs consisted of bare CO cores (C = 0.357, O = 0.619) at the beginning of accretion. The mass accretion rates were chosen to be M⊙yr-1, M⊙yr-1, M⊙yr-1, and M⊙yr-1. Other accretion rates were used, in order to separate different regimes of behavior, when needed. The composition of the accreted material was solar. All simulations were run for either many TNR cycles or the time required for long-term behavior to become evident.
Figure 7, shows a 0.7 M⊙ evolutionary sequence accreting at M⊙yr-1 that exhibits an initial flash and then settles into an extended period of slow growth where the luminosity is constant. The top panel shows the log of the luminosity as a function of time while the bottom panel shows the growth in mass over the same time period. The surface luminosity is close to that observed for the Super Soft Binary X-ray sources (Kahabka & van den Heuvel, 1997, and references therein) although the metallicity assumed to obtain the opacities was solar and not that of the LMC. The evolution of the WD, and the slow growth in mass, was followed for more than yr at which time the simulation was stopped. During this phase, the mass of the WD grew at a rate of M⊙yr-1.
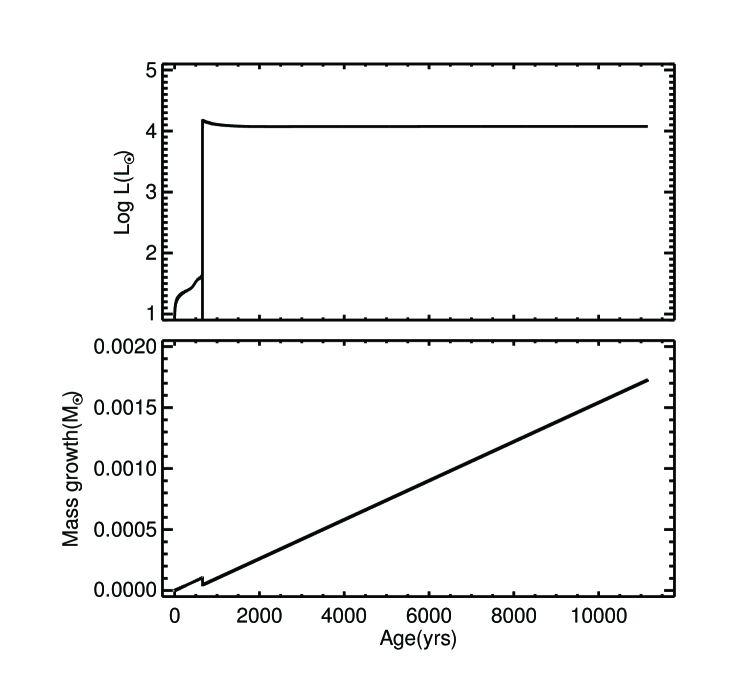
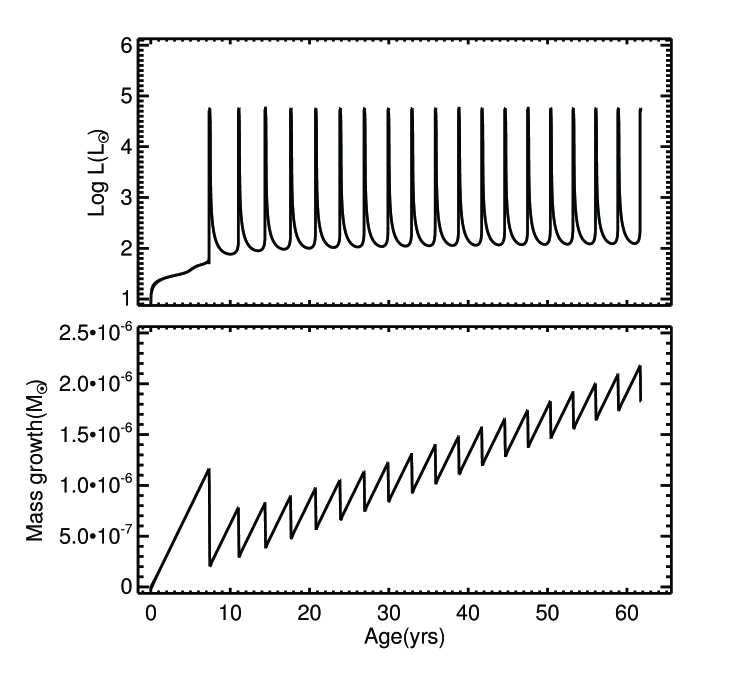
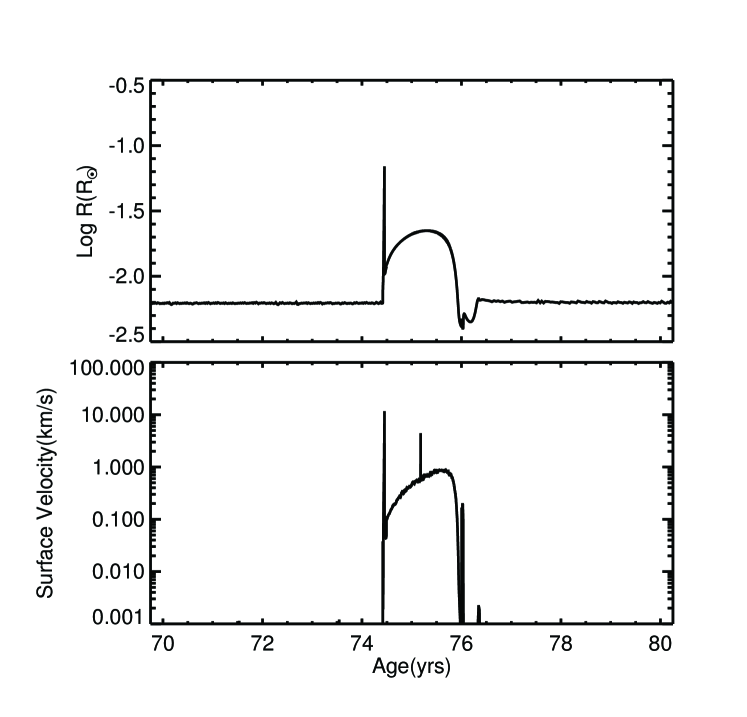
Figure 8 shows both the surface luminosity versus time (top panel) and the mass growth (bottom panel) for a 1.35 M⊙ WD accreting at M⊙yr-1. After the initial growth to the first TNR, the model settles into a recurring pattern of mass accretion resulting in TNRs which eject a fraction of the accreted mass via an Eddington wind. The positive slope shows that the WD is growing in mass at a rate of M⊙yr-1 for an accretion rate of M⊙yr-1. The recurrence time for this sequence is almost short enough to agree with that of the M31 recurrent nova that is outbursting almost once per year (Darnley et al., 2016, 2017b, 2017a, 2019; Henze et al., 2015, 2018).
While the evolution shown in Figure 8 implies that a 1.35M⊙ simulation can grow in mass with repeated hydrogen flashes, it is also interesting to see if accretion at a higher rate will cause the WD to grow in radius to that of a red giant as proposed by (Fujimoto, 1982a, b). Therefore, a higher Ṁ was chosen (M⊙yr-1) and while helium flashes occurred they did not eject any material. This is shown in Figure 9. After approximately seventy-five years of accretion, the WD undergoes a helium flash. The radius of the WD peaks at 0.056 R⊙ but the peak surface velocity reaches only 10 km s-1.
If this WD were in a CV system with a secondary that had a mass of 0.7M⊙ and a radius of 0.75 R⊙, it would fill its Roche Lobe if the system had a semi-major axis of 2.32R⊙ and a period of 6.9 hr. This gives a Roche Lobe radius for the WD primary of 1.01R⊙. However, the radius in this simulation never exceeded more than about 6% of this value during the helium flash. Therefore, such helium flashes do not stop the growth in the mass of the WD from either Roche Lobe overflow or envelope ejection. After the initial helium flash, the WD undergoes succeeding helium flashes roughly every 75 years. The WD continues to grow in mass at a rate of M⊙yr-1. The helium flashes are not violent because mass is being lost via an Eddington wind. Thus, a helium flash is not the dynamic mass ejection event that occurs with the mass loss prescription used in NOVA. In complementary helium accretion simulations with NOVA, large radii resulted from the initial TNR and further evolution was halted.
In Figure 10 the evolution of a 1.0 M⊙ WD also accreting at M⊙yr-1 is shown. The WD exhibits steady growth interrupted by a helium flash that again does not eject all the accreted material so that the WD is growing in mass. At lower accretion rates, the 0.7 M⊙, 1.0 M⊙, and 1.35M⊙ sequences also go through TNRs and mass loss events and the WD grows in mass. This is shown in Figure 11 which gives the growth rate in M⊙yr-1 as a function of Ṁ for 0.7M⊙ (solid line), 1.0M⊙ (dotted line), and 1.35M⊙ (dashed line) WDs. The lowest mass WDs are growing faster than the most massive WDs for the same Ṁ.

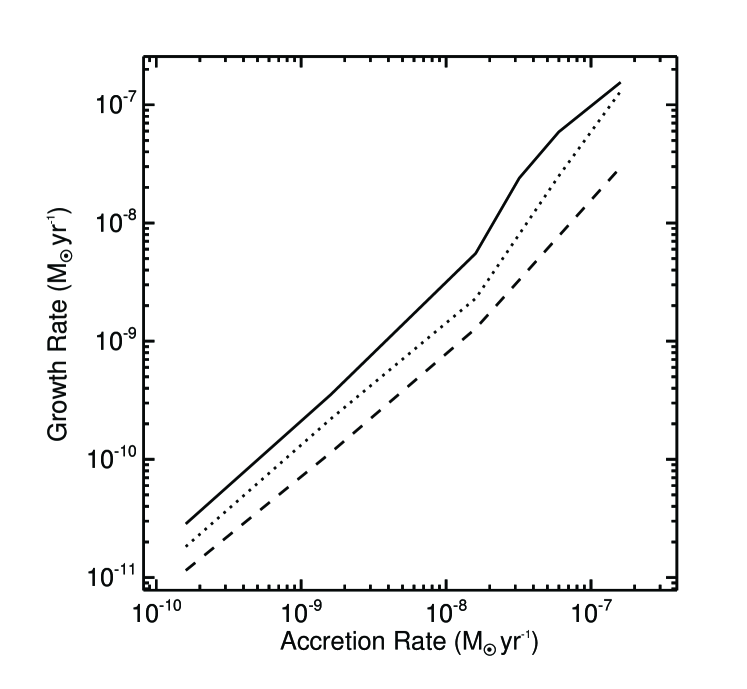
The growth rates (Figure 11) are much larger for the higher accretion rates at a given WD mass. For a given accretion rate, the lower mass WDs grow in mass at a greater rate than the more massive WDs. This is because the lower mass WDs must accrete more mass to reach the initial conditions for a TNR and, since they produce less nuclear energy, less mass is ejected. The 0.70M⊙ and 1.0M⊙ WDs, for accretion rates greater than M⊙yr-1, eventually become red giants at which point the simulation is ended. However, the 1.35M⊙ sequences, although exhibiting helium flashes, continue their mass growth at the higher accretion rates and never grow to red giant radii.
Using the results shown in Figure 11, we estimate the timescale for the growth of the WDs in CV systems to reach the Chandrasekhar Limit. The sequences that grow in radius to red giants (Ṁ greater than M⊙yr-1 on lower mass WDs) and also the lower accretion rate sequences which exhibit the most violent hydrogen flashes (Ṁ less than M⊙yr-1) are ignored in these figures. Using these constraints, the time for a 0.7M⊙ WD to reach the Chandrasekhar Limit ranges from yr to yr. The 1.0M⊙ WD will take yr to yr, and the 1.35M⊙ WD requires yr to yr. The shortest and longest evolution times vary by two orders of magnitude.
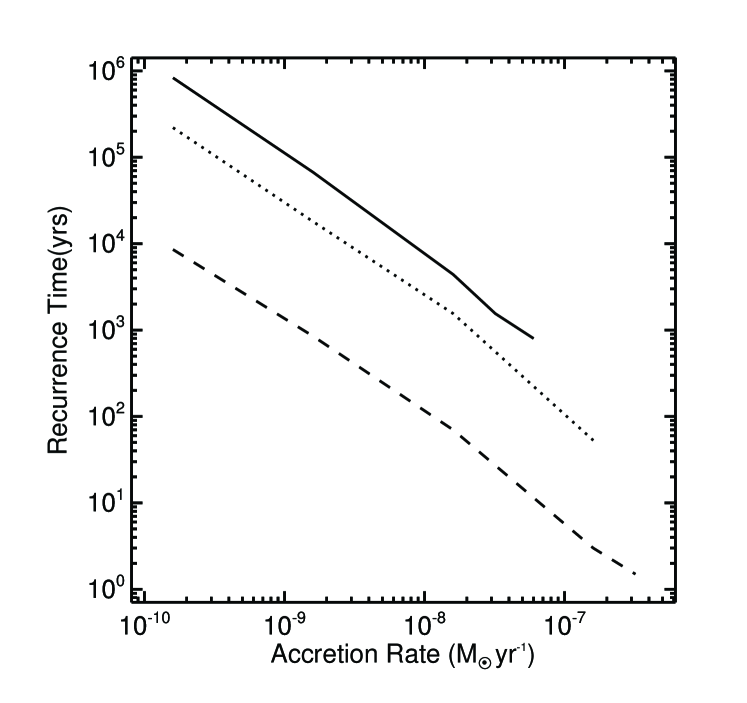
Figure 12 shows the recurrence time of the flashes versus the accretion rate (excluding the sequences that terminate as a red giant). For the 0.70M⊙ WD, the recurrence time spans some three orders of magnitude with the lowest accretion rate exhibiting the longest recurrence time. The 1.00M⊙ and 1.35M⊙ WD’s exhibit the same behavior with each higher mass being approximately one order of magnitude less in recurrence time at a given accretion rate. The evolutionary sequences span recurrence times from yr down to a year or less.
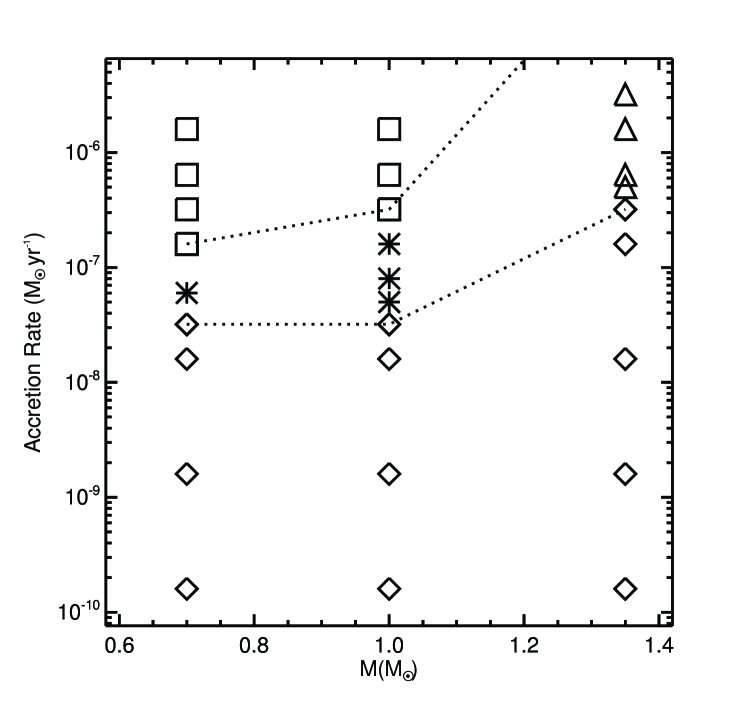
A summary of the MESA results is given in Figure 13 which has three main regions. At low accretion rates, all WD masses undergo a TNR. While mass is lost during the peak of the flash it is much less than that accreted to initiate the flash. This is the region below the lower dotted line in Figure 13 and each of the simulations is indicated by a “diamond”. At the highest accretion rates for the 0.70⊙ and 1.00M⊙ WDs, the evolutionary sequences, after an initial TNR enter a regime of slow growth in mass which is eventually terminated by the WD growing to red giant dimensions. The simulation is stopped because there is no accretion at these radii. These evolutionary sequences exist above the top dotted line in Figure 13. Nevertheless, the enlarged WD extends past the Roche Lobe radius of observed CVs and common envelope evolution could eject the outer layers and accretion begin again. However the Ṁ for these sequences is larger than typically observed for CVs. This behavior does not occur for 1.35M⊙ WDs. They experience helium flashes which do not eject all the accreted material and the WD continues to grow in mass.
The third regime, intermediate between the two dotted lines, is where slow growth in WD mass occurs for long times but the sequences eventually enter a regime of TNRs characteristic of a somewhat lower accretion rate (where the flashes occurred at the onset of accretion). The intermediate behavior is approximately bounded by accretion rates of M⊙yr-1 and M⊙yr-1. In virtually all sequences shown in Figure 13, the WD is growing in mass.
Finally, it is commonly assumed that a CO WD should not have a mass exceeding M⊙ (Iben, 1991; Ritossa et al., 1996; Iben et al., 1997). Our simulations in this paper, however, suggest that WDs are growing in mass, so that there should be massive CO WDs in CN systems. An example of this class is Nova LMC 1991, a CO nova, which exhibited a super Eddington luminosity for more than 2 weeks (Schwarz et al., 2001) likely requiring a WD mass exceeding M⊙. Moreover, the WDs in four of the nearest CVs [U Gem: 1.2 M⊙ (Echevarría et al., 2007), SS Cyg: 0.8 M⊙ (Sion et al., 2010), IP Peg: 1.16 M⊙ (Copperwheat et al., 2010), and Z Cam: 0.99 M⊙ (Shafter, 1983)] are more massive than the canonical value for single WDs of 0.6 M⊙ (Sion, 1986). In addition, Sion et al. (2019) report a WD mass for the recurrent nova CI Aql of 0.98 M⊙, Shara et al. (2018) report that the mean WD mass for 82 Galactic CNe is 1.13 M⊙ and for 10 recurrent novae is 1.31 M⊙, while Selvelli & Gilmozzi (2019) analyzed 18 old CNe, using data from both IUE and Gaia, and report that many WDs in CNe have masses above the canonical value for single WDs.
5 CNe and CVs are probably one Channel of SN Ia progenitors
Although of great importance to both galactic chemical evolution and, in addition, as probes of the evolution of the universe, the progenitors of SN Ia explosions are as yet unknown. Originally, the SD scenario, with the WD accreting from the secondary and growing in mass toward the Chandrasekhar Limit, was preferred. However, this scenario is now disfavored by many. The other scenario, the DD scenario, which involves either a merger or collision between two CO WDs, is now thought to be the major channel for SN Ia explosions. The switch in the preferred paradigm is caused by a number of perceived problems with the SD scenario that need to be understood. In this section we discuss four of those problems and show that they are, in fact, not problems at all.
The first major problem, which is directly relevant to the simulations presented in the earlier sections, is the common assumption, based on the analyses of the ejecta abundances and ejecta masses of CNe outbursts that the WD is decreasing in mass as a consequence of the TNR and resulting explosion. However, that assumption is incorrect for solar accretion as we have now shown in earlier sections of this manuscript. In addition, Starrfield et al. (2019) along with Hillman et al. (2015a, b, 2016) show that the WDs in CO CNe are also growing in mass. Moreover, we have now done simulations of ONe CNe and find that the WD in those systems is also gaining in mass (Starrfield et al. 2020, in preparation). Therefore for CVs in general the consequence of accretion are a growth in mass of the WD. One concern, nevertheless, is that the large number of CVs in the galaxy may result in too many SN Ia explosions. However, the mass of the secondary also determines the ultimate consequences of the evolution. It is possible that in many CV systems the secondary has too little mass and the outbursts will stop and the evolution will end before the WD has reached the Chandrasekhar Limit.
The second perceived problem is due to the interpretation of the calculations of Nomoto (1982) and Fujimoto (1982b, a). A reproduction of their results can be found as Figure 5 in Kahabka & van den Heuvel (1997) which shows that the space describing the consequences of mass accretion rate as a function of the mass of the accreting WD can be divided into three regions. Our version of their Figure 5 is Figure 13 and the data that we plot in Figure 13 is discussed in the last section. According to the results plotted in their Figure 5, for the lowest mass accretion rates, at all WD masses, they predict that accretion results in hydrogen flashes that resemble those of CNe and the WD is assumed to be losing mass. However, the purpose of this paper has been to provide a broad range of simulations at various Ṁ and WD mass (using two independent stellar evolution codes) which show that a WD accreting at low rates is gaining in mass. In addition, Hillman et al. (2015a, b, 2016) and we (Figure 13 ) have investigated the consequences of accretion at higher rates and again find that the WD is growing in mass. Thus, mass accreting systems with a broad range in WD mass and Ṁ must be included in the classes of SN Ia progenitors.
A third problem relates to the upper region on the Nomoto (1982) and the Fujimoto (1982b, a) plot, which shows the results for the highest accretion rates and predicts for all WD masses that the radius of the WD will grow rapidly to red giant dimensions, accretion will be halted, and any further evolution will await the collapse of the extended layers. These systems, therefore, cannot be SN Ia progenitors. However, we have done extensive studies of solar accretion onto WDs and our fully hydrodynamic studies show, for the highest mass accretion rates on the most massive WDs, steady hydrogen burning (see below) is occurring followed by recurring helium flashes. The helium flashes do not result in ejection and the WDs are again growing in mass. Hillman et al. (2015a, 2016) also report that helium flashes do not eject material.
The fourth problem is based on the existence of the intermediate regime identified by Nomoto (1982) and Fujimoto (1982b, a), where the material is predicted to burn steadily at the rate it is accreted. The central Ṁ of this region is nominally M⊙ yr-1 and it does have a slight variation with WD mass. Those systems that are accreting at the steady nuclear burning rate are supposedly evolving horizontally in this plot towards higher WD mass and, by some unknown mechanism, the mass transfer in the binary system is stuck in this mass accretion range. van den Heuvel et al. (1992) predicted that it was only the systems in this region that were SN Ia progenitors via the SD scenario, They identified the Super Soft X-ray sources (SSS) as those systems, based on their luminosities and effective temperatures. The SSS are , massive, WDs discovered by ROSAT (Trümper et al., 1991). They are binaries, with luminosities Lerg s-1 and effective temperatures ranging from K (Cowley et al., 1998; Branch et al., 1995; Kahabka & van den Heuvel, 1997).
However, in more recent studies of accretion without mixing, an expanded study of the stability of thin shells can be found in (Yoon et al., 2004, and references therein), who investigated the accretion of helium-rich and hydrogen-rich material onto WDs. Their results show that sequences in the steady nuclear burning regime begin in a stable region, but with continued accretion, evolve into instability. In addition, their study shows that the evolutionary sequences at these Ṁ exhibit the Schwarzschild & Härm (1965) thin shell instability, which implies that steady burning does not occur. We identify these systems, therefore, with those CVs (dwarf, recurrent, symbiotic novae) that show no core material either on the surface of the WD or in their ejecta.
Given that the SSS were the only systems that were predicted to be SD Ia progenitors, it was expected that they would be detected by consequences of the long periods of luminous X-ray and UV emission on the surrounding ISM. In addition, this extreme emission should still be evident in the ISM surrounding recent SN Ia explosions. For example, Graur & Woods (2019) state: ”For the WD to efficiently grow in mass, the accreted hydrogen must undergo stable nuclear-burning on its surface. This means the progenitor system will be a luminous source of soft X-ray emission (a supersoft X-ray source, SSS, van den Heuvel et al., 1992) for at least some period of time before the explosion.” Similar statements can also be found in Gilfanov & Bogdán (2010) and Kuuttila et al. (2019). Such emission has not been found and the absence of evidence has been used to eliminate the SD scenario even in the most recent studies. However, observations of CNe and CVs, which we now identify as possible SN Ia progenitors, show that they do not spend a large amount of time at high luminosities and effective temperatures.
Moreover, some recurrent novae are repeating sufficiently often that their WDs must have grown in mass so that they are now close to the Chandrasekhar Limit. One such system is the “rapidly recurring” recurrent nova in M31 (M31N 2008-12a) which is outbursting about once per year and has opened up a large cavity in the ISM surrounding the system (Darnley et al., 2016, 2017b, 2017a, 2019; Henze et al., 2015, 2018). It is neither X-ray nor UV luminous between outbursts.
6 New Studies with Mixed Compositions
In the previous sections we described the consequences of TNRs on WDs where no mixing of the accreted solar material with WD material was assumed. In this section we briefly describe new studies of the consequences of TNRs that result when mixing of accreted material with WD core material occurs. While almost all of the earlier studies assumed that the accreting material mixed immediately with WD material, we have now altered how and when we assume the mixing occurs. The reason is that if we assume mixing occurs from the beginning of the simulation the resulting simulations do not agree with the observations. The basic reason is that once the accreting envelope has been enriched, the increased opacity traps more of the heat from compression and nuclear burning in the accreted layers. This, in turns, causes the temperature to rise more rapidly per unit accreted material and the TNR occurs earlier with less material accreted than if no mixing had occurred (Starrfield et al., 1998, 2016).
Fortunately, the recent multi-dimensional studies of convection in the accreted layers of WDs (Casanova et al., 2010a, b, 2011a, 2011b, 2016, 2018; José, 2014; José et al., 2020, and references therein) implied that we could reasonably approximate their results by accreting a hydrogen-rich (solar abundances) layer and then switch to a mixed composition once the TNR was underway and convection had begun. A similar technique has already been used by José et al. (2007) who explored a variety of time scales for mixing the WD material into the accreted layers, once convection was underway, and found that using short time scales was warranted. Our initial studies, using a similar technique, suggested that accretion with mixing of WD with solar material onto CO WDs, resulted in CNe explosions where the WD was growing in mass (Starrfield et al., 2017, 2018a, 2018b).
Therefore, we have now used NOVA to study the consequences of TNRs on WDs of various masses using three different compositions (Starrfield et al., 2019). In all cases we find that more mass is accreted than ejected and, therefore, the WD is growing in mass. We now switch to a mixed composition once the TNR is ongoing and a major fraction of the accreted material is convective. This technique provides a range of model outcomes that are more compatible with observed CNe physical parameters reported in the literature. The simulations with 25% WD matter and 75% solar matter appear to fit the observations somewhat better than those with 50% WD matter and 50% solar matter.
Nevertheless, NOVA is able to only follow one outburst and reaching close to the Chandrasekhar Limit requires many such cycles of accretion-TNR-ejection-accretion. While this has yet to be done with either CO or ONe enriched material (this may have been done in the study of (Rukeya et al., 2017) but they only reported their ejected mass not the accreted mass), multi-cycle evolution and the growth in mass of the WD has been done with solar accretion studies (Starrfield, 2014; Hillman et al., 2015a, b, 2016; Starrfield, 2017). The multi-cycle studies reported in Starrfield (2014), Starrfield (2017), and this work were done with MESA (Paxton et al., 2011, 2013, 2018, and references therein) while those described by Hillman et al. (2015a) and Hillman et al. (2016) were done with the code of (Kovetz et al., 2009, and references therein). Given these studies with multiple codes, therefore, we feel that our single outburst result implies that the consequences of the CN outburst is the growth in mass of the WD under all situations.
Of great importance, some of the ejected isotope abundances in the simulations also fit the isotopic ratios measured for some pre-solar grains suggesting that these grains come from CNe ejecta (Pepin et al., 2011; Bose & Starrfield, 2019a, b; Iliadis et al., 2018). Pepin et al. (2011) studied the neon and helium abundances in cometary dust and identified grains with probable CNe origins. Bose & Starrfield (2019a, b) compared the compositions of 30 pre-solar SiC grains with predicted isotopic abundances. The simulations with 25% WD matter and 75% solar matter and with CO WD masses from 0.8 M⊙ to 1.35 M⊙ provided the best fits to the measured isotopic data for four SiC grains. In addition, one grain matched the 50% WD and 50% solar 1.35 M⊙ simulation. Iliadis et al. (2018) reported on a Monte Carlo technique, that involved the random sampling over the most important nova model parameters: the WD composition; the mixing of the outer WD layers with the accreted material before the explosion; the peak temperature and density; the explosion timescales; and the possible dilution of the ejecta after the outburst. They identified 18 pre-solar grains with measured isotopic signatures consistent with a CO nova origin, without assuming any dilution of the ejecta. These results emphasize our contention that CNe ejected matter was present during the formation of the solar system.
More recently, we have compared the isotope abundances from these CO and ONe nova simulations to the O-anomalous pre-solar dust grains with oxide and silicate chemistries. A smaller fraction of the O-anomalous pre-solar grains in meteorites include those with very large 17O excesses (17O/16O ) and small to moderate depletions in 18O. These grains were classified as extreme Group 1 grains. The previous models (José et al., 2004) that made the case for both CO and ONe novae being suitable sites for extreme Group 1 grains (Vollmer et al., 2008; Nittler et al., 2008; Gyngard et al., 2010) failed to explain the exact compositions of the extreme Group 1 grains but instead suggested a mixing between the nova ejecta and the surrounding medium. The 0.8 M⊙ and 1.0 M⊙ WD simulations can ideally explain the entire range of observed oxygen isotope compositions with variable amounts (5 to 80%) of CN ejecta. These same mixing models, however, cannot explain the silicon or magnesium grain compositions of the pre-solar grains. Alternatively, the only case that works reasonably well for silicon and magnesium isotope compositions of extreme Group 1 grains is the 0.6 M⊙ CO WD MDTNR simulations. It can explain the small enrichments (up to 100 ‰) observed for 30Si and up to 1000 ‰ enrichments observed for magnesium isotope compositions. However, these simulations cannot explain the oxygen isotope compositions. It underproduces both 17O and 18O compared to 16O. 17O production by explosive proton burning is common in nova explosions but additional 18O production is required to explain the extreme Group 1 grain compositions. 18O is produced by helium-burning that would occur in He novae (e.g., V445 Pup that shows no hydrogen lines). Extreme Group 1 grains can potentially form in He novae but these binary systems need to be modeled. Alternatively, 18O production may occur in the secondary carbon star, which is subsequently accreted onto the WD and takes part in grain condensation.
7 Conclusions
We have described the thermonuclear evolution that occurs as a consequence of accretion onto WDs assuming all compositions (solar, CO, and ONe), WD masses, and mass accretion rates. If the SD scenario for the progenitors of SN Ia is valid, then the growth of a CO or ONe WD to the Chandrasekhar Limit is required. This, in turn, requires that more material remain on a WD after a TNR than is ejected by the TNR. The hydrodynamic simulations of accretion onto WDs show that a TNR always occurs. We have evolved a broad range in WD mass (0.4 M⊙ to 1.35 M⊙) with NOVA , assuming a solar composition, and found that the maximum amount of ejected material () occurs for the 1.25M⊙ sequences and decreases to for the 0.7M⊙ sequences. Therefore, the WDs are growing in mass as a consequence of the accretion of solar material. Finally, the time to the TNR is sufficiently short that Recurrent Novae could occur on a much broader range of WD mass than heretofore believed. We have also done simulations, using NOVA, of TNRs on both CO (Starrfield et al., 2019) and ONe (Starrfield et al. 2020, in preparation) WDs with the same results.
The simulations done with MESA allowed us to study the effects of repeated TNRs on WDs of various masses and Ṁ. Figure 13 illustrates the main conclusions from this second part of the study. It shows the parameter space investigated with MESA in terms of WD mass and accretion rate and that the WD mass is growing for virtually all reasonable WD masses and Ṁ (in the sense of observed CV accretion rates). We identify the different regimes of behavior in the simulations reported here and show that, for a large range of accretion rates, the WDs grow in mass and that it is possible for a WD to start off with a mass as low as 0.70M⊙ and, given sufficient time, reach 1.35M⊙ and higher. The 1.35M⊙ sequences never become red giants and despite recurrent hydrogen and helium flashes their growth in mass continues through the simulations. Therefore, once an accreting WD reaches a mass of 1.35⊙ it will continue growing in mass for all accretion rates that were studied and could eventually reach the Chandrasekhar Limit. We emphasize that the high accretion rates on lower mass WDs that end with growth to red giant dimensions are larger than observed for typical CVs.
We find that the helium flashes in these simulations are insufficiently powerful to eject mass and offset the mass growth. For the WD simulations that grow in mass, the timescale for reaching the Chandrasekhar Limit varies by two orders of magnitude. This timescale depends on the WD mass and Ṁ and varies from yr to yr.
Finally, we conclude that the SD scenario is a viable channel for progenitors of SN Ia explosions. However, continuous accretion at high rates onto lower mass WDs should cause them to be extremely luminous and this is probably ruled out by the observations. The only systems that might be accreting at these high rates are the Super Soft Binary X-ray Sources originally discovered in the LMC. These systems are binaries, with luminosities Lerg s-1 and effective temperatures ranging from K. If the WDs are sufficiently massive, and the accreting material is not mixing with core material, then these results also suggest that the WDs in these systems are growing in mass.
8 Acknowledgements
We acknowledge useful discussion and encouragement from M. Darnley, E. Aydi, J. José, M. Hernanz, A. Heger, S. Kafka, L. Izzo, P. Molaro, M. Orio, M. della Valle, A. Shafter and the attendees at EWASS18, COSPAR 2018, and HEAD 2019 for their comments. This work was supported in part by NASA under the Astrophysics Theory Program grant 14-ATP14-0007 and the U.S. DOE under Contract No. DE-FG02- 97ER41041. SS acknowledges partial support from NASA, NSF and HST grants to ASU, WRH is supported by the U.S. Department of Energy, Office of Nuclear Physics, and CEW acknowledges support from NASA and NSF. SS thanks F. Giovanelli for inviting him to give this talk.
References
- Arnett et al. (2010) Arnett, D., Meakin, C., & Young, P. A. 2010, ApJ, 710, 1619
- Bloom et al. (2012) Bloom, J. S., Kasen, D., Shen, K. J., et al. 2012, ApJ Let., 744, L17
- Bose & Starrfield (2019a) Bose, M., & Starrfield, S. 2019a, ApJ, 873, 14
- Bose & Starrfield (2019b) —. 2019b, ApJ, 873, 14
- Branch et al. (1995) Branch, D., Livio, M., Yungelson, L. R., Boffi, F. R., & Baron, E. 1995, PASP, 107, 1019
- Cao et al. (2015) Cao, Y., Kulkarni, S. R., Howell, D. A., et al. 2015, Nature, 521, 328
- Casanova et al. (2010a) Casanova, J., José, J., García-Berro, E., Calder, A., & Shore, S. N. 2010a, A&A, 513, L5+
- Casanova et al. (2010b) —. 2010b, A&A, 513, L5
- Casanova et al. (2011a) —. 2011a, A&A, 527, A5
- Casanova et al. (2016) Casanova, J., José, J., García-Berro, E., & Shore, S. N. 2016, A&A, 595, A28
- Casanova et al. (2011b) Casanova, J., José, J., García-Berro, E., Shore, S. N., & Calder, A. C. 2011b, Nature, 478, 490
- Casanova et al. (2018) Casanova, J., José, J., & Shore, S. N. 2018, A&A, 619, A121
- Cassisi et al. (2007) Cassisi, S., Potekhin, A. Y., Pietrinferni, A., Catelan, M., & Salaris, M. 2007, ApJ, 661, 1094
- Chomiuk et al. (2012) Chomiuk, L., Soderberg, A. M., Moe, M., et al. 2012, ApJ, 750, 164
- Copperwheat et al. (2010) Copperwheat, C. M., Marsh, T. R., Dhillon, V. S., et al. 2010, Mon. Not. R. Astron. Soc., 402, 1824
- Cowley et al. (1998) Cowley, A. P., Schmidtke, P. C., Crampton, D., & Hutchings, J. B. 1998, ApJ, 504, 854
- Darnley et al. (2016) Darnley, M. J., Henze, M., Bode, M. F., et al. 2016, ApJ, 833, 149
- Darnley et al. (2017a) Darnley, M. J., Hounsell, R., Godon, P., et al. 2017a, ApJ, 849, 96
- Darnley et al. (2017b) —. 2017b, ApJ, 847, 35
- Darnley et al. (2019) Darnley, M. J., Hounsell, R., O’Brien, T. J., et al. 2019, Nature, 565, 460
- Echevarría et al. (2007) Echevarría, J., de la Fuente, E., & Costero, R. 2007, AJ, 134, 262
- Edwards et al. (2012) Edwards, Z. I., Pagnotta, A., & Schaefer, B. E. 2012, ApJ Let., 747, L19
- Ferguson et al. (2005) Ferguson, J. W., Alexander, D. R., Allard, F., et al. 2005, ApJ, 623, 585
- Fujimoto (1982a) Fujimoto, M. Y. 1982a, ApJ, 257, 767
- Fujimoto (1982b) —. 1982b, ApJ, 257, 752
- Gilfanov & Bogdán (2010) Gilfanov, M., & Bogdán, Á. 2010, Nature, 463, 924
- Graur et al. (2014) Graur, O., Maoz, D., & Shara, M. M. 2014, Mon. Not. R. Astron. Soc., 442, L28
- Graur & Woods (2019) Graur, O., & Woods, T. E. 2019, Mon. Not. R. Astron. Soc., 484, L79
- Gyngard et al. (2010) Gyngard, F., Nittler, L., Zinner, E., & Jose, J. 2010, in Nuclei in the Cosmos, 141
- Henden et al. (2001) Henden, A. A., Wagner, R. M., & Starrfield, S. G. 2001, IAU Circulars, 7730, 1
- Henze et al. (2015) Henze, M., Darnley, M. J., Kabashima, F., et al. 2015, A&A, 582, L8
- Henze et al. (2018) Henze, M., Darnley, M. J., Williams, S. C., et al. 2018, ApJ, 857, 68
- Hillebrandt & Leibundgut (2003) Hillebrandt, W., & Leibundgut, B., eds. 2003, From twilight to highlight : the physics of supernovae : proceedings of the ESO/MPA/MPE workshop held at Garching, Germany, 29-31 July 2002
- Hillebrandt & Niemeyer (2000) Hillebrandt, W., & Niemeyer, J. C. 2000, ARAA, 38, 191
- Hillman et al. (2015a) Hillman, Y., Prialnik, D., Kovetz, A., & Shara, M. M. 2015a, in Astronomical Society of the Pacific Conference Series, Vol. 493, 19th European Workshop on White Dwarfs, ed. P. Dufour, P. Bergeron, & G. Fontaine, 553
- Hillman et al. (2015b) Hillman, Y., Prialnik, D., Kovetz, A., & Shara, M. M. 2015b, Mon. Not. R. Astron. Soc., 446, 1924
- Hillman et al. (2016) —. 2016, ApJ, 819, 168
- Hix & Thielemann (1999) Hix, W. R., & Thielemann, F.-K. 1999, ApJ, 511, 862
- Howell (2010) Howell, D. A. 2010, Nature, 463, 35
- Howell (2011) —. 2011, Nature Communications, 2
- Howell et al. (2009) Howell, D. A., Conley, A., Della Valle, M., et al. 2009, ArXiv e-prints: White Paper Submitted to the Astro 2010 Decadel Survey
- Iben (1991) Iben, Jr., I. 1991, ApJS, 76, 55
- Iben et al. (1997) Iben, Icko, J., Ritossa, C., & García-Berro, E. 1997, ApJ, 489, 772
- Iglesias & Rogers (1996) Iglesias, C. A., & Rogers, F. J. 1996, ApJ, 464, 943
- Iliadis et al. (2018) Iliadis, C., Downen, L. N., José, J., Nittler, L. R., & Starrfield, S. 2018, ApJ, 855, 76
- José (2014) José, J. 2014, in Astronomical Society of the Pacific Conference Series, Vol. 490, Stella Novae: Past and Future Decades, ed. P. A. Woudt & V. A. R. M. Ribeiro, 275
- José et al. (2007) José, J., García-Berro, E., Hernanz, M., & Gil-Pons, P. 2007, ApJ Let., 662, L103
- José et al. (2004) José, J., Hernanz, M., Amari, S., Lodders, K., & Zinner, E. 2004, ApJ, 612, 414
- José et al. (2020) José, J., Shore, S. N., & Casanova, J. 2020, A&A, 634, A5
- Kahabka & van den Heuvel (1997) Kahabka, P., & van den Heuvel, E. P. J. 1997, ARAA, 35, 69
- Kasen et al. (2009) Kasen, D., Röpke, F. K., & Woosley, S. E. 2009, Nature, 460, 869
- Khokhlov (1991) Khokhlov, A. M. 1991, A&A, 245, 114
- Kovetz et al. (2009) Kovetz, A., Yaron, O., & Prialnik, D. 2009, Mon. Not. R. Astron. Soc., 395, 1857
- Kuuttila et al. (2019) Kuuttila, J., Gilfanov, M., Seitenzahl, I. R., Woods, T. E., & Vogt, F. P. A. 2019, Mon. Not. R. Astron. Soc., 484, 1317
- Leibundgut (2000) Leibundgut, B. 2000, Astr. & Astrophys. Review, 10, 179
- Leibundgut (2001) —. 2001, ARAA, 39, 67
- Li et al. (2011) Li, W., Bloom, J. S., Podsiadlowski, P., et al. 2011, Nature, 480, 348
- Lundqvist et al. (2015) Lundqvist, P., Nyholm, A., Taddia, F., et al. 2015, A&A, 577, A39
- Lyke et al. (2001) Lyke, J. E., Woodward, C. E., Gehrz, R. D., et al. 2001, in Bulletin of the American Astronomical Society, Vol. 33, American Astronomical Society Meeting Abstracts #198, 803
- Maoz et al. (2014) Maoz, D., Mannucci, F., & Nelemans, G. 2014, ARAA, 52, 107
- Newsham et al. (2014) Newsham, G., Starrfield, S., & Timmes, F. X. 2014, in Astronomical Society of the Pacific Conference Series, Vol. 490, Stella Novae: Past and Future Decades, ed. P. A. Woudt & V. A. R. M. Ribeiro, 287
- Nittler et al. (2008) Nittler, L. R., Alexander, C. M. O., Gallino, R., et al. 2008, ApJ, 682, 1450
- Nomoto (1982) Nomoto, K. 1982, ApJ, 253, 798
- Nomoto et al. (2003) Nomoto, K., Uenishi, T., Kobayashi, C., et al. 2003, in From Twilight to Highlight: The Physics of Supernovae, ed. W. Hillebrandt & B. Leibundgut, 115–+
- Nugent et al. (2011) Nugent, P. E., Sullivan, M., Cenko, S. B., et al. 2011, Nature, 480, 344
- Olling et al. (2015) Olling, R. P., Mushotzky, R., Shaya, E. J., et al. 2015, Nature, 521, 332
- Paxton et al. (2011) Paxton, B., Bildsten, L., Dotter, A., et al. 2011, ApJS, 192, 3
- Paxton et al. (2013) Paxton, B., Cantiello, M., Arras, P., et al. 2013, ApJS, 208, 4
- Paxton et al. (2015) Paxton, B., Marchant, P., Schwab, J., et al. 2015, ApJS, 220, 15
- Paxton et al. (2018) Paxton, B., Schwab, J., Bauer, E. B., et al. 2018, ApJS, 234, 34
- Paxton et al. (2019) Paxton, B., Smolec, R., Schwab, J., et al. 2019, ApJS, 243, 10
- Pepin et al. (2011) Pepin, R. O., Palma, R. L., Gehrz, R. D., & Starrfield, S. 2011, ApJ, 742, 86
- Potekhin & Chabrier (2010) Potekhin, A. Y., & Chabrier, G. 2010, Contributions to Plasma Physics, 50, 82
- Ritossa et al. (1996) Ritossa, C., Garcia-Berro, E., & Iben, Jr., I. 1996, ApJ, 460, 489
- Rogers & Nayfonov (2002) Rogers, F. J., & Nayfonov, A. 2002, ApJ, 576, 1064
- Ruiter (2020) Ruiter, A. J. 2020, arXiv e-prints, arXiv:2001.02947
- Ruiz-Lapuente (2014) Ruiz-Lapuente, P. 2014, New Astronomy Reviews, 62, 15
- Rukeya et al. (2017) Rukeya, R., Lü, G., Wang, Z., & Zhu, C. 2017, PASP, 129, 074201
- Sallaska et al. (2013) Sallaska, A. L., Iliadis, C., Champagne, A. E., et al. 2013, ApJS, 207, 18
- Saumon et al. (1995) Saumon, D., Chabrier, G., & van Horn, H. M. 1995, ApJS, 99, 713
- Schaefer & Pagnotta (2012) Schaefer, B. E., & Pagnotta, A. 2012, Nature, 481, 164
- Schwarz et al. (2001) Schwarz, G. J., Shore, S. N., Starrfield, S., et al. 2001, Mon. Not. R. Astron. Soc., 320, 103
- Schwarzschild & Härm (1965) Schwarzschild, M., & Härm, R. 1965, ApJ, 142, 855
- Selvelli & Gilmozzi (2019) Selvelli, P., & Gilmozzi, R. 2019, A&A, 622, A186
- Shafter (1983) Shafter, A. W. 1983, PhD thesis, California Univ., Los Angeles.
- Shara et al. (2018) Shara, M. M., Prialnik, D., Hillman, Y., & Kovetz, A. 2018, ApJ, 860, 110
- Shaviv (2002) Shaviv, N. J. 2002, in American Institute of Physics Conference Series, Vol. 637, Classical Nova Explosions, ed. M. Hernanz & J. José, 259–265
- Sion (1986) Sion, E. M. 1986, Publications of the Astronomical Society of the Pacific, 98, 821
- Sion et al. (2010) Sion, E. M., Godon, P., Myzcka, J., & Blair, W. P. 2010, ApJ Let., 716, L157
- Sion et al. (2019) Sion, E. M., Wilson, R. E., Godon, P., et al. 2019, ApJ, 872, 68
- Starrfield (2014) Starrfield, S. 2014, AIP Advances, 4, 041007
- Starrfield (2017) —. 2017, Evolution of Accreting White Dwarfs to the Thermonuclear Runaway, ed. A. W. Alsabti & P. Murdin (Springer Berlin / Heidelberg), 1211
- Starrfield et al. (2017) Starrfield, S., Bose, M., Iliadis, C., et al. 2017, in The Golden Age of Cataclysmic Variables and Related Objects IV, 66
- Starrfield et al. (2018a) Starrfield, S., Bose, M., Iliadis, C., et al. 2018a, in American Astronomical Society Meeting Abstracts, Vol. 231, American Astronomical Society Meeting Abstracts #231, 358.11
- Starrfield et al. (2019) Starrfield, S., Bose, M., Iliadis, C., et al. 2019, arXiv e-prints, arXiv:1910.00575
- Starrfield et al. (2016) Starrfield, S., Iliadis, C., & Hix, W. R. 2016, PASP, 128, 051001
- Starrfield et al. (2009) Starrfield, S., Iliadis, C., Hix, W. R., Timmes, F. X., & Sparks, W. M. 2009, ApJ, 692, 1532
- Starrfield et al. (2012) Starrfield, S., Iliadis, C., Timmes, F. X., et al. 2012, Bulletin of the Astronomical Society of India, 40, 419
- Starrfield et al. (1998) Starrfield, S., Truran, J. W., Wiescher, M. C., & Sparks, W. M. 1998, Mon. Not. R. Astron. Soc., 296, 502
- Starrfield et al. (2018b) Starrfield, S., Bose, M., Iliadis, C., et al. 2018b, in American Astronomical Society Meeting Abstracts, Vol. 232, American Astronomical Society Meeting Abstracts #232, 320.04
- Timmes & Arnett (1999) Timmes, F. X., & Arnett, D. 1999, ApJS, 125, 277
- Timmes & Swesty (2000) Timmes, F. X., & Swesty, F. D. 2000, ApJS, 126, 501
- Tomov et al. (2015) Tomov, T., Swierczynski, E., Mikolajewski, M., & Ilkiewicz, K. 2015, A&A, 576, A119
- Trümper et al. (1991) Trümper, J., Hasinger, G., Aschenbach, B., et al. 1991, Nature, 349, 579
- van den Heuvel et al. (1992) van den Heuvel, E. P. J., Bhattacharya, D., Nomoto, K., & Rappaport, S. A. 1992, A&A, 262, 97
- Vollmer et al. (2008) Vollmer, C., Hoppe, P., & Brenker, F. E. 2008, ApJ, 684, 611
- Wagner et al. (2001a) Wagner, R. M., Schwarz, G., & Starrfield, S. G. 2001a, IAU Circulars, 7571, 1
- Wagner et al. (2001b) Wagner, R. M., Schwarz, G., Starrfield, S. G., et al. 2001b, IAU Circulars, 7717, 2
- White et al. (2015) White, C. J., Kasliwal, M. M., Nugent, P. E., et al. 2015, ApJ, 799, 52
- Woosley & Kasen (2011) Woosley, S. E., & Kasen, D. 2011, ApJ, 734, 38
- Woudt & Steeghs (2005) Woudt, P. A., & Steeghs, D. 2005, in American Institute of Physics Conference Series, Vol. 797, Interacting Binaries: Accretion, Evolution, and Outcomes, ed. L. Burderi, L. A. Antonelli, F. D’Antona, T. di Salvo, G. L. Israel, L. Piersanti, A. Tornambè, & O. Straniero, 647–650
- Woudt et al. (2009) Woudt, P. A., Steeghs, D., Karovska, M., et al. 2009, ApJ, 706, 738
- Yoon et al. (2004) Yoon, S.-C., Langer, N., & van der Sluys, M. 2004, A&A, 425, 207