Direct Coupling of Free Diffusion Models to Microscopic Models of Confined Crystal Growth and Dissolution
Abstract
We couple a free solute diffusion model to a model of crystal surface growth represented by, but not limited to, a (2 + 1)-dimensional solid-on-solid (SOS) model confined by a flat surface. We use kinetic Monte Carlo (KMC) with dissolution rates based on nearest-neighbor interactions to solve the Master equation for the surface dynamics, and we use an offlattice random walk to model the Fickian diffusion of the solute particles. The two solvers are coupled directly through deposition rates of the free particles calculated using the mean first passage time (MFPT) of deposition that is found to scale as . Two variants are studied: ignoring (radial) and not ignoring the line of sight (pathfinding). Reference models such as uniform concentration (random deposition) and lattice diffusion (crystal lattice extended into the liquid) are used for comparison. We find that the macroscopic limit of the surface dynamics is reproduced by all models. The free diffusion models produce a lower equilibrium roughness and a smaller height autocorrelation length than the reference models, and are found to behave very well in tight confinements. It is also demonstrated that lattice diffusion does not work well in tight confinements. The two MFPT models behave very similarly close to equilibrium and for dissolution, but becomes increasingly different with increasing surface growth speed. The model is put to use by simulating a cavity with a flux boundary condition at one side. The conclusion is that the new model excels in confinement, and line of sight can in practice be ignored since the dominant deposition sites likely are in line of sight, which minimizes the CPU-time needed in the coupling.
pacs:
02.70.-c, 05.40.-a, 68.08.-pI Introduction
Surface growth and dissolution of a solid from solution requires mass transport by diffusion to and from the liquid-solid interface. When the liquid is confined to nanometer thick films the diffusion in confinement becomes an important control on the process. Moreover, when confined, liquids behave very differently from their respective bulk phases Chiavazzo et al. (2014); Diallo (2015). Feedback between growth and dissolution, mass transport, and confinement induced stresses are known to lead to instabilities that reduce diffusion paths and increase dissolution rates by many orders of magnitude Den Brok (1998); Dysthe et al. (2002).
Molecular Dynamics (MD) is well suited for simulating transport in nanoconfined liquids Cámara and Bresme (2004); Kalcher and Dzubiella (2013); Sun et al. (2013); Ori et al. (2014); Chiavazzo et al. (2014); Yasuoka et al. (2015). However, since MD operates on the time scale of atomic vibrations, it suffers from a time scale problem when faced with growth and dissolution processes, which involve time scales that are orders of magnitude larger. This is the reason why kinetic Monte Carlo (KMC) is widely used in these cases Voter (2007).
The challenge is that KMC cannot be directly coupled to separate dynamic processes unless these dynamics are either given directly in terms of transition rates, or they do not affect the KMC transition rates. For instance, free diffusion impacts the KMC state transition rates since it sets the deposition rates. Hence KMC is unable to produce a time step until a deposition rate is supplied, but the free diffusion is unable to integrate in time until a time step is suppled.
For surfaces in open reservoirs this problem has been solved by splitting the system into two: one pure solute part which can be iterated in time using practically any algorithm, and one part consisting of the crystal surface and a minimal amount of solute which is iterated in time using rate based lattice diffusion, with a shared concentration and/or flux boundary between the two subsystems that is iteratively solved for consistency at all times Drews et al. (2004); Pricer et al. (2002a, b); Tello and Curtin (2005).
In our confined system the restriction of having particles diffusing on a lattice could induce unwanted effects because the ability of the solute to adapt to its surroundings is potentially very important. We will therefore in this paper construct an algorithm that couples free diffusion to the KMC surface dynamics, and benchmark it against a lattice diffusion implementation.
Since the crystal surface is dynamic, and acts as a spatial boundary condition to the liquid, using a continuum description of the liquid is not practical. These continuum methods also scales badly with increasing dimensionality Plapp and Karma (2000). Continuum models also fail to incorporate important particle fluctuations, which leaves a discrete particle based model optimal van Zon and ten Wolde (2005). Hence we will base our algorithm on a discrete particle model.
The paper is structured as follows: In Sec. II we briefly introduce the surface model before we give an in-depth derivation of the free diffusion model and the coupling to the surface dynamics. Following in Sec. III we present a detailed analysis of the model where we compare its behavior to that of lattice diffusion and a uniform concentration model. Concluding the results section we apply the derived model to simulate a system where the lattice diffusion and the uniform concentration model are not well suited. In Sec. IV we summarize and conclude the paper.
II Model
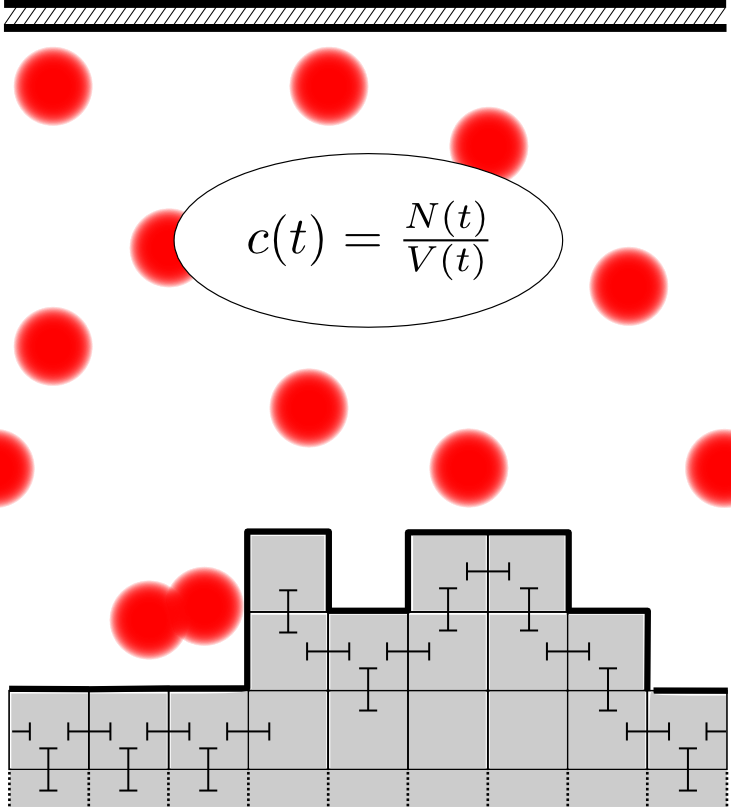
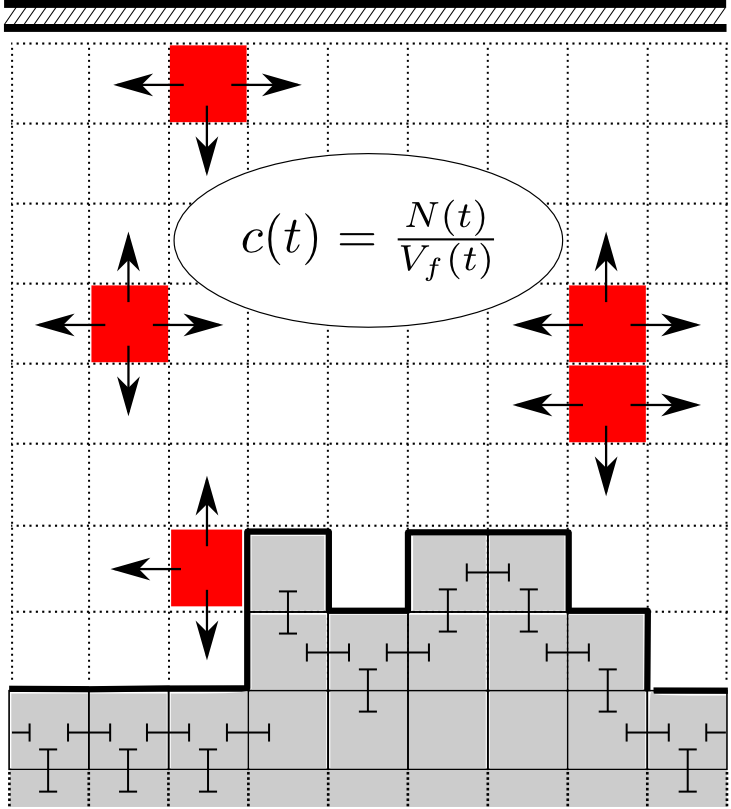
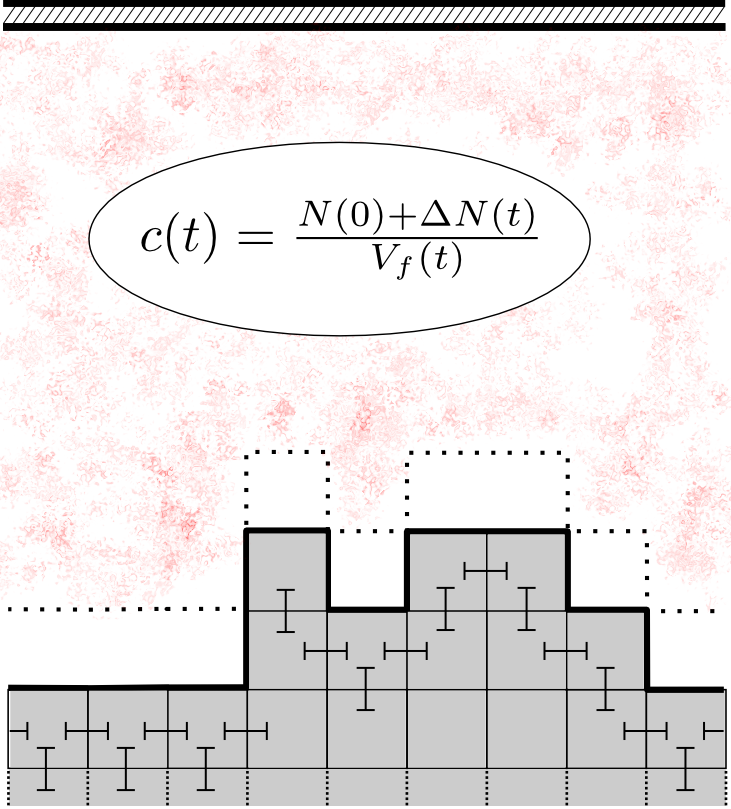
II.1 Surface
The surface is modeled using a (2 + 1)-dimensional solid-on-solid (SOS) surface with nearest neighbor interactions. Above the surface there is an inert flat surface placed at a fixed position such that the initial average separation is .
The allowed surface transitions are dissolution and deposition at top sites only (the SOS restriction), i.e. processes which either reduces or increases the local height by one unit. The exception is if there is no space around a site to dissolve to, or no space between the surfaces to deposit.
The dissolution rate is Gilmer and Bennema (1972)
| (1) |
where is the number of nearest neighbors particle has, and , with being the nearest neighbor bond energy, being the Boltzmann constant, and being the temperature.
The deposition rate will depend on how we model the diffusion in the liquid surrounding the surface.
II.2 Liquid
In the liquid, we will assume the dynamics to be governed by Fickian diffusion, that is, the particle concentration obeys the diffusion equation
| (2) |
where is the concentration at a time at the position and is the diffusion coefficient, here assumed to be independent of position.
We model the liquid as ideal, such that for solute particles. Inserting this into Eq. (1) yields a constant transition rate for solute particles. The diffusion coefficient for solute particles on a lattice with separation is thus
| (3) |
where is the lattice separation. This is the diffusion coefficient we will use throughout this work.
This is a simplification since, in general, the value of in the liquid will differ from that of the surface. Hence should be a free parameter of the liquid. Nevertheless, we will use Eq. (3) here. Using a specific value for (in units of ) should be straight forward.
II.2.1 Free diffusion
Free diffusion is included by not constraining the solute particles to a lattice. The solute particles do not interact with anything except the surfaces which act as physical boundaries (hard-sphere interactions).
In order to move the solute particles in accordance with the diffusion equation in Eq. (2), we update their positions according to the recurrence relation Plapp and Karma (2000)
| (4) |
where represents a Cartesian degree of freedom for solute particle at a time step , and is a normal distributed random number with variance , with being the time step. If a suggested position is illegal (i.e. blocked by the surfaces), we redraw a new position. Alternatively one could reject the move or reflect the move.
The concentration is calculated using the cavity volume as
| (5) |
where is the number of solute particles at time .
II.2.2 Deposition rates
For the standard liquid models used in surface growth such as the reference models we use (see Appendices A and B for details), the deposition rates are immediately available as either a constant in the case of a uniform concentration model, or as an implicit transition from a lattice cell in the liquid to one on the surface.
In the case of free diffusion this kind of approach is not possible, since the particle dynamics are not given in terms of rates. We cannot simply let the particles diffuse and attach if they collide with the surface either, since we in kinetic Monte Carlo do not a priori know the time the surface stays in its current state unless we a priori know the deposition rates. This creates a circular dependency between the time step and the deposition rates. To break this circular dependency we will introduce a model for the solute particle deposition rates.
Given that a particle is located at some position , we want to calculate the deposition rate at a specific surface site . This could be measured as the average time it takes separate diffusion processes starting out at to reach the surface at site for the first time. This quantity is referred to as the mean first passage time (MFPT) of deposition. If we denote the MFPT of deposition as , the deposition rate becomes
| (6) |
where is a characteristic distance between solute particle at a position position and surface site .
Calculating the MFPT is expensive. The reason we use kinetic Monte Carlo for the surface dynamics is to achieve larger time scales, hence it would render this choice obsolete if the individual cycles became too slow. We therefore aim here to derive a generic form of the MFPT expression using what we know from the diffusion equation in Eq. (2).
Comparing the dimensions of to those of the parameters in Eq. (2) suggests a relationship on the form
| (7) |
This expression is spherically symmetric, and a deposition at a specific site can very crudely be thought of as escaping this shell through a specific square hole of area . A very crude correction for this is to weigh the time by the ratio of the area of the hole to that of the full shell , which yields
| (8) |
Inserting this back into Eq. (6) yields the deposition rate
| (9) |
where the value of is obtained by requiring that on average the system should equilibrate at the same concentration as the uniform concentration model.
This expression has the same form as what is calculated for a narrow escape through a hole in a sphere in Ref Oshanin et al. (2010).
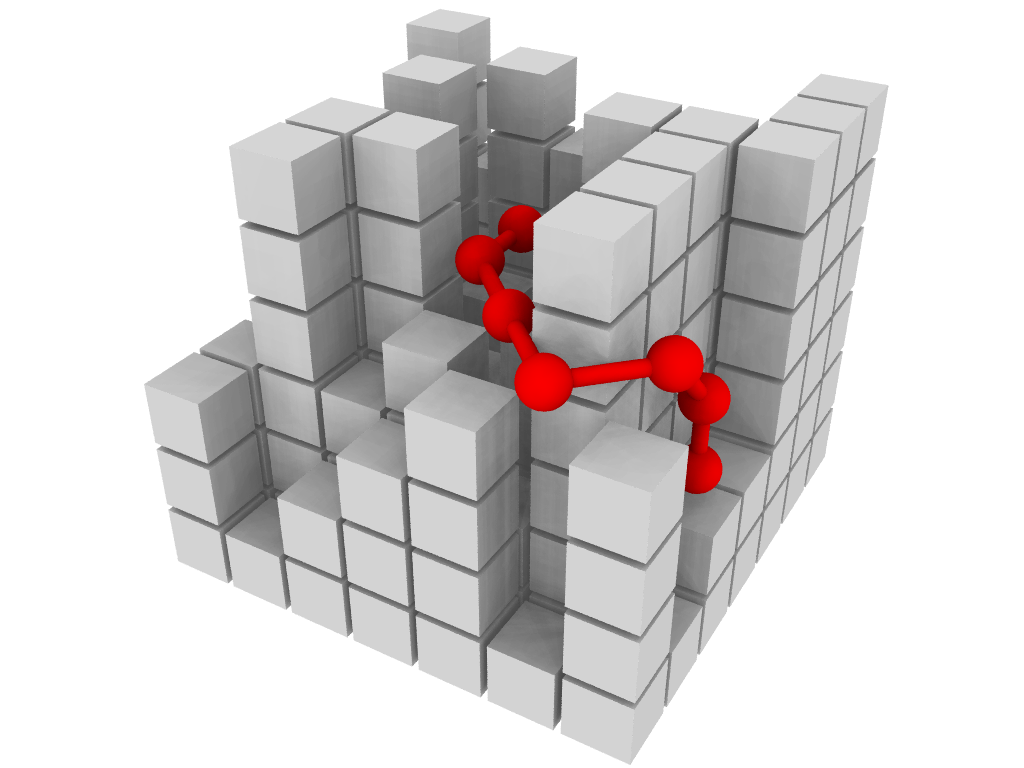
We will model the characteristic distance in Eq. (9) in two different ways: one using radial distances, and another using the shortest path, which can be efficiently calculated using the A∗ algorithm Hart et al. (1968). The idea is that the latter takes into account physical obstacles along the way, whereas the former does not. We will refer to these methods as radial and pathfinding MFPT, respectively.
In Fig. 2 an example of a shortest path calculation is shown, where a particle finds its way to a deposition site on the other side of an obstacle. A radial calculation here would over estimate the probability of reaching this site.
II.2.3 Implementation details
Following is the algorithm used to couple the kinetic Monte Carlo dynamics to the free diffusion process:
- 1.
-
2.
Calculate the time step , where is a uniformly distributed random number and is the sum of all rates calculated in the first step.
-
3.
Assign a probability to each transition, draw one at random, and execute it.
-
4.
Diffuse all solute particles not involved in the transition for a time (this may need to be split into shorter intervals).
We have set the maximum allowed time step for a single free diffusion step equal to .
Since the continuous coordinate solute particles are allowed close to the discrete surface, problems might occur where e.g. a solute particle becomes stuck in a surface hole without being able to select a legal diffusion step. To avoid this we have simply chosen to give all solute particles a wiggle-room of to each side.
Since the term in the MFPT decays very quickly with distance , we calculate the deposition rate only inside a cube centered on the diffusing particle of lengths , where we set . This is referred to as the maximum distance method, and is thoroughly analyzed in Ref. Schwarz and Rieger (2013), where it is stated that is safe for all practical purposes ( in our case). This also means that particle with a vertical position greater than the maximum surface height plus has a deposition rate equal to 0. Hence the CPU time required to calculate the deposition rate only scales with the number of particles close to the surface, and not the total number of particles unless the volume is very small.
III Simulations and Results
For the simulations we have used the rejection free kinetic Monte Carlo (KMC) algorithm Voter (2007). First we will find the values of in the mean first passage time (MFPT) from Eq. (9) by requiring the system to on average equilibrate at the same concentration as the uniform concentration model from Appendix B. Once is obtained we will compare the free diffusion model and the reference models to the analytical solutions to the macroscopic limit derived in Appendix C. As a final comparison with the reference models we calculate the equilibrium roughnesses and height autocorrelation lengths for each model. We then apply the radial model to a system where the other models are not suited in order to demonstrate its necessity. The selected system is a cavity geometry with a high flux of particles into the system at one boundary.
We implement constant cavity volume by keeping the average separation between the crystal and the confining surface constant by repositioning the latter. In simulations done at a constant number of particles, whenever a particle is added or removed by the simulations, we remove or insert a particle at random, respectively. All simulations have an initial average height , which means that the position of the confining surface represents the initial surface-surface separation as well.
For simulations where the confining surface was fixed, the system is initialized in a steady state at for and generated by simulating a given number of steps under a constant cavity volume as described in the previous paragraph.
All separations are measured as center-center distances, such that the edge-edge distance is one lattice unit less.
III.1 Equilibration
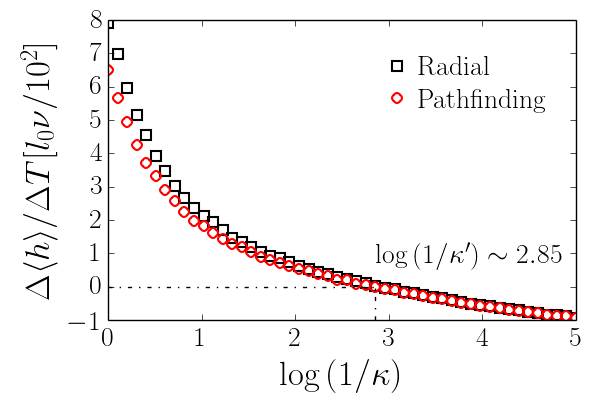
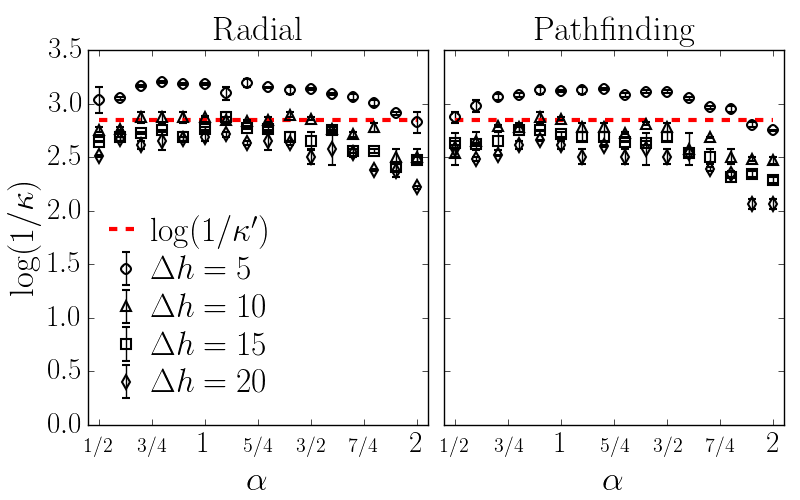
In order to obtain reasonable values for in Eq. (9) for both the radial and the pathfinding mean first-passage time (MFPT) models, we fix the number of particles and the volume, and set the initial concentration to the known equilibrium concentration of the unconfined uniform concentration model from Eq. (19). Since the two diffusion models are very different in nature, this is a crude approximation, but it serves as a reasonable way to obtain a fair value for the parameter nonetheless.
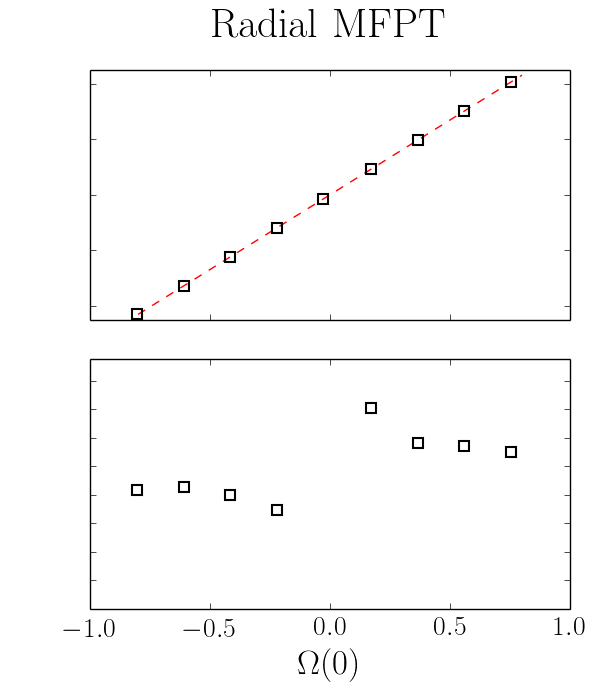
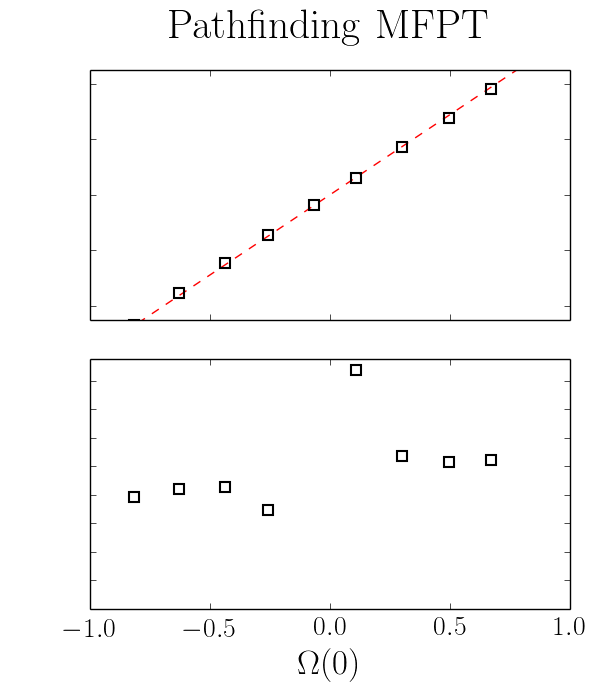
We then apply two different methods for estimating the value of which leads to zero net growth. In the first method we measure the growth speed as a function of averaged over several simulations and interpolate the point where the growth speed is zero, and in the second approach we estimate the root of the growth speed as a function of using bisection. The first approach is very accurate, but requires many simulations and much manual labor. The second approach is completely automated, however, has limited precision due to statistical fluctuations in the growth speed measurements.
The results of the first approach for the radial and pathfinding MFPT models are shown in Fig. 3, where we see that for dissolving systems (), the two models behave equally, whereas for growing systems, the two models diverge more and more as the growth speed increase. This makes sense since for dissolving systems, the details of the growth mechanisms should be less important, and opposite for growing systems. It also makes sense that we see the radial method producing all around higher growth speeds, since it does not care about lines of sight and should therefore overestimate the deposition rates. Around equilibrium, however, the two models are very similar and yield a unified value of .
The results for bisection for different surface-surface separations and is given in Fig. 4. Ideally we would want to be independent of and , however, as we can see this is not the case. One problem is that the assumption that the equilibrium concentration is given by Eq. (19) is increasingly invalid with decreasing , since this equation is derived without accounting for finite-size effects (). This effect is prominent in Fig. 4 where the results appears shifted in comparison to the other data. Moreover, as increase, particles far away from a deposition site can contribute significantly to its total deposition probability. Our expression for this deposition rate is very basic and issues in this limit is therefore expected. This effect is also prominent in the figure where we see the results curve off for higher . These facts does not imply that the model is invalid in these regimes, it means only that we must expect to have dependencies on the model parameters, and ensure that we use a value which is appropriate for the given set. Nevertheless, the dependency of on the model parameters appears to be smooth and well behaved.
III.2 Comparisons with the macroscopic limit
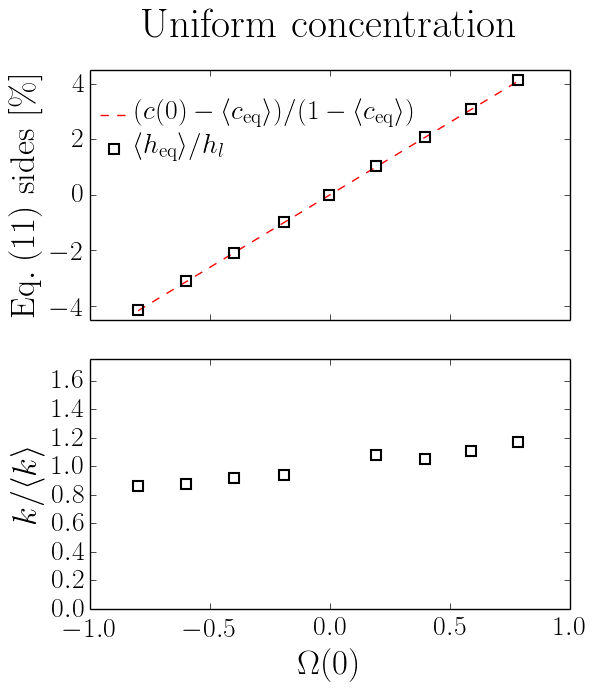
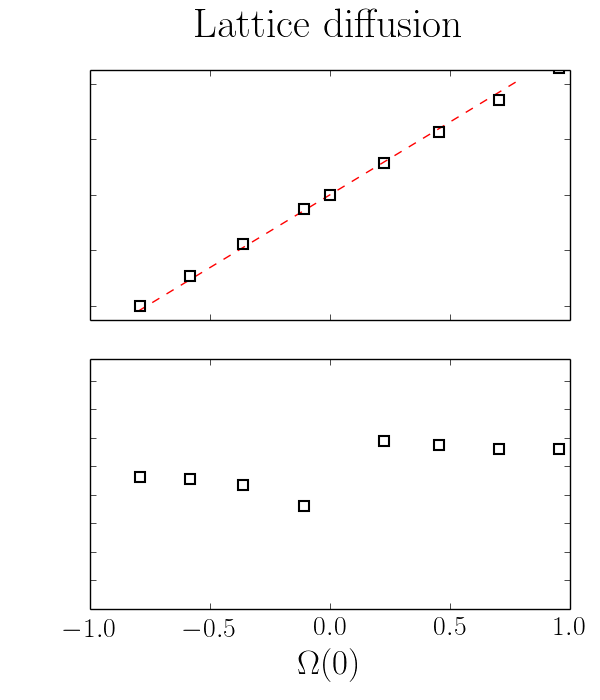
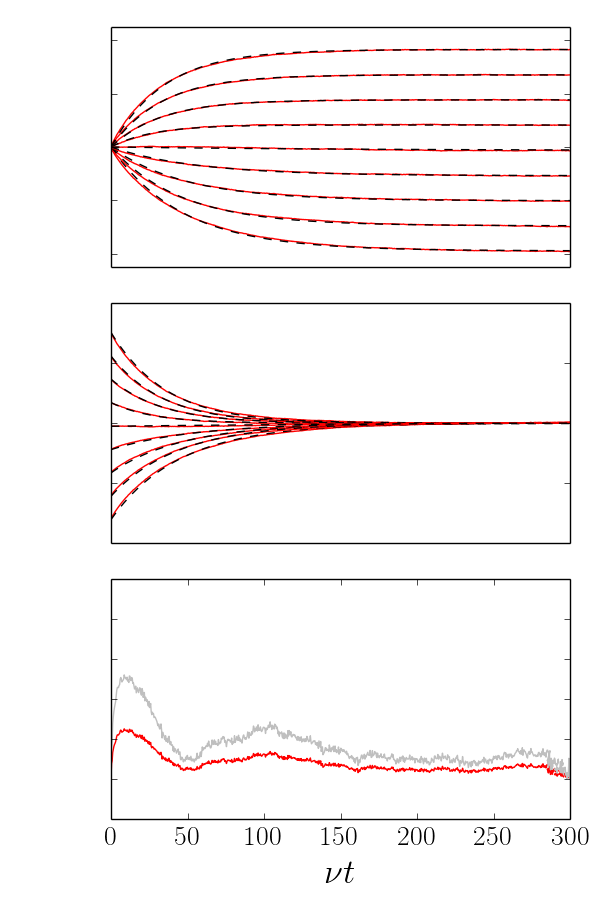
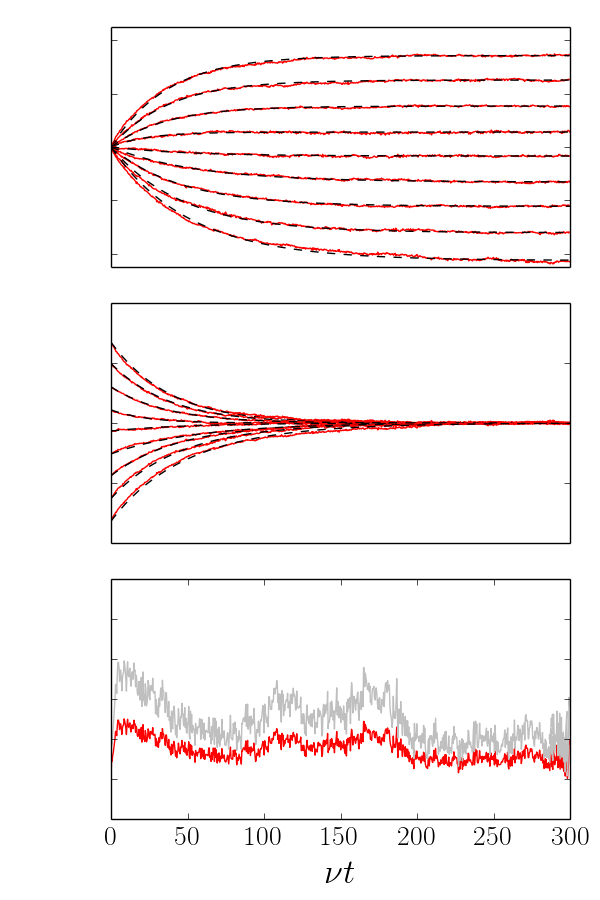
In this section we will compare the behavior of the MFPT models in the macroscopic limit to those of the reference models. As a system we have chosen to study one with a fixed confining surface height, and a constant number of particles, i.e. , we are in the conditions of the canonical ensemble.
In Appendix C we assume that the macroscopic equation of motion is
| (10) |
where is a constant, is the average crystal surface height, and is the supersaturation with being the equilibrium concentration, and derive analytical expressions for and , which are given in Eq. (26) and Eq. (27), respectively.
Since the constant from Eq. (10) is not a priori known in KMC, a direct comparison between simulations and the analytical results from Appendix C is not possible. However, the asymptotic value of is
| (11) |
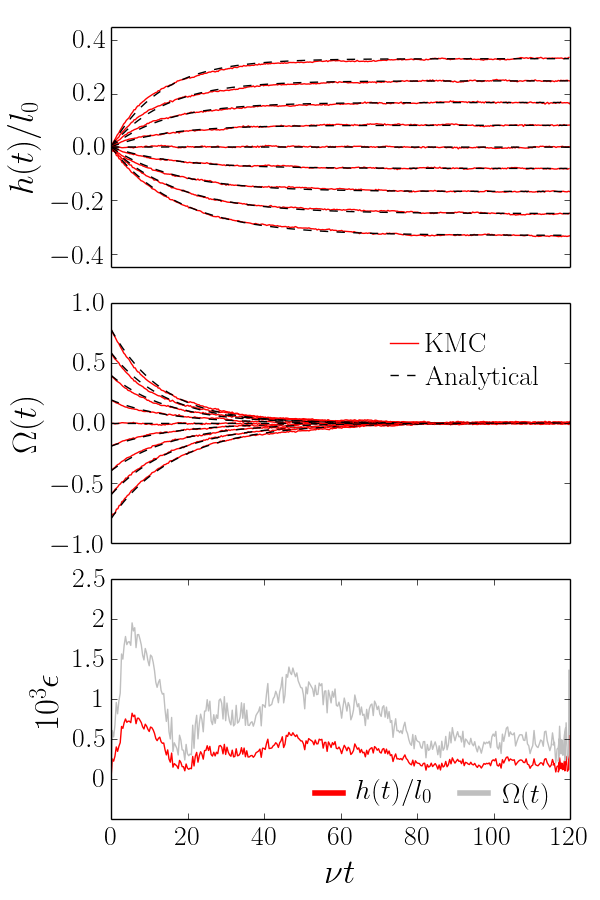
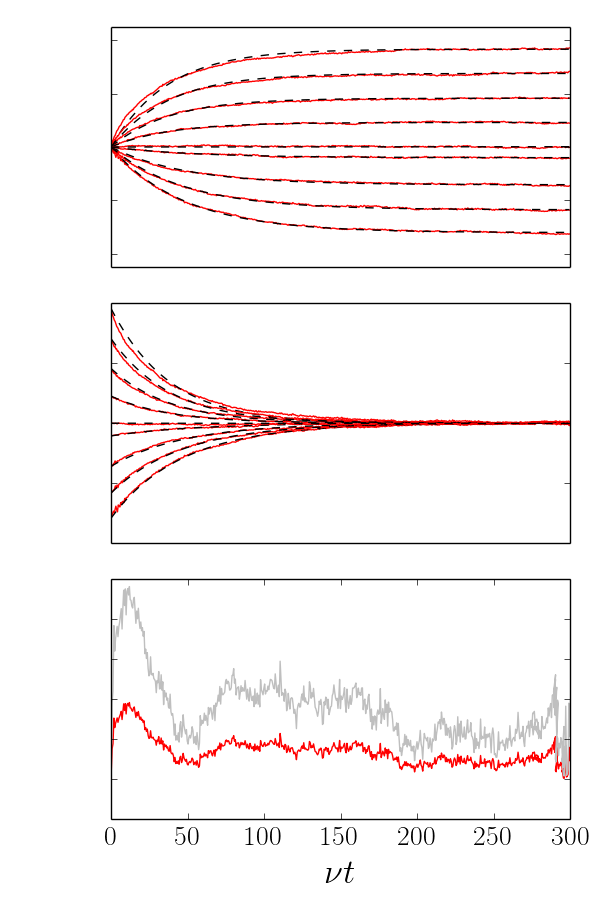
which we see is independent of and can be directly compared. Moreover, since the system is in thermal equilibrium, has no external forces acting on it, and cannot exchange particles across any system boundaries, we know from thermodynamics that . We can therefore evaluate Eq. (11) using the concentration measured at a stage where it has converged , and compare it to the corresponding converged simulation height . If the macroscopic equilibrium is obeyed, we should find that these two independent measurements obey Eq. (11). In the top row of Fig. 5 we see that this is the case for all the diffusion models, where the squares and stippled lines are the left- and right-hand sides of Eq. (11), respectively.
Knowing that the asymptotic limits match, we now estimate by minimizing the difference between the simulated and analytical and using least square methods. The resulting is displayed as a function of initial saturation in the second row (from the top) of Fig. 5, and the remaining rows show the resulting simulated and analytical , and their absolute errors, respectively. It is clear that there is an overall good match between the macroscopic limit and each of the diffusion models, but the best match is produced by the MFPT models. It is tempting to say that this means that they are macroscopically more correct, which may or may not be important. Nevertheless, it is remarkable that such a simple solute-surface dynamics coupling can produce such a high level of match with equations derived without any concern regarding these details.
The asymmetry in which has been previously observed for the uniform concentration model without confinement at a fixed concentration Gilmer and Bennema (1972); Gilmer (1972); Cheng (1991) is reproduced for all models as well, except for some sight diverging tendencies close to equilibrium for the free diffusion model.
These results reveal crucial properties the diffusion model should have. For example, the results show that the equilibrium is well defined even with a direct coupling between the free diffusion and the lattice surface, they show that the time evolution of the system behaves smoothly even if the diffusion is much more dynamic than in any of the other models, and it shows that the macroscopic limit is preserved when we introduced the free diffusion model at the microscopic level. In other words, these results show clearly that Eq. (10) is the underlying equation of the ensemble averaged motion of the surface.
We see that lattice diffusion is the model which produce the worst fit with the analytical solution. Moreover, it seems that the height curves are not evenly spread (the gap between the equilibrium and the one for is not identical to the other gaps). This means that the equilibrium concentration depends on the input concentration, which might be an effect caused by the hard-sphere interaction of the lattice diffusion particles.
III.3 Equilibrium comparisons
III.3.1 Roughness
The roughness of a (2 + 1)-dimensional SOS surface described by a matrix of heights h with elements is calculated as
| (12) |
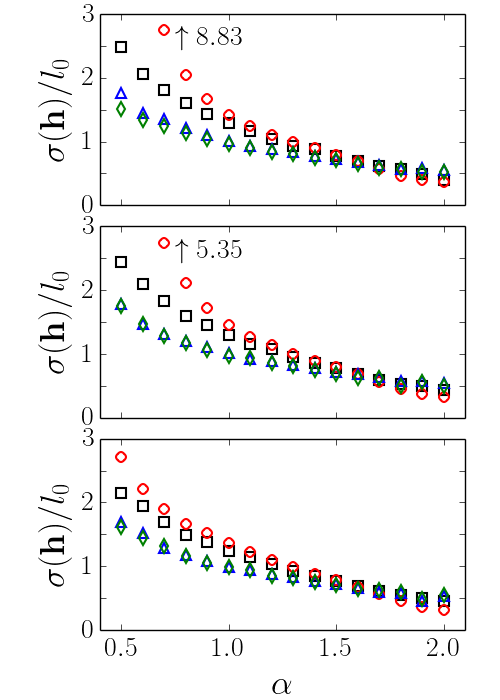
and is plotted as a function of for the MFPT models and the reference models in equilibrium for various separations in Fig. 6. The overall trend is that the surface roughness decays with increasing , which is expected since the probability of dissolving a peak relative to a valley goes as .
From these results we see that the MFPT models produce similar roughnesses which generally is lower than for the uniform concentration and lattice diffusion models. This tells us that there are very few scenarios where the dominant deposition path is not within radial line of sight.
For high the MFPT models match the uniform concentration model, whereas the lattice diffusion model is somewhat lower. For very low , the simulations converge very slowly such that there are some errors in the results of about a quarter of a lattice length. For all other values of the errors are so small they would not be visible.
For low the MFPT models do not seem to include the same diverging behavior as lattice diffusion does. In this limit, the equilibrium concentration is high (a lot of particles are present), such that we expect more irreversible spiking of the kind illustrated in Fig. 9 to occur, which explains the sudden increase in roughness. Since the MFPT models operate with continuous coordinates, these issues are not present.
We see also that for higher , all diffusion models produce similar roughnesses, which is expected since here the equilibrium concentration is low (few particles are present), such that the details of the diffusion model should not be important. However, lattice diffusion produces a significantly lower roughness in tight confinement. This demonstrates again that the MFPT models are more well-behaved in tight confinements than the lattice diffusion model.
As expected, the roughness becomes independent of the confinement at a certain separation where the surface roughness is no longer limited by the finite separation. The roughness of the MFPT methods are overall so low that it appears unchanged down to , but the roughness of the reference models are clearly impacted for low .
III.3.2 Height autocorrelation lengths
The height autocorrelation function is calculated as
| (13) |
where the average is over all lattice sites . It is often custom to scale this function such that , however, since we are interested in the autocorrelation length , this is not necessary. The autocorrelation length is defined as the inverse decay constant of the autocorrelation function, that is, if
| (14) |
then we can extract from a curve-fit of the sampled autocorrelation function.
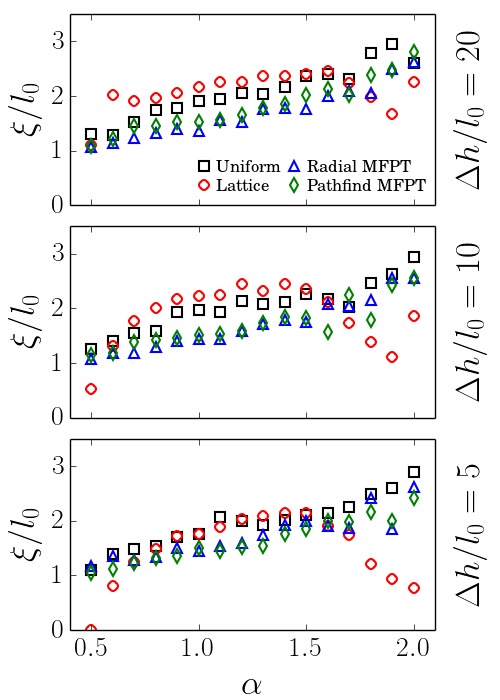
We have calculated using four directions: along the -axis for and opposite, and for the two diagonals going through . In all models we found the autocorrelation length of these directions to match up, and therefore we calculated as the average of these four values. The results as a function of for all diffusion models in equilibrium for various separations are given in Fig. 6.
The trend is that the autocorrelation length increases with . This makes sense since as increase, the system is driven more and more towards minimizing the surface tension, which means that if one surface site is at a certain height, it becomes more likely that the surroundings are at a similar height, i.e. we increase the autocorrelation length.
Again, as for the roughness, the MFPT models seem to produce similar results. This again suggests that the dominant deposition sites are likely to be in line of sight. We see also that the MFPT autocorrelation lengths are generally lower than those of the reference diffusion models, except for and , where the lattice diffusion model behaves chaotic. Looking at the respective roughness plot in the same figure we see that these points are the same as where the roughness diverges and drops below that of the uniform concentration model. Hence this further demonstrates that lattice diffusion struggles in tight confinement, whereas the MFPT models are generally well-behaved.
The chaotic behavior for lattice diffusion is found to be due to the autocorrelation function not resembling an exponential decay, hence we are unable to extract from Eq. (14) in a well-defined manner.
It is interesting to note that all diffusion models produce autocorrelation lengths which has the same slopes with increasing .
III.4 Example system: Cavity with flux boundary

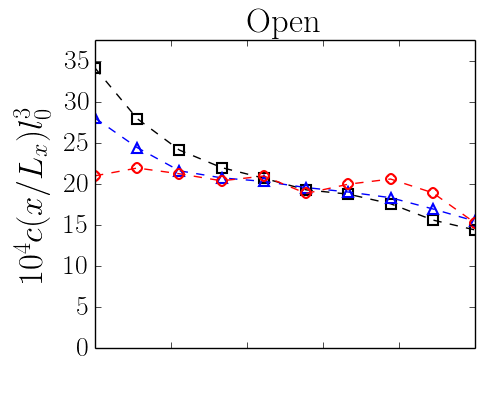
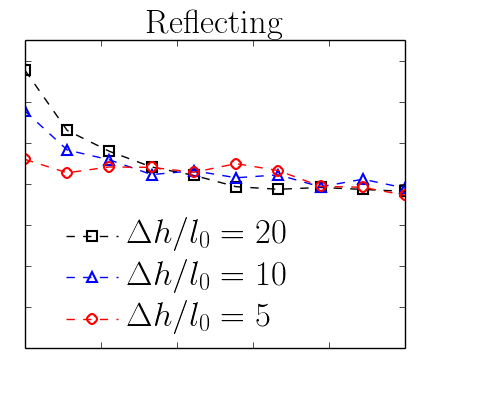
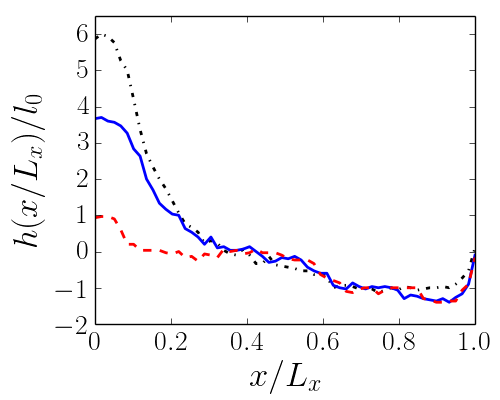
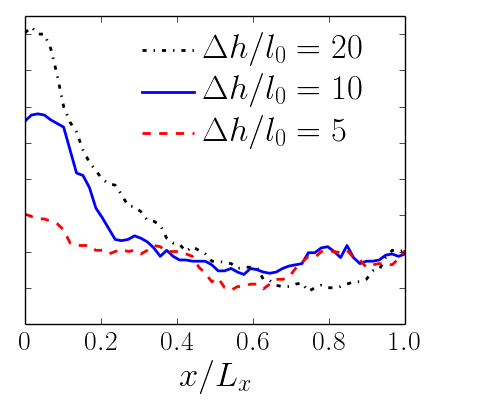
We have up to this point focused on showing that the MFPT models behave well in confinement and in the macroscopic limit. Here we will apply the radial MFPT model to a system where the reference models would not be suited. The system we will study is the same as the periodic one used in the macroscopic limit, however, now with the boundary opened up (solute particles can escape) with an added flux boundary condition. For the opposing boundary at we study two different boundary conditions: open with a lower flux, and reflecting. The surface is also pinned in and such that a boundary site has no additional neighbor if its height .
We add a flux at and a flux at , which is translated into rates by multiplying by the open boundary area. The reflecting boundary simply mirrors the particle across the boundary when it diffuses outside. Periodic boundaries are still applied in the -direction. Snapshots of the system at different levels of confinement are given in Fig. 8.
From the results in Fig. 8 we see that the crystal surface height averaged over the -direction, , consist of a number of steps which is at its highest close to the boundary and fluctuates between partial or complete pits (negative heights) and partial or no islands deeper into the cavity. The reason why the decay is relatively smooth is that the step fronts fluctuate. The bunched steps forms a growth rim such as is observed experimentally for confined crystals growing in a supersaturated solution Becker and Day (1905); Taber (1916); Rø yne and Dysthe (2012). Close to the inner boundary we get either a pit due to the low flux and open boundary, or a stable evolution from the middle of the channel due to the reflecting boundary.
The concentration field have been measured as the average number of particles per volume. We have studied the dependency in the periodic direction and found it to be uniform, hence is averaged over the -direction. Figure 8 show that for the open boundary, the concentration field is linearly decaying from the point where the nucleated steps have ended, and has a non-linear dependency close to the high flux boundary where steps nucleate. For there is only three vertical cells which are away from the surface initially, which makes it hard to calculate the concentration field in a well-defined manner. Hence the concentration field here is not as well-behaved. This fact demonstrates the necessity of the discrete representation of the particles. For the reflecting boundary, the concentration field curves off such that at the inner boundary.
These results demonstrate that the MFPT diffusion model is well suited for simulation in these environments, and is able to produce the correct diffusion dynamics as well as the correct surface dynamics with a direct coupling between the two. The results also demonstrate that the produced concentration field responds correctly to other boundary conditions than the periodic ones used in the previous sections. A uniform concentration model is not applicable in environments such as the one presented here, and guessing the shape of the concentration field is not trivial. It is therefore clear that in order to model these systems in a satisfactory manner, a discrete particle free diffusion model which explicitly solves the diffusion equation is indeed necessary.
IV Discussions and Conclusions
We have presented an algorithm for coupling free particle diffusion in a liquid to lattice crystal surface models subject to spatial confinement, where the dynamics is described in terms of rates of single particle events (dissolution and deposition). The basic idea behind the algorithm is that for every solute particle, a deposition rate is calculated to sites present inside a cube centered around the particle with sides . This rate is the inverse of a mean first passage time (MFPT) of depositing at the site, which is found to scale as , where is a characteristic distance to the site. This characteristic distance was modeled in two ways: radially and as the shortest available path (accounting for line of sight). We have shown that the model excels at simulating confined geometries in which more basic existing models are not well suited.
In this paper we have used a (2+1)-dimensional solid-on-solid (SOS) surface on a cubic lattice, but the derived diffusion model is not limited to this. In practice the model should be directly applicable to any surface with predefined deposition sites. The strength of the diffusion model derived here is that it functions well in all types of geometries, including spatial confinement. However, the diffusion model should work just as well for open geometries (e.g. a single surface in an infinite bath).
The radial and pathfinding MFPT models were found to produce a similar equilibrium roughness, a similar equilibrium height autocorrelation length, and both produced the correct macroscopic limits. For growth, however, there was an increasing difference between the two models, since the radial model ignores line of sight issues. Unless the growth is very rapid, we found that the two methods produce near identical dynamics, which means that the most likely deposition sites are in line of sight of the particle. This makes sense since the term decays so quickly that a particle is most likely very close to the most dominant deposition site. Based on this it is fair to say that it is safe to use the radial method except when the system is growing very rapidly. This also saves a lot of CPU time, since the pathfinding is very slow compared to calculating a straight line.
Besides producing the correct macroscopic limit, the free diffusion also produce a known asymmetry in the kinetic constant which appear in the macroscopic equation of motion. The free particle model have a slight divergence in close to equilibrium, however, this means only that the assumption that the speed is proportional to the supersaturation to unit power is false close to equilibrium. This non-linearity is observed experimentally close to equilibrium Khorsand et al. (2010); Bennema and Klein Haneveld (1967). We will in other words not only automatically obtain the correct concentration field, but we include non-linear effects which a uniform concentration model does not.
It was clear that the lattice diffusion method had several issues in tight confinements, none of which were present in the MFPT models. The lattice diffusion is less CPU intensive per cycle than the free diffusion, however, in the free diffusion we move all the particles at once while we in the lattice diffusion model move the particles one at the time. Hence if we look at the CPU time required per surface event, the free diffusion is more efficient.
The cavity example demonstrated that the MFPT model reacts well to different boundary conditions, and that it leads to a correct surface evolution even in systems which are not infinite and isotropic. Moreover, it demonstrated a challenge with measuring the concentration in a well-defined manner close to the surface.
With a free diffusion model available it should be possible to include for instance a drift term into the diffusion equation assuming that the MFPT is still dominated by the diffusion. It should also be possible to force the solute particles to follow a specific distribution using a Metropolis or Metropolis Hastings Monte Carlo algorithm. Including solute particle chemistry and interactions in general through molecular dynamics or Boltzmann statistics and the Metropolis algorithm should also be possible, however, this means that the MFPT expression should depend on the details of these additions as well.
Acknowledgements.
Discussions and comments by Anja Røyne significantly contributed to this paper. This study was supported by the Research Council of Norway through the project “Nanoconfined crystal growth and dissolution” (No. 222386). We acknowledge support from the Norwegian High Performance Computing (NOTUR) network through the grant of machine access.Appendix A Lattice Diffusion Model
If we restrict the motion of solute particles to a lattice which is an extension of the crystal lattice into the liquid, we get the diffusion model we refer to as lattice diffusion. Since the liquid is assumed to be ideal, solute particles do not bind to one another, however, hard-sphere interactions are unavoidable since two particles cannot occupy the same cell at the same time. Inserting into Eq. (1) yields for all solute particle positions , which is the rate of a solute particle transitioning away from its current location. This model is illustrated in the middle part of Fig. 1.
Solute particles transitioning to the lattice sites immediately above the surface instantly become surface particles. This constraint guarantees that the layer immediately above the surface is always vacant, hence it should not be included when calculating the concentration. The concentration becomes
| (15) |
where is the number of solute particles, and is the volume at which solute particles are free to move, where is the cavity volume and is the reactive surface area.
Deposition rates
Since we do not distinguish between adsorbed and free surface particles, a deposition is simply a solute particle transitioning from a site in the liquid to a site on the surface.
This means that there is no need for an explicit deposition reaction (and rate), since it is implicit in the lattice diffusion model. However, for the sake of completeness we may write the deposition rate at surface site as
| (16) |
where denotes a sum over liquid sites neighboring site , and is 1 if a particle is present at liquid site , and 0 otherwise.
Implementation details
In this model, the rate of a particle transitioning away from a current position is independent of the destination. This means that if the particle has escape paths, the total escape rate becomes . If the particle escape is selected, the destination is then selected at random. Alternatively we could add reactions to the catalog with different escape paths.
The rates of transitions in the liquid are larger than those of the surface, and if the concentration is high, the number of transitions available for solute particles is large compared to for surface particles. This means that we spend a lot of time moving the solute particles. However, whenever we move a particle, we only have to recalculate the rates of the affected sites, which on average is very few. Nevertheless, the efficiency of this model suffers greatly from the constraint of moving a single particle at the time.
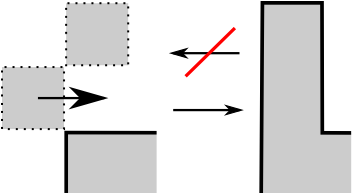
If a particle from the liquid deposits by transitioning sideways onto a surface site such that it immediately connects one or more particles directly above this site to the surface, the surface height can increase more than one unit per step in lattice diffusion. However, since a particle has to dissolve from the top site due to the solid-on-solid (SOS) condition, the height cannot decrease by more than one unit per step. This means that all transitions are not completely reversible, and creates a tendency of the system “spiking” at high concentrations. This process is displayed in Fig. 9. It is possible to avoid these issues by for instance repositioning of the particles causing the issues, however, our focus is not on creating ad hoc fixes to problematic models, but rather unveiling what is causing the problems and study how they limit one model as compared to another.
Appendix B Uniform Concentration Model
If we simply average over the liquid sites in the lattice diffusion model and describe it by a uniform concentration , we get what we refer to as the uniform concentration model. As we will see, this model will correspond to a constant (in space) deposition rate model, also referred to as a random deposition model. This model is displayed in the right-most figure of Fig. 1. What we effectively do is to only count the number of particles in the liquid, not caring about where they are located.
By rearranging Eq. (15) we can calculate the initial number of particles at as . We can track the change in solute particles by counting the number of depositions and dissolutions, such that . We get
| (17) |
Deposition rates
By averaging Eq. (16) over all surface sites , we can calculate the deposition rate for the uniform concentration model by setting this average occupancy equal to the uniform concentration as follows:
| (18) |
where is the number of surrounding liquid sites. This is true only if the concentration is uniform, since in general the concentration might be higher or lower close to the surface than other places (e.g. in bulk).
Implementation details
When a particle is deposited, we do not know from which one of the liquid sites it came. However, we know that the number of dissolution paths necessary equals for the immediate reverse transition. It can be shown that in steady state, such factors that are independent of the final state, and is equal for a transition and its immediate reverse transition, can be removed from the rates. We therefore do not count paths in the uniform concentration model.
Since we do not track the solute particles explicitly there is nothing stopping the concentration from becoming negative. In order to avoid this, we set the concentration to zero in the cases where the value of is so that would become negative.
Without confinement, the equilibrium concentration is known to be Gilmer and Bennema (1972)
| (19) |
Appendix C Analytical Calculations for the Macroscopic Limit
Crystal growth and dissolution with fast surface integration is empirically known to obey the following relationship Machej (1997); Khorsand et al. (2010); Bennema and Klein Haneveld (1967); Haneveld (1971); Dove et al. (2005)
| (20) |
where is a constant, is the average height of the surface, and measures the degree at which the system is out of equilibrium.
Here we will solve this equation for and for a closed system which can only exchange heat with its surroundings, i.e. in the conditions of the canonical ensemble.
Let the position of the confining surface be , then the cavity volume is
| (21) |
where is the reactive surface area, is the volume of the solvent, and is the volume of the number of particles . Since the system is closed and a particle takes up an equal amount of space in the liquid as on the surface, the volume of the solvent is constant. We calculate from the initial conditions as
| (22) |
where we used that the unit less concentration is .
By using Eq. (21) we can express in terms of the height
| (23) |
such that the supersaturation becomes
| (24) |
| (25) |
whose solution is
| (26) |
where is Lambert W-function, that is, the inverse function of .
| (27) |
where the constant is expressed in terms of the initial condition as
| (28) |
References
- Chiavazzo et al. (2014) E. Chiavazzo, M. Fasano, P. Decuzzi, and P. Asinari, Nat. Commun. 5, 1 (2014).
- Diallo (2015) S. O. Diallo, Phys. Rev. E 92, 012312 (2015).
- Den Brok (1998) S. W. J. Den Brok, Geology 26, 915 (1998).
- Dysthe et al. (2002) D. K. Dysthe, Y. Podladchikov, F. Renard, J. Feder, and B. Jamtveit, Phys. Rev. Lett. 89, 246102 (2002).
- Cámara and Bresme (2004) L. G. Cámara and F. Bresme, J. Chem. Phys. 120, 11355 (2004).
- Kalcher and Dzubiella (2013) I. Kalcher and J. Dzubiella, Phys. Rev. E 88, 1 (2013).
- Sun et al. (2013) G. Sun, N. Giovambattista, E. Wang, and L. Xu, Soft Matter 9, 11374 (2013).
- Ori et al. (2014) G. Ori, F. Villemot, L. Viau, a. Vioux, and B. Coasne, Mol. Phys. 112, 1350 (2014).
- Yasuoka et al. (2015) H. Yasuoka, R. Takahama, M. Kaneda, and K. Suga, Phys. Rev. E 92, 063001 (2015).
- Voter (2007) A. Voter, in Radiat. Eff. Solids, NATO Science Series, Vol. 235 (Springer Netherlands, 2007) pp. 1–23.
- Drews et al. (2004) T. O. Drews, E. G. Webb, D. L. Ma, J. Alameda, R. D. Braatz, and R. C. Alkire, Mater. interfaces, Electrochem. phenomenaomen 50, 226 (2004).
- Pricer et al. (2002a) T. J. Pricer, M. J. Kushner, and R. C. Alkire, J. Electrochem. Soc. 149, C396 (2002a).
- Pricer et al. (2002b) T. J. Pricer, M. J. Kushner, and R. C. Alkire, J. Electrochem. Soc. 149, C406 (2002b).
- Tello and Curtin (2005) J. S. Tello and W. A. Curtin, Int. J. Multiscale Comput. Eng. 3, 257 (2005).
- Plapp and Karma (2000) M. Plapp and A. Karma, J. Comput. Phys. 165, 592 (2000).
- van Zon and ten Wolde (2005) J. S. van Zon and P. R. ten Wolde, J. Chem. Phys. 123, 234910 (2005).
- Gilmer and Bennema (1972) G. Gilmer and P. Bennema, J. Cryst. Growth 13-14, 148 (1972).
- Oshanin et al. (2010) G. Oshanin, M. Tamm, and O. Vasilyev, J. Chem. Phys. 132, 235101 (2010).
- Hart et al. (1968) P. Hart, N. Nilsson, and B. Raphael, IEEE Trans. Syst. Sci. Cybern. 4, 100 (1968).
- Stukowski (2009) A. Stukowski, Model. Simul. Mater. Sci. Eng. 18, 015012 (2009).
- Schwarz and Rieger (2013) K. Schwarz and H. Rieger, J. Comput. Phys. 237, 396 (2013).
- Gilmer (1972) G. H. Gilmer, J. Appl. Phys. 43, 1347 (1972).
- Cheng (1991) V. K. W. Cheng, J. Chem. Soc. Faraday Trans. 87, 2467 (1991).
- Becker and Day (1905) G. F. Becker and A. L. Day, Proc. Washingt. Acad. Sci. 7, 283 (1905).
- Taber (1916) S. Taber, Am. J. Sci. 41, 532 (1916).
- Rø yne and Dysthe (2012) A. Rø yne and D. K. Dysthe, J. Cryst. Growth 346, 89 (2012).
- Khorsand et al. (2010) M. R. Khorsand, M. Habibian, N. Rohani, and A. R. Zarei, Iran. J. Chem. Chem. Eng. 29, 13 (2010).
- Bennema and Klein Haneveld (1967) P. Bennema and H. B. Klein Haneveld, J. Cryst. Growth 1, 232 (1967).
- Machej (1997) K. Machej, Chem. Eng. Process. Process Intensif. 36, 185 (1997).
- Haneveld (1971) H. Haneveld, J. Cryst. Growth 10, 111 (1971).
- Dove et al. (2005) P. M. Dove, N. Han, and J. J. De Yoreo, Proc. Natl. Acad. Sci. 102, 15357 (2005).