Interlayer magnetism in Fe3-xGeTe2
Abstract
Fe3-xGeTe2 is a layered van der Waals magnetic material with a relatively high ordering temperature and large anisotropy. While most studies have concluded the interlayer ordering to be ferromagnetic, there have also been reports of interlayer antiferromagnetism in Fe3-xGeTe2. Here, we investigate the interlayer magnetic ordering by neutron diffraction experiments, scanning tunneling microscopy (STM) and spin-polarized STM measurements, density functional theory plus U calculations and STM simulations. We conclude that the layers of Fe3-xGeTe2 are coupled ferromagnetically and that in order to capture the magnetic and electronic properties of Fe3-xGeTe2 within density functional theory, Hubbard U corrections need to be taken into account.
I introduction
Magnetic layered materials, due to their reduced dimensionality, have exceptional physical properties and potential applications in spintronics Novoselov et al. (2016); Geim and Grigorieva (2013); Deng et al. (2018a). Recently, Fe3-xGeTe2 has attracted much attention as a magnetic van der Waals layered material with a wide range of interesting properties Deiseroth et al. (2006); Chen et al. (2013); Verchenko et al. (2015); León-Brito et al. (2016); May et al. (2016); Zhu et al. (2016); Zhuang et al. (2016); Liu et al. (2017); Yi et al. (2016); Nguyen et al. (2018); Zhang et al. (2018). Spin-polarized scanning tunneling microscope measurements have demonstrated the existence of skyrmionic bubbles in Fe3-xGeTe2 Nguyen et al. (2018). This has been confirmed in a series of follow-up studies Ding et al. (2019); Wang et al. (2019a); Park et al. (2019); Wu et al. (2019); You et al. (2019). In addition, several other intriguing physical properties have been discovered in Fe3-xGeTe2 , such as a large anomalous Hall current induced by topological nodal lines Kim et al. (2018), Kondo lattice behavior Zhang et al. (2018), giant tunneling magnetoresistance Song et al. (2018) and current-driven magnetization switching Wang et al. (2019b). It is noteworthy that the magnetic ordering temperature can be controlled by Fe occupancy May et al. (2016) and gating Deng et al. (2018a). Furthermore, these materials have been cleaved to the monolayer limit where magnetic order persists and gating has been demonstrated to tune the Curie temperature order in exfoliated crystals Fei et al. (2018); Deng et al. (2018b).
As shown in Fig. 1, Fe3GeTe2 consists of a triangular layer of planar FeGe (with iron atoms labeled Fe-II) sandwiched between two triangular layers of buckling FeTe (with iron atoms labeled Fe-I). The Fe3GeTe2 “sandwiches” are weakly bound to each other via van der Waals interactions. Interestingly it has been found that there can be large amounts of Fe-II vacancies in the FeGe layer up to 30% Verchenko et al. (2015); May et al. (2016).
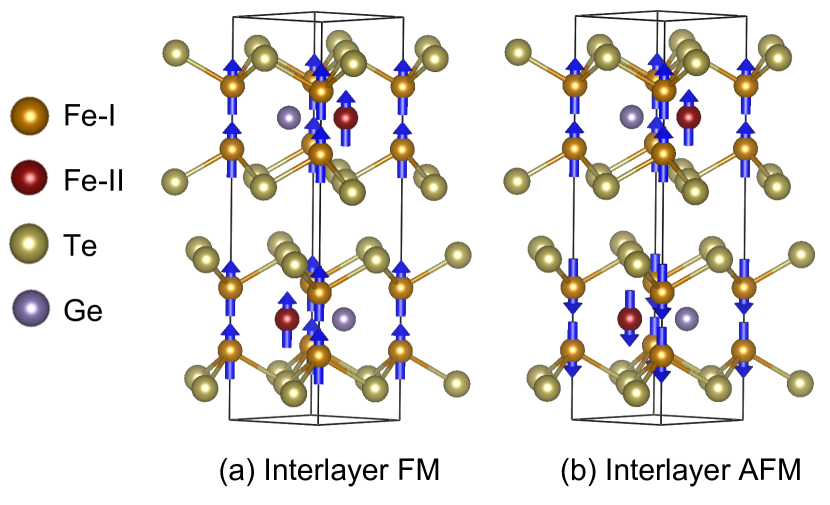
Bulk Fe3-xGeTe2 has been reported to be a van der Waals magnetic material with a relatively high magnetic ordering temperature and large easy-axis anisotropy Deiseroth et al. (2006); Chen et al. (2013). Importantly, however, both the magnetic ordering temperature () and magnetic anisotropy are reduced with increasing concentration of Fe-II vacancies May et al. (2016). Early on it was concluded that Fe3-xGeTe2 has an interlayer ferromagnetic (FM) ordering as shown in Fig. 1(a) based on magnetization measurements Deiseroth et al. (2006); Chen et al. (2013); Verchenko et al. (2015); León-Brito et al. (2016); May et al. (2016); Zhu et al. (2016); Zhuang et al. (2016); Liu et al. (2017). Also the temperature dependence of several neutron diffraction peaks are consistent with FM ordering with the moments aligned along the -axis May et al. (2016). However, it was found that when using a lower magnetic field, the magnetic susceptibility of Fe3-xGeTe2 suggest antiferromagnetic (AFM) ordering between the layers ( Fig. 1 (b)) instead of the FM ordering. Yi et al. (2016). In particular, the temperature dependence of the magnetization shows a kink around a characteristic temperature below the ordering temperature , with K and K for the samples used in Ref. Yi et al. (2016). In addition the zero-field cooled (ZFC) magnetization curve goes very close to zero as the temperature goes to zero when using an external magnetic field parallel to the easy axis. Furthermore it was concluded from AC susceptibility measurements and magnetic force microscopy that in the temperature range between and the system enters a second more complex magnetic phase Yi et al. (2016). To further support this scenario it was shown from Density Functional Theory (DFT) that at zero temperature the AFM interlayer ordering has a lower energy than the FM one Yi et al. (2016). A recent theoretical study Jang et al. (2019) concluded that while undoped Fe3GeTe2 has an AFM interlayer ordering, the ground state of hole-doped Fe3-xGeTe2 () should have an interlayer FM ordering. The interlayer magnetic ordering controls inversion symmetry and time-reversal symmetry, which in turn controls many physical properties such as the topology, giant magnetoresistance, second harmonic generation and piezo electricity Li et al. (2019); Klein et al. (2018); Sun et al. (2019). Therefore it is important to resolve the interlayer magnetic ordering in Fe3-xGeTe2. Understanding the interlayer coupling in Fe3-xGeTe2 may also help researchers to understand the magnetism in related metallic ferromagnets, notably Fe5-xGe2Te2 Jothi et al. (2019) and Fe5-xGeTe2 Stahl et al. (2018); May et al. (2019a, b), the latter of which has a Curie temperature over 300K.
In our work, a series of experimental and theoretical methods has been employed to study the interlayer magnetic ordering of Fe3-xGeTe2. This includes neutron diffraction, scanning tunneling microscopy (STM) around Fe-II vacancies, spin-polarized STM measurements across step-edges and Density Functional Theory (DFT) calculations. Our results indicate that Fe3-xGeTe2 is ferromagnetically ordered between the layers. In order to reach agreement of the theoretical results with the experimental observations we have found that the DFT+U method is needed to treat the local Coulomb interactions among the Fe-d orbitals.
II Methods
Neutron diffraction experiments and samples Neutron scattering was performed on a 5 gram powder sample of composition Fe2.9GeTe2 and a single crystal sample of concentration Fe2.76GeTe2 with dimensions up to 10 mm. The preparation and characterization of these samples are described in Ref. May et al. (2016). The powder sample was loaded into a cylindrical Al can and measured on the HB-2A neutron diffractometer at the High Flux Isotope Reactor (HFIR), ORNL Calder et al. (2018). A constant wavelength of 2.41 Å was selected from the 113 reflection of a vertically focusing Ge monochromator. The pre-mono, pre-sample and pre-detector collimation was open-21’-12’. Measurements were performed in the range 5 to 130 degrees. Single crystal elastic measurements were performed on the HB-3 triple axis instrument at HFIR using a PG(002) monochromator and analyzer with a fixed energy of 14.7 meV. The collimation was 48’-40’-40’-120’ for pre-mono, pre-sample, pre-analyzer and pre-detector. We note that the neutron beam is larger than the samples. We also note that the samples used for neutron scattering in this study correspond to some of the samples used in the previous literature. Specifically, the powder sample was measured in Ref. May et al. (2016) and the single crystal was the one discussed in Ref. Yi et al. (2016).
Scanning tunneling microscope and samples STM and spin-polarized STM was performed using a variable-temperature Omicron STM instrument. The sample was grown using the chemical vapor transport method as described in the Ref. Nguyen et al. (2018). A single crystal of Fe3-xGeTe2 was cleaved in situ in an ultrahigh vacuum at room temperature and then transferred to STM for measuring at 120 K. The atomic-resolution topographic image was acquired using a tungsten tip. Etched ferromagnetic nickel tips were prepared for spin-polarized STM measurements as in our previous reports Nguyen et al. (2018); Park et al. (2017). d/d maps were obtained using a lock-in technique with ac modulation of 1 kHz and 30 mV.
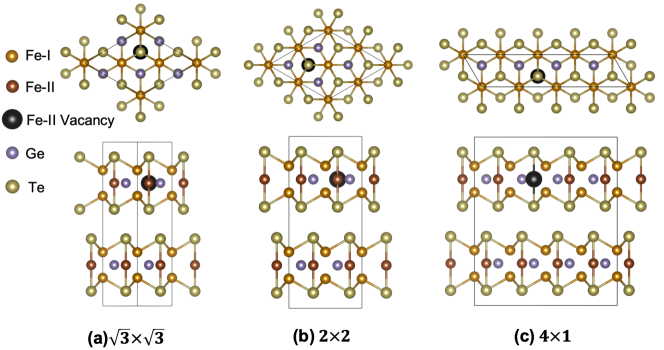
Theoretical methods. DFT Hohenberg and Kohn (1964) within the projected augmented wave method Kresse and Furthmüller (1996); Kresse and Joubert (1999) has been employed, as implemented in the Vienna ab initio simulation package. The generalized gradient approximation of Perdew, Burke and Ernzerhof was used for the electron exchange-correlation functional Perdew et al. (1996). To account for the strong intra-atomic interactions two types of DFT+U approximation schemes were used Dudarev et al. (1998); Liechtenstein et al. (1995). Also approximate van der Waals corrections have been added to treat the interactions between the layered structures, according to the optB86b-vdW method Klimeš et al. (2009, 2011). The in-plane and out-of-plane lattice constants Å and Å, the space group and the initial atomic positions were taken from X-ray diffraction Deiseroth et al. (2006). The relaxation of the atom positions was performed by the conjugate gradient scheme until the maximum force on each atom was less than 1 meVÅ-1, and the total energy was converged to eV. The energy cutoff of the plane waves was chosen as 520 eV. To simulate the effects of Fe-II vacancies three type of supercells have been considered in which the in-plane lattice vectors have been extended, while keeping the out-of-plane lattice vectors fixed. These supercells are depicted in the supplement sup . The k-point grid used for the normal cell, the , and supercells were , , and , respectively. To perform the STM simulations a vacuum of Å was inserted. To simplify the STM simulations, the atomic positions were taken to be those corresponding to the bulk supercells. The STM simulations have been performed with the P4VASP software p4v using the constant current mode. Atomic images were produced with the VESTA program Momma and Izumi (2011).
III Results
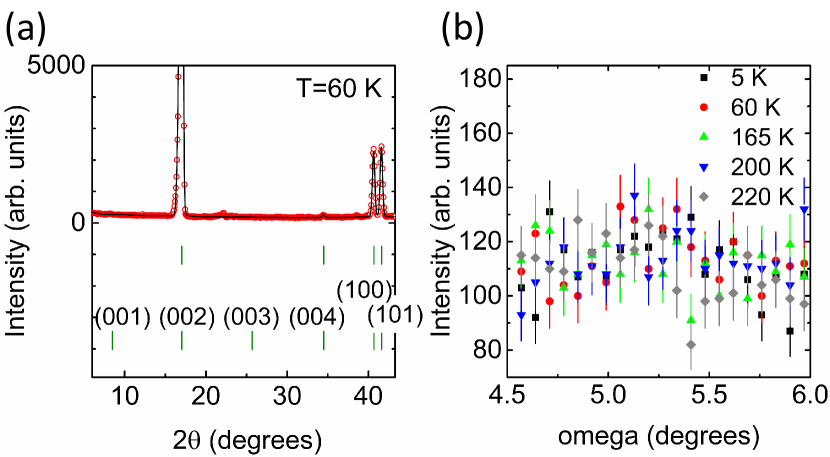
First, to investigate the possibility of interlayer AFM, neutron diffraction experiments were performed as shown in Fig. 2. As we can see from the neutron diffraction in Fig. 2(a) there are no Bragg peaks associated with AFM ordering at (001) and (003). These measurements were performed at 60 K which is well below K for which the kink was observed in the magnetization measurements of Fe3-xGeTe2 Yi et al. (2016). In addition the (003) refection in Fig. 2(b) shows no significant temperature dependence in going from above the magnetic transition at 220 K down to 5 K. These results show there is no interlayer AFM long range order in Fe3-xGeTe2.
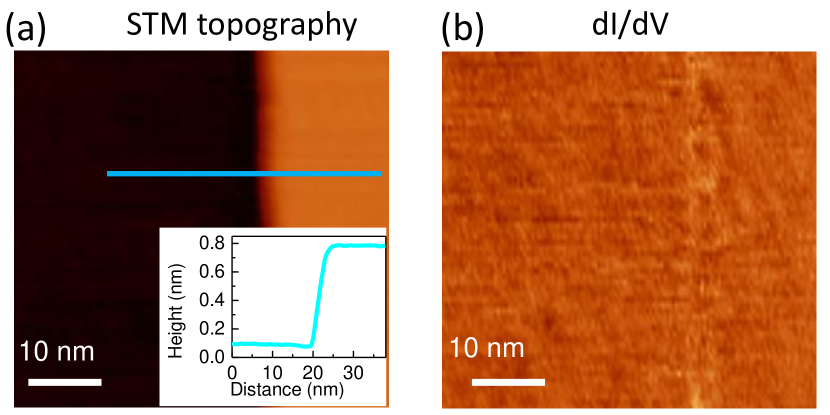
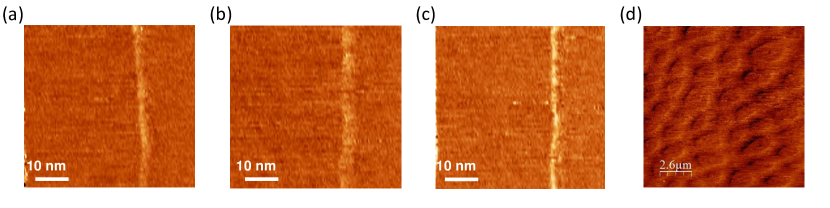
In order to further study the possibility of interlayer AFM order we performed spin-polarized STM measurements across a large number of step-edges. A typical example is shown in Fig 3. The height of a stepped layer is measured to be about 0.7 nm as shown in Fig 3(a), which is roughly consistent with the half of lattice constant in -axis ( nm). Importantly, the map of d/d at bias -0.1 V as shown in Fig 3(b) shows no spin-polarized contrast between the two terraces. This is also confirmed by the d/d maps at biases -0.5 V, -0.2 V and 0.2 V shown in the supplement sup . On the other hand, using the same STM tip, we were able to resolve magnetic domains in Fe3-xGeTe2 sup . We note that no contrast in spin-polarized STM does not necessarily imply the same magnetic configuration. It could also be that the spin-polarized STM is not sensitive enough to detect a difference. Nevertheless, the spin-polarized STM observation is consistent with the neutron scattering measurements discussed above, which show no evidence for AFM coupling between the layers.
| U(eV) | Energy difference (meV) | |||
|---|---|---|---|---|
| cell | cell | cell | cell | |
| 0 | 22.4 | 16.0 | -5.0 | 35.0 |
| 1 | -31.6 | -47.3 | -97.6 | -84.2 |
| 2 | -45.9 | -51.1 | -112.4 | -116.8 |
| 3 | -59.4 | -85.6 | -101.7 | -72.4 |
| 4 | -41.1 | -91.1 | -188.1 | -176.8 |
Following the experimental results, we performed first-principle calculations to investigate the interlayer magnetic coupling in Fe3-xGeTe2. Several reports Zhang et al. (2018); Zhu et al. (2016); Xu et al. (2020) have suggested that correlations in Fe3-xGeTe2 play an important role. Given that Fe is a 3d transition metal this is a reasonable assertion. The simplest approach to treat local Coulomb interactions beyond DFT is via the so-called DFT+U method in which the Hubbard U parameter quantifies the local Coulomb repulsion among the Fe-d orbitals. To this end we first consider the DFT+U scheme implemented by Dudarev et al Dudarev et al. (1998). Tab. 1 shows the energy difference between the interlayer FM and AFM configurations as a function of U. The second column corresponds to the Fe3GeTe2 normal cell without Fe-II vacancies. When eV, the energy difference between FM and AFM configuration for the normal cell without vacancies is meV, which is consistent with the DFT without U calculation reported in Ref. Yi et al. (2016). However, as we increase U from 0 to 4 eV, the energy difference gives negative values as shown in the second column of Table 1. The negative energy difference for the listed finite U values show that the ground state of Fe3GeTe2 has an interlayer FM ordering for the case without vacancies, consistent with the experimental observations. When using the DFT+U scheme implemented by Liechtenstein et al Liechtenstein et al. (1995), the same conclusion is reached. sup
In Ref. Jang et al. (2019) it has been concluded that Fe-II vacancies are responsible for inducing the ferromagnetism in Fe3-xGeTe2. To study the effect of Fe-II vacancies we considered the , and single Fe-II vacancy supercells defined in the supplement sup . Tab. 1 shows the total energy of the FM configuration per supercell relative to that of the AFM configuration for these various supercells. Let us first focus on the results. Just like in Ref. Jang et al. (2019) we find that for the supercell the Fe-II vacancy flips the FM configuration from being energetically unfavorable to favorable. However, for the and supercells we find that the Fe-II vacancies don’t reduce the total energy of the FM configuration relative to that of the AFM configuration enough to stabalize it. Therefore it seems we cannot draw a simple conclusion about the influence of Fe-II vacancies on the stability of the FM and AFM configurations. On the other hand, we see from Tab. 1 that for all the listed finite values of U the FM configuration has the lowest energy in all the three supercells, in agreement with the experimental observations.
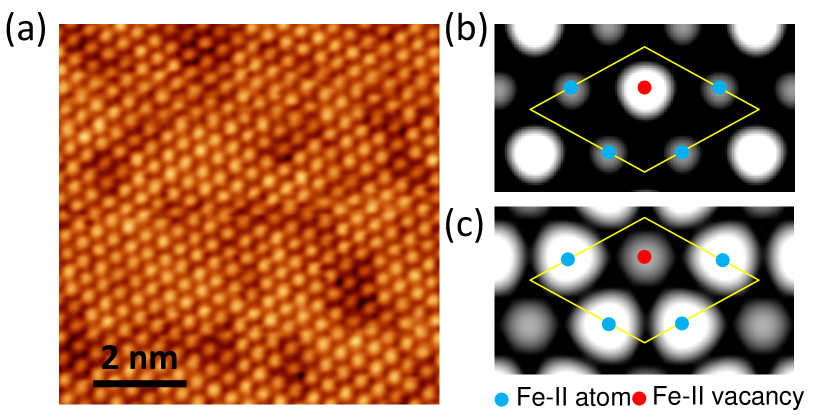
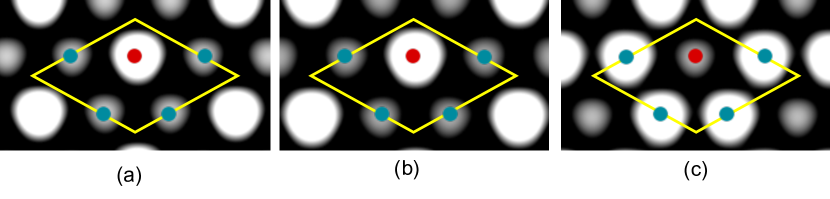
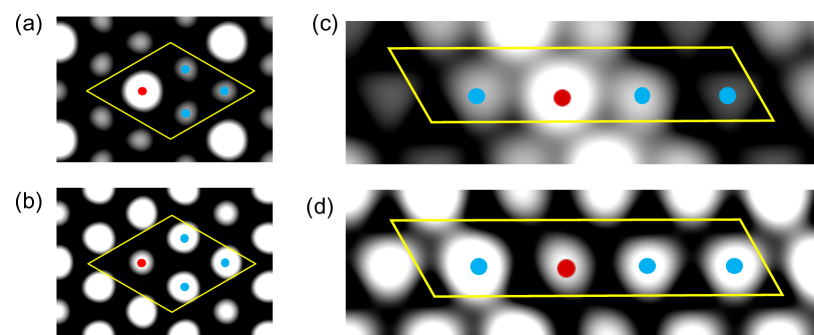
Finally we find that the DFT+U approximation is also more consistent with recent STM experiments compared to plain DFT. Naturally, Fe3-xGeTe2 is Te terminated, so the STM tip is probing the local electronic structure above the Te atoms. The Te atoms in turn are located directly above the Fe-II atoms. In Ref. Nguyen et al. (2018) it had been shown that the STM intensities above the Fe-II vacancies is darker than those above the Fe-II atoms. In Fig.4(a) a similar experimental STM image is presented that shows the same effect. To simulate the STM around Fe-II vacancies we perform DFT+U calculations on a supercell with a single Fe vacancy in it. Fig.4(c) shows that the contrast seen in STM is reproduced by the FM solution for eV, because the STM intensity above the Fe-II vacancy is lower compared to the sites that are above the Fe-II atoms. On the other hand the STM simulation based on the AFM solution for , shown in Fig.4(b), has the opposite contrast: the STM intensity is bright/dark above the Fe-II vacancies/atoms. In other words, the STM simulation based on DFT without U corrections qualitatively disagrees with the STM experiments. In the supplement we demonstrate the same conclusion for the and single Fe-II vacancy supercells sup .
To better understand the origin of the STM contrast above the Fe-II vacancies and Fe-II atoms we analyzed the relaxed positions and local density of states of the Te atoms that are located directly above the Fe-II atoms. For all the considered Fe-II vacancy supercells and values of the Hubbard U, in both the FM and AFM configuration, the Te heights above the Fe-II vacancies are lower than the Te heights above the Fe-II atoms sup . So even for the AFM DFT case without a Hubbard U correction we find that the Te height above the Fe-II vacancy is lowered despite the fact that the STM intensity above these Te atoms is raised. This suggest that the origin of the contrast in the STM is electronic in nature instead of structural. To study the electronic contributions to the STM intensity we consider the local density of states (DOS) of the Te- orbitals integrated between the bias voltage of -0.5 eV used in the STM experiment and the Fermi energy. For all three supercells we find that for the AFM DFT simulation without a Hubbard U correction the integrated DOS of the Te- orbitals above the Fe-II vacancies is higher than the integrated DOS of the Te- orbitals above the Fe-II atoms. For the FM DFT+U simulations with eV this is reversed sup . This further confirms that indeed the contrast in the STM simulations is driven by changes in the local electronic structure.
IV Discussion
In our work we find that the interlayer magnetic coupling in Fe3-xGeTe2 is FM and that in order to capture this theoretically, Hubbard U corrections need to be included within DFT. This conclusion is consistent with some earlier studies that highlight the importance of correlation effects in Fe3-xGeTe2 Zhang et al. (2018); Zhu et al. (2016); Xu et al. (2020). While we have focused on the interlayer magnetic coupling in our study, our conclusion that local Coulomb interactions play an important role in Fe3-xGeTe2 will help understanding the properties of this system in general.
One question that remains unanswered is why the DFT calculations show that upon including a Hubbard U correction, Fe3-xGeTe2 undergoes an AFM to FM transition. More generally this ties to the question what the nature is of the FM interlayer coupling. In the van der Waals system CrI3 it has been concluded that the interlayer magnetic coupling is controlled by the super-superexchange mechanism Sivadas et al. (2018). However, unlike CrI3, Fe3-xGeTe2 is metallic. In particular, the in-plane as well as the out-of-plane resistivity does not show activation behavior as a function of temperature. Kim et al. (2018). At the same time there have been several reports with evidence for the presence of local moments in Fe3-xGeTe2 Zhang et al. (2018); Zhu et al. (2016); Xu et al. (2020); Calder et al. (2019). One possibility is that within pure DFT the AFM is driven by nesting conditions in the out-of-plane band structure and that within DFT+U a FM exchange mechanism based on local moments becomes dominant. Since the AFM coupling occurs between layers within the unit cell, the nesting properties cannot directly be analyzed from the band structure. Instead one can compute the Lindhard function to study a spin-wave density scenario as was done for example for the case of intra-unitcell AFM in RuO2 Berlijn et al. (2017). We leave such an endeavor for future studies.
Another question is how the magnetization measurements can be interpreted given that there is no AFM in Fe3-xGeTe2. Specifically in Ref. Yi et al. (2016) it has been shown that the ZFC magnetization curve for low magnetic fields along the easy axis is very close to zero at low temperatures. This is indicative of AFM Kittel (1996). Furthermore, the magnetization curves display a kink around a characteristic temperature that is below the magnetic ordering temperature . In Ref. Tian et al. (2019) these findings in the magnetization measurements have been reproduced. However, the authors of Ref. Tian et al. (2019) argue that domain-wall pinning is a more likely explanation for the observed behavior than AFM. After cooling Fe3-xGeTe2 in zero external field it contains an equal number of domains parallel and anti-parallel to the easy axis. Then if the magnetic fields and the temperatures are too low, the walls between these domains remain pinned and the induced magnetization stays negligible. The kink at is interpreted in Ref. Tian et al. (2019) as the temperature at which the domain walls depin. Magnetic force microscopy measurements have shown that the magnetic domains evolve from a branching structure at to a bubble structure at and remain constant at lower temperatures Yi et al. (2016). It would be interesting to see if in future studies these observations can be understood within a domain-wall depinning scenario.
V Conclusions
Using neutron diffraction, scanning tunneling microscopy, spin-polarized STM and DFT+U based total energy calculations and STM simulations we have studied the question whether the magnetic interlayer ordering in Fe3-xGeTe2 is FM or AFM. Based on our experimental results and the previous results in the literature we conclude that Fe3-xGeTe2 is FM. The resolution of the out-of-plane magnetic order is important given that it controls the time-reversal and inversion symmetry and therefore many physical properties such as the topology, second harmonic generation and piezo electricity to mention but a few. To theoretically reproduce the experimental observations we have learned that it is necessary to include Hubbard U corrections beyond pure DFT. This conclusion derived from the interlayer magnetic coupling will help understanding the electronic and magnetic properties of Fe3-xGeTe2 in general.
Acknowledgements.
We thank R. Fishman for valuable discussions. This research was conducted at the Center for Nanophase Materials Sciences, which is a DOE Office of Science User Facility. We used resources of the Compute and Data Environment for Science (CADES) at the Oak Ridge National Laboratory, which is supported by the Office of Science of the U.S. Department of Energy under Contract No. DE-AC05-00OR22725. In addition we used resources of the National Energy Research Scientific Computing Center, a DOE Office of Science User Facility supported by the Office of Science of the U.S. DOE under Contract No. DE-AC02-05CH11231. This research used resources at the High Flux Isotope Reactor, a DOE Office of Science User Facility operated by the Oak Ridge National Laboratory. Sample synthesis (A.F.M.) was supported by the U. S. Department of Energy, Office of Science, Basic Energy Sciences, Materials Sciences and Engineering Division. This manuscript has been authored by UT-Battelle, LLC under Contract No. DE-AC05-00OR22725 with the U.S. Department of Energy. The United States Government retains and the publisher, by accepting the article for publication, acknowledges that the United States Government retains a non-exclusive, paid-up, irrevocable, world-wide license to publish or reproduce the published form of this manuscript, or allow others to do so, for United States Government purposes. The Department of Energy will provide public access to these results of federally sponsored research in accordance with the DOE Public Access Plan (http://energy.gov/downloads/doe-public-access-plan).References
- Novoselov et al. (2016) K. Novoselov, A. Mishchenko, A. Carvalho, and A. C. Neto, Science 353, aac9439 (2016).
- Geim and Grigorieva (2013) A. K. Geim and I. V. Grigorieva, Nature 499, 419 (2013).
- Deng et al. (2018a) Y. Deng, Y. Yu, Y. Song, J. Zhang, N. Z. Wang, Z. Sun, Y. Yi, Y. Z. Wu, S. Wu, J. Zhu, et al., Nature 563, 94 (2018a).
- Deiseroth et al. (2006) H.-J. Deiseroth, K. Aleksandrov, C. Reiner, L. Kienle, and R. K. Kremer, European journal of inorganic chemistry 2006, 1561 (2006).
- Chen et al. (2013) B. Chen, J. Yang, H. Wang, M. Imai, H. Ohta, C. Michioka, K. Yoshimura, and M. Fang, Journal of the Physical Society of Japan 82, 124711 (2013).
- Verchenko et al. (2015) V. Y. Verchenko, A. A. Tsirlin, A. V. Sobolev, I. A. Presniakov, and A. V. Shevelkov, Inorganic chemistry 54, 8598 (2015).
- León-Brito et al. (2016) N. León-Brito, E. D. Bauer, F. Ronning, J. D. Thompson, and R. Movshovich, Journal of Applied Physics 120, 083903 (2016).
- May et al. (2016) A. F. May, S. Calder, C. Cantoni, H. Cao, and M. A. McGuire, Physical Review B 93, 014411 (2016).
- Zhu et al. (2016) J.-X. Zhu, M. Janoschek, D. Chaves, J. Cezar, T. Durakiewicz, F. Ronning, Y. Sassa, M. Mansson, B. Scott, N. Wakeham, et al., Physical Review B 93, 144404 (2016).
- Zhuang et al. (2016) H. L. Zhuang, P. Kent, and R. G. Hennig, Physical Review B 93, 134407 (2016).
- Liu et al. (2017) Y. Liu, V. N. Ivanovski, C. Petrovic, et al., Physical Review B 96, 144429 (2017).
- Yi et al. (2016) J. Yi, H. Zhuang, Q. Zou, Z. Wu, G. Cao, S. Tang, S. Calder, P. Kent, D. Mandrus, and Z. Gai, 2D Materials 4 (2016).
- Nguyen et al. (2018) G. D. Nguyen, J. Lee, T. Berlijn, Q. Zou, S. M. Hus, J. Park, Z. Gai, C. Lee, and A.-P. Li, Physical Review B 97, 014425 (2018).
- Zhang et al. (2018) Y. Zhang, H. Lu, X. Zhu, S. Tan, W. Feng, Q. Liu, W. Zhang, Q. Chen, Y. Liu, X. Luo, et al., Science advances 4, eaao6791 (2018).
- Ding et al. (2019) B. Ding, Z. Li, G. Xu, H. Li, Z. Hou, E. Liu, X. Xi, F. Xu, Y. Yao, and W. Wang, arXiv preprint arXiv:1912.11228 (2019).
- Wang et al. (2019a) H. Wang, C. Wang, Y. Zhu, Z.-A. Li, H. Zhang, H. Tian, Y. Shi, H. Yang, and J. Li, arXiv preprint arXiv:1907.08382 (2019a).
- Park et al. (2019) T.-E. Park, L. Peng, X. Zhang, S. J. Kim, K. M. Song, K. Kim, M. Weigand, G. Schütz, S. Finizio, J. Raabe, et al., arXiv preprint arXiv:1907.01425 (2019).
- Wu et al. (2019) Y. Wu, S. Zhang, J. Zhang, W. Wang, Y. L. Zhu, J. Hu, K. Wong, C. Fang, C. Wan, X. Han, et al., arXiv preprint arXiv:1907.11349 (2019).
- You et al. (2019) Y. You, Y. Gong, H. Li, Z. Li, M. Zhu, J. Tang, E. Liu, Y. Yao, G. Xu, F. Xu, et al., Physical Review B 100, 134441 (2019).
- Kim et al. (2018) K. Kim, J. Seo, E. Lee, K.-T. Ko, B. Kim, B. G. Jang, J. M. Ok, J. Lee, Y. J. Jo, W. Kang, et al., Nature materials 17, 794 (2018).
- Song et al. (2018) T. Song, X. Cai, M. W.-Y. Tu, X. Zhang, B. Huang, N. P. Wilson, K. L. Seyler, L. Zhu, T. Taniguchi, K. Watanabe, et al., Science 360, 1214 (2018).
- Wang et al. (2019b) X. Wang, J. Tang, X. Xia, C. He, J. Zhang, Y. Liu, C. Wan, C. Fang, C. Guo, W. Yang, et al., Science advances 5, eaaw8904 (2019b).
- Fei et al. (2018) Z. Fei, B. Huang, P. Malinowski, W. Wang, T. Song, J. Sanchez, W. Yao, D. Xiao, X. Zhu, A. F. May, W. Wu, D. H. Cobden, J.-H. Chu, and X. Xu, Nat. Mater 17, 778 (2018).
- Deng et al. (2018b) Y. Deng, Y. Yu, Y. Song, J. Zhang, N. Z. Wang, Z. Sun, Y. Yi, Y. Z. Wu, S. Wu, J. Zhu, J. Wang, X. H. Chen, and Y. Zhang, Nature 563, 94 (2018b).
- Jang et al. (2019) S. W. Jang, M. Y. Jeong, H. Yoon, S. Ryee, and M. J. Han, arXiv preprint arXiv:1904.04510 (2019).
- Li et al. (2019) J. Li, Y. Li, S. Du, Z. Wang, B.-L. Gu, S.-C. Zhang, K. He, W. Duan, and Y. Xu, Science Advances 5 (2019), 10.1126/sciadv.aaw5685.
- Klein et al. (2018) D. R. Klein, D. MacNeill, J. L. Lado, D. Soriano, E. Navarro-Moratalla, K. Watanabe, T. Taniguchi, S. Manni, P. Canfield, J. Fernández-Rossier, et al., Science 360, 1218 (2018).
- Sun et al. (2019) Z. Sun, Y. Yi, T. Song, G. Clark, B. Huang, Y. Shan, S. Wu, D. Huang, C. Gao, Z. Chen, M. McGuire, T. Cao, D. Xiao, W.-T. Liu, W. Yao, X. Xu, and S. Wu, Nature 572, 497 (2019).
- Jothi et al. (2019) P. Jothi, J. Scheifers, Y. Zhang, M. Alghamdi, D. Stekovic, M. Itkis, J. Shi, and B. Fokwa, Phys. Status Solidi RRL , 1900666 (2019).
- Stahl et al. (2018) J. Stahl, E. Shlaen, and D. Johrendt, Z. Anorg. Allg. Chem. 644, 1923 (2018).
- May et al. (2019a) A. F. May, D. Ovchinnikov, Q. Zheng, R. Hermann, S. Calder, B. Huang, Z. Fei, Y. Liu, X. Xu, and M. A. McGuire, ACS Nano 13, 4436 (2019a).
- May et al. (2019b) A. F. May, C. A. Bridges, and M. A. McGuire, Phys. Rev. Materials 3, 104401 (2019b).
- Calder et al. (2018) S. Calder, K. An, R. Boehler, C. R. Dela Cruz, M. D. Frontzek, M. Guthrie, B. Haberl, A. Huq, S. A. J. Kimber, J. Liu, J. J. Molaison, J. Neuefeind, K. Page, A. M. dos Santos, K. M. Taddei, C. Tulk, and M. G. Tucker, Review of Scientific Instruments 89, 092701 (2018).
- Park et al. (2017) J. Park, C. Park, M. Yoon, and A.-P. Li, Nano Letters 17, 292 (2017).
- Hohenberg and Kohn (1964) P. Hohenberg and W. Kohn, Physical review 136, B864 (1964).
- Kresse and Furthmüller (1996) G. Kresse and J. Furthmüller, Physical review B 54, 11169 (1996).
- Kresse and Joubert (1999) G. Kresse and D. Joubert, Physical review b 59, 1758 (1999).
- Perdew et al. (1996) J. P. Perdew, K. Burke, and M. Ernzerhof, Physical review letters 77, 3865 (1996).
- Dudarev et al. (1998) S. Dudarev, G. Botton, S. Savrasov, C. Humphreys, and A. Sutton, Physical Review B 57, 1505 (1998).
- Liechtenstein et al. (1995) A. I. Liechtenstein, V. I. Anisimov, and J. Zaanen, Phys. Rev. B 52, R5467 (1995).
- Klimeš et al. (2009) J. Klimeš, D. R. Bowler, and A. Michaelides, Journal of Physics: Condensed Matter 22, 022201 (2009).
- Klimeš et al. (2011) J. Klimeš, D. R. Bowler, and A. Michaelides, Physical Review B 83, 195131 (2011).
- (43) Technical details are provided in the Supplementary Information.
- (44) www.p4vasp.at.
- Momma and Izumi (2011) K. Momma and F. Izumi, Journal of Applied Crystallography 44, 1272 (2011).
- Xu et al. (2020) X. Xu, Y. W. Li, S. R. Duan, S. L. Zhang, Y. J. Chen, L. Kang, A. J. Liang, C. Chen, W. Xia, Y. Xu, et al., arXiv preprint arXiv:2004.10379 (2020).
- Sivadas et al. (2018) N. Sivadas, S. Okamoto, X. Xu, C. J. Fennie, and D. Xiao, Nano Letters 18, 7658 (2018), pMID: 30408960.
- Calder et al. (2019) S. Calder, A. I. Kolesnikov, and A. F. May, Phys. Rev. B 99, 094423 (2019).
- Berlijn et al. (2017) T. Berlijn, P. C. Snijders, O. Delaire, H.-D. Zhou, T. A. Maier, H.-B. Cao, S.-X. Chi, M. Matsuda, Y. Wang, M. R. Koehler, P. R. C. Kent, and H. H. Weitering, Phys. Rev. Lett. 118, 077201 (2017).
- Kittel (1996) C. Kittel, Introduction to Solid State Physics (Wiley, 1996).
- Tian et al. (2019) C.-K. Tian, C. Wang, W. Ji, J.-C. Wang, T.-L. Xia, L. Wang, J.-J. Liu, H.-X. Zhang, and P. Cheng, Phys. Rev. B 99, 184428 (2019).
[Supplementary Information] Interlayer magnetism in Fe3-xGeTe2
I Spin-polarized scanning tunneling spectroscopy
Fig. S1(a)-(c) show additional spin-polarized differential conductance (d/d) maps across the step edge at various biases. Similar to the one in Fig. 3(b) in the manuscript, these spin-polarized maps do not display a magnetic contrast between the terraces. The bright-line feature at the step edge is likely corresponding to edge states. Fig. S1(d) shows a spin-polarized STM topography image that reveals magnetic domains on the flat terrace, similar as seen in Ref. Nguyen et al. (2018).
II Fe-II vacancy supercells
Fig. S2 shows the supercells used in this study to simulate Fe-II vacancies.
III STM simulations
Fig. S3 displays STM simulations for the Fe-II vacancy supercell in the magnetic groundstate configuration as a function of U. These images show how the STM intensity above the Fe-II vacancy, relative to the STM intensity above the Fe-II atoms, changes from bright to dark upon increasing U. Fig. S4 shows the same for two other supercells.
IV Liechtenstein DFT+U functional
Table SI shows that also for the DFT+U scheme implemented by Liechtenstein et al Liechtenstein et al. (1995) the interlayer FM ordering is energetically favorable in Fe3GeTe2 for all listed non-zero values of the Hubbard and Hund’s coupling parameters.
| U (eV) | ||
|---|---|---|
| 0 | 30.0 | 16.4 |
| 1 | -26.4 | -4.9 |
| 2 | -45.7 | -40.0 |
| 3 | -35.3 | -37.6 |
| 4 | -39.6 | -34.4 |
V Te heights
Table SII shows that for all the considered Fe-II vacancy supercells and values of the Hubbard U, in both the FM and AFM configuration, the Te heights above the Fe-II vacancies are lower than the Te heights above the Fe-II atoms.
| U (eV) | ||||||
|---|---|---|---|---|---|---|
| FM | AFM | FM | AFM | FM | AFM | |
| 0 | 8.3 | 8.4 | 8.1 | 7.6 | 10.1 | 9.3 |
| 1 | 8.8 | 9.9 | ||||
| 2 | 10.7 | 12.6 | ||||
| 3 | 22.4 | 20.0 | ||||
| 4 | 24.9 | 23.5 | 16.0 | 15.2 | 10.8 | 9.4 |
VI Integrated Te-p Density of States
Table SIII shows that for the AFM DFT simulation without a Hubbard U correction the integrated DOS of the Te- orbitals above the Fe-II vacancies is higher than the integrated DOS of the Te- orbitals above the Fe-II atoms. For the FM DFT+U simulations with eV this is reversed.
| U (eV) | ||||||
|---|---|---|---|---|---|---|
| Fe-II atom | Fe-II vacancy | Fe-II atom | Fe-II vacancy | Fe-II atom | Fe-II vacancy | |
| 0 | 0.077 | 0.144 | 0.084 | 0.119 | 0.068 | 0.126 |
| 4 | 0.160 | 0.083 | 0.128 | 0.121 | 0.139 | 0.119 |
References
- Nguyen et al. (2018) G. D. Nguyen, J. Lee, T. Berlijn, Q. Zou, S. M. Hus, J. Park, Z. Gai, C. Lee, and A.-P. Li, Physical Review B 97, 014425 (2018).
- Liechtenstein et al. (1995) A. I. Liechtenstein, V. I. Anisimov, and J. Zaanen, Phys. Rev. B 52, R5467 (1995).
- Dudarev et al. (1998) S. Dudarev, G. Botton, S. Savrasov, C. Humphreys, and A. Sutton, Physical Review B 57, 1505 (1998).