Phase Diagram and Superconductivity of Calcium Borohyrides at Extreme Pressures
Abstract
Motivated by the recent discovery of near-room temperature superconductivity in high-pressure superhydrides, we investigate from first-principles the high-pressure superconducting phase diagram of the ternary Ca-B-H system, using ab-initio evolutionary crystal structure prediction, and Density Functional Perturbation Theory. We find that below 100 GPa all stable and weakly metastable phases are insulating. This pressure marks the appearance of several new chemically-forbidden phases on the hull of stability, and the first onset of metalization in CaBH5. Metallization is then gradually achieved at higher pressure at different compositions. Among the metallic phases stable in the Megabar regime, we predict two high- superconducting phases with CaBH6 and Ca2B2H13 compositions, with critical temperatures of 119 and 89 K at 300 GPa, respectively, surviving to lower pressures. Ternary hydrides will most likely play a major role in superconductivity research in the coming years; our study suggests that, in order to reduce the pressure for the onset of metallicity and superconductivity, further explorations of ternary hydrides should focus on elements less electronegative than boron.
Introduction
The search for high-temperature superconductors in hydrogen-rich systems stems from two seminal intuitions of Neil Ashcroft’s, i.e. that hydrogen, under sufficiently high pressures, may be turned into a metallic room-temperature superconductor, and that the same result may be achieved at lower pressures exploiting chemical precompression in hydrides Ashcroft (1968, 2004). This second intuition, in particular, led to a major breakthrough in 2014, with the experimental discovery that sulfur hydride (SH3), under a pressure of 200 GPa, becomes a superconductor with a critical temperature () of 203 KDrodzov et al. (2015a); Duan et al. (2015). After the discovery of SH3, other superconducting hydrides were found, with lanthanum hydride (LaH10) currently holding the record, with a of 260 K Drodzov et al. (2019); Somayazulu et al. (2019); Troyan et al. (2019); Semenok et al. (2020a); Drodzov et al. (2015b); Kong et al. (2019). All these high- hydrides are remarkable examples of high-pressure forbidden chemistry, as their H-rich chemical compositions defy the standard rules on oxidation states and coordination; it is arguable that their existence would have never been anticipated, without theoretical predictions enabled by ab-initio methods based on Density Functional Theory (DFT) methods for crystal structure prediction and superconductivity, developed in the last 20 years.Oganov et al. (2019); Baroni et al. (2001); Allen and Dynes (1975); Oliveira et al. (1988); Sanna et al. (2018); Flores-Livas et al. (2020).
High- superhydrides belong to the class of conventional superconductors, where the superconducting pairing is mediated by phonons. For this class of materials, Migdal-Eliashberg theory, combined with first-principles calculations of the electron-phonon coupling, permits to make quantitative predictions of superconducting properties. Based on Migdal-Eliashberg theory and experience, the highest among conventional superconductors are expected in materials, which: ) contain light elements, exhibit a sizable density of states (DOS) at the Fermi level, typical of good metals, and large electron-phonon (e-ph ) matrix elements, characteristic of systems with contain directional (covalent or ionic) bonds An and Pickett (2001); Boeri et al. (2004). Whereas the first requirement is satisfied by any compound containing hydrogen, which is the lightest element in the periodic table, the other two conditions are met only by a few hydrides, and only at extreme pressures.
In the last five years, many research groups, galvanized by the ground-breaking SH3 discovery, devoted their efforts to the exploration of all possible binary hydrides, i.e. compounds with chemical formula AxHy. Flores-Livas et al. (2020); Semenok et al. (2020b); Wang et al. (2018); Zurek and Bi (2019); Pickard et al. (2020) As of 2020, this exploration has been essentially completed, showing that only around 10% of the elements of the periodic table form high-pressure binary hydrides with superconducting s exceeding nitrogen boiling temperature (77 K). These can be grouped essentially in two main families, depending on the size and electronegativity of the A element.
The first family is that of covalent hydrides, in which A can be a metalloid or non-metal. At low pressure, covalent hydrides form molecular crystals, which are large-gap insulators Benoit et al. (1996); Flores-Livas et al. (2018); Sun et al. (2007). Pressures in the Megabar (100 GPa) range can render some of these compounds metallic, through band overlap. Some of these metallic molecular hydrides, such as phosphorous, silicon or sulfur hydrides, exhibit superconductivity, with s that can be as high as 100 K Eremets et al. (2008); Feng et al. (2006); Pickard and Needs (2006); Flores-Livas et al. (2016a); Drodzov et al. (2015b); Li et al. (2014); Esfahani et al. (2017); Gao et al. (2008); Zhang et al. (2015). Increasing pressure even further, in a few systems molecular bonds break, and, as additional hydrogen is incorporated into the A-H lattice, compounds with completely different stoichiometries and geometrical motifs form, in which hydrogen and the guest atom arrange in highly symmetric structures, which are metallic and held together by covalent, directional bonds. This is the case, for example, of SeH3 and SH3, where ’s can be as high as 200 K Flores-Livas et al. (2016b); Drodzov et al. (2015a); Duan et al. (2015); Errea et al. (2015); Heil and Boeri (2015); Akashi et al. (2016).
The second family of high- binary hydrides comprises weak hydrogen formers, such as alkaline earths, lanthanoids, actinoids, and early transition metals. Within this family, the highest s are usually found in hydrogen clathrate structures, characterized by highly symmetric H cages surrounding a central atom Peng et al. (2017). Several of these clathrate hydrides, which form at pressures around 100 GPa, were predicted to achieve superconducting above 200 K, Wang et al. (2011); Feng et al. (2015); Peng et al. (2017); Heil et al. (2019); Liu et al. (2017); Semenok et al. (2020a), and YH6, YH9, LaH10, ThH10 were experimentally confirmed as near-room temperature superconductors Somayazulu et al. (2019); Drodzov et al. (2019); Kong et al. (2019); Troyan et al. (2019); Semenok et al. (2020a).
After the binary hydrides have been thoroughly explored, the natural route to improve the superconducting properties of high-pressure hydrides, either by reducing the pressures needed to achieve high , or by increasing the maximum , is to consider ternary hydrides - materials with AxByHz composition, where the presence of two different elements, A and B, opens many routes for the optimization of material properties. However, the increased flexibility of ternary hydrides comes at a high price, since accounting for possible decomposition paths requires exploring a much larger compositional space than in the case of binaries. For this reason, only a few out of the six-thousand possible ternary hydrides have been investigated to date pta . Most studies in literature have been focusing on optimization of known hydrides, by iso- or eterovalent substitution, Li et al. (2018a); Cui et al. (2020); Ge et al. (2016); Liu et al. (2018); Heil and Boeri (2015); Amsler (2019); Liang et al. (2019a, b), and only a few works taken into account the full thermodynamics of ternary phasesKokail et al. (2017); Sun et al. (2019).
In this work, we used first-principles methods for evolutionary structure prediction Glass et al. (2006) and superconductivity Baroni et al. (2001); Giannozzi et al. (2009) to explore computationally the full high-pressure phase diagram of the calcium-boron-hydrogen (Ca-B-H) ternary system to identify new superconductors. Calcium boron hydrides are part of the broad family of metal-boron-hydrides (MBH), which have been extensively studied for hydrogen storage applications at room pressure. Züttel et al. (2007); Paskevicius et al. (2017). MBH are characterized by the simultaneous presence of a weak (M) hydride former, and a strong (B) hydride former, which forms strong (covalent or ionic) bonds with hydrogen. At ambient conditions, metal borohydrides adopt a M(BH4)n stoichiometry, in which tetrahedral BH anions, similar to methane, are loosely arranged on an open lattice, and accomodate mono-, di- or trivalent cations in the interstitials. Besides the stable M(BH4)n compositions, other metastable phases have been predicted to form,Zhang et al. (2010) containing BH and BH anions, with ethane- and polyethylene-like motifs. The similarity between MBH and hydrocarbons makes them very attractive candidates for superconductivity, since they combine in a single compound the strong directional bonds typical of covalent hydrides,Flores-Livas et al. (2018) with the possibility of controlling charge doping via interstitial atoms. Indeed, a theoretical study in lithium boron hydride showed that, while at ambient pressure all stable and metastable phases are wide-gap ionic insulators, at pressures in the megabar range covalent metallic structures with increased hydrogen content should become stable; a high-, metallic, highly symmetric Li2BH6 phase with a of 98 K was predicted to form at 100 GPaKokail et al. (2017).
In this paper, we will analyze the high-pressure phase diagram of Ca-B-H with the precise aim of identifying new hydrogen-rich, covalent metallic structures, analogous to SH3, exhibiting high- conventional superconductivity. We will show that, although such structures do indeed form, electronic structure features amenable to the chemical properties of calcium and boron limit the maximum achievable and their stability range, making calcium borohydrides not competitive with the record binary hydrides, such as SH3 and LaH10.
The paper is organized as follows: in section I we will present the phase diagram as a function of pressure, highlighting the evolution of the structural properties of the stable phases. In section II we will present the electronic properties of the stable and metastable phases, focusing in more detail on the new metallic structures that we identify at high pressures. In section III, we will then investigate the electron-phonon properties, and discuss which specific electronic and structural features lead to low or high- in the different phases. In section IV we will draw the main conclusions of our work. The Appendixes contain figures of the electronic DOS for all structures, band structure plots for selected high-pressure phases, as well as an extensive account of the computational details.
I Phase diagram
The Ca-B-H phase diagram at ambient pressure is well-characterized, since it was extensively studied for hydrogen storage applications. The ground state phase Ca(BH4)2 decomposes above 300oC through different channels: either towards CaH2, H2, and CaB12H12, or towards CaH2, CaB6 and H2, through an intermediate Ca(BH3)2 phaseRiktor et al. (2009); Yan et al. (2015); Kim et al. (2012a, b); Ozolins et al. (2008). These experimental observations are reproduced by first-principles calculations, which showed that the two pathways are quasi-degenerate Zhang et al. (2010).
To the best of our knowledge, there are no predictions on the behavior of the ternary phase diagram under pressure, including intermediate Ca-B-H compositions. However, the pressure behavior of the binary systems (Ca-B, Ca-H, B-H), which form the edge of the ternary hull, was studied by ab-initio calculations in recent years, in search for possible superconductors. Superconducting structures were found in all three systems, with a maximum of 235 K in CaH6 and 21 K in BH, both above 150 GPa, and 6 K in CaB at 30 GPa Shah and Kolmogorov (2013); Wang et al. (2011); Hu et al. (2013).
In this study, to obtain the phase diagram as a function of pressure, we sampled the full ternary Ca-B-H phase space with variable-composition structural searches at fixed pressures (0, 50, 100, and 300 GPa) to identify the compositions stable at room, intermediate, and extreme pressures. More than 4000 unique structures were sampled for each pressure. The lowest-enthalpy structures for each composition identified in these runs were then relaxed at intermediate pressures to obtain the phase diagram. Further details can be found in Appendix B.
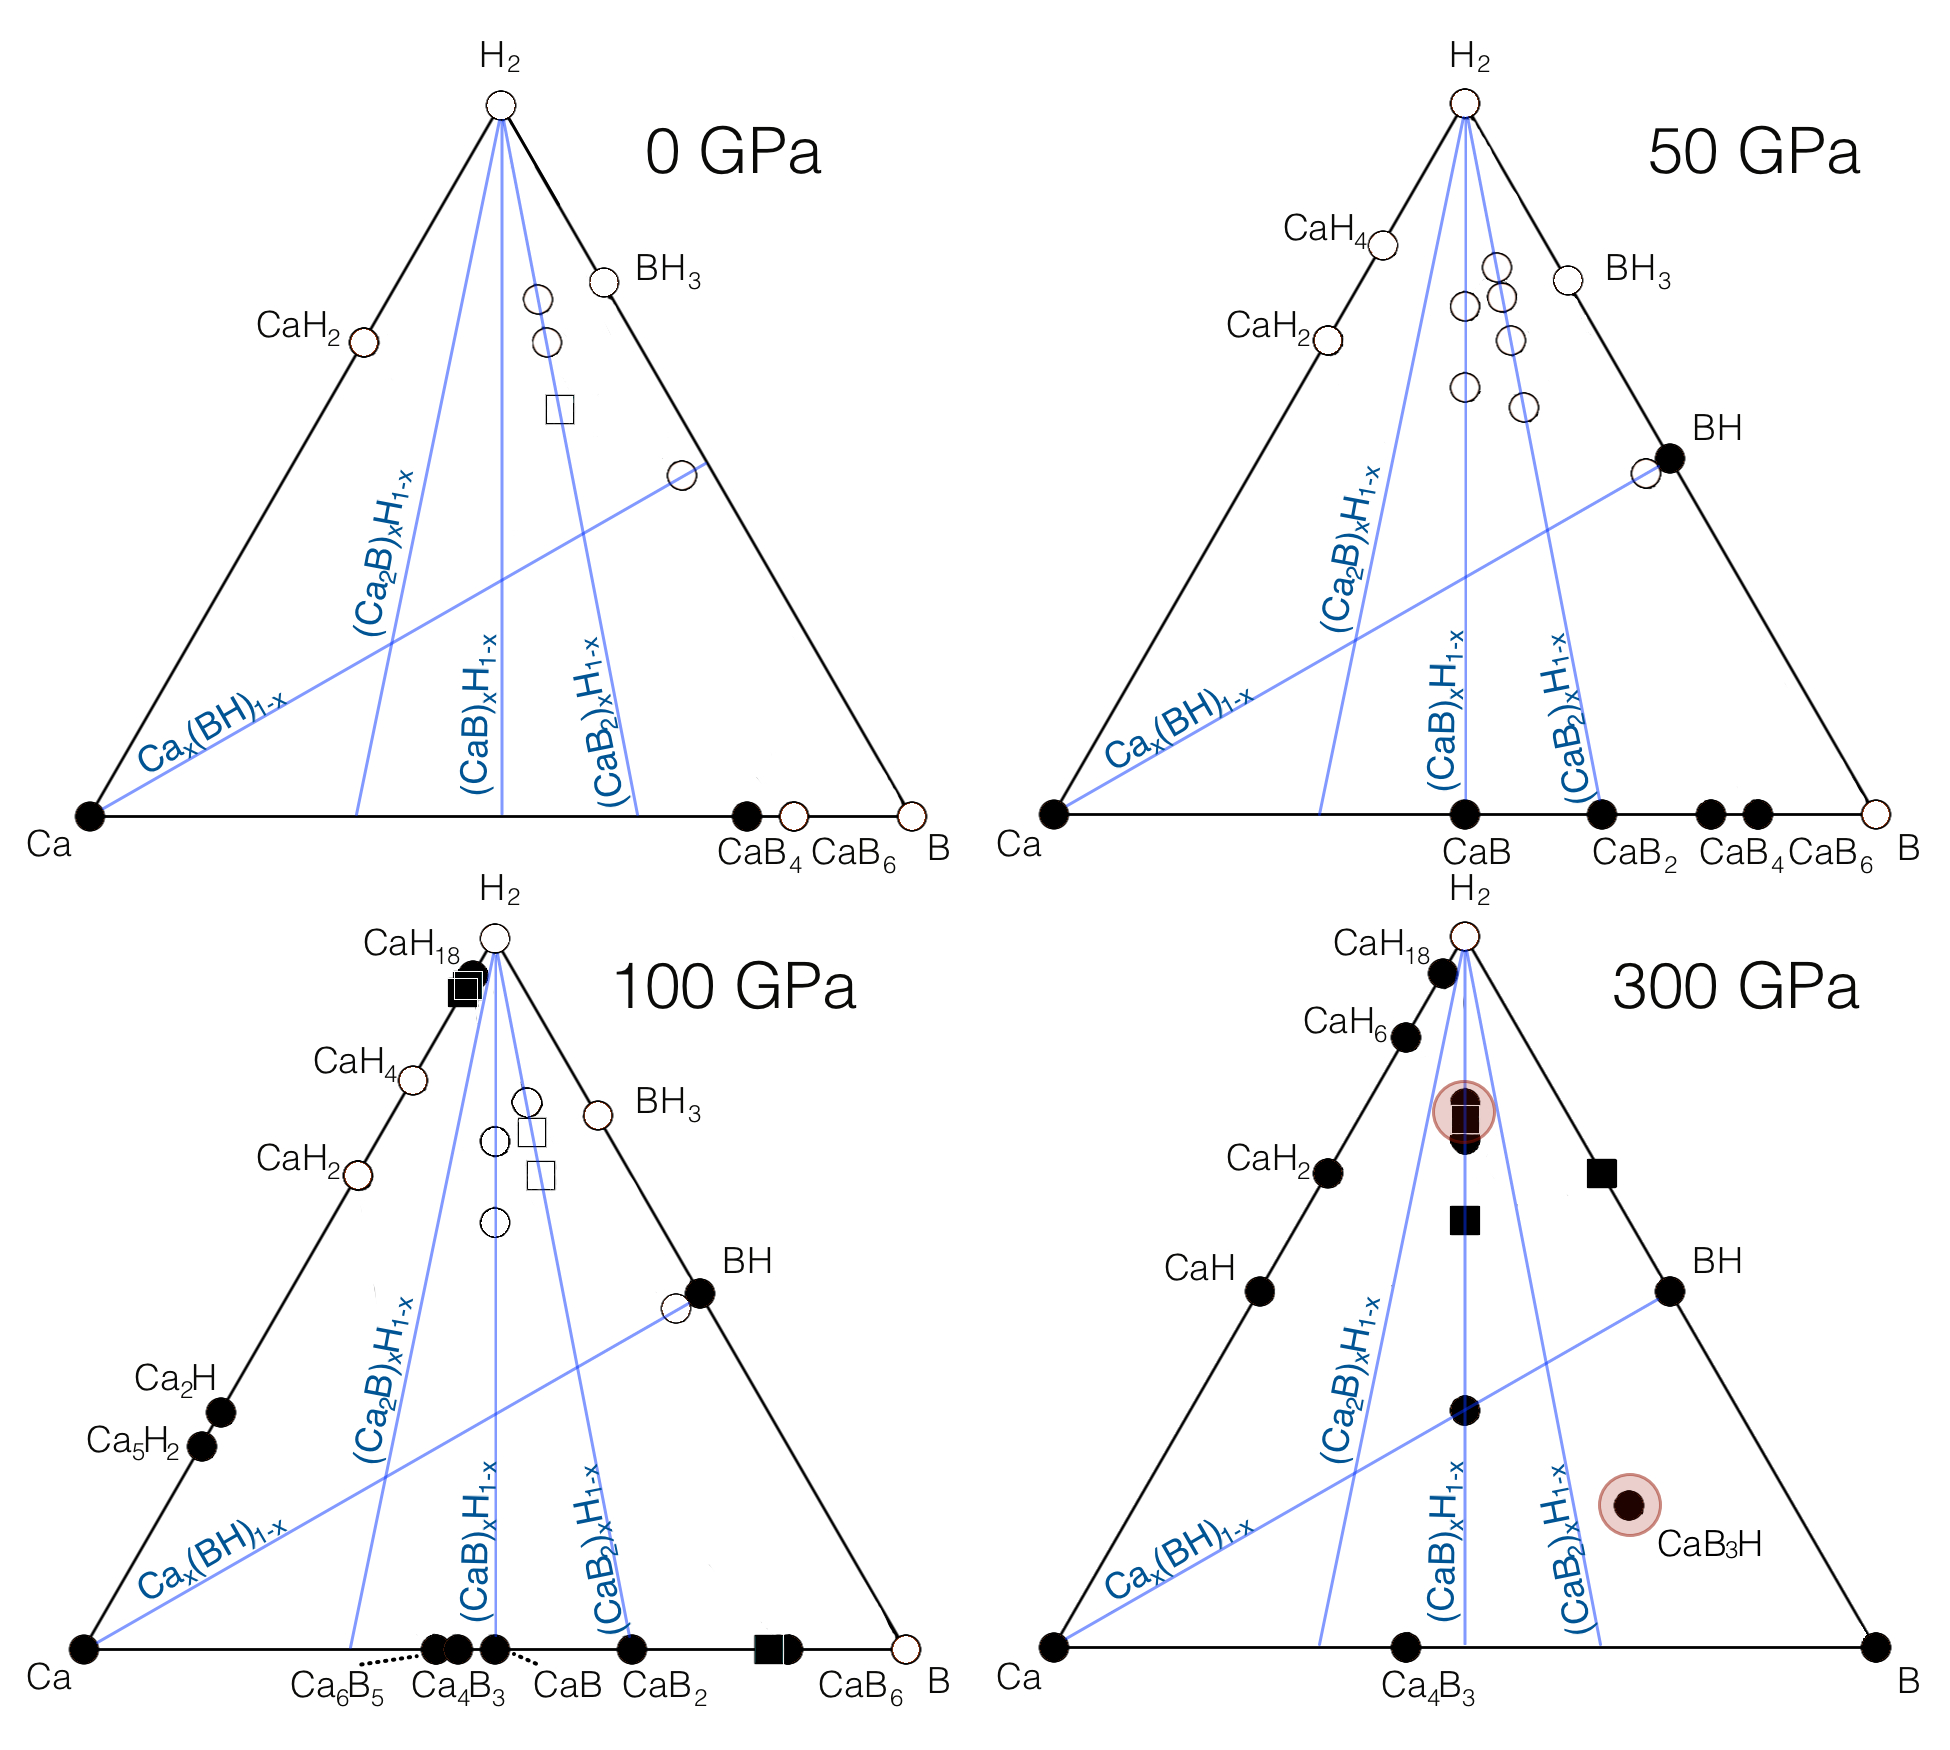
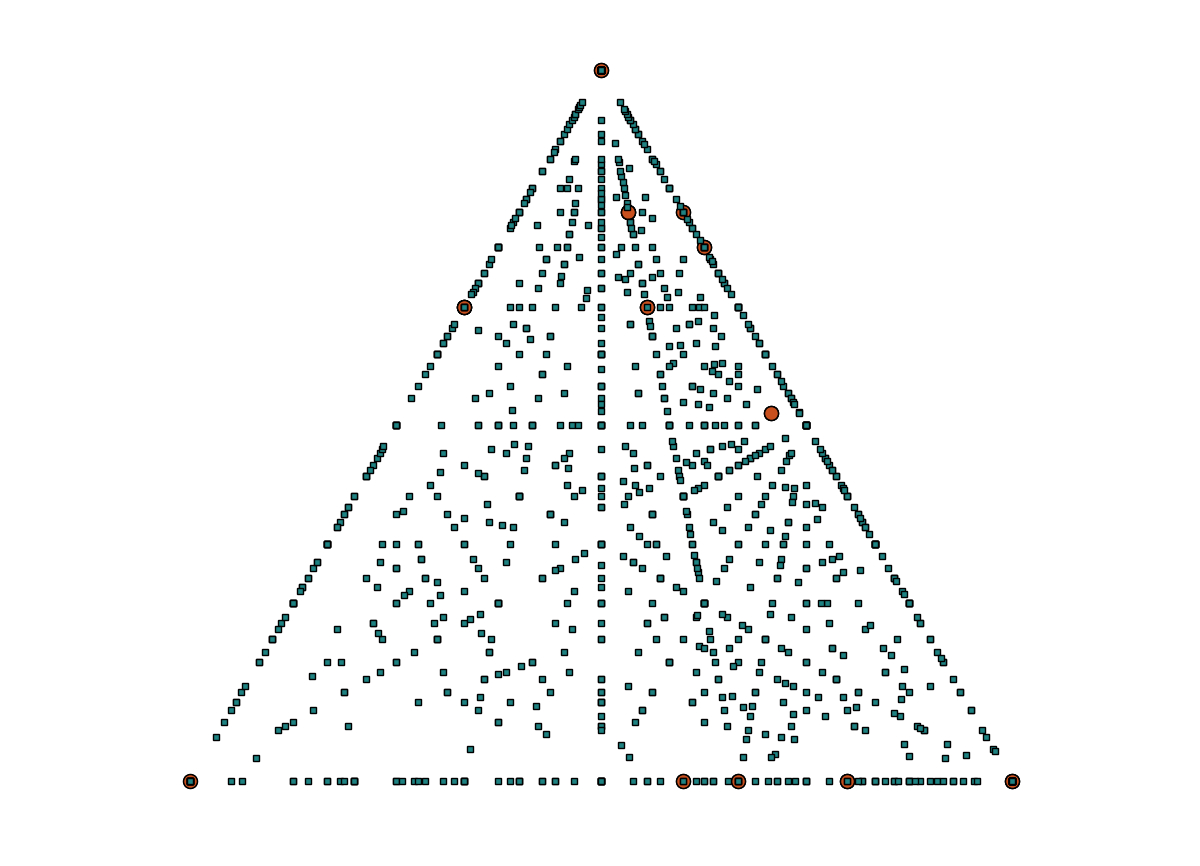
Fig.1 shows the ternary convex hulls for the four pressures studied. The stable and metastable compositions are shown as circles and squares, respectively, while metal/nonmetal character is indicated by full/empty symbols. The figures highlight a gradual transition from low to high-pressure stoichiometries, and from insulating to metal behavior.
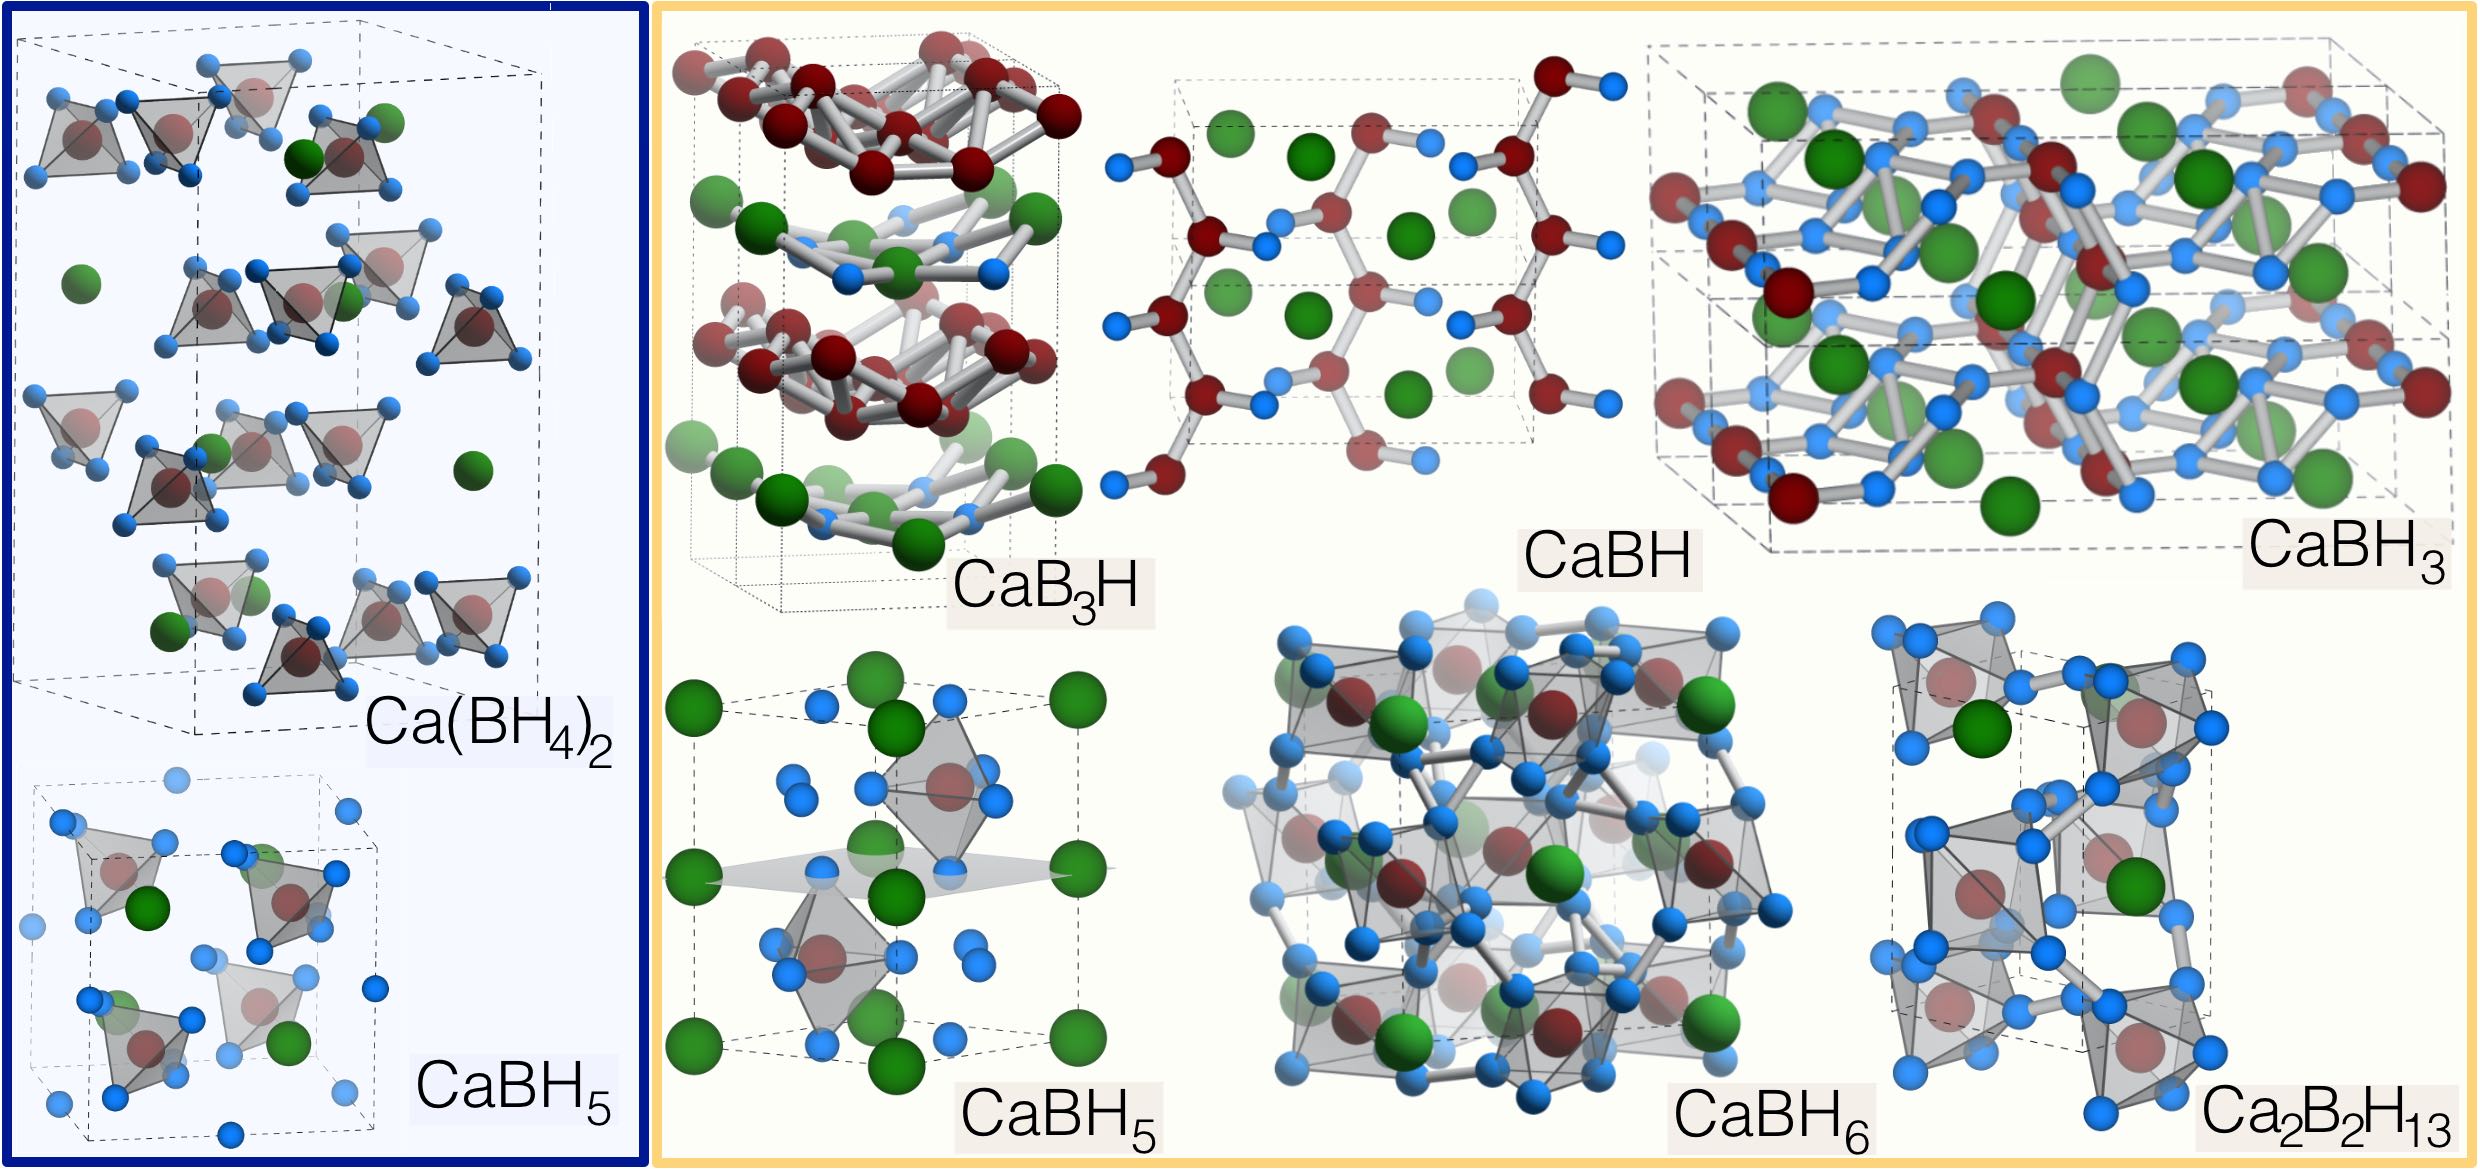
At ambient pressure, our predictions agree with previous experiments and calculations Zhang et al. (2010); Shah and Kolmogorov (2013); Wang et al. (2011); Hu et al. (2013); Ozolins et al. (2008); Aeberhard et al. (2011); Li et al. (2018b). At room pressure the stable (or weakly metastable) phases lie along the Ca(BHx)2 line. Their structures comprise BH anions, with hydrocarbon-like motifs, and Ca cations in the interstitials: Ca(BH2)2 (polyethylene), Ca(BH3)2 (ethane), and Ca(BH4)2 (methane). In addition, there is a stable CaB12H12 phase, containing B12H122- icosahedra Stabila et al. (2010); Ozolins et al. (2008). The crystal structure of Ca(BH4)2 is shown in the top left panel of Fig.2.
At 50 GPa, most compositions stable at ambient pressure remain on the convex hull, with structures which maintain the motifs observed at ambient pressures. In addition, new compositions appear along the Ca(BHx)2 and Ca(BHx) lines, as hydrogen is trapped in the open molecular structures stable at room pressure. In Ca(BH5)2 interstitial H2 molecules are trapped between BH4 tetrahedra, in CaBH3 a single H atom occupies the interstitial sites among Ca tetrahedra, which are sandwiched between BH2 linear chains, while in CaBH5 a single H atom is trapped in the interstitial sites between BH4 anionic tetrahedra – bottom left panel of Fig.2. Trapping of atomic or molecular hydrogen is observed at high pressures also in many covalent hydrides. Duan et al. (2015)
At 100 GPa, phases on the Ca(BHx)2 line become unstable, while CaBH3 and CaBH5, on the (CaB)Hx line, remain stable. In addition, CaB12H12 has a structural phase transition towards a phase with space group, in which the B12H122- icosahedra are more densely packed. All structures are still insulating at this pressure, but metallization sets in by band overlap immediately after in CaBH5
None of the Ca(BHx)2 ambient-pressure compositions survives up to 300 GPa, where the pressure is so high that it leads to a complete rearrangement of the bonds: boron and hydrogen now form interconnected, dense networks, and the structures are all metallic. The stable high-pressure crystal structures are shown in the right panel of Fig. 2.
CaB3H is characterized by buckled triangular boron layers, similar to those predicted in Ref.Hu et al., 2013 for pure boron, alternated with CaH planes, so that the Ca atoms fits into the valleys of the B layers. CaBH is constituted by infinite B-H buckled chains in the direction, parallel to Ca chains. Ca2B2H13 exhibits a structure with distorted B-H octahedra and triangular bipyramids, and interstitial H2 molecules. CaBH5 undergoes a structural phase transition from the phase identified at 50 GPa and shown in the left panel of Fig. 2, to a phase with space group , in which the interstitial H atoms are incorporated in the B-H sublattice to form BH5 triangular bipyramids.
In addition to these thermodynamically stable phases, among H-rich compositions we also identified a high-symmetry structure with space group for CaBH6, lying about 100 meV/atom above the hull. This structure comprises BH6 6-vertex antiprisms, with hydrogen at the vertexes and boron in the middle. The nearest-neighbor H-H distance (1.2Å) is close to that of atomic hydrogen, Natoli et al. (1993), suggesting the formation of a metallic H sublattice. Given the empirical correlation between H-H interatomic distances and high- superconductivity in high-pressure hydrides, we decided to include this structure in our pool of potential high- superconductors.
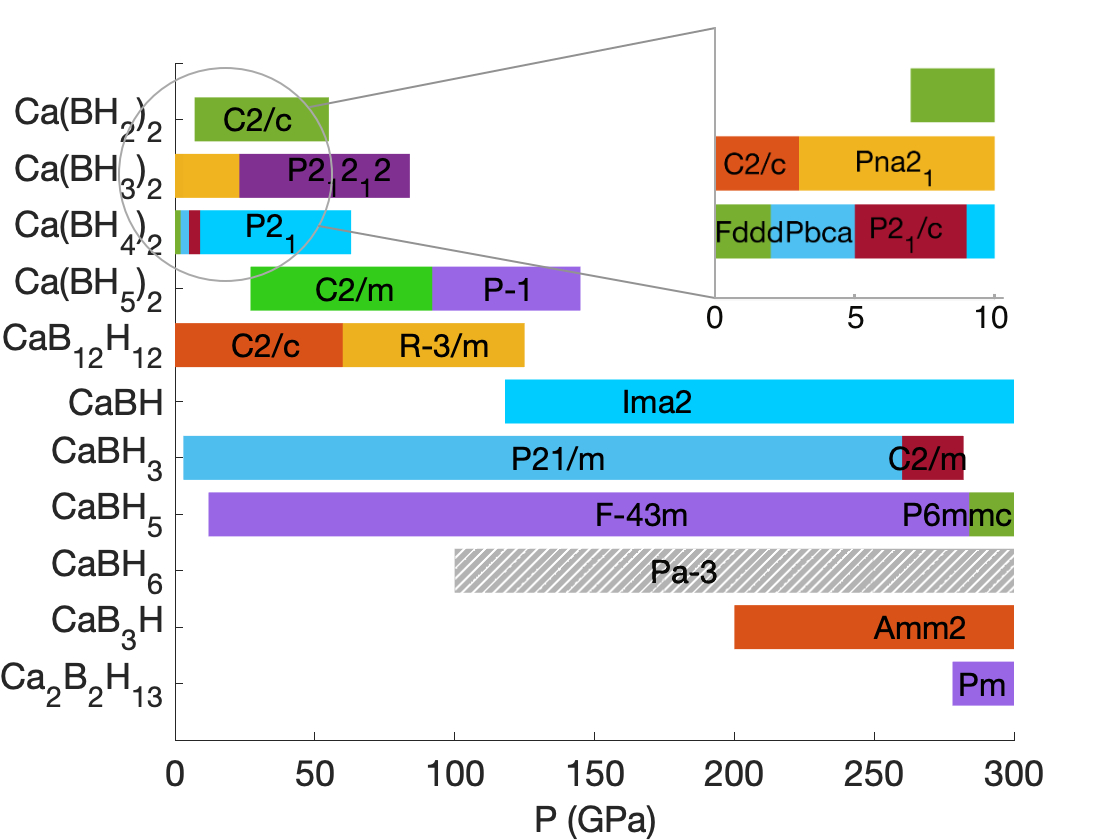
The phase diagram in Fig. 3 summarizes the stability range of the different Ca-B-H structures as a function of pressure. As it can be appreciated, several phases which appear on the 300 GPa convex hull remain stable up to much lower pressures.
There is a rather clear separation of the phase diagram between a low- and a high-pressure regime, setting in at around 100 GPa. The group of low-pressure phases comprises Ca(BHx)2 (x = 2, 3, 4) compositions, as well as CaB12H12; as shown previously, all these phases form molecular, insulating crystals. A series of structural transitions occurs between 0 and 50 GPa, due to the progressive rearrangement of BHx units in the crystal. At pressures beween 10 and 20 GPa, hydrogen starts to get trapped in molecular or atomic form in these open structures, stabilizing H-rich stoichiometries, such as Ca(BH5)2, Ca(BH3) and Ca(BH5).
Additional structures along the Ca(BH)x line become stable above 100 GPa: in these phases, the low-P motifs of the B-H sublattice, analogous to hydrocarbons, are replaced by new ones, in which boron is coordinated to five or more hydrogen atoms. This qualitative transition of the B-H sublattice behavior is accompanied by the onset of metallic behavior. In fact, all structures we report at 300 GPa are metallic in their whole stability range.
II Electronic Structure
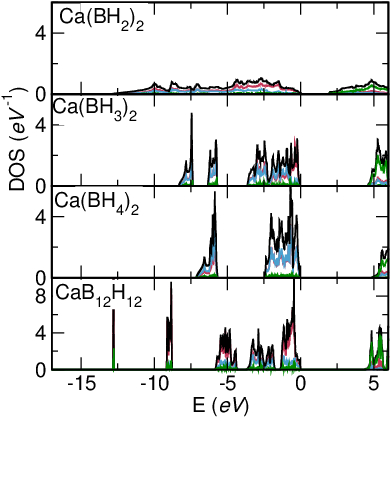
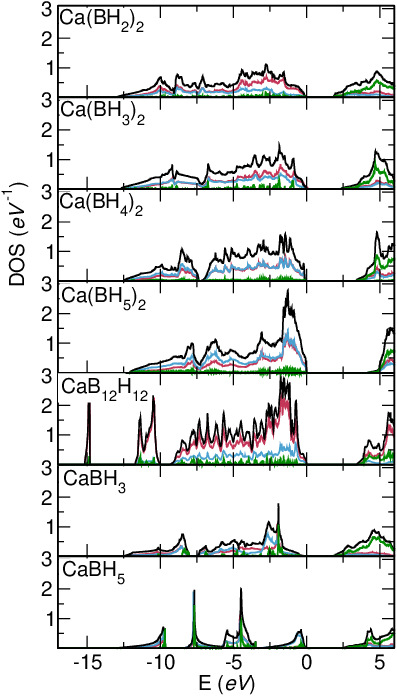
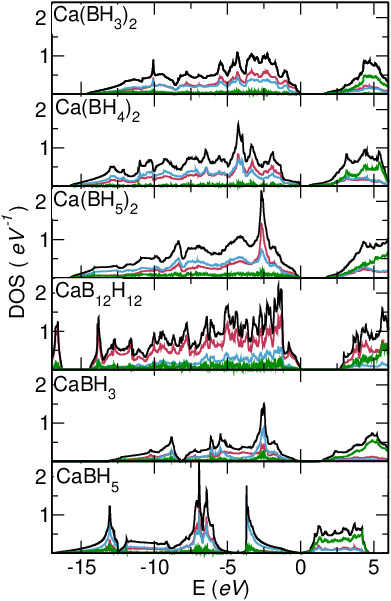
We now discuss the electronic properties of the structures in the Ca-B-H high-pressure phase diagram. Structures which are stable up to 100 GPa are of no interest for superconductivity, since they are insulating. Hence, here we discuss the main features of their electronic structure only briefly, and collect the plots of the relative Densities of States (DOS) in Appendix A.
Room pressure structures, characterized by a disconnected lattice of hydrocarbon-like, BH anions, exhibit molecular-like DOS’s, with sharp peaks of mixed B and H character, and band gaps ranging from 2.6 eV for Ca(BH2)2 to 5 eV for Ca(BH4)2. Ca and states lie at the bottom the conduction band; Ca is fully ionized, as confirmed by a Bader charge analysis, which assigns a total charge of about +1.5 to it. As pressure is increased to 50 GPa, the peaks of the DOS broaden and merge into a continuous band; the bonding/antibonding gaps decrease to 1.8 eV for Ca(BH2)2, and 3.4 eV for Ca(BH4)2. The new Ca(BH5)2, CaBH3 and CaBH5 phases are all insulating, with gaps of 4.1, 1.6, and 2.3 eV, respectively.
At 100 GPa the reported phases for Ca(BH3)2, Ca(BH4)2, Ca(BH5)2 and CaB12H12 are still insulating, with calculated gaps of 1.6, 0.5, 1.8 and 2.6 eV, respectively, CaBH3 exhibits a gap of 0.4 eV, CaBH5 is semimetallic.
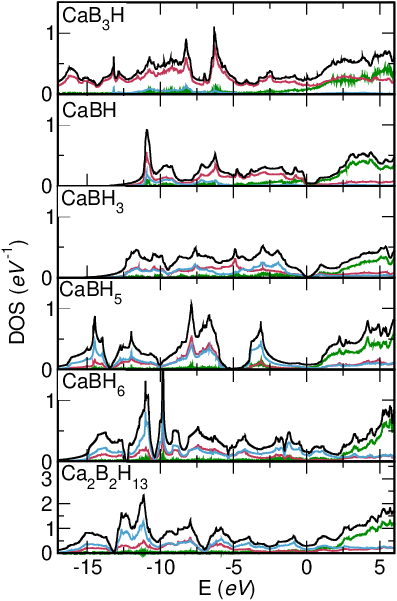
As shown in Fig. 3, phases resulting from a the full rearrangement of the B-H sublattice at high pressures gradually appear on the convex hull only above 100 GPa. We discuss their electronic properties at a common pressure of 300 GPa, where high-P structures are stable for all compositions. In Fig.4 we show the electronic DOS projected onto the atomic orbitals for CaB3H, CaBH, CaBH3, CaBH5, CaBH6, and Ca2B2H13. The energies have been rescaled with respect to the Fermi energy. The behavior of the DOS in the valence region depends strongly on the relative boron and hydrogen content: the CaB3H and CaBH DOS are dominated by electronic states with B character. On the other hand, the hydrogen-rich phases exhibit a strong B and H hybridization over the whole -20 to 5 eV range; furthermore, Ca- states are spread over the valence and conduction band, so that Ca is only partly ionized, with an average net Bader charge of +0.9. In CaBH5 the valence band exhibits B and H character with the exception of energies near the Fermi level, where around half of the contribution to the total DOS comes from states with Ca- character.
In CaBH6 and Ca2B2H13, the occupied states mostly have B and H character; the B- and H- projected DOS follow each other rather closely, which indicates that the two are covalently bonded, while the Ca- states remain empty, and lie around 2 eV above the Fermi energy.
III Superconductivity
With the exception of CaBH3, which is a semimetal with a very small DOS at the Fermi level, all high-pressure Ca-B-H phases are metallic, and hence have the potential to be high- superconductors. In order to quantitatively assess their superconducting properties, we carried out calculations of their electron-phonon properties, using Density Functional Perturbation theory, as implemented in the plane-waves pseudopotential code Quantum Espresso. Savrasov and Savrasov (1996); Giannozzi et al. (2009); Baroni et al. (2001).
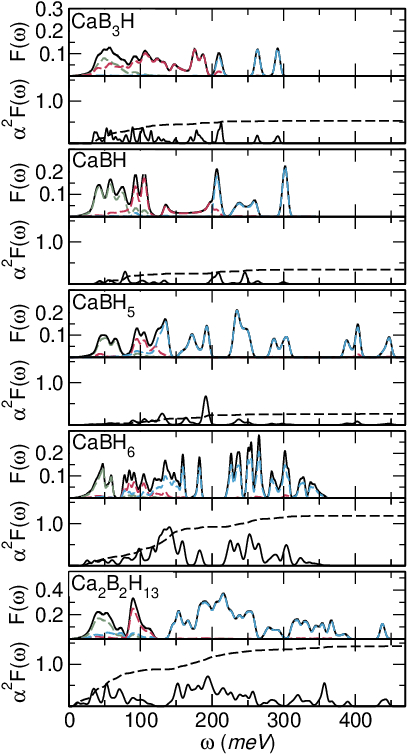
The top panels of Fig.5 show the calculated total and partial phonon Densities of States of CaB3H, CaBH, CaBH5, CaBH6, and Ca2B2H13, with the same color coding as for the electronic DOS’s in Fig. 4.
For all structures there is a net separation of phonon spectra in three regions: a low-energy one, extending from 0 to 75 meV, dominated by modes of Ca character, an intermediate one, from 75 to 175 meV, with modes of mixed B and H character, and a high-energy region, from 175 up to 300 meV, characterized by B-H stretching modes. Moreover, hydrogen-rich structures exhibit a further high-energy band, above 300 meV, which involves purely H vibrations and is not present in CaB3H and CaBH.
The bottom panels of the figure show, for each Ca-B-H phase, the calculated Eliashberg (electron-phonon) spectral function, which is essentially a phonon Density of States, weighted by the electron-phonon matrix elements for states at the Fermi level. Carbotte (1990) Comparing its shape with the phonon DOS one can obtain a direct information on the distribution of the e-ph coupling over the phonon spectrum. In all cases, the Eliashberg function follows quite closely the phonon DOS, indicating that the e-ph coupling is distributed almost evenly on all vibrational modes, in analogy with other high- high-pressure hydrides Duan et al. (2015); Peng et al. (2017); Errea et al. (2020); Heil et al. (2019).
From the Eliashberg function, we obtained the logarithmic average phonon frequency and the e-ph coupling constant , which appear in the Mc-Millan Allen Dynes formula for the critical temperature:Allen and Dynes (1975); McMillan (1968)
| (1) |
and measure respectively the average effective frequency of the phonons participating in the superconducting pairing and the intensity with which they couple to electrons at the Fermi level.
These quantities are reported in table 1 for all five Ca-B-H compounds shown in Fig.5. The last column of the table shows also the s, obtained from Eq. 1 for a standard choice of the Morel-Anderson pseudopotential, .
|
|
|
|
|
|
|
|
|||||||||||||||||
|---|---|---|---|---|---|---|---|---|---|---|---|---|---|---|---|---|---|---|---|---|---|---|---|---|
| CaB3H | 300 | 2 | 43.6 | 1.08 | 0.02 | 0.48 | 0.44 | 78 | 7 | |||||||||||||||
| CaBH | 300 | 2 | 27.9 | 0.60 | 0.06 | 0.14 | 0.23 | 97 | 0.1 | |||||||||||||||
| CaBH5 | 300 | 2 | 39.9 | 0.41 | 0.40 | 0.26 | 0.63 | 131 | 0.1 | |||||||||||||||
| CaBH6 | 100 | 4 | 119.7 | 0.57 | 0.73 | 1.93 | 3.33 | 70 | 114 | |||||||||||||||
| CaBH6 | 200 | 4 | 97.6 | 0.64 | 0.67 | 1.27 | 1.99 | 106 | 117 | |||||||||||||||
| CaBH6 | 300 | 4 | 85.6 | 0.79 | 0.67 | 1.19 | 1.59 | 117 | 119 | |||||||||||||||
| Ca2B2H13 | 200 | 1 | 50.2 | 0.59 | 0.51 | 1.23 | 2.10 | 59 | 63 | |||||||||||||||
| Ca2B2H13 | 300 | 1 | 43.9 | 0.67 | 0.55 | 1.37 | 2.07 | 74 | 89 |
For only two out of five structures we predict a exceeding liquid nitrogen boiling point: CaBH6 (=119 K), and Ca2B2H13 (=89 K). Both are hydrogen-rich, high-symmetry phases. In both cases, superconductivity survives up to lower pressures, with sizable s.
Boron-rich CaB3H also exhibits a finite, although much lower (7 K). This is not surprising since an inspection of the electronic DOS in fig: 4 shows that the contribution of H states is negligible in the whole valence region, and the fraction of H states at the Fermi level, , is as low as 2%. Essentially, the superconducting pairing is dominated by electronic and vibrational states of the boron sublattice, determining an intermediate e-ph coupling constant (), and an which is sensibly larger than in superconducting borides, but about half than high- hydrides. Flores-Livas et al. (2020)
The other two metallic calcium borohydrides stable at high-pressure, CaBH and CaBH5, should not be superconducting according to our calculations. Both exhibit a DOS at the Fermi level which is comparable to that of other high-pressure hydrides; note that the value of the DOS in table 1 has been rescaled with the unit cell volume, in order to allow for a meaningful comparison across structures with different compositions and stability pressures.
However, the value of the parameter , is remarkably smaller than in the two high- Ca-B-H phases. This parameter essentially measures the intrinsic coupling between electrons at the Fermi level and lattice vibrations. In CaBH, its low value can be explained in terms of a very small fraction of H-derived electronic states at the Fermi level (), leading to ineffective e-ph coupling. The same argument cannot be applied in CaBH5, where about half of the electronic states at the Fermi level have H orbital character.
To understand why in CaBH5 electrons at the Fermi level couple so little to phonons, despite a strong H orbital character, it is useful to inspect the so-called Local Density of States (LDOS):
| (2) |
where and are the Kohn-Sham eigenfunctions and eigenvalues of the system. The LDOS permits to visualize the real-space distribution of the electronic states at a given energy . If computed for , it permits to visualize the real-space distribution of electrons, which participate in the superconducting pairing. Heil et al. (2018)
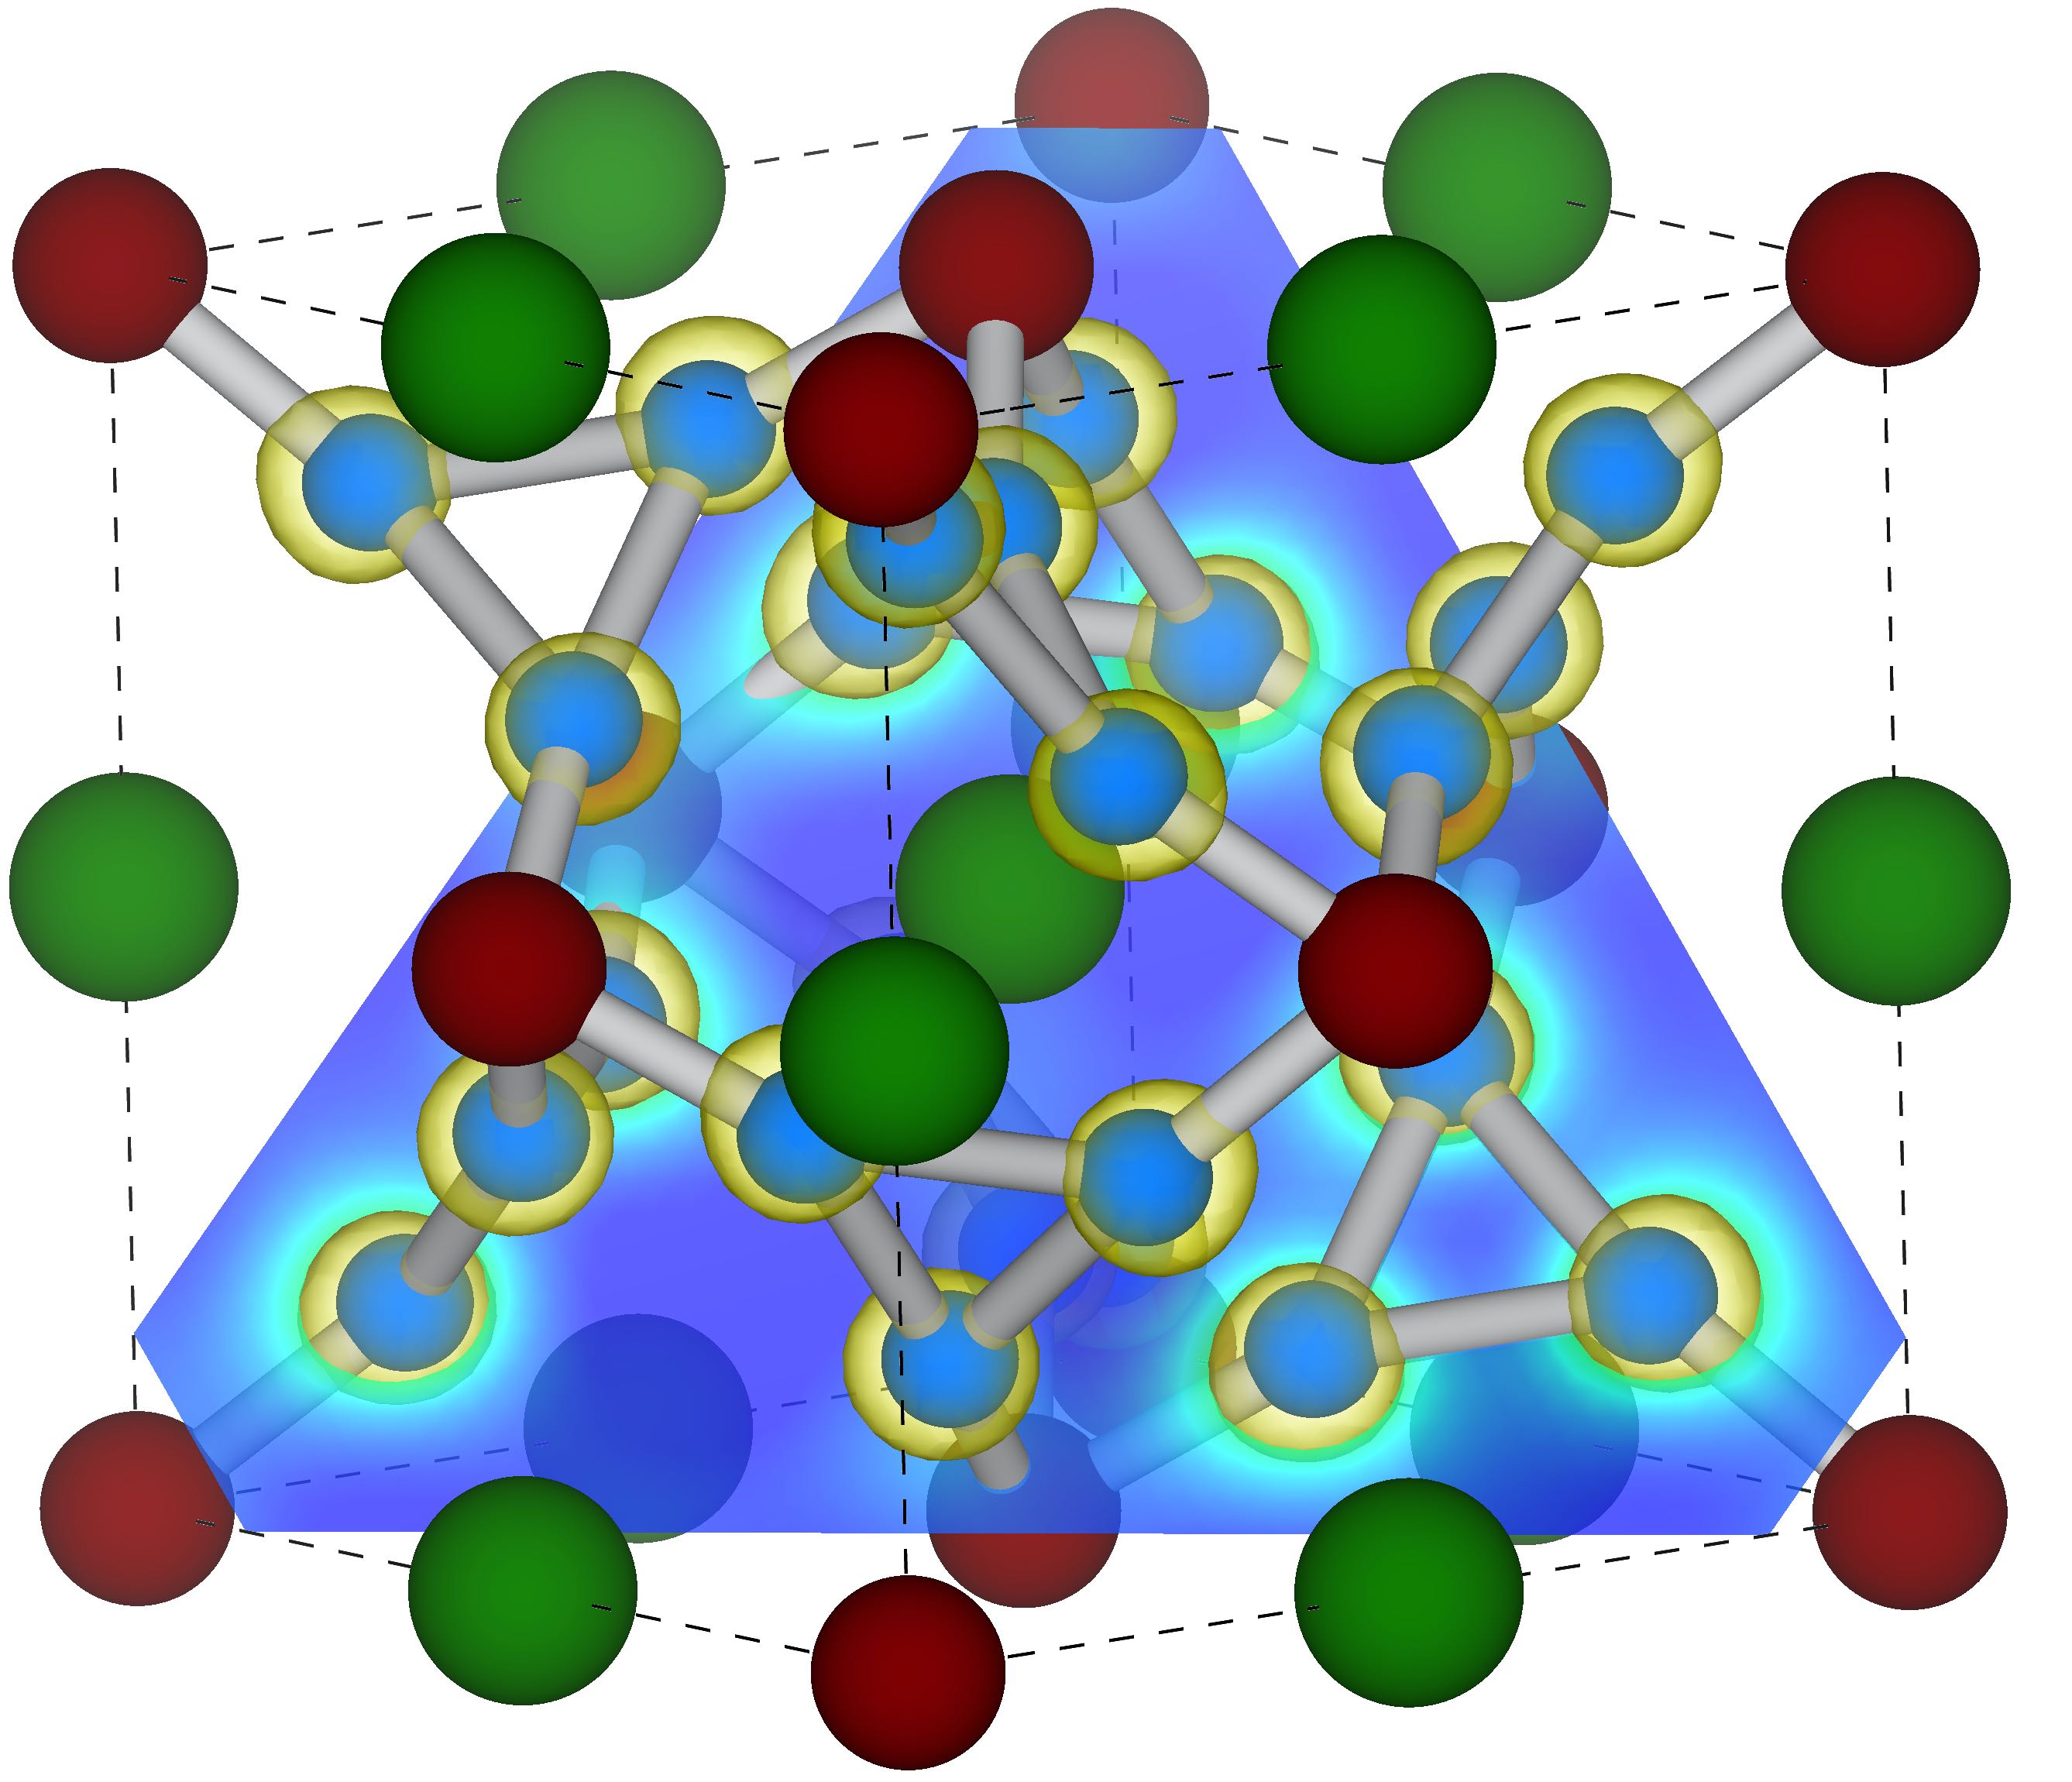
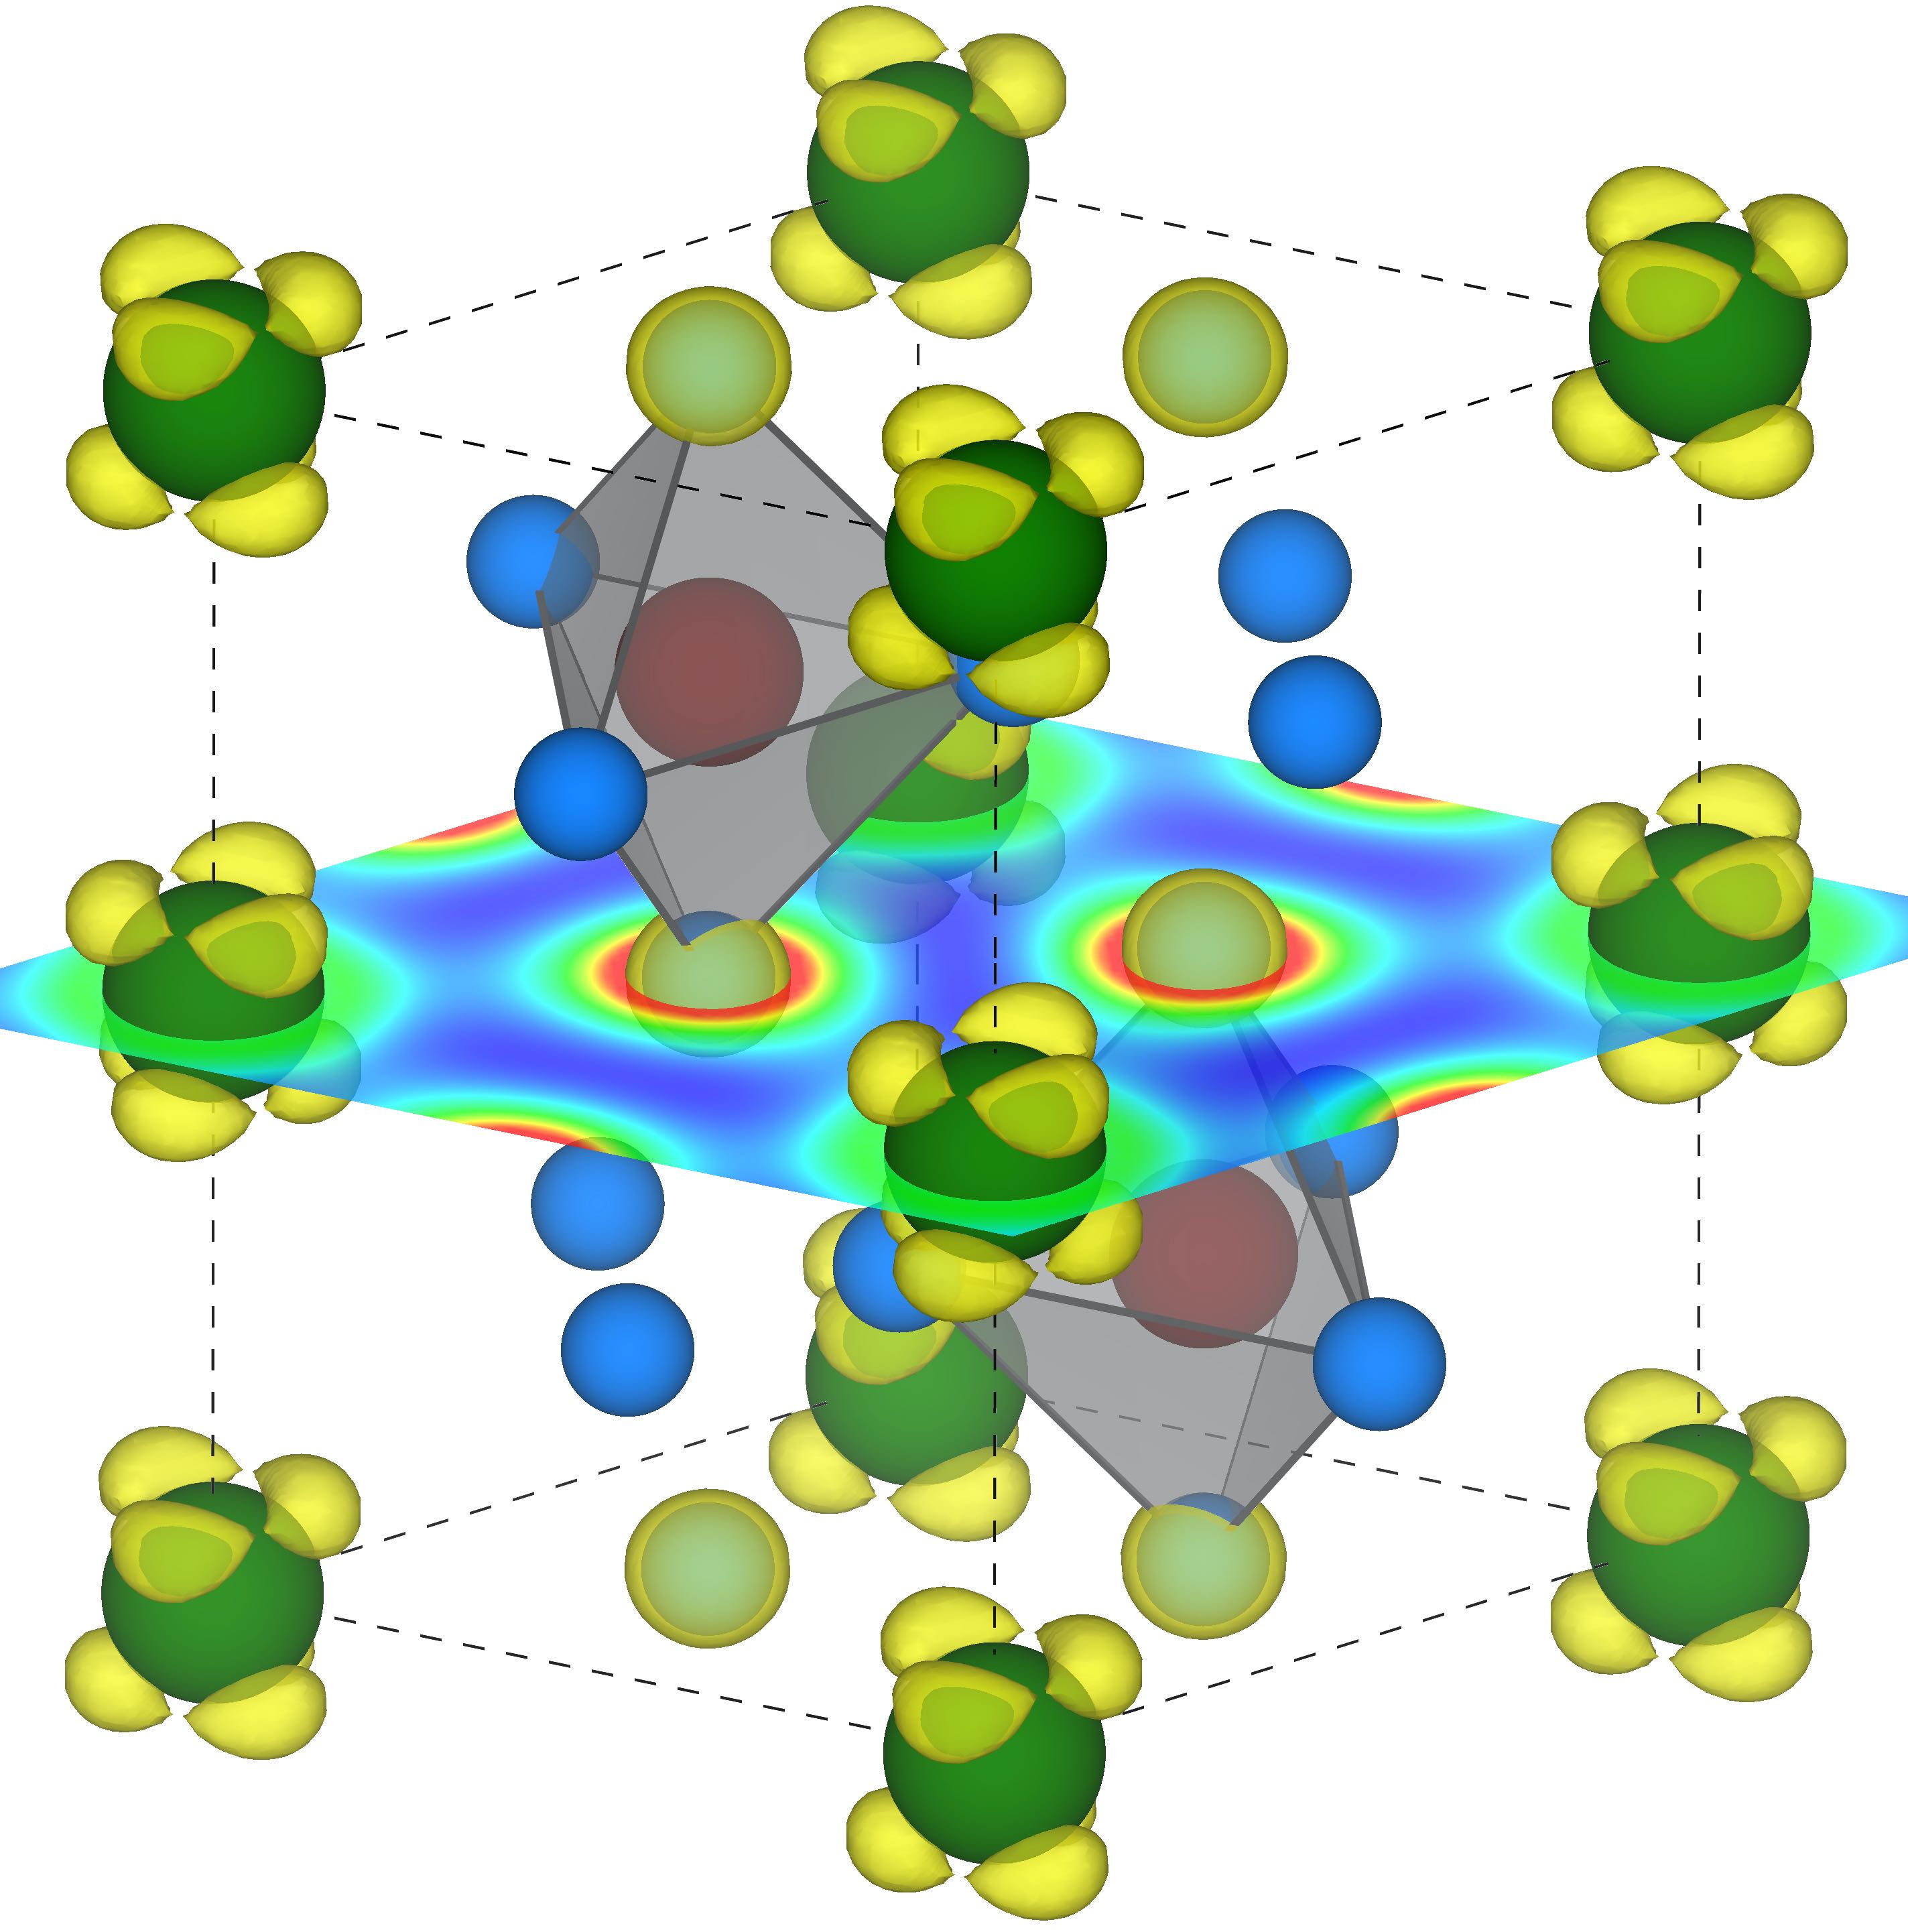
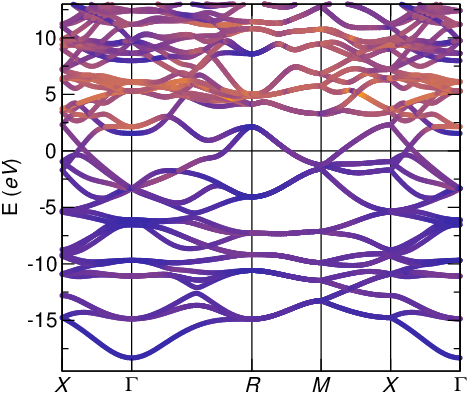
Fig. 6 shows isosurfaces and isocontours of the LDOS at for high- CaBH6 (top) and non-superconducting CaBH5 (bottom). In CaBH6, the electronic charge is concentrated on the B-H sublattice, and hence is highly susceptible to B-H bond-stretching vibrations that dominate the intermediate and high-frequency part of the phonon spectrum, giving rise to large e-ph matrix elements. In CaBH5, on the other hand, a considerable fraction of the charge is concentrated around Ca atoms, with a distribution typical of planar orbitals. The spatial overlap of these electronic states with neighboring B or H atoms is quite small, and hence their coupling to B-H vibrations is strongly suppressed with respect to CaBH6. The same picture is confirmed by the "fat-band" plots, shown in Appendix A, which show that Ca-3d-derived states dominate one of the two pockets of the Fermi surface of CaBH5, but give none or negligible contributions to the electronic states that form the Fermi surfaces of CaBH6 and Ca2B2H13. Hence, Ca orbitals play an essential role in determining the superconducting properties of different calcium borohydrides.
IV Conclusions
In this work, we have studied ab-initio the high-pressure superconducting phase diagram of the ternary calcium-boron-hydrogen system, using evolutionary crystal structure prediction and Density Functional Perturbation Theory, with the aim of identifying new high- high-pressure hydrides. The original hypothesis of this work was that the combination of hydrogen with a weak (Ca) and a strong (B) hydride former at high pressures could provide a large playground of covalent metallic crystals, to improve the superconducting properties, compared to binary hydrides.
Our structural searches have shown that the Ca-B-H phase diagram can be clearly split in two regions: the low-pressure region, extending from room pressure to approximately 100 GPa, is characterized by closed-shell, insulating phases, forming open molecular structures. As pressure is increased, hydrogen is gradually incorporated into the B-H lattice, stabilizing hydrogen-rich compositions. At around 100 GPa, a different high-pressure regime sets in, following the rearrangement of boron and hydrogen bonds into dense sublattices; the new structures that form gradually become metallic at higher pressures. Among these high-pressure structures, we identify two phases, with unusually high H:B ratios: CaBH6 and Ca2B2H13, characterized by 5 and 6-coordinated boron atoms, surrounded by hydrogen. For these two phases at 300 GPa, we estimate a of 119 and 89 K, respectively, which survive to lower pressures. These s are higher than those reported for the stable phases of the binary B-H system Hu et al. (2013), and comparable to those predicted in the related Li-B-H system. Kokail et al. (2017) We also show that a third hydrogen-rich phase, CaBH5, despite being metallic, is non-superconducting; this can be attributed to a dominant contribution of Ca states to the electronic states at the Fermi surface, which couple poorly to B and H phonons. In this work, we neglected anharmonic effects which are known to affect superconducting properties of hydridesErrea et al. (2015, 2020) since this level of detail was beyond the scope of our exploratory work.
On one hand, our results confirm that ternary hydrides are a promising venue to search for high-temperature conventional superconductivity; on the other hand, they also highlight that details of electronic structure and chemistry may play a key role in determining the final superconducting . In fact, we find that high-pressure ternary Ca-B-H covalent metallic structures are not competitive with the best covalent hydrides, such as SH3, for two reasons: 1) since boron is very electronegative, closed-shell, insulating structures survive up to high pressures, and metalization slowly sets in only after 100 GPa; 2) Since the orbitals of Ca lie close to the valence, at high pressure they may influence the behavior of valence electronic states in unpredictable ways, acting very differently from other alkali metals and alkaline earths. Our study hence suggests that searches for high- superconductivity in ternary hydrides should be oriented toward compounds containing elements less electronegative than boron, such as aluminum and silicon, where bonds can be more easily broken and reformed.
The authors acknowledge computational resources from the dCluster of the Graz University of Technology and the VSC3 of the Vienna University of Technology, and support through the FWF, Austrian Science Fund, Project P 30269- N36 (Superhydra). L. B. acknowledges funding through Progetto Ateneo Sapienza 2017-18-19 and computational Resources from CINECA, proj. Hi-TSEPH.
Appendix A Supplementary Figures
In this section we report the density of states for the stable phases of the Ca-B-H system at 0, 50, and 100 GPa, discussed in Sect. II, as well as the orbital-projected band structure plots for CaBH5, CaBH6, Ca2B2H13 discussed in Sect. III.
Electronic Densities of States
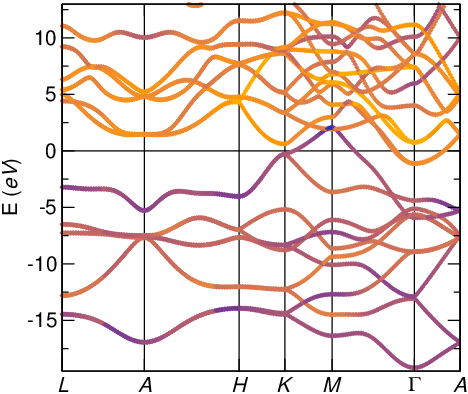
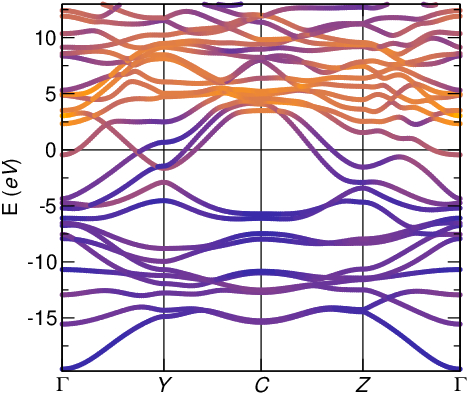
Electronic Band Structure of high-pressure CaBH5, CaBH6 and Ca2B2H13
Appendix B Computational Details
Structural Prediction
To construct the Ca-B-H phase diagram, variable-composition structural searches at fixed pressures were carried out using evolutionary algorithms as implemented in the Universal Structure Predictor: Evolutionary Xtallography software (USPEX) Glass et al. (2006). Oversampling of the same minima is avoided through the use of a anti-seeding technique. Each structure underwent a five-step relaxation to minimize stress and forces, calculated within DFT. For this purpose we employed the Vienna ab-initio software package (VASP) Kresse and Furthmüller (1996), using Projector Augmented Waves (PAW) pseudopotentials with Perdew-Burke-Ernzerhof (PBE) exchange-correlation functional supplied within the VASP package. We used a cutoff on the plane waves expansion of 600 eV; for reciprocal-space integration we employed a regular grid in k space with a 0.04 spacing in units of , and a gaussian smearing of 0.05 eV.
The ternary convex hulls in Fig.1 were constructed as follows: first, an exploratory run was carried out on the full compositional space, for a total of about 2000 structures per pressure, with a variable number of atoms/cell, ranging from 8 to 16. This was sufficient to correctly predict some stable stoichiometries at room pressure, but not all of them were identified. To improve the accuracy, we performed additional searches for variable compositions, along selected lines: (Ca1B2)1-xHx, (Ca2B2)1-xHx, (Ca2B1)1-xHx, and Ca1-x(BH)x, Ca1-xBx, Ca1-xHx, and B1-xHx, with about 250 structures per line, and a cell size ranging from 8 to 18. This was sufficient to reproduce results from Refs Shah and Kolmogorov, 2013; Wang et al., 2011; Hu et al., 2013, and represents a good compromise between exploration and sampling. As an example, the convex hull at 0 GPa before refinement including all the compositions sampled in the search is shown in Fig.14. Finally, we performed a few fixed-composition structural searches on the compositions which resulted to be stable, to correctly assess the details of the crystal structure.Structures in literature which had a cell size exceeding these parameters were included by hand.
After these exploratory runs, stable or weakly-metastable structures were further relaxed with tighter constraints, until the individual components of the forces were less than 1 meV/Å; finally, the total energy was computed using the tetrahedron method for k-space integration, with a resolution of 0.03 , resulting in a refinement on the estimate of the energies. From the enthalpies thus calculated, the convex hulls, and the figures, were constructed using the Pymatgen library Ong et al. (2013).
The pressure-dependent phase diagram in Fig.3 was obtained calculating the energy versus volume relation for each stable and metastable phase identified at 0, 50, 100, and 300 GPa; the obtained relation was then fitted using the Birch-Murnaghan equation of state. The phase transitions within a single composition were determined by directly comparing the enthalpy thus estimated. The decomposition pressure for a given stoichiometry was estimated comparing the enthalpy of the reactant with that of the products , according to the formula:
| (3) |
Where is the relative fraction of product in the reaction; whence if is negative, the phase is stable, as the enthalpy of the reactant is less than the enthalpy of the products, considering as possible decomposition products the phases stable on the convex hull calculated at the closest pressure. Where is the relative fraction of product in the reaction; whence if is negative, the phase is stable, as the enthalpy of the reactant is less than the enthalpy of the products.
Superconductivity
All electronic structure and superconductivity calculations in sections II and III were carried out with QUANTUM Espresso (QE) using Norm-conserving (NC) pseudopotentials, and Perdew-Burke-Ernzerhof (PBE) exchange-correlation functional. A cutoff of 80 Ry was used for the plane-wave expansion of the wave functions. The structures were prerelaxed in QE until each component of the forces acting on single atoms was less than 2 meV/Å. Calculations of the ground-state charge density were carried out using a 0.06 Ry smearing and a grid in reciprocal space for k space integration. Phonon calculations were performed on a reciprocal-space grid, and the integration of the electron-phonon matrix element on the Fermi surface was carried out using a grid, and a gaussian smearing with a width of 270 meV to describe the zero-width limit of the electronic functions.
The phonon density of states was obtained by performing Fourier interpolation on a grid.
The figures of the crystal structures were generated using VESTA (Visualization for Electronic and STructural Analysis) Momma and Izumi (2011)
References
- Ashcroft (1968) N. W. Ashcroft, Phys. Rev. Lett. 21, 1748 (1968).
- Ashcroft (2004) N. W. Ashcroft, Phys. Rev. Lett. 92, 187002 (2004).
- Drodzov et al. (2015a) A. P. Drodzov, M. I. Eremets, I. A. Troyan, V. Ksenofontov, and S. I. Shylin, Nature 525, 73 (2015a).
- Duan et al. (2015) D. Duan, Y. Liu, F. Tian, D. Li, X. Huang, Z. Zhao, H. Yu, B. Liu, W. Tian, and T. Cui, Scientific Reports 4 (2015).
- Drodzov et al. (2019) A. P. Drodzov, P. Kong, V. Minkov, S. Besedin, M. Kuzovnikov, S. Mozaffari, L. Balicas, F. F. Balakirev, D. E. Graf, V. B. Prakapenka, E. Greenberg, D. A. Knyazev, M. Tkacz, and M. I. Eremets, Nature 569, 528 (2019).
- Somayazulu et al. (2019) M. Somayazulu, M. Ahart, A. K. Mishra, Z. M. Geballe, M. Baldini, Y. Meng, V. V. Struzhkin, and R. J. Hemley, Phys. Rev. Lett. 122, 027001 (2019).
- Troyan et al. (2019) I. A. Troyan, D. V. Semenok, A. G. Kvashnin, A. G. Invanova, V. B. Prakapenka, E. Greenberg, A. G. Gavriliuk, I. S. Lyubutin, V. V. Struzhkin, and A. R. Oganov, arXiv:1908.01534 (2019).
- Semenok et al. (2020a) D. V. Semenok, A. G. Kvashnin, A. G. Ivanova, V. Svitlyk, V. Y. Fominski, A. V. Sadakov, O. A. Sobolevskiy, V. M. Pudalov, I. A. Troyan, and A. R. Oganov, Mat. Tod. 33, 36 (2020a).
- Drodzov et al. (2015b) A. P. Drodzov, M. I. Eremets, and I. A. Troyan, arXiv:1508.06224 (2015b).
- Kong et al. (2019) P. Kong, V. Minkov, M. Kuzovnikov, S. Besedin, A. P. Drodzov, S. Mozaffari, L. Balicas, F. F. Balakirev, V. B. Prakapenka, E. Greenberg, D. A. Knyazev, and M. I. Eremets, arXiv:1909.10482 (2019).
- Oganov et al. (2019) A. Oganov, C. Pickard, Q. Zhu, and R. Needs, Nature Reviews Materials 4, 331 (2019), cited By 33.
- Baroni et al. (2001) S. Baroni, S. de Gironcoli, and A. D. Corso, Reviews of Modern Physics 73, 515 (2001).
- Allen and Dynes (1975) P. B. Allen and R. C. Dynes, Phys. Rev. B 12, 905 (1975).
- Oliveira et al. (1988) L. N. Oliveira, E. K. U. Gross, and W. Kohn, Phys. Rev. Lett. 60, 2430 (1988).
- Sanna et al. (2018) A. Sanna, J. A. Flores-Livas, A. Davydov, K. Dewhurst, S. Sharma, and E. K. U. Gross, J. Phys. Soc. Japan 87, 041012 (2018).
- Flores-Livas et al. (2020) J. A. Flores-Livas, L. Boeri, A. Sanna, G. Profeta, R. Arita, and M. Eremet, Physics Reports (2020).
- An and Pickett (2001) J. M. An and W. E. Pickett, Phys. Rev. Lett. 86, 4366 (2001).
- Boeri et al. (2004) L. Boeri, J. Kortus, and O. K. Andersen, Phys. Rev. Lett. 93, 237002 (2004).
- Semenok et al. (2020b) D. V. Semenok, I. A. Kruglov, I. A. Savkin, A. G. Kvashnin, and A. R. Oganov, Current Opinion in Solid State and Materials Science 24, 100808 (2020b).
- Wang et al. (2018) H. Wang, X. Li, G. Gao, Y. Li, and Y. Ma, WIREs Computational Molecular Science 8, e1330 (2018), https://onlinelibrary.wiley.com/doi/pdf/10.1002/wcms.1330 .
- Zurek and Bi (2019) E. Zurek and T. Bi, The Journal of Chemical Physics 150, 050901 (2019), https://doi.org/10.1063/1.5079225 .
- Pickard et al. (2020) C. J. Pickard, I. Errea, and M. I. Eremets, Annual Review of Condensed Matter Physics 11, 57 (2020), https://doi.org/10.1146/annurev-conmatphys-031218-013413 .
- Benoit et al. (1996) M. Benoit, M. Bernasconi, P. Focher, and M. Parrinello, Phys. Rev. Lett. 76, 2934 (1996).
- Flores-Livas et al. (2018) J. A. Flores-Livas, M. Grauzinyte, L. Boeri, G. Profeta, and A. Sanna, Eur. Phys. J. B. 91, 176 (2018).
- Sun et al. (2007) L. Sun, Z. Zhao, A. L. Ruoff, C.-S. Zha, and G. Stupian, J. Phys. Condens. Matter 19, 425206 (2007).
- Eremets et al. (2008) M. I. Eremets, I. A. Troyan, S. A. Medvedev, J. S. Tse, and Y. Yao, Science 319, 1506 (2008).
- Feng et al. (2006) J. Feng, W. Grochala, T. Jaron, R. Hoffmann, A. Bergara, and N. W. Ashcroft, Phys. Rev. Lett. 96, 017006 (2006).
- Pickard and Needs (2006) C. J. Pickard and R. J. Needs, Phys. Rev. Lett. 97, 045504 (2006).
- Flores-Livas et al. (2016a) J. A. Flores-Livas, M. Amsler, C. Heil, A. Sanna, L. Boeri, G. Profeta, C. Wolverton, S. Goedecker, and E. K. U. Gross, Phys. Rev. B 93, 020508(R) (2016a).
- Li et al. (2014) Y. Li, J. Hao, H. Liu, Y. Li, and Y. Ma, J. Chem. Phys. 140, 174712 (2014).
- Esfahani et al. (2017) M. M. D. Esfahani, A. R. Oganov, H. Niu, and J. Zhang, Phys. Rev. B 95, 134506 (2017).
- Gao et al. (2008) G. Gao, A. R. Oganov, A. Bergara, M. Martinez-Canales, T. Cui, T. Iitaka, Y. Ma, and G. Zou, Phys. Rev. Lett. 101, 107002 (2008).
- Zhang et al. (2015) H. Zhang, X. Jin, Y. Lv, Q. Zhuang, Q. Lv, Y. Liu, K. Bao, D. Li, B. Liu, and T. Cui, Phys. Chem. Chem. Phys. 17, 27630 (2015).
- Flores-Livas et al. (2016b) J. A. Flores-Livas, A. Sanna, and E. K. U. Gross, Eur. Phys. J. B. 89, 63 (2016b).
- Errea et al. (2015) I. Errea, M. Calandra, C. J. Pickard, J. Nelson, R. J. Needs, Y. Li, H. Liu, Y. Zhang, Y. Ma, and F. Mauri, Phys. Rev. Lett. 114, 157004 (2015).
- Heil and Boeri (2015) C. Heil and L. Boeri, Phys. Rev. B 92, 060508(R) (2015).
- Akashi et al. (2016) R. Akashi, W. Sano, R. Arita, and S. Tsuneyuki, Phys. Rev. Lett. 117, 075503 (2016).
- Peng et al. (2017) F. Peng, Y. Sun, C. J. Pickard, R. J. Needs, Q. Wu, and Y. Ma, Phys. Rev. Lett. 119, 107001 (2017).
- Wang et al. (2011) H. Wang, J. S. Tse, K. Tanaka, T. Iitaka, and Y. Ma, PNAS 109, 6463 (2011).
- Feng et al. (2015) X. Feng, J. Zhang, G. Gao, H. Liu, and H. Wang, RSC Adv. 5, 59292 (2015).
- Heil et al. (2019) C. Heil, S. D. Cataldo, G. Bachelet, and L. Boeri, Phys. Rev. B 99, 220502(R) (2019).
- Liu et al. (2017) H. Liu, I. I. Naumov, R. Hoffmann, N. W. Ashcroft, and R. J. Hemley, PNAS 114, 6990 (2017).
- (43) The periodic table has 118 elements, therefore there are possible combinations .
- Li et al. (2018a) D. Li, Y. Liu, F. Tian, S.-L. Wei, Z. Liu, D.-F. Duan, B. Liu, and T. Cui, Front. Phys. 13, 137107 (2018a).
- Cui et al. (2020) W. Cui, T. Bi, J. Shi, Y. Li, H. Liu, E. Zurek, and R. J. Hemley, Phys. Rev. B 101, 134504 (2020).
- Ge et al. (2016) Y. Ge, F. Zhang, and Y. Yao, Phys. Rev. B 93, 224513 (2016).
- Liu et al. (2018) B. Liu, W. Cui, J. Shi, L. Zhu, J. Chen, S. Lin, R. Su, J. Ma, K. Yang, M. Xu, J. Hao, A. P. Durajski, J. Qi, Y. Li, and Y. Li, Phys. Rev. B 98, 174101 (2018).
- Amsler (2019) M. Amsler, Phys. Rev. B 99, 060102(R) (2019).
- Liang et al. (2019a) X. Liang, S. Zhao, C. Shao, A. Bergara, H. Liu, L. Wang, R. Sun, Y. Zhang, Y. Gao, Z. Zhao, X.-F. Zhou, J. He, D. Yu, G. Gao, and Y. Tian, Phys. Rev. B 100, 184502 (2019a).
- Liang et al. (2019b) X. Liang, A. Bergara, L. Wang, B. Wen, Z. Zhao, X.-F. Zhou, J. He, G. Gao, and Y. Tian, Phys. Rev. B 99, 100505(R) (2019b).
- Kokail et al. (2017) C. Kokail, W. von der Linden, and L. Boeri, Physical Review Materials 1, 074803 (2017).
- Sun et al. (2019) Y. Sun, J. Lv, Y. Xie, H. Liu, and Y. Ma, Phys. Rev. Lett. 123, 097001 (2019).
- Glass et al. (2006) C. W. Glass, A. R. Oganov, and N. Hansen, Computer Physics Communications 175, 713 (2006).
- Giannozzi et al. (2009) P. Giannozzi, S. Baroni, N. Bonini, M. Calandra, R. Car, C. Cavazzoni, D. Ceresoli, G. L. Chiarotti, M. Cococcioni, and I. Dabo, J. Phys. Condens. Matter 21, 395502 (2009).
- Züttel et al. (2007) A. Züttel, A. Borgschulte, and S.-I. Orimo, Scripta Materialia 56, 823 (2007).
- Paskevicius et al. (2017) M. Paskevicius, L. H. Jepsen, P. Schouwink, R. Cerny, D. B. Ravnsbaek, Y. Filinchuk, M. Dornheim, F. Besenbacher, and T. R. Jensen, Chem. Soc. Rev. 46, 1565 (2017).
- Zhang et al. (2010) Y. Zhang, E. Majzoub, V. Ozolins, and C. Wolverton, Phys. Rev. B 82, 174107 (2010).
- Riktor et al. (2009) M. D. Riktor, M. H. Sørby, K. Chlopek, M. Fichtner, and B. C. Hauback, J. Mater. Chem. 19, 2754 (2009).
- Yan et al. (2015) Y. Yan, A. Remhof, D. Rentsch, A. Züttel, S. Giri, and P. Jena, Chem. Commun. 51, 11008 (2015).
- Kim et al. (2012a) Y. Kim, S.-J. Hwang, J.-H. Shim, Y.-S. Lee, H. N. Han, and Y. W. Cho, J. Phys. Chem. C 116, 4330 (2012a).
- Kim et al. (2012b) Y. Kim, S.-J. Hwang, Y.-S. Lee, J.-Y. Suh, H. N. Han, and Y. W. Cho, J. Phys. Chem. C 116, 25715 (2012b).
- Ozolins et al. (2008) V. Ozolins, E. H. Majzoub, and C. Wolverton, J. Am. Chem. Soc. 230, 230 (2008).
- Shah and Kolmogorov (2013) S. Shah and A. N. Kolmogorov, Phys. Rev. B 88, 014107 (2013).
- Hu et al. (2013) C.-H. Hu, A. R. Oganov, Q. Zhu, G.-R. Qian, G. Frapper, A. O. Lyakhov, and H.-Y. Zhou, Phys. Rev. Lett. 110, 165504 (2013).
- Aeberhard et al. (2011) P. C. Aeberhard, K. Refson, P. P. Edwards, and W. I. F. David, Phys. Rev. B 83, 174102 (2011).
- Li et al. (2018b) X. Li, Y. Huang, S. Wei, D. Zhou, Y. Wang, X. Wang, F. Li, Q. Zhou, B. Liu, X. Huang, and T. Cui, J. Phys. Chem. C 122, 14272 (2018b).
- Stabila et al. (2010) V. Stabila, J.-H. Her, W. Zhou, S.-J. Hwang, C. Kim, L. A. M. Ottley, and T. J. Udovic, Journal of Solid State Chemistry 183, 1133 (2010).
- Natoli et al. (1993) V. Natoli, R. M. Marting, and D. M. Ceperley, Phys. Rev. Lett. 70, 1952 (1993).
- Savrasov and Savrasov (1996) S. Y. Savrasov and D. Y. Savrasov, Phys. Rev. B 54, 16487 (1996).
- Carbotte (1990) J. P. Carbotte, Reviews of Modern Physics 62, 1027 (1990).
- Errea et al. (2020) I. Errea, F. Belli, L. Monacelli, A. Sanna, T. Koretsune, T. Tadano, R. Bianco, M. Calandra, R. Arita, F. Mauri, and J. A. Flores-Livas, Nature 578, 66 (2020).
- McMillan (1968) W. L. McMillan, Phys. Rev. 167, 331 (1968).
- Heil et al. (2018) C. Heil, G. B. Bachelet, and L. Boeri, Phys. Rev. B 97, 214510 (2018).
- Kresse and Furthmüller (1996) G. Kresse and J. Furthmüller, Phys. Rev. B 54, 11169 (1996).
- Ong et al. (2013) Ong, S. Ping, W. D. Richards, A. Jain, G. Hautier, M. Kocher, S. Cholia, D. Gunter, V. L. Chevrier, K. A. Persson, and G. Ceder, Computational Materials Science 68, 314 (2013).
- Momma and Izumi (2011) K. Momma and F. Izumi, J. Appl. Crystallogr. 44, 1272 (2011).