Analysis of the spectra observed from GRB061007, GRB061121, GRB080605, GRB090926B, GRB080207 and GRB070521 host galaxies. H and SFR trends.
We calculate the physical conditions and the N/H and O/H relative abundances for a sample of long GRB (LGRB) host galaxies in the redshift range 1z2.1 by modelling recently observed line and continuum spectra. The results are consistent with those previously calculated for LGRB host galaxies throughout a more extended redshift range z. We analyse star formation rates (SFR) within the LGRB hosts on the basis of the H fluxes. They are compared with those of local low-luminosity starburst (SB) galaxies, individual HII regions in local galaxies as well as LGRB host galaxies at intermediate and relatively high redshifts. The enhanced SFR in the HII regions within nearby galaxies is explained by a relatively high filling factor which characterizes ”individual regions” rather than ”entire galaxies” which are generally presented by the observations. The fragmented matter in the galaxies derives from progenitor merging. We check whether the release by the morphological transformations of ice of the O2 and N2 molecules trapped into the ice mantles of dust grains could explain the N/O ratios throughout the redshift. We have found that shock velocities calculated by modelling the spectra are high enough to completely destroy the ice mantles. Therefore, the prevention of secondary nitrogen formation is a valid hypothesis to explain the low N/O ratios at z1. The SFR trend increasing with z is roughly similar to that of N/O.
Key Words.:
radiation mechanisms: general — shock waves — ISM: abundances — galaxies: GRB — galaxies: high redshift1 Introduction
Long GRB (LGRB) derive from implosion of massive stars. They have observed periods 2 seconds and they are mainly detected at redshifts z0.08. These data concern the burst itself. An effort is recently carried on to investigate the burst influence on the properties of the host galaxies (e.g. Contini 2019a), for instance, following the shocks created by the burst as they reach and propagate throughout the host galaxy. The effect of radiation accompanying the GRB will be better recognized when the high ionization level lines emitted from the host gas will be available from the observations. Meanwhile, the radiation source of the host gas is attributed to the starburst (SB) within the host. In a few cases (e.g. LGRB031203, Margutti et al. 2007) the spectra at different epochs were observed. This allowed (Contini 2019a) to give a hint on whether and how the host gas properties are affected by the GRB. However, the calculated physical conditions and element abundances of all types of galaxies at relatively high redshifts represent only an average because the observations generally cover the entire galaxy. Specific observations of different regions within the same galaxy (e.g. Nicuesa Guelbenzu et al 2015) will resolve this issue (Contini 2019b).
GRB host galaxies are investigated in particular to obtain some information about the progenitors. Line spectra in the optical- near infrared range are now available for most of the survey galaxies also at redshifts 1. The modelling of the spectra focus on metallicities in order to disclose the nature of star forming processes throughout the redshift. It has been suggested that metallicities in GRB hosts are lower than solar (Asplund et al 2009) indicating that primordial material is trapped inside the emitting clouds. However O/H ratios higher than solar were derived in a number of objects (e.g. Perley 2016b). Analyzing a relatively large sample of host galaxies of different types, it was found (Contini 2016 and references therein) that gas temperatures and densities in the emitting clouds within GRB hosts are similar to those of supernova (SN) hosts and SB galaxies. Surveys of spectral observations including a large number of objects were presented by Krühler et al (2011), Savaglio et al (2012), Han et al (2010), etc. Their data allowed to calculate the element abundances by modelling the line ratios.
To characterise the population of LGRB host galaxies at 1z3 the conditions in which LGRBs form were addressed in the frame of star formation ages throughout the redshift by Palmerio et al (2019), Vergani et al. (2017), Hashimoto et al (2019), etc. in order to trace star formation. They reported LGRB characteristics calculated on the basis of large surveys of host galaxy investigations (Vergani et al 2015, Perley et al 2016a, 2016b, Japelj et al 2016a, 2016b). Palmerio et al confirmed that LGRBs occur mainly in low metallicity neighbourhood. However, high metallicity progenitors were not excluded (Berg et al 2012, Savaglio et al 2012, Contini 2019b, etc).
Star formation rates (SFR) are generally evaluated by the Kennicutt et al (1998) equation on the basis of the H observed luminosity. H are the strongest recombination lines. However, a leading question involving star formation and SFR within the host galaxies concerns dust formation. Formation and destruction of stars are closely connected with the production of interstellar dust (Dwek 1998, Franceschini 2001, Kreckel et al 2013) even in the early universe because dust is created by the ejecta of population III stars (Nozawa et al 2003). It was suggested that most of the stars at redshift z 1-3 were formed in a dusty environment (Le Floc’h et al. 2005, Magnelli et al. 2009, Elbaz et al. 2011, Murphy et al. 2011, Reddy et al. 2012) implying that the infrared wavelengths are the SFR indicators. The UV and optical wavelengths may be preferred as SFR indicators at very high redshift, when galaxies contained little dust (e.g., Wilkins et al. 2011, Walter et al. 2012) which could not seriously modify the line ratios from their theoretical values in the different wavelength domains. Calzetti (2013) claimed that the calibration of SFR indicators remains, however, problematic for distant galaxies (e.g., Reddy et al. 2012; Lee et al. 2010; Wuyts et al. 2011), since it can be affected in particular by differences in star formation histories, metal abundances, content and distribution of stellar populations and dust between low and high redshift galaxies (Elbaz et al. 2011).
We investigate LGRB host galaxies focusing on the element abundances. At present, we can determine N/H and O/H with a satisfactory accuracy by the detailed modelling of the observed line ratios. When the lines relative to C, Si, S and Fe will be available from the observations in the UV and/or in the IR range we will be able to discuss the presence of dust grains with more precision. In this paper we start by modelling the line and continuum spectra observed by Palmerio et al (2019) and Hashimoto et al (2019) from LGRB hosts at 1 in order to add more data to the sample of LGRB host galaxies presented by Contini (2017 and references therein). The choice of the survey objects is, however, limited to those showing the characteristic spectral lines which constrain the models. We also consider galaxies at lower redshifts which were analysed previously but show new data of lines and/or of the continuum SED. Our method consists in calculating by the detailed modelling of the spectra the physical and chemical parameters characteristic of the gas within the galaxy which lead to the best fit the line ratios. Thus, we obtain the calculated H and H fluxes for each galaxy. They can be compared with the observed ones and can be used to calculate the reddening correction factor for each line ratio. Then, we analyse SFR in LGRB host galaxies focusing on the observed H fluxes. Comparison of calculated with observed H can give a hint about SFR evolution throughout the 0z3 redshift. We use composite models which account consistently for photoionization and shocks. The calculation code is briefly described in Sect. 2. In Sect. 3 the modelling of Palmerio et al and Hashimoto et al observations are presented. The distribution of the SFRs throughout the redshift is discussed in Sect. 4. Concluding remarks follow in Sect. 5.
2 Calculation details
The code suma is adopted (for a more detailed description of the code see Contini 2019a). The main input parameters are those which lead to the calculations of line and continuum fluxes. They account for photoionization and heating by primary and secondary radiation and for collisional process due to shocks. The input parameters such as the shock velocity , the atomic preshock density and the preshock magnetic field (for all models =10-4Gauss is adopted) define the hydrodynamical field. They are combined in the compression equation (Cox 1972) which is resolved throughout each slab of the gas in order to obtain the density profile throughout the emitting clouds. Primary radiation for SB in the GRB host galaxies is approximated by a black-body (bb). The input parameters that represent the primary radiation from the SB are the effective temperature and the ionization parameter . The primary radiation source does not depend on the host physical condition but it affects the surrounding gas. This region is not considered as a unique cloud, but as a sequence of plane-parallel slabs (up to 300) with different geometrical thickness calculated automatically following the temperature gradient. The secondary diffuse radiation is emitted from the slabs of gas heated by the radiation flux reaching the gas and by the shock. Primary and secondary radiation are calculated by radiation transfer. The calculations initiate at the shock front where the gas is compressed and adiabatically thermalised, reaching a maximum temperature in the immediate post-shock region T 1.5 ( /100 )2. T decreases downstream leading to recombination. The cooling rate is calculated in each slab. The line and continuum emitting regions throughout the galaxy cover an ensemble of fragmented clouds. The geometrical thickness of the clouds is an input parameter which is calculated consistently with the physical conditions and element abundances of the emitting gas. The fractional abundances of the ions are calculated resolving the ionization equations for each element (H, He, C, N, O, Ne, Mg, Si, S, Ar, Cl, Fe) in each ionization level. Then, the calculated line ratios, integrated throughout the cloud geometrical width, are compared with the observed ones. The calculation process is repeated changing the input parameters until the observed data are reproduced by the model results, at maximum within 10-20 percent for the strongest line ratios and within 50 percent for the weakest ones.
The gas ionized by the SB radiation flux emits continuum radiation (as well as the line fluxes) from radio to X-ray. The continuum accounts for free-free and free-bound radiation (hereafter addressed to as bremsstrahlung). Some parameters regarding directly the continuum SED, such as the dust-to-gas ratio and the dust grain radius agr are not directly constrained by fitting the line ratios. Dust grains are sputtered throughout the shock front and downstream. They are heated by the primary radiation and by mutual collision with atoms. The dust reprocessed radiation in the infrared (IR) range throughout the SED depends on and agr . The distribution of the grain sizes along the cloud starting from an initial radius is automatically calculated by suma.
3 Modelling the spectra
3.1 Line ratios
| GRB | z | [OII]3727+ | [NeIII]3868 | H | H | [OIII]5007+ | H | [NII]6583 |
|---|---|---|---|---|---|---|---|---|
| 0610071 | 1.2623 | 2.4 | 2 | - | 1.0 | 9.5+ | 40.4 | 2.4 |
| corr | 2.98 | 2.42 | - | 1 | 8.7+(2.2) | 3 | 1.8 | |
| mod1 | 3.3 | 1.0 | 0.46 | 1 | 11.74 | 3 | 0.36 | |
| 0611211 | 1.3160 | 3.38 | 0.32 | 0.53 | 1 | 4.36 | 5.060.9 | 0.57 |
| corr | 4.97 | 0.46 | 0.64 | 1 | 3.4 | 3 | 0.34 | |
| mod2 | 5.2 | 0.55 | 0.46 | 1 | 3.47 | 2.96 | 0.39 | |
| 0806051 | 1.6408 | 2.22 | - | - | 1 | 5.18 | 3.78 | 0.52 |
| corr | 2.64 | - | - | 1 | 5.00 | 3 | 0.4 | |
| mod3 | 2.5 | - | - | 1 | 5.02 | 2.94 | 0.33 | |
| 090926B1 | 1.2427 | 4.96 | 0.92 | 1.17 | 1 | 6.38 | 4.79 | 0.8 |
| corr | 7.07 | 1.13 | 1.38 | 1 | 5.8 | 3 | 0.8 | |
| mod4 | 7.1 | 0.75 | 0.46 | 1 | 5.9 | 2.95 | 0.5 | |
| 0802072 | 2.086 | 2.028 | 0.73 | - | 1 | 4.836 | 3.0 | 0.68 |
| mod5 | 1.8 | 0.5 | 0.46 | 1 | 4.9 | 3.2 | 0.52 |
1 from Palmerio et al (2019); 2 from Krühler et al (2015)
| models | mod1 | mod2 | mod3 | mod4 | mod5 |
|---|---|---|---|---|---|
| H 1 | 0.02 | 0.0023 | 0.03 | 0.0094 | 0.084 |
| () | 200 | 100 | 200 | 160 | 320 |
| () | 60 | 90 | 80 | 110 | 80 |
| (pc) | 0.23 | 0.02 | 0.1 | 0.1 | 1.1 |
| (104K) | 8.8 | 7.2 | 5.4 | 9.4 | 9.7 |
| - | 0.04 | 0.0034 | 0.042 | 0.0085 | 0.04 |
| He/H | 0.1 | 0.1 | 0.1 | 0.1 | 0.1 |
| N/H2 | 0.22 | 0.2 | 0.4 | 0.2 | 0.5 |
| O/H2 | 6.6 | 6.6 | 6.6 | 6.6 | 6.6 |
| Ne/H2 | 1. | 1. | 1. | 0.7 | 1 |
| S/H2 | 0.2 | 0.3 | 0.3 | 0.2 | 0.2 |
| Ar/H2 | 0.06 | 0.04 | 0.03 | 0.006 | 0.06 |
| 12+log(O/H)3 | 8.82 | 8.82 | 8.82 | 8.82 | 8.82 |
| 12+log(O/H)4 | 8.13 | 8.51 | 8.47 | 8.48 | 8.745 |
1 H absolute flux calculated at the nebula in ; 2 in 10-4 units; 3 calculated in this paper; 4 Palmerio et al; 5 calculated by Krühler et al (2015).
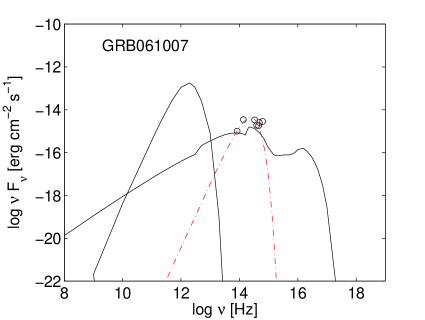
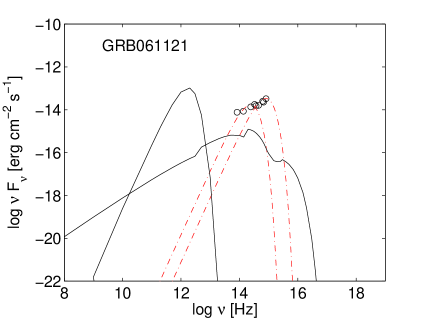
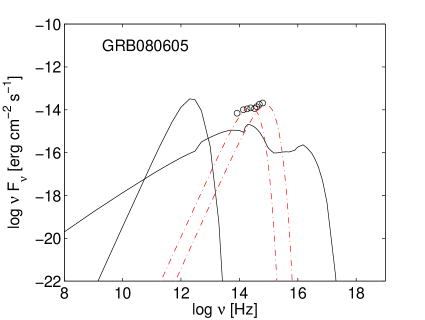
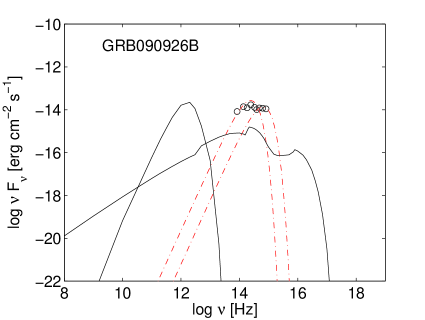
Palmerio et al (2019) report the sample of LGRB host galaxies at 1z2 (Salvaterra 2012) observed by the Swift/BAT6 (Burst Alert Telescope). We consider for modelling Palmerio et al data presented in their table A.4. The observed line fluxes are given in units of 10-17 and are corrected for Galactic foreground extinction. The modelling procedure requires a minimum number of specific lines in order to constrain the models. We select the galaxies which show H , H and oxygen in at least two ionization levels, GRB061007, GRB061121, GRB08605 and GRB090926B. They are reported in Table 1. For each galaxy the row showing the observed flux ratios is followed by the line intensity ratios to H (reddening corrected). We have further corrected the line ratios using Osterbrock (1974) equations when H /H 4 because the H /H ratios calculated by quantum mechanic procedures range between 3.05 and 2.87 for gas temperatures between 5000 K and 10000 K and preshock densities 102-104 . These values are similar to those calculated by the detailed modelling of the spectra (which means that all the lines are considered) for most of the LGBR host galaxies. The preshock densities calculated for the galaxies in Table 1 are not as high as to yield H /H 4. These values can be found for high optical depths (Osterbrock 1974, fig 4.3). In Table 1, for each host galaxy, below the row reporting the corrected line ratios, the model calculation results are shown for comparison. For the host of GRB061007 the [OIII] 5007 line is given by the observations, while the [OIII] 4959 line is omitted. The two lines belong to the same multiplet. From the ratio of the the transition probabilities (Osterbrock 1974) the [OIII] 4959 line should be 1/3 [OIII] 5007. On this basis we have added the [OIII] 4959 line flux for GRB061007 in Table 1.
In the bottom of Table 1 the line ratios for the host galaxy GRB080207 at z=2.086 are shown. We added in Table 1 the host line spectrum of this object from the sample of Krühler et al (2015) because the model can be constrained by Hashimoto et al (2019) rich photometric data of the continuum SED. Hashimoto et al reported for GRB080207 also the [CII] 156 m line in the far-IR. Model calculations yield [CII]/H = 0.04 and H = 0.09 . For GRB080207, after the GRB detection by SWIFT/BAT (Racusin et al 2008), no optical and NIR afterglows were detected. The extremely red host galaxy was identified within the X-ray positional error circle (Hunt et al 2011, Svensson et al 2012). The H and [OIII]5007 lines were observed with VLT/X-Shooter by Krühler et al (2012) yielding SFR 77 M⊙ yr-1. The host galaxy was also detected by Herschel/PACS at 30m and 50m . The modelling of the line ratios is reported by Contini (2016, table 8).
In Table 1 we compare the results of model calculations with the observations. The calculation uncertainty is 10 percent. The models are represented by the sets of the input parameters which lead to the best fit of the observed line ratios. They are described in Table 2. We adopt for all the spectra a black-body dominated model representing the star burst. The effective temperatures calculated for the star burst in the host galaxies are high enough to indicate a quite recent event. The O/H relative abundances calculated by the detailed modelling are solar ((O/H)⊙=6.6 10-4, Asplund et al 2009) for all the hosts, while the N/H ratios are low relatively to the solar ones ((N/H)⊙=10-4) and similar to those of other LGRB hosts. The results suggest that LGRB at z 2 occur in a low metallicity medium, relative to nitrogen. In the bottom of Table 2 metallicities in terms of 12+log(O/H) calculated by the present detailed modelling and by the strong line method by Palmerio et al are compared. Palmerio et al values are lower than solar, therefore they claim that SFR should be high in their sample of host galaxies on the basis of the low metallicity.
3.2 Continuum SED
The bremsstrahlung emitted from the galaxy clouds can be seen throughout the SED in the X-ray - radio range. The dust reradiation bump in the infrared and the old star backgound population flux emerge from it in nearly all the galaxy types. In this work we use =10-14 by number for all the models which corresponds to 4.1 10-4 by mass for silicates (Draine & Lee 1994). The black body emission from the background old star population with Tbb 3000-8000 K generally covers the near-IR (NIR) - optical range of the SED.
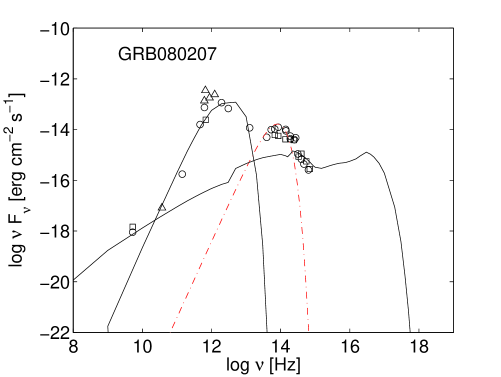
The modelling of the continuum SED of each object is calculated by the same model which fits the line ratios. The results are shown in the diagrams of Figs 1 and 2. Two main solid lines show the result of modelling. One represents the bremsstrahlung emitted from the gaseous clouds within the galaxy which also emit the lines, while the other line represents reprocessed radiation by dust. The red dash-dotted lines indicate the black-body flux emitted from the underlying old star population with different temperatures. For the Palmerio et al sample which appears in Fig. 1 diagrams the modelling of the continuum SED is not constrained by the data in the radio, in the far-IR, not even in the very NIR, while the model results are definitively constrained by the data reported by Hashimoto et al for GRB080207 (Fig. 2). Therefore, in Fig. 1 diagram, we have normalized the bremsstrahlung radiation by the frequency in the radio range at = 108 Hz, waiting for future data. The underlying old stellar temperatures which result from the IR-optical bump is 3000 K for GRB061007, while the temperatures range between 3103K- 104K, 3103K- 104K and 3103K- 8103K for GRB061121, GRB080605 and GRB090926B, respectively.
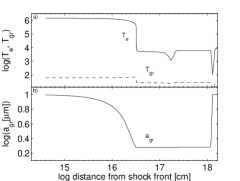
The relatively rich dataset presented for the SED by Hashimoto et al for GRB080207 (Fig. 2) covers a more extended frequency range, accounting for the radio range, the IR range of dust reprocessed radiation and the NIR-optical range due to the underlying stellar population. This host continuum SED in the far-IR is reproduced by a dust-to-gas ratio by mass 4.1 10-4. GRB070521 was detected by the burst alert telescope (BAT) by Gehrels (2004) and Guidorzi et al (2007a). The X-ray afterglow was detected by the Swift X-Ray Telescope (XRT) by Guidorzi (2007b). The redshift of the host galaxy at z=2.0865 was determined by the H emission by Krühler et al (2015) leading to SFR=26 M⊙ yr-1. The line fluxes observed from GRB070521 and from other samples, as e.g. those of Vergani et al (2017) could not be used for modelling because the data were not enough to constrain the models. On the other hand, Hashimoto et al (2019) presented a rich photometric set of data also for this GRB host. We try to reproduce the observation data in Fig. 2 by the same model as that calculated for GRB080207. The fit is suitable enough to suggest that similar physical conditions characterize both the GRB070521 and GRB080207 host galaxy gas. The black-body bump in the IR (red line), which represents the contribution of the underlying old star population, has a temperature of 1000 K which is lower than generally observed for other GRB hosts and it is most likely interpreted as emission by hot dust rather than by old stars. Dust grains can be heated to T1000 K (close to evaporation) by strong radiation and/or collisionally by gas throughout strong shocks ( 500 ) and downstream. These conditions are not easily found in LGRB host clouds. We have adopted a maximum radius agr =1 m for the dust grains in all the galaxies presented in Figs. 1 and 2. Fig. 3 shows the profiles of the grain radius agr sputtered downstream by the shock, of the grain temperature and of the gas temperature throughout the clouds in the GRB080207 host galaxy. Large dust grains with agr 1 m survive sputtering within the clouds because the shock velocity (Table 2, mod5) is low enough (350 ). For the other galaxies agr remains constant throughout the clouds due to the low (200 ). The fit of the GRB080207 dust reprocessed radiation bump leads to a maximum 70 K. On the other hand, dust shells with temperatures of 1000 K are present in late-type stars (e.g. Danchi et al. 1994) as well as in symbiotic systems (Angeloni et al 2010) and can explain the IR black body radiation bump of the underlying stellar population.

4 SFR evolution trend
Kennicutt et al (1998) investigating SFR following the evolutionary properties of galaxies claim that most information comes from the integrated UV, far-IR (FIR) flux and from nebular recombination lines. The last ones provide a ”sensitive probe of young massive star population”, while FIR efficacy as a SFR tracer depends on the contribution of young stars to heat the dust grains. Generally SFR are given by the observers on the basis of the H line flux. We therefore investigate SFR at different redshifts by the analysis of the H luminosities adopting Kennicutt et al (1998) equation:
SFR (M⊙ y-1) = 7.9 10-42 LHα (erg s-1) (1)
because SFR (M⊙ y-1)= 1.40.410-41L[OII] (erg s-1) (2)
which was written for the [OII] line (L[OII] is the [OII] luminosity), leads to less correct results (see Kennicutt et al).
We have checked the spectra by Palmerio et al and Krühler et al in Table 1. Not all of them show [OII]3727+/H intensity ratios higher than the H /H ones. As for the sample of LGRB hosts adopted by Contini (2016, 2017) the [OII]3727+/H line ratios are seldom higher than the H /H . Therefore we will consider eq. (1) valid for the calculation of SFRs. LHα , the H luminosity observed at Earth, is the same as that calculated at the nebula i.e. LHα =H 4d2=H 4R2, where d is the distance from Earth, H is the H flux observed at Earth, H is the H flux calculated at the nebula and R the radius of the emitting nebula in terms of the distance of the nebula from the galaxy center. Model results are valid for the emitting nebula, while the observations are obtained at Earth, therefore the H /H ratios range within a factor of 10-16 - 10-17, depending on the distance of the emitting galaxy. R covers a range of 0.01-100 pc for LGRB host clouds. The observed data are averaged on the whole galaxy, therefore a filling factor should be accounted for because the morphological distribution of matter throughout the galaxies is highly fragmented.
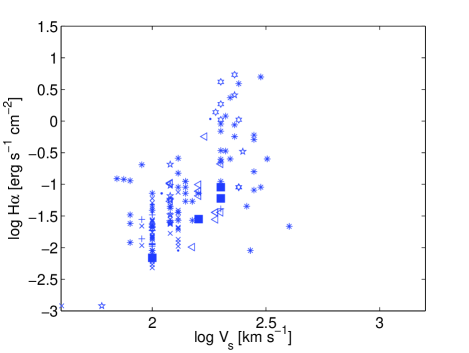
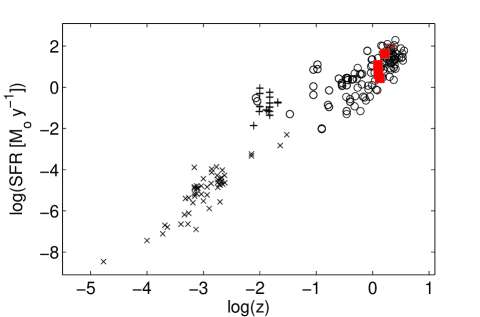
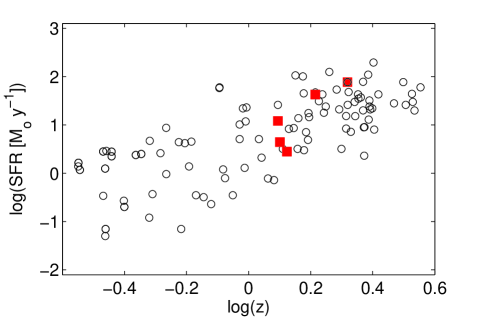
| symbol | object | Ref. |
|---|---|---|
| asterisks | GRB hosts | (1) |
| point | LGRB hosts | (2) |
| pentagrams | LGRB different hosts | (3) |
| hexagram | LGRB hosts with WR stars | (4) |
| triangles | LGRB at low z | (5) |
| filled squares | LGRB in this paper | (6) |
| plus | HII regions in local galaxies | (7) |
| cross | HII low-luminosity nearby galaxies | (8) |
(1) (Krühler et al. 2015); (2) (Savaglio et al. 2009); (3) (Sollerman et al (2005), Castro-Tirado et al. (2001), Graham & Fruechter (2013), Levesque et al. (2010), Vergani et al. (2011), Piranomonte et al. (2015); (4) (Han et al. 2010); (5) (Niino et al. 2016); (6) (Palmerio et al 2019); (7) (Marino et al. 2013); (8) (Berg et al. 2012);
4.1 H line flux
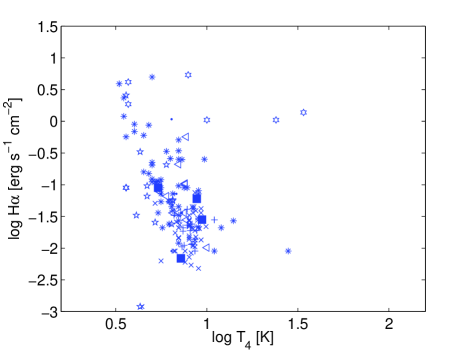
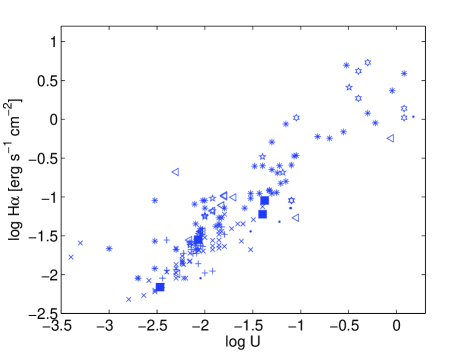
In order to understand the SFR trend throughout a large redshift range we show in Fig. 4 the H fluxes calculated at the nebula on the basis of the corrected observed spectra, in order to avoid distance problems. In our previous investigation of SFR in LGRB host galaxies (Contini 2016, fig. 8) we presented the physical parameters which contribute to H . Line fluxes are calculated by the models which lead to the best fit of the spectra observed from different objects at different redshifts. The line intensities result from summing the contribution of the different slabs of clouds within the gas nebula. The effective Balmer line recombination coefficient is 2104/T (Brocklehurst 1971). The calculation of the H flux accounts also for the most significant parameters (e.g. , , , and ). We investigate the trends of H calculated at the emitting nebula (H ) as function of the different physical parameters. They are shown in Fig. 4 on the basis of the diagrams previously presented by Contini (2016, fig. 8). We have added H calculated by the data given by Berg et al (2012) for low luminosity local HII galaxies and by Marino et al (2013) for the Calar Alto Legacy Integral Field Area (CALIFA) sample of individual HII regions in nearby galaxies in order to enlarge the redshift range by including local galaxies. Also, the results of modelling the LGRB host spectra at intermediate and low z (z0.4) by Niino et al (2016) are shown in Fig. 4 diagrams as well as H calculated by modelling the data presented by Palmerio et al (2019) in the 1z2.1 range. The diagrams showing a clear trend of H with each of the input parameters are shown in Fig. 4, whereas those which display a confused picture were omitted. The diagrams indicate that H increases with the shock velocity and with the ionization parameter, but decreases with the SB effective temperature between 104K and 105 K because the H+ recombination coefficient increases for gas heated by the source radiation to decreasing temperatures 105K. The SB temperatures in the hosts of the LGRB sample presented in Table 2 were found within the norm 104 105 K and the shock velocities are 100 . The maximum temperature of the gas downstream is therefore 1.5 105 K (see Sect. 2) leading to energies 13 eV, similar to the H ionization potential (13.6 eV). Shocks with 100 enhance the SFR throughout the host galaxies. Moreover, H increases with , the ionization parameter, when more photons reach the emitting nebula leading to strong line emission. The low ionization parameters calculated for the Berg et al and Marino et al samples (Contini 2017) yield a low H . However, we will show in the following that the SFR are different for the two samples.
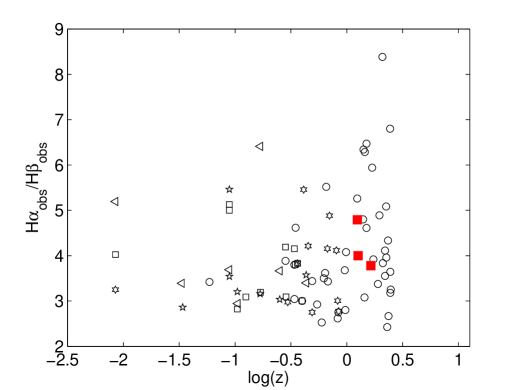
Before discussing the SFR trend obtained by the observations we check the H /H ratios presented by the observers after correction. In our previous investigation of SFR in LGRB host galaxies (Contini 2016, fig. 8) H /H =3 (Osterbrock 1974) was used to correct the spectra from reddening because it is adapted to represent the physical conditions throughout the nebulae when shocks are at work. The line fluxes collected from the observations were reddening corrected by the observers using Cardelli et al (1989) method. Marino et al and Berg et al used H /H =2.86. Fig. 5 shows that there is an increasing trend of H /H (presented by the observers) with z, although most of the values are in the appropriate range (30.5 Osterbrock 1974). This indicates that the correction is not complete for some objects and/or that matter with a higher optical depth may contribute to the spectra, yielding higher H /H line ratios (Osterbrock 1974) in particular in the redshift range between approximately 0.25 and 2.5. A valid correction of line fluxes may yield different values of SFRs.
4.2 SFR
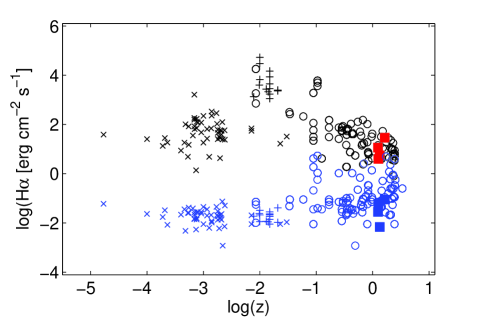
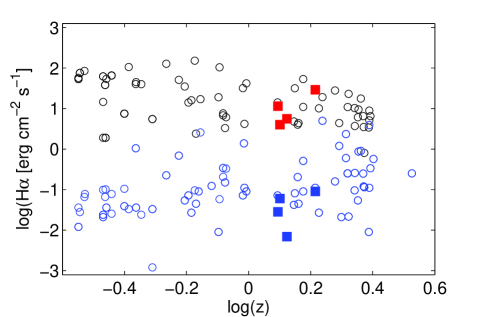
We compare in Fig. 6 H with H line intensities. H fluxes are shifted upwards on the Y-axis by a factor of 1017. The left panels of Figs. 6 - 8 cover a large redshift range -5.5log(z)0.6 while the right ones are zoomed to -0.6log(z) 0.6. H and H follow different trends as H decreases with z, while the H trend increases, in particular towards higher z. This means that also the SFR trend should decrease at high z because SFRs are generally calculated by eq. 1. The opposite can be seen for SFR in Fig. 7 (right panel). The left panel of Fig. 7 shows the SFR values collected from the observer samples throughout a large z range (z3). It seems that the distance factor d2 which is used in the calculation of LHα dominates grossly the SFR trend from local HII galaxies to LGRB hosts. SFR could show a steeper increasing trend at high z if the spectra were corrected with a higher precision. SFRs presented by Marino et al CALIFA HII regions in near galaxies (Fig. 7 left) overcome by a factor of 100 the SFR values calculated by Niino et al for LGRB host at z0.4, while the Berg et al sample of local galaxies follows roughly a linear increasing slope. We suggest that the abnormally high SFR values in the CALIFA HII regions are due to the fact that Marino et al consider HII within the galaxies which are more compact than the entire observed by e.g. Berg et al. Galaxies, in general, have strongly fragmented structures. The and parameters calculated for the Berg et al sample of HII galaxies and for the Marino et al HII regions (Contini 2017) are alike, therefore the H values are similar and the different luminosities depend on the morphological distribution of matter through the galaxy. The abnormal SFR (and H ) in the Marino et al HII compact regions and other nearby galaxies at z0.1 is most probably due to a high filling factor ff. The low ff which is revealed by the fragmented texture of the galaxy medium most probably depends on the progenitor merging phenomena.
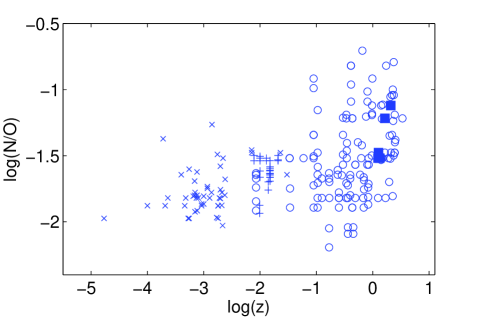
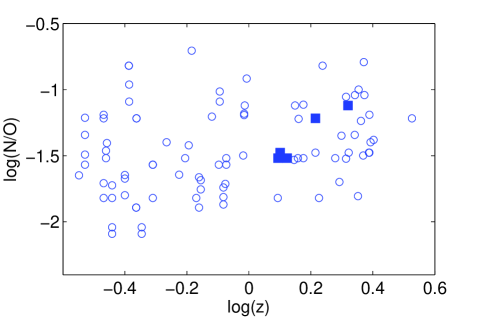
4.3 N/O abundance ratios
The formation of stars depends on dust production. Table 2 shows that the calculated N/O ratios are lower than solar, while O/H are solar. We have checked whether the release of O2 and N2 molecules trapped into the ice mantles of dust grains can explain the low N/O relative abundances calculated for the sample of LGRB hosts presented by Palmerio et al. O2 and N2 molecules are trapped within grain ice mantles with an O2 efficiency greater than for N2 (Laufer et al. 2018). They are released with roughly similar ratios by heating the ice to the critical temperatures of the exothermic morphological transformations, 140K-160K from amorphous to crystalline cubic and 160K-190K from cubic to hexagonal. Ice mantles are completely destroyed for 50 (Strahler & Palla 2005). The shock velocities calculated by the detailed modelling of the spectra for a relatively large sample of LGRB hosts and HII galaxies (Contini 2017) are in general 100 . Therefore, a low N abundance in the gaseous phase of LGRB host clouds does not seem to be due to trapping of N2 molecules into ice mantles.
SFR trends are generally discussed in the light of massive stars and therefore of metallicities intended as the O/H relative abundances (e.g. Vincenzo et al 2015, Mannucci et al 2010). We focus on N/H ratios. Nitrogen is mostly a secondary element being a product of CNO cycle formed at expences of C and O already present in stars. The primary N component originating in giant branch stars (AGB) is predicted by stellar nucleosynthesis (Chiappini et al 2003). Henry et al (2000) have found that N has both primary and secondary components. The production of nitrogen is dominated by primary process at low metallicity and secondary process at higher ones (Maynet & Maeder 2002). Contini (2017) showed that O/H and N/H ratios have a minimum for 0.1z0.4, while N/O decreases towards low z. For z0.1 the O/H ratios are close to solar within a large redshift range. In the same redshift range the N/O ratios follow an increasing (AGN, SN hosts, etc ) or a decreasing (SB , HII galaxies) trend with decreasing z for different types of objects. It was suggested by Contini (2017 and references therein) that N/O ratios depend on secondary nitrogen production. The N/O ratios reach the lowest values in local HII galaxies. For comparison, in Fig. 8 the results of N/O calculated for the host galaxy sample presented by Palmerio et al are added in the diagrams showing the calculated N/O versus z trend through the extended redshift range. They are too few to confirm the decreasing trend of N/O with decreasing z at z2, however they fit the average distribution of N/O for z1-2 (Fig. 8 right). Fig. 8 (right) shows that the N/O trend decreasing with z is similar to that indicated by Fig. 7 for SFR. The CNO cycle which is responsible for secondary N is a very temperature sensitive process. Reid & Hawley (2005) claim that a self mainaining CNO chain would require high core temperatures (T16106K) and masses M1.5M⊙. They are not predicted at z0.1 by Fig. 8 (left).
5 Concluding remarks
We have calculated the physical conditions and the element abundances of recently observed GRB host galaxies at redshift 1z2.1 by modelling the spectra presented by Palmerio et al (2019) and Hashimoto et al (2018). We have compared them with those found for previously analysed LGRB hosts by Contini (2017 and references therein) on a large redshift range. GRB061007, GRB061121, GRB080605 and GRB090926B spectra were presented by Palmerio et al (2019). We have added the line spectrum of GRB080207 from the sample of Krühler et al and the continuum SED of both GRB080207 and GRB070521 from Hashimoto et al (2018) because they show a rich collection of photometric data. Other samples, such as e.g. that of Vergani et al (2017) could not be used because the spectra do not contain enough data to constrain a detailed modelling. We have found that the physical conditions throughout the hosts and the element abundances are consistent with those found for other hosts in the same redshift range. We have investigated the distribution of SFR throughout the extended redshift range 0.00001z4 adding to the SFR sample collected for LGRB hosts in previous works, the SFR observed in nearby HII regions by Marino et al (2013) and in the low luminosity local HII galaxies by Berg et al (2012). SFR are analysed by the H fluxes. It seems that the log(SFR) trend is quasi-linear with log(z) on a large z range. We suggest that the SFR values presented by Marino et al for HII regions are higher than those given by Berg et al for local HII galaxies at z0.1 because the filling factor is higher in compact HII regions rather than throughout entire galaxies. The merging process of the progenitors could lead to a highly disomogeneous morphological structure of the ISM.
Comparing the SFR trend with that of the N/O abundance ratios, we have found that both decrease for z3. We have checked whether the release of O2 and N2 molecules trapped into the dust grain ice mantles by the exothermic morphological transformations of water ice could explain the N/O ratios calculated throughout the redshift. However, shock velocities 50 completely destroy the ice mantles. The shock velocities calculated by the detailed modelling of the spectra are generally 100 for LGRB hosts and SB galaxies. Therefore, the prevention of secondary N formation for z 1 remains a valid hypothesis to explain the decreasing trend of N/O ratios towards low z.
References
- Angeloni (2010) Angeloni, R., Contini, M., Ciroi, S. & Rafanelli, P., 2010, MNRAS, 402, 2075
- Asplund (2009) Asplund, M., Grevesse, N., Sauval, A.J. & Scott, P., 2009, ARAA, 47, 481
- Bell (1977) Bell, A.R., 1977, MNRAS, 179, 573
- Berg (2012) Berg, D.A. et al., 2012, ApJ, 754, 98
- Brocklehurst (1971) Brocklehurst, M., 1971 MNRAS, 153, 471
- Calzetti (2013) Calzetti, D., 2013seg..book..419C
- Cardelli (1989) Cardelli, J.A., Clayton, G.C., Mathis, J.S. 1989, ApJ, 345, 245
- Castro (2001) Castro-Tirado, A.J. et al., 2001, A&A, 370, 398
- Chiappin (2019) Chiappini, C. et al.2003, MNRAS,339, 63
- Continia (2019) Contini, M., 2019a, MNRAS, 488, 4487
- Continib (2019) Contini, M., 2019b, arXiv:190805157
- Contini (2017) Contini, M., 2017, MNRAS, 469, 3125
- Contini (2016) Contini, M., 2016, MNRAS, 460, 3232
- Cox (1972) Cox, D.P., 1972, ApJ, 178, 143
- Danchi (1994) Danchi W. C., Bester M., Degiacomi C. G., Greenhill L. J. & Townes C. H., 1994, AJ, 107, 1469
- Draine (1994) Draine, B. T. & Lee M. M., 1994 , ApJ , 285 , 89
- Dwek (1998) Dwek, E., 1998 ApJ, 501, 643
- Elbaz (2011) Elbaz, D., Dickinson, M., Hwang, H.S. et al., (2011), A&A, 533, A119
- Ferland (2016) Ferland, G. et al., 2016, arXiv:160308902, The Lexington Benchmarks for Numerical Simulation in Nebulae
- Franceschini (2001) Franceschini, A., Aussel, H., Cesarsky, C.-J., Elbaz, D., & Fadda, D., 2001, A&A, 378, 1
- Fruchter (2006) Fruechter, A.S. et al., 2006, Nature, 441, 463
- Gehrels (2004) Gehrels, N. et al., 2004, 611, 1005
- Graham (2013) Graham, J.F. & Fruechter, A.S., 2013, Nature, 441, 463
- Guidorzia (2007) Guidorzi, C. et al., 2007a , GRB Coordinates Network , 6431
- Guidorzib (2007) Guidorzi, C. , Romano, P., Hill, J., Beardmore, A., Evans, P. A. & Moretti, A., 2007b , GRB Coordinates Network , 6452
- Guseva (2012) Guseva, N.G., Izotov, Y.I., Fricke, K.J. & Henkel, C., 2012, A&A, 534, A84
- Han (2010) Han, X. H., Hammer, F., Liang, Y. C., Flores, H., Rodrigues, M., Hou, J. L. & Wei, J. Y., 2010, A&A, 514, 24
- Hashimoto (2019) Hashimoto, T. et al., 2019, MNRAS, 488, 5024
- Henry (2000) Henry, R.B.C., Edmunds, M.G. & Köppen,J. 2000, ApJ, 541, 660
- Hunt (2011) Hunt, L., Palazzi, E., Rossi, A., Savaglio, S., Cresci, G., Klose, S. Michalowski, M. & Pian, E., 2011, ApJ, 736, L36
- Japelja (2016) Japelj, J., Vergani, S. D., Salvaterra, R., et al., 2016a, A&A, 590, A129
- Japeljb (2016) Japelj, J., Vergani, S. D., Salvaterra, R., Hunt, L. K. & Mannucci, F., 2016b, A&A, 593, A115
- Kennicutt (1998) Kennicutt, R.C. et al., 1998, ARA&A, 36, 198
- Kreckel (2013) Kreckel, K. et al., 2013, ApJ, 771, 62
- Kruler (2015) Krühler, T. et al., 2015 A&A, 581, 125
- Kruler (2012) Krühler, T. et al., 2012 ApJ, 758, 46
- Kruler (2011) Krühler, T., Greiner, J., Schady, P., et al., 2011, A&A, 534, A108
- Lau (2018) Laufer, D., Bar-Nun, A., Ninio-Greenberg, A. 2018, MNRAS, 469, 818
- Lee (2010) Lee, S.-K., Ferguson, H.C., Somerville, R.S., Wiklind, T. & Giavalisco, M., 2010, ApJ, 725, 1644
- Lefloc (2005) Le Floc’h, E., Papovich, C., Dole, H., et al., 2005, ApJ, 632, 169
- Levesq (2010) Levesque, E. M., Berger, E, Kewley, L. J. & Bagley, M. M., 2010, AJ,139,694L
- Magnel (2009) Magnelli, B. et al., 2009, A&A, 496, 57
- Mannucci (2010) Mannucci, F., Cresci, G., Maiolino, R., Marconi, A., Gnerusci, A. 2010, MNRAS, 408, 205
- Margutti (2007) Margutti, R. et al., 2007, A&A, 474, 815
- Marino (2013) Marino, R.A. et al., 2013, A&A, 229, 114
- Meynet (2002) Meynet, G., & Maeder, A. 2002, A&A, 390, 561
- Murphy (2011) Murphy, E.J. et al., 2011, ApJ, 732, 126
- Nicuesa (2015) Nicuesa Guelbenzu A. et al 2015, A&A, 583, A88, NG15
- Niino (2016) Niino, Y. et al., 2016 Publ. Astron. Soc. Japan, 69, 27
- Nozawa (2003) Nozawa, T., Kozasa, T., Umeda, H., Maeda, K., & Nomoto, K., 2003, ApJ, 598, 785
- Osterb (1974) Osterbrock D. E. 1974 , in Astrophysics of Gaseous Nebulae . W.H Freeman and Co . San Francisco
- Palmer (2019) Palmerio, J.T. et al., 2019, A&A, 623, 26
- Perleya (2016) Perley, D.A. , Niino, Y., Tanvir, N.R., Vergani, S.D. & Fynbo, J.P.U., 2016a, ApJ ArXiv:1602.00770
- Perleyb (2016) Perley, D. A., Tanvir, N. R., Hjorth, J., et al. 2016b, ApJ, 817, 8
- Pirano (2015) Piranomonte, S. et al., 2015, MNRAS, 452, 3293
- Racusi (2008) Racusin, J.L. et al., 2008, GRB Coordinates Network, 7264
- Reddy (2012) Reddy, N.A., Dickinson, M., Elbaz, D. et al., 2012, ApJ, 744, 154
- Reid (2005) Reid, N. & Hawley, S. 2005, in ’New Light on Dark Stars, Red Dwarfs, Low Mass Stars and Bursters’ (Springer, 2005)
- Salvat (2012) Salvaterra, B., 2012, ApJ, 749, 68
- Sarg (2009) Sargyan, L.A. & Waldman,W. 2009, ApJ, 701, 1398
- Savagl (2009) Savaglio, S., Glazerbrook, K. & Le Borgne, D., 2009, ApJ, 691, 182
- Savagl (2012) Savaglio, S., Rau, A., Greiner, J., et al., 2012, MNRAS, 420, 627
- Palla (2012) Strahler, S.W. & Palla, F. 2005 in ”The formation of stars”
- Soller (2012) Sollerman J., Östlin G., Fynbo J. P. U., Hjorth J., Fruchter A. & Pedersen K., 2005 New Astron., 11, 103
- Svenss (2012) Svensson, K.M. et al., 2012, MNRAS, 421, 25
- Thilke (2009) Thilker, D.A. et al., 2009, Nature, 457, 990
- Vergan (2011) Vergani, S.D. et al., 2011, A&A, 535, A127
- Vergan (2015) Vergani, S. D., Salvaterra, R., Japelj, J., et al., 2015, A&A, 581, A102
- Vergan (2017) Vergani, S.D. et al., 2017, A&A, 599, A120
- Vincen (2012) Vincenzo, F. et al, arXiv:1603.00460
- Walter (2012) Walter, F. et al., 2012, ApJ, 752, 93
- Wilkin (2011) Wilkins, S.M., Bunker, A.J., Stanway, E., Lorenzoni, S. & Caruana, J., 2011, 391, 363
- Wuyts (2011) Wuyts, S., Förster-Schreiber, N., Lutz, D. et al. 2011, ApJ, 738, 106