THE X-RAY REACTIVATION OF THE RADIO BURSTING MAGNETAR \srclong
Abstract
A few years after its discovery as a magnetar, SGR J1935+2154 started a new burst-active phase on 2020 April 27, accompanied by a large enhancement of its X-ray persistent emission. Radio single bursts were detected during this activation, strengthening the connection between magnetars and fast radio bursts. We report on the X-ray monitoring of SGR J1935+2154 from 3 days prior to 3 weeks after its reactivation, using Swift, NuSTAR, and NICER. We detected X-ray pulsations in the NICER and NuSTAR observations, and constrained the spin period derivative to s s-1 (3 c.l.). The pulse profile showed a variable shape switching between single and double-peaked as a function of time and energy. The pulsed fraction decreased from 34% to 11% (5–10 keV) over 10 days. The X-ray spectrum was well fit by an absorbed blackbody model with temperature decreasing from 1.6 to 0.45–0.6 keV, plus a nonthermal power-law component () observed up to 25 keV with NuSTAR. The 0.3–10 keV X-ray luminosity increased in less than four days from erg s-1 to about 3 erg s-1 and then decreased again to 2.5 erg s-1 over the following three weeks of the outburst, where is the source distance in units of 6.6 kpc. We also detected several X-ray bursts, with properties typical of short magnetar bursts.
… \reportnumAccepted to ApJL
1 Introduction
| InstrumentaaThe instrumental setup is indicated in brackets: PC = photon counting, WT = windowed timing. | Obs.ID | Start | Stop | Exposure | Count RatebbCount rate, computed after removing bursts, in the 0.3–10 keV range for Swift, in the 1–5 keV band for NICER, and in the 3–25 keV range for NuSTAR summing up the two FPMs. | FluxccObserved 0.3–10 keV flux in units of 10-11 erg cm-2 s-1. | ||
|---|---|---|---|---|---|---|---|---|
| YYYY-MM-DD hh:mm:ss (TT) | (ks) | (counts s-1) | (keV) | (km) | (10-11 cgs) | |||
| Swift/XRT (PC) | 00033349044 | 2020-04-23 15:16:16 | 2020-04-23 15:49:27 | 2.0 | 0.0120.002 | – | – | 0.045ddThe flux is estimated using webpimms (see text for details). |
| Swift/XRT (PC) | 00968211001 | 2020-04-27 19:41:56 | 2020-04-27 20:15:09 | 1.8 | 0.370.01 | 1.6 | 0.49 | 5.01 |
| NICER/XTI | 3020560101 | 2020-04-28 00:38:31 | 2020-04-28 16:21:20 | 4.7 | 2.940.04 | 0.800.02 | 1.110.05 | 2.490.12 |
| Swift/XRT (PC) | 00033349045 | 2020-04-28 18:00:36 | 2020-04-28 21:37:41 | 2.9 | 0.0770.005 | 0.61 | 0.99 | 0.60.1 |
| Swift/XRT (WT) | 00033349046 | 2020-04-29 13:07:57 | 2020-04-29 13:32:57 | 1.5 | 0.090.01 | 0.36 | 2.74 | 0.69 |
| NICER/XTI | 3020560102 | 2020-04-29 13:47:17 | 2020-04-29 14:05:20 | 1.1 | 0.960.05 | 0.490.02eeThe blackbody temperature was tied up among these data sets (see text for details). | 1.47 | 0.82 |
| Swift/XRT (PC) | 00033349047 | 2020-04-29 17:54:22 | 2020-04-29 18:27:38 | 2.0 | 0.0720.006 | 0.44 | 2.05 | 0.52 |
| NICER/XTI | 3655010101 | 2020-04-29 21:31:57 | 2020-04-29 21:48:40 | 0.8 | 0.780.04 | 0.490.02eeThe blackbody temperature was tied up among these data sets (see text for details). | 1.88 | 0.400.07 |
| NICER/XTI | 3655010102 | 2020-04-30 00:37:56 | 2020-04-30 07:09:40 | 5.3 | 0.730.02 | 0.490.02eeThe blackbody temperature was tied up among these data sets (see text for details). | 1.73 | 0.40 |
| NICER/XTI | 3020560103 | 2020-04-30 13:02:45 | 2020-04-30 13:17:20 | 0.8 | 0.720.04 | 0.490.02eeThe blackbody temperature was tied up among these data sets (see text for details). | 1.83 | 0.32 |
| Swift/XRT (PC) | 00033349048 | 2020-04-30 05:29:05 | 2020-04-30 18:27:53 | 1.9 | 0.0540.005 | 0.44 | 1.55 | 0.46 |
| Swift/XRT (WT) | 00033349049 | 2020-04-30 07:10:24 | 2020-04-30 11:47:56 | 1.5 | 0.050.01 | 0.40 | 1.84 | 0.570.16 |
| Swift/XRT (PC) | 00033349050 | 2020-05-01 02:03:14 | 2020-05-01 22:42:20 | 2.1 | 0.0560.005 | 0.63 | 0.93 | 0.36 |
| Swift/XRT (WT) | 00033349051 | 2020-05-01 12:58:08 | 2020-05-01 13:20:56 | 1.4 | 0.050.01 | 0.39 | 2.98 | 0.33 |
| NuSTAR FPMA/B | 80602313002 | 2020-05-02 00:06:09 | 2020-05-02 20:31:09 | 37.1/36.9 | 0.1750.003 | 0.59 | 0.85 | 0.320.01 |
| Swift/XRT (WT) | 00033349053 | 2020-05-02 11:50:05 | 2020-05-02 13:28:56 | 0.7 | 0.060.02 | 0.69 | 0.97 | 0.30 |
| Swift/XRT (PC) | 00033349052 | 2020-05-02 16:33:41 | 2020-05-02 23:02:54 | 1.2 | 0.0270.005 | 0.71 | 0.69 | 0.18 |
| Swift/XRT (WT) | 00033349055 | 2020-05-03 12:55:54 | 2020-05-03 13:23:56 | 1.7 | 0.0200.009 | 0.45 | 1.24 | 0.27 |
| Swift/XRT (PC) | 00033349054 | 2020-05-03 22:23:05 | 2020-05-03 22:48:52 | 1.5 | 0.0500.006 | 0.68 | 0.93 | 0.24 |
| Swift/XRT (PC) | 00033349056 | 2020-05-04 01:47:23 | 2020-05-04 18:04:51 | 3.4 | 0.0400.003 | 0.48 | 1.29 | 0.28 |
| Swift/XRT (WT) | 00033349057 | 2020-05-04 12:40:56 | 2020-05-04 13:07:56 | 1.6 | 0.070.01 | 0.66 | 0.85 | 0.53 |
| Swift/XRT (PC) | 00033349058 | 2020-05-05 03:17:19 | 2020-05-05 13:01:52 | 1.9 | 0.0340.004 | 0.53 | 1.15 | 0.15 |
| Swift/XRT (WT) | 00033349059 | 2020-05-05 20:40:09 | 2020-05-05 21:02:56 | 1.4 | 0.050.01 | 0.55 | 1.37 | 0.19 |
| Swift/XRT (PC) | 00033349060 | 2020-05-06 06:36:44 | 2020-05-06 08:20:52 | 1.3 | 0.0310.005 | 0.46 | 1.50 | 0.18 |
| Swift/XRT (PC) | 00033349061 | 2020-05-07 09:30:09 | 2020-05-07 20:56:54 | 3.7 | 0.0350.003 | 0.470.09 | 1.57 | 0.23 |
| Swift/XRT (PC) | 00033349062 | 2020-05-10 04:28:08 | 2020-05-10 22:15:52 | 3.2 | 0.0430.004 | 0.63 | 0.99 | 0.230.11 |
| Swift/XRT (WT) | 00033349063 | 2020-05-10 06:01:43 | 2020-05-10 10:56:56 | 3.2 | 0.0300.007 | 0.510.10 | 1.51 | 0.24 |
| NuSTAR FPMA/B | 80602313004 | 2020-05-10 23:51:09 | 2020-05-11 20:31:09 | 38.5/38.2 | 0.1400.002 | 0.520.04 | 1.03 | 0.270.01 |
| NICER/XTI | 3020560104 | 2020-05-11 14:30:54 | 2020-05-11 16:18:40 | 1.3 | 0.540.04 | 0.490.02eeThe blackbody temperature was tied up among these data sets (see text for details). | 1.70 | 0.160.01 |
| Swift/XRT (WT) | 00033349064 | 2020-05-13 02:22:52 | 2020-05-13 07:29:55 | 1.9 | 0.56ffThese observations were combined to increase the signal-to-noise. | 0.690.10 | 0.95 | 0.17 |
| Swift/XRT (WT) | 00033349065 | 2020-05-13 09:03:52 | 2020-05-13 10:30:56 | 1.3 | 0.56ffThese observations were combined to increase the signal-to-noise. | 0.690.10 | 0.95 | 0.17 |
| Swift/XRT (WT) | 00033349066 | 2020-05-15 00:31:07 | 2020-05-15 03:58:39 | 3.5 | 0.0590.006 | 0.460.07 | 1.70 | 0.24 |
Magnetars are isolated X-ray pulsars with spin periods in the 0.3–12 s range and large spin-down rates, implying particularly strong surface dipolar magnetic fields of the order of –1015 G (see Kaspi & Beloborodov, 2017; Esposito et al., 2018, for recent reviews). These objects have a persistent X-ray luminosity of –1036 erg s-1, which is thought to be powered by the instabilities and decay of their extreme magnetic fields. Among isolated neutron stars, magnetars are the most variable, with an unpredictable bursting activity. They emit short (1 s) and bright ( 1039–1041 erg s-1) bursts in the X-ray band, either sporadically or clustered in “forests” (e.g., Israel et al., 2008; Collazzi et al., 2015). These bursts are often accompanied by an enhancement of the X-ray persistent flux, up to three orders of magnitude above quiescence. Then, the flux usually relaxes back to the pre-outburst level on months/years timescales (Coti Zelati et al., 2018). Recently, magnetar traits have been observed also in high- pulsars (e.g., Gavriil et al., 2008; Archibald et al., 2016), X-ray pulsars with dipolar fields as low as G (e.g., Rea et al., 2010, 2012b), and the central source of the supernova remnant RCW 103 (e.g., Rea et al., 2016; D’Aì et al., 2016; Borghese et al., 2018). These findings have shown how magnetar-like emission might be more common within the neutron star population than previously expected.
SGR J1935+2154 (SGR J1935 hereafter) was discovered in 2014, when the Burst Alert Telescope (BAT) on board of the Neil Gehrels Swift Observatory (Gehrels et al., 2004) triggered on a short burst (Stamatikos et al., 2014). A follow-up campaign confirmed the source as a magnetar with spin period s and spin-down rate s s-1, implying a dipole magnetic field G at the pole and characteristic age kyr (Israel et al., 2016). SGR J1935 has been quite active since then, with intense outbursts in February 2015, May and June 2016 (Younes et al., 2017b), and frequent bursting activity (Lin et al., 2020a).
SGR J1935 reactivated on 2020 April 27–28, emitting a forest of X-ray bursts (e.g., Palmer & BAT Team, 2020; Younes et al., 2020) accompanied by an increase of the persistent X-ray flux, as typical in magnetar outbursts. More interestingly, two millisecond radio bursts temporally coincident with a hard X-ray burst were detected from the direction of the source (The CHIME/FRB Collaboration et al., 2020; Bochenek et al., 2020; Li et al., 2020; Mereghetti et al., 2020; Tavani et al., 2020), strenghtening the long suspected connection between magnetars and fast radio bursts (FRBs; see Cordes & Chatterjee 2019; Petroff et al. 2019 for reviews). However, besides these radio bursts, radio pulsed emission has not been detected so far from the source (e.g., Younes et al., 2017b; Lin et al., 2020b).
This Letter reports on the results of our monitoring campaign of SGR J1935 with Swift, NuSTAR, and NICER, covering the first 20 days since its reactivation. We describe the observations (§2) and report our timing and spectral analysis as well as a search for short bursts (§3). We discuss our findings in §4.
2 Observations and data reduction
We report the log of the observations used in this work in Table 1. Data reduction was performed using tools in the heasoft package (version 6.27.2). Photon arrival times were referred to the solar system barycenter using the source Chandra position (RA = 19h34m55598, Dec = +21∘53′4779, J2000.0; Israel et al. 2016) and the JPL planetary ephemeris DE 200. In the following, we adopt a distance of 6.6 kpc (Zhou et al., 2020, see also Mereghetti et al. 2020) and quote all uncertainties at 1 confidence level (c.l.).
2.1 Swift
After the Swift/BAT trigger, SGR J1935 was monitored almost daily with the Swift/XRT (Burrows et al., 2005) either in photon counting (PC; timing resolution of 2.51 s) or windowed timing (WT; 1.8 ms) modes. The data were reprocessed and analysed with standard prescriptions.
In the first XRT observation performed after the BAT trigger, a dust scattering ring was detected around the source, extending from 1 to 2 arcmin (Kennea et al., 2020; Mereghetti et al., 2020). This structure was no longer observed in a pointing performed the following day (a detailed study of this structure will be presented in a future paper). We collected the source photons from a 20-pixel circle (1 pixel ). Background counts were extracted from a region of the same size for WT data and an annulus with radii of 100 and 150 pixels, centered on the source, for the PC observations.
2.2 NuSTAR
SGR J1935 was observed with NuSTAR (Harrison et al., 2013) twice, on 2020 May 2 and 11. The two focal plane modules FPMA and FPMB observed the source for a total on-source exposure time of 75.6 and 75.1 ks, respectively. We used the tool nupipeline to create cleaned event files and filter out passages through the South Atlantic Anomaly. The source counts were collected within a circular region of radius 100 arcsec, while the background was estimated from a 100-arcsec circle on the same chip of the target. In both pointings, SGR J1935 is detected until 25 keV. We ran the script nuproducts to extract light curves and spectra, and generate response files for both FPMs.
2.3 NICER
NICER (Gendreau et al., 2012) observed SGR J1935 six times for a total on-source exposure time of 14 ks. The data were processed via the nicerdas pipeline, with the tool nicerl2 with standard filtering criteria. The background count rate and spectra were computed from NICER observations of the RXTE blank-field regions using nibackgen3C50.
3 Analysis and results
3.1 Timing Analysis
For the timing analysis, we selected events in the 1–5 keV energy band for NICER and 3–20 keV for NuSTAR. The data sets of NICER observations IDs. 3655010101, 3655010102 and 3020560103 performed on April 29–30 were merged to increase the source signal-to-noise ratio. We did not include Swift/XRT observations in our timing analysis due to their poor counting statistics.
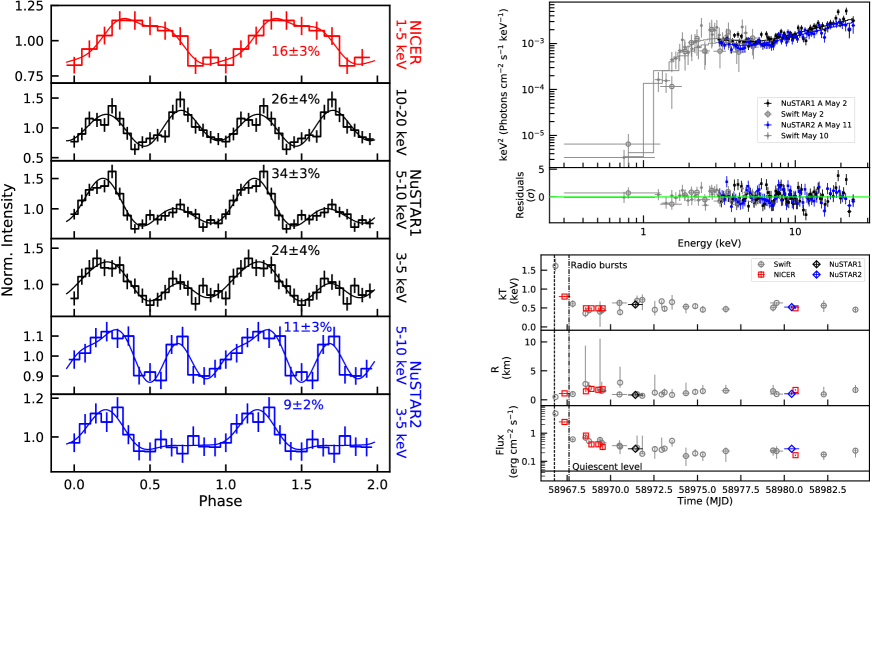
We calculated a power density spectrum (PDS) for all time series to search for the spin signal, assuming a 3.5 detection threshold for the signal (using the algorithm by Israel & Stella 1996), taking into account all the frequencies in the PDS. Pulsations were significantly detected over a blind search only during the first NuSTAR observation. The signal was then found in the second NuSTAR observation and in the NICER combined pointings IDs. 3655010101 3655010102 3020560103 by looking in the range of periods (at 3; the component can be neglected) around the value measured in the first NuSTAR data set. The period values were then refined by means of a phase-fitting technique. We obtained the following results: = 3.24731(1) s for the combined NICER data sets (April 29–30), = 3.247331(3) s for the first NuSTAR observation (May 2) and = 3.24734(1) s for the second NuSTAR observation (May 11). The above uncertainties and the variable pulse profile (see below) did not allow us to phase-connect coherently the NICER and NuSTAR observations. These period measurements imply an upper limit on the spin period derivative of s s-1 (3 c.l.), a factor of about two above the value inferred during the 2014 outburst (Israel et al., 2016).
Fig. 1 shows the pulse profiles at different epochs and as a function of energy. The profile shape varies considerably in time, changing from quasi-sinusoidal on April 29-30 to double-peaked on May 2 and 11 (the separation between the two peaks is about half rotational cycle). The profile shape is also highly variable with energy in the NuSTAR data sets, the second peak (at phase 0.6–0.7) being more prominent above 5 keV and dominating above 10 keV in the first observation.
The background-subtracted pulsed fraction (defined as the semi-amplitude of the sinusoidal functions describing the pulse divided by the source average count rate) decreased by a factor of between May 2 and 11 (in the 3–5 and 5–10 keV ranges; see Fig. 1). No pulsations were detected over the 10–20 keV band in the second NuSTAR observation, and we set a 3 upper limit on the pulsed fraction of 15%.
3.2 Spectral Analysis
The spectral analysis was performed with the xspec fitting package. We adopted the Tbabs model (Wilms et al., 2000) to describe the photoelectric absorption by the interstellar medium. The NuSTAR and NICER background-subtracted spectra were grouped in at least 50 and 20 counts per bin, respectively. The Swift/XRT spectra were grouped according to a minimum number of counts variable from observation to observation. We used the Cash statistic to compute model parameters and their uncertainties.
Fig. 1 shows the spectra extracted from nearly simultaneous NuSTAR and Swift/XRT data. The broad-band spectrum is well described by an absorbed blackbody model plus a power-law component accounting for the emission above 10 keV. The hydrogen column density was held fixed to = cm-2 in the fits, i.e. the value derived by Coti Zelati et al. (2018) (this is compatible with that given by Younes et al. 2017b). For the first epoch (May 2), the best-fitting values are: keV, km, and photon index (C-stat = 160.24 for 146 degrees of freedom, dof). For the second epoch (May 11), we derived keV, km and (C-stat = 112.17/145 dof). The observed fluxes were (6.9 0.1) and 5.9 erg cm-2 s-1 (0.3–25 keV), chronologically, giving luminosities of (4.01 0.08) and (3.46 0.08) erg s-1, where is the source distance in units of 6.6 kpc. At both epochs, the power-law component accounted for 86% of the total observed flux and its luminosity varied from (3.23 0.09) to (2.84 0.07) erg s-1 (0.3–25 keV).
We then fit the same model to the Swift/XRT spectra jointly, and repeated the same procedure for the NICER spectra ( was fixed to the above value). To avoid covariance between the values of the blackbody temperature and normalization due to the limited energy band adopted for NICER spectra (1–5 keV), we tied up the temperature across all data sets except for the first one. Firstly, we allowed the photon index to vary in the fits. However, we could not obtain meaningful constraints on this parameter over the energy range covered by Swift and NICER. We then repeated the analysis by fixing it to , i.e. the value measured using the NuSTAR observations. We obtained C-stat = 134.95 for 111 dof for the Swift data and C-stat = 447.71 for 480 dof for the NICER data.
The blackbody temperature reached a value of keV about 75 min after the first BAT trigger on April 27 at 18:26:20 UT (Palmer & BAT Team, 2020). It decreased to (0.80 0.02) keV in the following day, and attained values in the range 0.45–0.6 keV over the last 10 days of our monitoring (Table 1; Fig. 1). During the first 20 days of this new active phase, the observed flux dropped from to erg cm-2 s-1 (0.3–10 keV; Table 1; Fig. 1). These values translate into a luminosity of and erg s-1 (0.3–10 keV), respectively. An XRT observation performed on April 23 (only 4 days prior to the outburst onset) found SGR J1935 in quiescence with net count rate of counts s-1 (0.3–10 keV), corresponding to an observed flux of erg cm-2 s-1 and a luminosity of erg s-1 (assuming an absorbed blackbody spectrum with keV, cm-2).
3.3 Burst Search and Properties
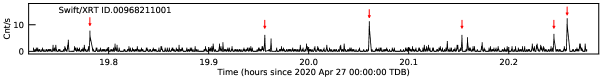
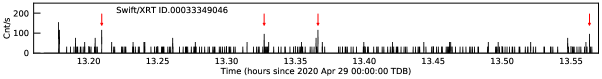
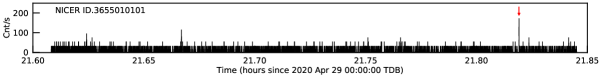
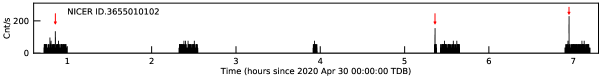
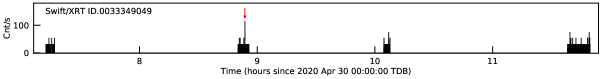
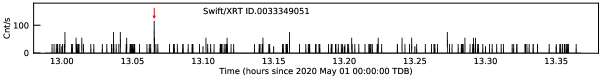
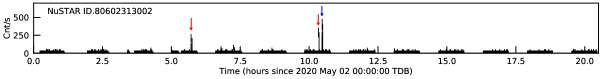
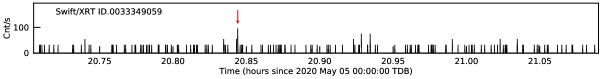
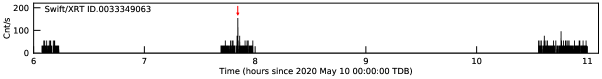
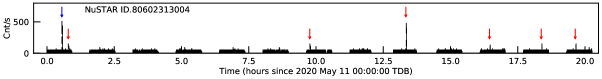
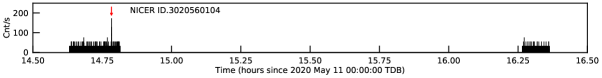
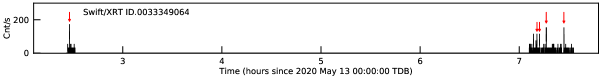
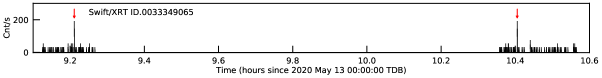
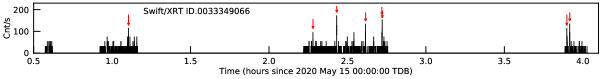
We inspected the light curves of all observations for the presence of short bursts. Our search algorithm estimates the Poisson probability for an event to be a random fluctuation compared to the average number of counts per bin in the full observation, considering the total number of time bins . We applied this algorithm to light curves binned with different time resolutions (2-4, 2-5 and 2-6 s) to be sensitive to bursts of different duration, except for the Swift/XRT PC-mode event files that were binned at the available timing resolution (2.5073 s). Bins having a probability smaller than 10 are identified as bursts ( is the number of different time resolutions adopted for the search). In Table 2, we report the epochs of the bursts referred to the solar system barycenter. Fluence and duration are given for the bursts detected in the NICER and NuSTAR data sets. Their light curves are shown in Fig. 2. We do not report on the 25 short bursts detected in the first NICER observation (Obs. ID 3020560101; see Table 1 of Younes et al. 2020) due to the complex light curve and instrument saturation problems.
We extracted the spectra only for those events with at least 30 net counts, that is, two bursts detected in the NuSTAR observations (80602313002 #3 and 80602313004 #1 in Table 2). We fitted the spectra using single-component models (a power-law, a blackbody and an optically thin thermal bremsstrahlung). The blackbody and power-law model fits gave a satisfactory description for both events with a goodness probability111https://heasarc.gsfc.nasa.gov/xanadu/xspec/manual/node84.html of 55% and 40%, respectively. For the blackbody model, we derived a temperature equivalent to (2.9 0.5) keV for 80602313002 #3 and (3.9 0.7) keV for 80602313004 #1. The corresponding fluxes were (1.0 0.3) 10-8 and (1.8 0.6) 10-8 erg cm-2 s-1 in the 3–79 keV energy range, converting to luminosity of (5.3 1.5) 10 and (9.3 3.1) 10 erg s-1.
4 Discussion
Since its discovery in 2014, the magnetar SGR J1935 has been a prolific source, showing numerous X-ray outbursts and frequent bursting activity. We presented here the results of an intensive X-ray monitoring campaign of this source over about three weeks since the end of April 2020, when it emitted a forest of X-ray bursts, and two bright radio millisecond bursts with characteristics strongly reminiscent of FRBs (The CHIME/FRB Collaboration et al., 2020; Bochenek et al., 2020).
1. Spin period and pulse profiles. We detected the source spin period in the combined NICER data sets acquired on April 29–30, and in both NuSTAR data sets on May 2 and 11. Unfortunately, the spacing between the few detections, and the uncertainties on the periods, prevented us from extracting a phase-connected timing solution. The spin period measurements at the different epochs allowed us to set an upper limit on the period derivative of s s-1 (at 3 c.l.). This limit is compatible with the spin-down rate of s s-1 derived by Israel et al. (2016) in 2014, using a phase-connected timing analysis.
The double-peaked morphology of the NuSTAR pulse profiles is markedly different from the quasi-sinusoidal modulation observed in the NICER observation a few days before and in previous X-ray observations of the source (Israel et al., 2016).
Timing noise and large pulse profile changes (in time and energy) are common during magnetar outbursts (e.g. Dib & Kaspi 2014; Esposito et al. 2018 for a review, and references therein), especially following X-ray bursting activity. The magnetar magnetosphere is subject to rapid changes before setting to a new quiescent configuration, which are responsible for the fast profile variations especially in the hard X-rays, where the emission is dominated by nonthermal photons. These changes might also lead to the formation of new bundles and hot spots on the surface, modifying the pulse profile also in the soft X-ray range.
2. Luminosity, spectral evolution, and bursting activity. About three days before its reactivation, SGR J1935 was observed by Swift/XRT at a luminosity of erg s-1 (0.3–10 keV). Following the source reactivation, the X-ray luminosity reached a peak value of 3.2 10 erg s-1, making this event the most powerful outburst detected from SGR J1935 so far. The luminosity then dropped by more than one order of magnitude, down to 2.5 10 erg s-1 about 3 weeks later. However, this is still a factor 4 larger than the pre-outburst level. A similar rapid decay pattern was also observed for the strong outbursts in May and June 2016 (Younes et al., 2017b) and, overall, is not uncommon for magnetars in outburst (Coti Zelati et al., 2018).
During the entire monitoring, SGR J1935 showed a thermal spectrum in the soft X-rays well described by an absorbed blackbody model quickly cooling from a temperature of 1.6 keV to 0.45–0.6 keV. Emission was detected up to 25 keV in the NuSTAR observations. The spectral shape was identical at the two epochs, and was adequately modelled by a power-law model with index and luminosity erg s-1 (extrapolated to the 10–50 keV energy range). Hard X-ray emission from SGR J1935 was seen also in a NuSTAR pointing performed 5 days after the 2015 outburst onset. In that case, the high-energy spectrum could be described by a slightly harder power-law component ( 0.9) with a lower luminosity, 1 10 erg s-1 (10–50 keV; Younes et al. 2017b). However, the spectral evolution during this last outburst is different from that observed in the previous events, where the luminosity decay could be ascribed to the evolution of the high-energy component (Younes et al., 2017b).
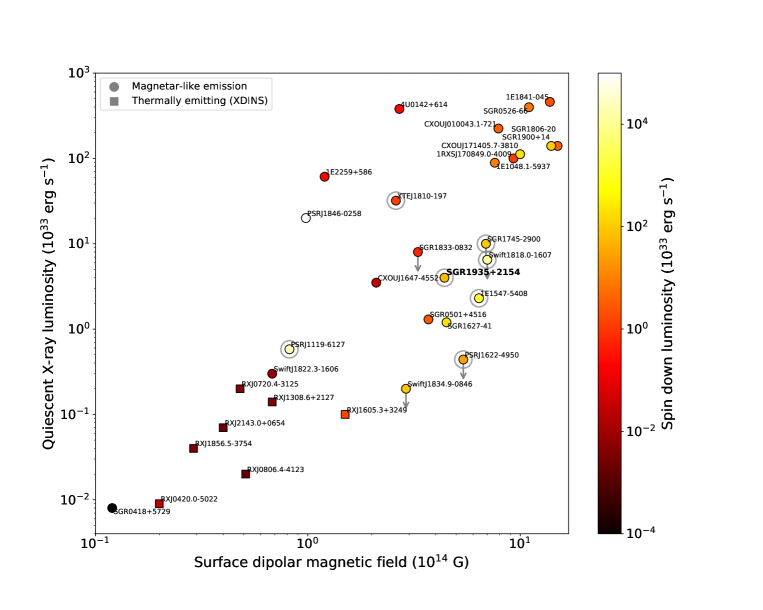
The bursting activity of SGR J1935 during this new outburst is not dissimilar from that previously observed in this and other magnetars. However, such activity is not so prolific in all magnetars, and it is expected to depend on the age of the source and the tangled configuration of its magnetic field (Perna & Pons, 2011; Viganò et al., 2013). A very rough proxy for it is provided by the quiescent X-ray luminosity, which is predicted to be higher in magnetars with a more tangled and powerful magnetic field in the crust, since they are subject to larger crustal currents and -field crustal dissipation (see Fig. 3). A significant anti–correlation between magnetar quiescent luminosities and their luminosity increases in outburst was observed (Pons & Rea, 2012; Coti Zelati et al., 2018), suggesting the existence of a limiting luminosity of erg s-1 for magnetar outbursts (regardless of the source quiescent level), which holds also for the case of SGR J1935.
3. Comparison with other magnetars and FRBs. Comparing the short X-ray bursts and outburst emitted by SGR J1935 with those of the other Galactic magnetars, they are perfectly in line with expectations. There is nothing in the X-ray emission properties of this magnetar that would make it peculiar in any aspect (Coti Zelati et al., 2018). However, the simultaneous detection of radio bursts with a bright magnetar-like burst (The CHIME/FRB Collaboration et al., 2020; Bochenek et al., 2020; Mereghetti et al., 2020) showed for the first time that magnetar bursts might have bright radio counterparts. This result is particularly interesting in the context of the physical interpretation of FRBs, bright ms-duration transients from distant galaxies. Their brightness temperatures imply a coherent radio emission, suggesting a connection with pulsar emission mechanisms. Several repeating FRBs have been discovered (Spitler et al., 2014, 2016), reinforcing their proposed interpretation in terms of young bursting magnetars in other galaxies (e.g., Popov & Postnov 2013; Margalit et al. 2020, and references therein).
Radio pulsed emission was so far restricted to five magnetars (see Fig. 3). Such emission is at variance with the typical radio pulsar emission, and it is always connected to some extent with the magnetar X-ray activation. However, similarly to radio pulsars, all radio-loud magnetars have a large spin-down power compared to their radio-quiet siblings, and quiescent X-ray luminosity below their rotational power (with the exception of XTE J1810197; Rea et al. 2012a; Coti Zelati et al. 2018 and Fig. 3). SGR J1935 has a high rotational power, but so far it did not show any radio pulsations (Younes et al., 2017b; Lin et al., 2020b), while surprisingly emitting radio bursts during the outburst we report here. From the study of the bursting activity of this source, it becomes clear that: 1) not all X-ray magnetar bursts have necessarily a radio counterpart (see also Archibald et al. 2020), and 2) many radio bursts from magnetars might have been missed due to the lack of large field-of-view instruments in the radio band. Hence, it might be a common characteristic after all. Future detections will shed light on these ms-radio bursts, their connection (or not) with faint radio pulsations (i.e. bright single pulses), their preferred X-ray burst counterparts. Population synthesis studies will allow a comparison between their rates and luminosity distributions and those observed in FRBs.
| Instrument | Obs.IDaaThe notation #N corresponds to the burst number in a given observation. | Burst epoch | FluencebbThe fluence refers to the 0.3–10 keV range for NICER/XTI and 3–79 keV for NuSTAR. | DurationccThe duration has to be considered as an approximate value. We estimated it by summing the 15.625-ms time bins showing enhanced emission for the structured bursts, and by setting it equal to the coarser time resolution at which the burst is detected in all the other cases. |
|---|---|---|---|---|
| YYYY-MM-DD hh:mm:ss (TDB) | (counts) | (ms) | ||
| Swift/XRT (PC)ddFluence and maximum durations are not reported for the bursts detected by Swift/XRT owing to uncertainties related to the detector saturation limits. | 00968211001 #1 | 2020-04-27 19:46:52 | – | – |
| #2 | 19:57:22 | – | – | |
| #3 | 20:03:38 | – | – | |
| #4 | 20:09:12 | – | – | |
| #5 | 20:14:42 | – | – | |
| #6 | 20:15:30 | – | – | |
| Swift/XRT (WT)ddFluence and maximum durations are not reported for the bursts detected by Swift/XRT owing to uncertainties related to the detector saturation limits. | 00033349046 #1 | 13:12:34 | – | – |
| #2 | 13:19:38 | – | – | |
| #3 | 13:21:59 | – | – | |
| #4 | 13:33:48 | – | – | |
| NICER/XTI | 3655010101 #1 | 2020-04-29 21:49:09 | 8 | 62.5 |
| NICER/XTI | 3655010102 #1 | 2020-04-30 00:51:27 | 6 | 31.25 |
| #2 | 05:21:38.89 | 7 | 62.5 | |
| #3 | 06:56:59 | 11 | 62.5 | |
| Swift/XRT (WT)ddFluence and maximum durations are not reported for the bursts detected by Swift/XRT owing to uncertainties related to the detector saturation limits. | 00033349049 #1 | 2020-04-30 08:53:44 | – | – |
| Swift/XRT (WT)ddFluence and maximum durations are not reported for the bursts detected by Swift/XRT owing to uncertainties related to the detector saturation limits. | 00033349051 #1 | 2020-05-01 13:03:55 | – | – |
| NuSTAR | 80602313002 #1 | 2020-05-02 05:43:12 | 11 | 31.25 |
| #2 | 10:19:46 | 13 | 31.25 | |
| #3 | 10:27:46 | 46 | 0.125 | |
| Swift/XRT (WT)ddFluence and maximum durations are not reported for the bursts detected by Swift/XRT owing to uncertainties related to the detector saturation limits. | 00033349059 #1 | 2020-05-05 20:50:38 | – | – |
| Swift/XRT (WT)ddFluence and maximum durations are not reported for the bursts detected by Swift/XRT owing to uncertainties related to the detector saturation limits. | 00033349063 #1 | 2020-05-10 07:50:37 | – | – |
| NuSTAR | 80602313004 #1 | 2020-05-11 00:33:00 | 43 | 93.75 |
| #2 | 00:47:14 | 7 | 62.5 | |
| #3 | 09:46:00 | 7 | 62.5 | |
| #4 | 13:20:16 | 25 | 46.875 | |
| #5 | 18:22:15 | 7 | 62.5 | |
| #6 | 19:38:10 | 7 | 62.5 | |
| NICER/XTI | 3020560104 #1 | 2020-05-11 14:47:00 | 8 | 62.5 |
| Swift/XRT (WT)ddFluence and maximum durations are not reported for the bursts detected by Swift/XRT owing to uncertainties related to the detector saturation limits. | 00033349064 #1 | 2020-05-13 02:27:45 | – | – |
| #2 | 07:10:44 | – | – | |
| #3 | 07:12:16 | – | – | |
| #4 | 07:16:22 | – | – | |
| #5 | 07:27:04 | – | – | |
| Swift/XRT (WT)ddFluence and maximum durations are not reported for the bursts detected by Swift/XRT owing to uncertainties related to the detector saturation limits. | 00033349065 #1 | 2020-05-13 09:12:39 | – | |
| #2 | 10:24:18 | – | ||
| Swift/XRT (WT)ddFluence and maximum durations are not reported for the bursts detected by Swift/XRT owing to uncertainties related to the detector saturation limits. | 00033349066 #1 | 2020-05-15 01:06:18 | – | |
| #2 | 02:16:50 | – | – | |
| #3 | 02:25:54 | – | – | |
| #4 | 02:36:56 | – | – | |
| #5 | 02:43:10 | – | – | |
| #6 | 02:43:19 | – | – | |
| #7 | 03:53:54 | – | – | |
| #8 | 03:55:00 | – | – |
References
- Archibald et al. (2016) Archibald, R. F., Kaspi, V. M., Tendulkar, S. P., & Scholz, P. 2016, ApJ, 829, L21
- Archibald et al. (2020) Archibald, R. F., Scholz, P., Kaspi, V. M., Tendulkar, S. P., & Beardmore, A. P. 2020, ApJ, 889, 160
- Arnaud (1996) Arnaud, K. A. 1996, in Astronomical Data Analysis Software and Systems V, Vol. 101, XSPEC: The First Ten Years, ed. G. H. Jacoby & J. Barnes (ASP, San Francisco), 17–20
- Blackburn (1995) Blackburn, J. K. 1995, in Astronomical Data Analysis Software and Systems IV., Vol. 77, FTOOLS: A FITS Data Processing and Analysis Software Package, ed. R. A. Shaw, H. E. Payne, & J. J. E. Hayes (ASP Conf. Ser., San Francisco, CA), 367
- Bochenek et al. (2020) Bochenek, C. D., Ravi, V., Belov, K. V., et al. 2020, arXiv e-prints, arXiv:2005.10828
- Borghese et al. (2018) Borghese, A., Coti Zelati, F., Esposito, P., et al. 2018, MNRAS, 478, 741
- Burrows et al. (2005) Burrows, D. N., Hill, J. E., Nousek, J. A., et al. 2005, Space Science Reviews, 120, 165
- Camilo et al. (2018) Camilo, F., Scholz, P., Serylak, M., et al. 2018, ApJ, 856, 180
- Collazzi et al. (2015) Collazzi, A. C., Kouveliotou, C., van der Horst, A. J., et al. 2015, ApJS, 218, 11
- Cordes & Chatterjee (2019) Cordes, J. M., & Chatterjee, S. 2019, ARA&A, 57, 417
- Coti Zelati et al. (2018) Coti Zelati, F., Rea, N., Pons, J. A., Campana, S., & Esposito, P. 2018, MNRAS, 474, 961
- D’Aì et al. (2016) D’Aì, A., Evans, P. A., Burrows, D. N., et al. 2016, MNRAS, 463, 2394
- Dib & Kaspi (2014) Dib, R., & Kaspi, V. M. 2014, ApJ, 784, 37
- Esposito et al. (2018) Esposito, P., Rea, N., & Israel, G. L. 2018, in Timing Neutron Stars: Pulsations, Oscillations and Explosions, ed. T. Belloni, M. Mendez, & C. Zhang, ASSL, Springer, in press (preprint: astro-ph/1803.05716)
- Esposito et al. (2020) Esposito, P., Rea, N., Borghese, A., et al. 2020, ApJ, 896, L30
- Gavriil et al. (2008) Gavriil, F. P., Gonzalez, M. E., Gotthelf, E. V., et al. 2008, Science, 319, 1802
- Gehrels et al. (2004) Gehrels, N., Chincarini, G., Giommi, P., et al. 2004, ApJ, 611, 1005
- Gendreau et al. (2012) Gendreau, K. C., Arzoumanian, Z., & Okajima, T. 2012, in Society of Photo-Optical Instrumentation Engineers (SPIE) Conference Series, Vol. 8443, Proc. SPIE, 844313
- Harrison et al. (2013) Harrison, F. A., Craig, W. W., Christensen, F. E., et al. 2013, ApJ, 770, 103
- Hunter (2007) Hunter, J. D. 2007, Computing in Science & Engineering, 9, 90
- Israel & Stella (1996) Israel, G. L., & Stella, L. 1996, ApJ, 468, 369
- Israel et al. (2008) Israel, G. L., Romano, P., Mangano, V., et al. 2008, ApJ, 685, 1114
- Israel et al. (2016) Israel, G. L., Esposito, P., Rea, N., et al. 2016, MNRAS, 457, 3448
- Kaspi & Beloborodov (2017) Kaspi, V. M., & Beloborodov, A. M. 2017, ARA&A, 55, 261
- Kennea et al. (2020) Kennea, J. A., Beardmore, A. P., Page, K. L., & Palmer, D. M. 2020, The Astronomer’s Telegram, 13679, 1
- Li et al. (2020) Li, C. K., Lin, L., Xiong, S. L., et al. 2020, arXiv e-prints, arXiv:2005.11071
- Lin et al. (2020a) Lin, L., Göğüş, E., Roberts, O. J., et al. 2020a, ApJ, 893, 156
- Lin et al. (2020b) Lin, L., Zhang, C. F., Wang, P., et al. 2020b, arXiv e-prints, arXiv:2005.11479
- Margalit et al. (2020) Margalit, B., Beniamini, P., Sridhar, N., & Metzger, B. D. 2020, arXiv e-prints, arXiv:2005.05283
- Mereghetti et al. (2020) Mereghetti, S., Savchenko, V., Ferrigno, C., et al. 2020, arXiv e-prints, arXiv:2005.06335
- Palmer & BAT Team (2020) Palmer, D. M., & BAT Team. 2020, GRB Coordinates Network, 27665, 1
- Perna & Pons (2011) Perna, R., & Pons, J. A. 2011, ApJ, 727, L51
- Petroff et al. (2019) Petroff, E., Hessels, J. W. T., & Lorimer, D. R. 2019, A&A Rev., 27, 4
- Pons & Rea (2012) Pons, J. A., & Rea, N. 2012, ApJ, 750, L6
- Popov & Postnov (2013) Popov, S. B., & Postnov, K. A. 2013, arXiv e-prints, arXiv:1307.4924
- Rea et al. (2016) Rea, N., Borghese, A., Esposito, P., et al. 2016, ApJ, 828, L13
- Rea et al. (2012a) Rea, N., Pons, J. A., Torres, D. F., & Turolla, R. 2012a, ApJ, 748, L12
- Rea et al. (2010) Rea, N., Esposito, P., Turolla, R., et al. 2010, Science, 330, 944
- Rea et al. (2012b) Rea, N., Israel, G. L., Esposito, P., et al. 2012b, ApJ, 754, 27
- Spitler et al. (2014) Spitler, L. G., Cordes, J. M., Hessels, J. W. T., et al. 2014, ApJ, 790, 101
- Spitler et al. (2016) Spitler, L. G., Scholz, P., Hessels, J. W. T., et al. 2016, Nature, 531, 202
- Stamatikos et al. (2014) Stamatikos, M., Malesani, D., Page, K. L., & Sakamoto, T. 2014, GRB Coordinates Network, 16520, 1
- Tavani et al. (2020) Tavani, M., Casentini, C., Ursi, A., et al. 2020, arXiv e-prints, arXiv:2005.12164
- The CHIME/FRB Collaboration et al. (2020) The CHIME/FRB Collaboration, :, Andersen, B. C., et al. 2020, arXiv e-prints, arXiv:2005.10324
- van der Walt et al. (2011) van der Walt, S., Colbert, S. C., & Varoquaux, G. 2011, Comput. Sci. Eng., 13, 22
- Viganò et al. (2013) Viganò, D., Rea, N., Pons, J. A., et al. 2013, MNRAS, 434, 123
- Wilms et al. (2000) Wilms, J., Allen, A., & McCray, R. 2000, ApJ, 542, 914
- Younes et al. (2017a) Younes, G., Baring, M. G., Kouveliotou, C., et al. 2017a, ApJ, 851, 17
- Younes et al. (2017b) Younes, G., Kouveliotou, C., Jaodand, A., et al. 2017b, ApJ, 847, 85
- Younes et al. (2020) Younes, G., Baring, M. G., Kouveliotou, C., et al. 2020, arXiv e-prints, arXiv:2006.11358
- Zhou et al. (2020) Zhou, P., Zhou, X., Chen, Y., et al. 2020, arXiv e-prints, arXiv:2005.03517