Ionization: a possible explanation for the difference of mean disk sizes in star-forming regions
Abstract
Context. Surveys of protoplanetary disks in star-forming regions of similar age revealed significant variations in average disk mass in some regions. For instance, disks in the Orion Nebular Cluster (ONC) and Corona Australis (CrA) are on average smaller than disks observed in Lupus, Taurus, Chamaeleon I, or Ophiuchus.
Aims. In contrast to previous models that studied the truncation of disks at a late stage of their evolution, we investigate whether disks may already be born with systematically smaller disk sizes in more massive star-forming regions as a consequence of higher ionization rates.
Methods. Assuming various cosmic-ray ionization rates, we computed the resistivities for ambipolar diffusion and Ohmic dissipation with a chemical network, and performed 2D nonideal magnetohydrodynamical protostellar collapse simulations.
Results. A higher ionization rate leads to stronger magnetic braking, and hence to the formation of smaller disks. Accounting for recent findings that protostars act as forges of cosmic rays and considering only mild attenuation during the collapse phase, we show that a high average cosmic-ray ionization rate in star-forming regions such as the ONC or CrA can explain the detection of smaller disks in these regions.
Conclusions. Our results show that on average, a higher ionization rate leads to the formation of smaller disks. Smaller disks in regions of similar age can therefore be the consequence of different levels of ionization, and may not exclusively be caused by disk truncation through external photoevaporation. We strongly encourage observations that allow measuring the cosmic-ray ionization degrees in different star-forming regions to test our hypothesis.
Key Words.:
magnetohydrodynamics (MHD), protoplanetary disks, stars: low-mass, magnetic fields, surveys, (ISM:) cosmic rays1 Introduction
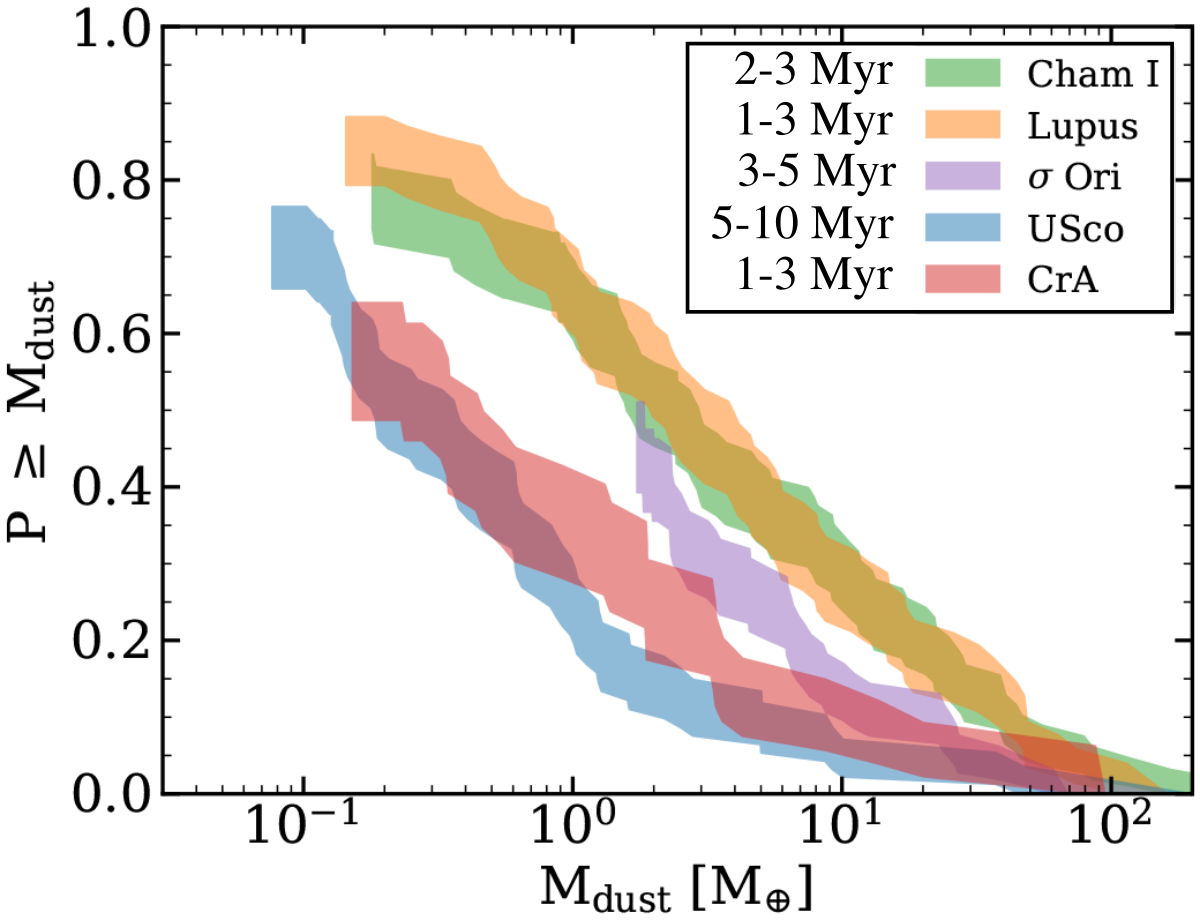
In the past years, surveys of young stellar objects (YSOs) of Class II in several star-forming regions have helped significantly to better constrain the size and mass distribution of disks based on dust continuum observations. A comparison of the obtained average disk sizes and disk masses of the surveys shows significant differences. There seems to be a trend that disks in older star-forming regions are typically smaller than disks in younger star-forming regions. The oldest star-forming region for which dust masses of disks were obtained is Upper Sco (Barenfeld et al., 2016) with an age of 5 – 10 Myr. The average dust mass is M♁. This is significantly lower than the dust masses of disks derived for younger star-forming regions of age 1 – 3 Myr, such as Lupus (Ansdell et al., 2016), Chamaeleon I (Pascucci et al., 2016), and Taurus (Long et al., 2018), where the average dust content is derived to be more than 10 M♁. All of the above dust masses were computed using the same method and assumptions (see table 4 in Cazzoletti et al., 2019), which allows a fair comparison of the obtained masses. The age of the -Orionis region is 3 – 5 Myr (Oliveira et al., 2002, 2004), and hence older than the young star-forming regions Lupus, Chamaeleon I, Ophiuchus, and Taurus, but younger than Upper Sco. Ansdell et al. (2017) determined the average mass in -Orionis to be M♁, which is lower than for the young regions, but higher than for the older region Upper Sco. In agreement with this trend, the dust mass of Class II disks is about five times lower than the dust mass of Class I objects in Ophiuchus, as shown by Williams et al. (2019), who compared the results of the sample of fainter (and generally more evolved star-disk systems) with the previous sample of brighter disks (Cieza et al., 2019). Similarly, the dust masses in the Myr old Orion Molecular Cloud 2 (OMC-2) are similar to the dust masses measured for Lupus and Taurus, which have similar ages (van Terwisga et al., 2019). This correlation of decreasing dust mass with increasing age is consistent with the theory of a radial drift of dust grains in gaseous disks (Whipple, 1972; Weidenschilling, 1977; Birnstiel et al., 2010).
However, not all of the observations are consistent with an age- correlation. Eisner et al. (2018) reported significantly lower average disk masses for the 1 Myr old star-forming region Orion Nebula Cluster (ONC) (Prosser et al., 1994; Hillenbrand, 1997) compared to disks of similar ages in star-forming regions of lower density. Consistent with the lower dust mass, Eisner et al. (2018) also measured a significantly smaller average disk radius in the ONC than in Chamaeleon I (Pascucci et al., 2016), Taurus, Ophiuchus (Tripathi et al., 2017), Lupus (Tazzari et al., 2017), and Upper Sco (Barenfeld et al., 2017). Similar to the ONC, Cazzoletti et al. (2019) measured an average dust mass of disks in Corona Australis (CrA) of M⊙, which is similar to that of Upper Sco (for a comparison of the dust mass distributions of disks in Chamaeleon I, Lupus, -Orionis, Upper Sco, and CrA, see Fig. 1, which is adopted from Cazzoletti et al. (2019)). However, the age of CrA is – 3 Myr and hence similar to the ages of Taurus or Ophiuchus, which have much larger and more massive disks. Another region with a low average dust mass of disks ( M⊙), but a young age (2 – 3 Myr) is IC348 (Ruíz-Rodríguez et al., 2018). While the presence of lower disk masses in older regions can be explained by radial drift and growth of dust grains, the lower average dust mass of disks in these young regions must have another cause.
One mechanism leading to smaller disk sizes is disk truncation through tidal interactions with other stars in the star-forming region (Clarke & Pringle, 1993; Ostriker, 1994; Pfalzner et al., 2005). However, recent simulations have shown that the densities in the considered star-forming regions are too low for frequent and hence efficient disk truncation through tidal stripping (Winter et al., 2018a).
Another possible mechanism for disk truncation is external photoevaporation by background radiation (Störzer & Hollenbach, 1999; Armitage, 2000; Adams, 2010; Facchini et al., 2016; Haworth et al., 2018). Winter et al. (2018b) compared the effect of tidal stripping with external photoevaporation on protoplanetary disk dispersal. They found that the effect of external photoevaporation generally exceeds the effects from tidal interaction, which makes photoevaporation a more likely candidate for mass loss in disks. Eisner et al. (2018) suggested that the massive Trapezium stars associated with the region might be the necessary sources for enhanced external photoevaporation. Moreover, -Orionis hosts the massive Herbig star O9V, and the disk sizes correlate with the distance from this Herbig star as shown in observations with Herschel (Maucó et al., 2016) and the Atacama Large (sub-)Millimeter Array (ALMA) (Ansdell et al., 2017). Therefore, the low disk masses and small disk sizes in -Orionis might be caused by the Herbig star O9V. van Terwisga et al. (2020) detected two distinct disk populations in NGC 2024 with different mean dust masses. The eastern population hosts more massive disks that are presumably younger than the disks in the western population. The authors interpreted the lower disk masses in the western population as a consequence of both age and enhanced external photoevaporation from IRS 2b and IRS 1 as a result of the lower extinction in the west. van Terwisga et al. (2020) also pointed out that the disks in the western population might have already formed with systematically smaller sizes, as suggested for the disks in the star-forming regions Ophiuchus (Williams et al., 2019) and CrA (Cazzoletti et al., 2019). In particular, CrA hosts a massive star, R CrA, but in contrast to O9V in -Orionis, there is no correlation between disk mass and distance from R CrA.
Unlike cosmic rays, ultraviolet photons are likely screened soon after leaving the emitting source because of the high extinction within molecular clouds. Therefore, external photoevaporation is likely not the only mechanism causing smaller disk masses and sizes in young star-forming regions.
A possible explanation for smaller disks and thereby lower disk masses might be the overabundance of low-mass stars in the considered region compared to other regions because the disk mass correlates with stellar mass (Pascucci et al., 2016; Ansdell et al., 2017). This - is a likely explanation for the observation of lower disk masses in IC 348 (Ruíz-Rodríguez et al., 2018). Cazzoletti et al. (2019) accounted for possible biases in their CrA survey and ruled out that the lower disk masses observed in CrA are caused by the - correlation. This means that the smaller disk sizes must have another explanation.
Surveys of YSO Class 0 and Class I objects show that disks already form early during the star formation process from material falling onto the star-disk system from the surrounding envelope (Jørgensen et al., 2009; Segura-Cox et al., 2018; Tychoniec et al., 2018; Andersen et al., 2019). Disks may therefore already be born with systematic deviations depending on the conditions in the star-forming region. In this paper, we suggest that at least part of the lower disk masses obtained in recent surveys of Class II objects are a consequence of a higher ionization rate in the star-forming regions with smaller disks. Instead of considering a scenario in which the disks are truncated after their formation, such as it is the case for tidal stripping or external photoevaporation, we suggest that the disks were already born small as a result of stronger magnetic braking. It is known from theory that magnetic fields can reduce the sizes of disks significantly or even suppress their formation altogether under idealized conditions (the so-called magnetic braking catastrophe; Lüst & Schlüter, 1955; Mestel & Spitzer, 1956; Mellon & Li, 2008). The Continuum And Line Young ProtoStellar Object (CALYPSO) survey of Class 0 disks by Maury et al. (2019) suggests that magnetic braking efficiently prevents the formation of large disks during the protostellar collapse phase.
Today, we know that multiple effects such as turbulence (Seifried et al., 2012, 2013; Joos et al., 2013; Kuffmeier et al., 2017), misalignment of angular momentum and magnetic field vector (Joos et al., 2012; Krumholz et al., 2013; Gray et al., 2018), and/or nonideal magnetohydrodynamical (MHD) effects (Mellon & Li, 2009; Machida & Matsumoto, 2011; Machida et al., 2011; Tsukamoto et al., 2015; Masson et al., 2016; Wurster et al., 2019) can circumvent the magnetic braking catastrophe. In this study, we show in consistence with previous models (Wurster et al., 2018b) that for higher ionization rates, magnetic braking is more efficient and leads to lower disk masses. In other words, nonideal MHD effects, in particular ambipolar diffusion, lead to larger disks for lower ionization rates because magnetic braking depends on the ionization fraction of the gas (Zhao et al., 2016). Considering that the size of the gaseous disk also determines the size of the dusty disk, we therefore suggest that regions with disks of lower mass, such as the ONC, IC 348, and in particular CrA, are a result of a higher average ionization rate in these regions than in regions with larger disks of similar age.
We structure the paper as follows. In section 2 we show the effect of the cosmic-ray ionization rate on resistivities and thereby on the disk size. In section 3 we discuss the results in the context of the observed surveys. In section 4 we conclude and discuss how our scenario may be tested in future observations.
2 Methods
The different nonideal MHD effects depend on multiple physical properties such as density, temperature, chemical abundance, and magnetization. Zhao et al. (2016) developed a chemical network that allows for computing resistivities (ambibolar diffusion , Ohmic dissipation , and Hall effect ) for the different physical properties during the collapse phase. We computed the resisitivities using their network to discuss the effect of the cosmic-ray ionization rate on the nonideal MHD resistivities.
To test the effect of a varying ionization rate on the formation of protostellar disks, we ran 2D simulations with the MHD code zeustw (Krasnopolsky et al., 2010) using a spherical grid analogous to the work presented by Zhao et al. (2016). The simulations account for self-gravity, assume the gas to be isothermal below a critical density of , and assume a scaling of thermal pressure with density of for densities above . We carried out 20 simulations assuming a cosmic-ray ionization rate of , , , , and for four combinations of initial rotation and magnetization. The end of each simulation was at about 20 kyr after the formation of the central star.
Our initial condition was a uniform, isolated core with total mass and a radius of . The initial mass density therefore was under the assumption of a molecular weight of . We started with a solid-body rotation of the core with an angular speed of or , which corresponds to a ratio of rotational to gravitational energy of or (Goodman et al., 1993). For simplicity, we considered alignment of the magnetic field with the angular momentum vector and started with a uniform magnetic field of or , corresponding to a dimensionless mass-to-flux ratio of or . This level of magnetization is consistent with measurements of the Zeeman splitting of OH (Troland & Crutcher, 2008). To compute the resistivities, we used the MRN (Mathis-Rumpl-Nordsieck Mathis et al., 1977) grain size distribution with a fixed power-law index between the minimum grain size of and the maximum grain size of (Zhao et al., 2016),
| (1) |
where is the grain size and is the grain number density.
We assumed outflow boundary conditions at the inner boundary of our domain at radius and at the outer boundary (). Mass flowing into the inner boundary region was collected at the center to represent the growing star. Our 2D grid (,) consisted of grid points. The grid was uniform in direction and nonuniform in -direction. We logarithmically increased the spacing in -direction outward by a constant factor of with a spacing of next to the inner boundary.
3 Ionization, nonideal MHD, magnetic braking, and disk radii
Figure 2 shows the resistivities in dependence of densities computed with the chemical network developed by Zhao et al. (2016). The resistivities were computed for a magnetic field strength that depends on the hydrogen density as (Nakano et al., 2002; Li et al., 2011). The temperature was computed with the broken power law introduced by Zhao et al. (2018) to mimic the results obtained by Tomida et al. (2013) in radiative transfer simulations:
| (2) |
with mass density , temperature , and . We computed the resistivities corresponding to Ohmic dissipation , the Hall effect , and ambipolar diffusion for cosmic-ray ionization rates of s-1 (dashed lines), s-1 (solid lines), and s-1 (dash-dotted lines). The plot illustrates the high variability of the resistivities and shows that different resistive effects dominate at different densities.
Ohmic dissipation dominates at densities cm-3 for this particular grain size distribution. This means that Ohmic dissipation is important at the high densities that are present during the adiabatic phase of the protostar and second core formation (e.g., Tomida et al., 2015; Vaytet et al., 2018), and it also affects the properties in the midplane of the inner disk (e.g., Gressel et al., 2015; Bai, 2016). In contrast, Ohmic dissipation does not affect the processes beyond au from the star significantly. For lower densities, and are the dominating resistivities.
Consistent with theoretical analysis (Hennebelle et al., 2016), comparison runs with and without ambipolar diffusion suggest a significant effect of ambipolar diffusion, leading to a plateau value of G for densities in the range of g cm-3 to about g cm-3. The effect is reduced magnetic braking and hence enhanced disk formation (see the core collapse simulation by Masson et al., 2016).
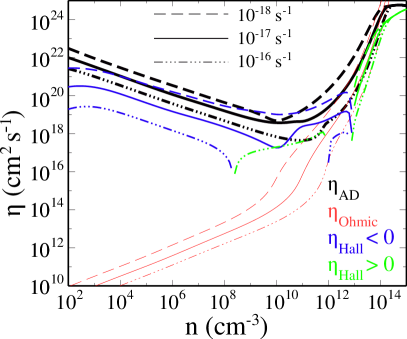
The effect of is the least studied effect of the three resistivities. In contrast to Ohmic dissipation and ambipolar diffusion, the Hall effect depends on the orientation of the magnetic field axis with respect to the orientation of the rotational axis. In the case of anti-alignment, the Hall effect can potentially increases the rotation of the disk and the resulting disk size, whereas alignment of the two axes can lead to stronger magnetic braking and hence smaller disk sizes (Tsukamoto et al., 2015; Marchand et al., 2018). In this study, we only consider ambipolar and Ohmic resistivities and neglect the Hall effect.
Fig. 2 shows that the cosmic-ray ionization rates strongly affect the resisitivities in a nonlinear way, with higher ionization rates corresponding to significantly lower resitivities. Cosmic rays are considered as the main source for ionizing dense clouds, and although variations of the ionization rate caused by focusing and mirroring at high densities of protostellar collapse have been studied and discussed (Padovani & Galli, 2011; Silsbee et al., 2018), assuming a canonical rate of s-1 is common practice in running nonideal MHD simulations (cf. Tomida et al., 2015; Vaytet et al., 2018). This value is often introduced as an overestimate with the argument that the inner parts of the collapse are efficiently shielded from cosmic rays and that 26Al becomes the main source of ionization in the inner part, causing an ionization rate of only s-1 (Umebayashi & Nakano, 2009). However, observations of dense cores show a wide scatter of cosmic-ray ionization rates in the range of s-1 and s-1 , with a mean value around s-1 to s-1 (see Figure 15 in Padovani et al., 2009, with data from Caselli et al. (1998)). Moreover, more recent observations have reported ionization rates of s-1 in the protostellar shock L1157-B1 (Podio et al., 2014) or even higher rates ( s-1) around the young protostar OMC-2 FIR 4 (Ceccarelli et al., 2014; Fontani et al., 2017; Favre et al., 2018). These energetic particles produced by the young protostars could increase the ionization rate in the surrounding cloud, affecting the dynamical evolution of contracting dense cores embedded in the irradiated region.
3.1 Disk size dependence on cosmic-ray ionization rate
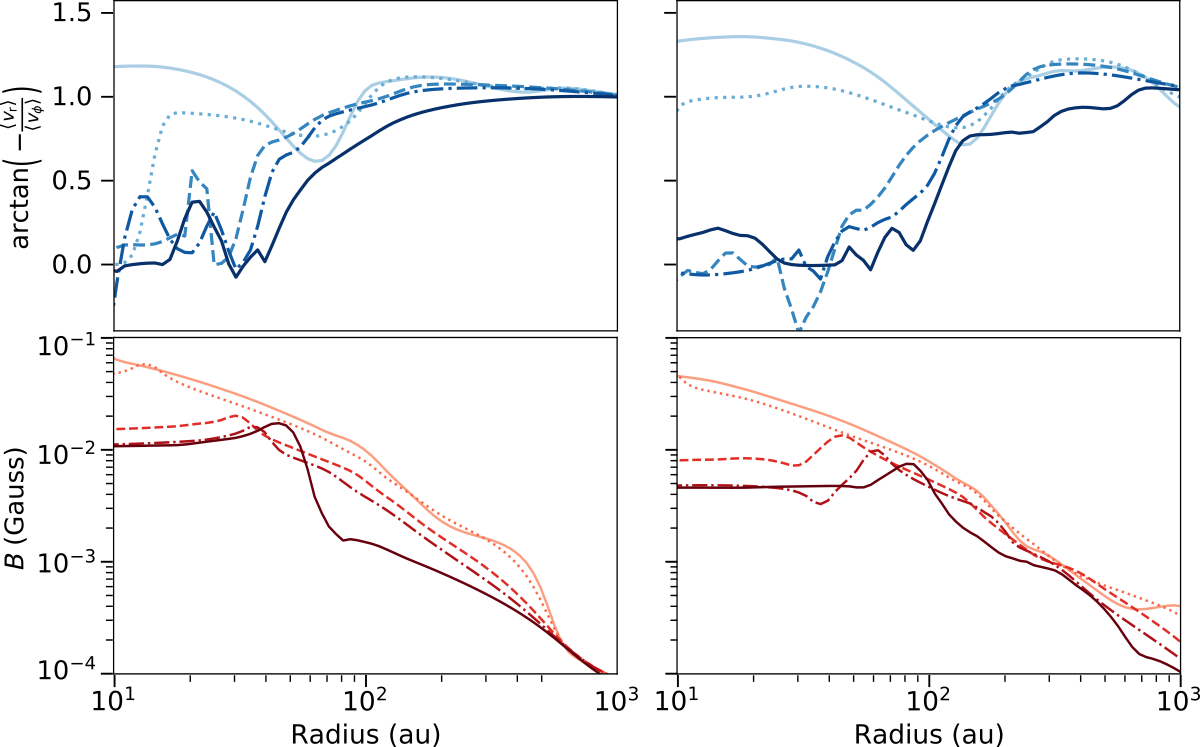
The upper panel in Fig. 3 shows the averaged radial profiles of the radial and azimuthal velocities and displayed as for the combination of and for five ionization rates (, , , , and ) 11 kyr apart in time. corresponds to pure infall, means pure rotation, and is pure outflow. The darker the line in the plot, the lower the ionization rate. For decreasing ionization rates, the plot shows a trend to lower values of , that is, the gas predominantly rotates for low ionization rates, while it predominantly infalls for high ionization rates. The trend toward a rotationally dominated profile for decreasing ionization rates correlates with a decrease in magnetic field strength, as illustrated in the lower panels of Fig. 3. In other words, the increasing resistivity for decreasing ionization rates weakens the transport of angular momentum and hence promotes the formation of rotating structures such as disks. As demonstrated in Zhao et al. (2016), the rotational velocity profile is consistent with Keplerian rotation, corresponding to the accumulated mass of and around the forming protostar at the center.
When we compare the different times with each other, the plot shows a trend: for the highest ionization rates we considered ( and ), the gas becomes even more dominated by infall, while for the lower ionization rates, the radial extent of the rotationally dominated region grows over time. Again, the lower panels show that this can be directly attributed to the magnetic field strength, which establishes a characteristic plateau (Hennebelle et al., 2016; Masson et al., 2016), but not for the two cases with the highest ionization.
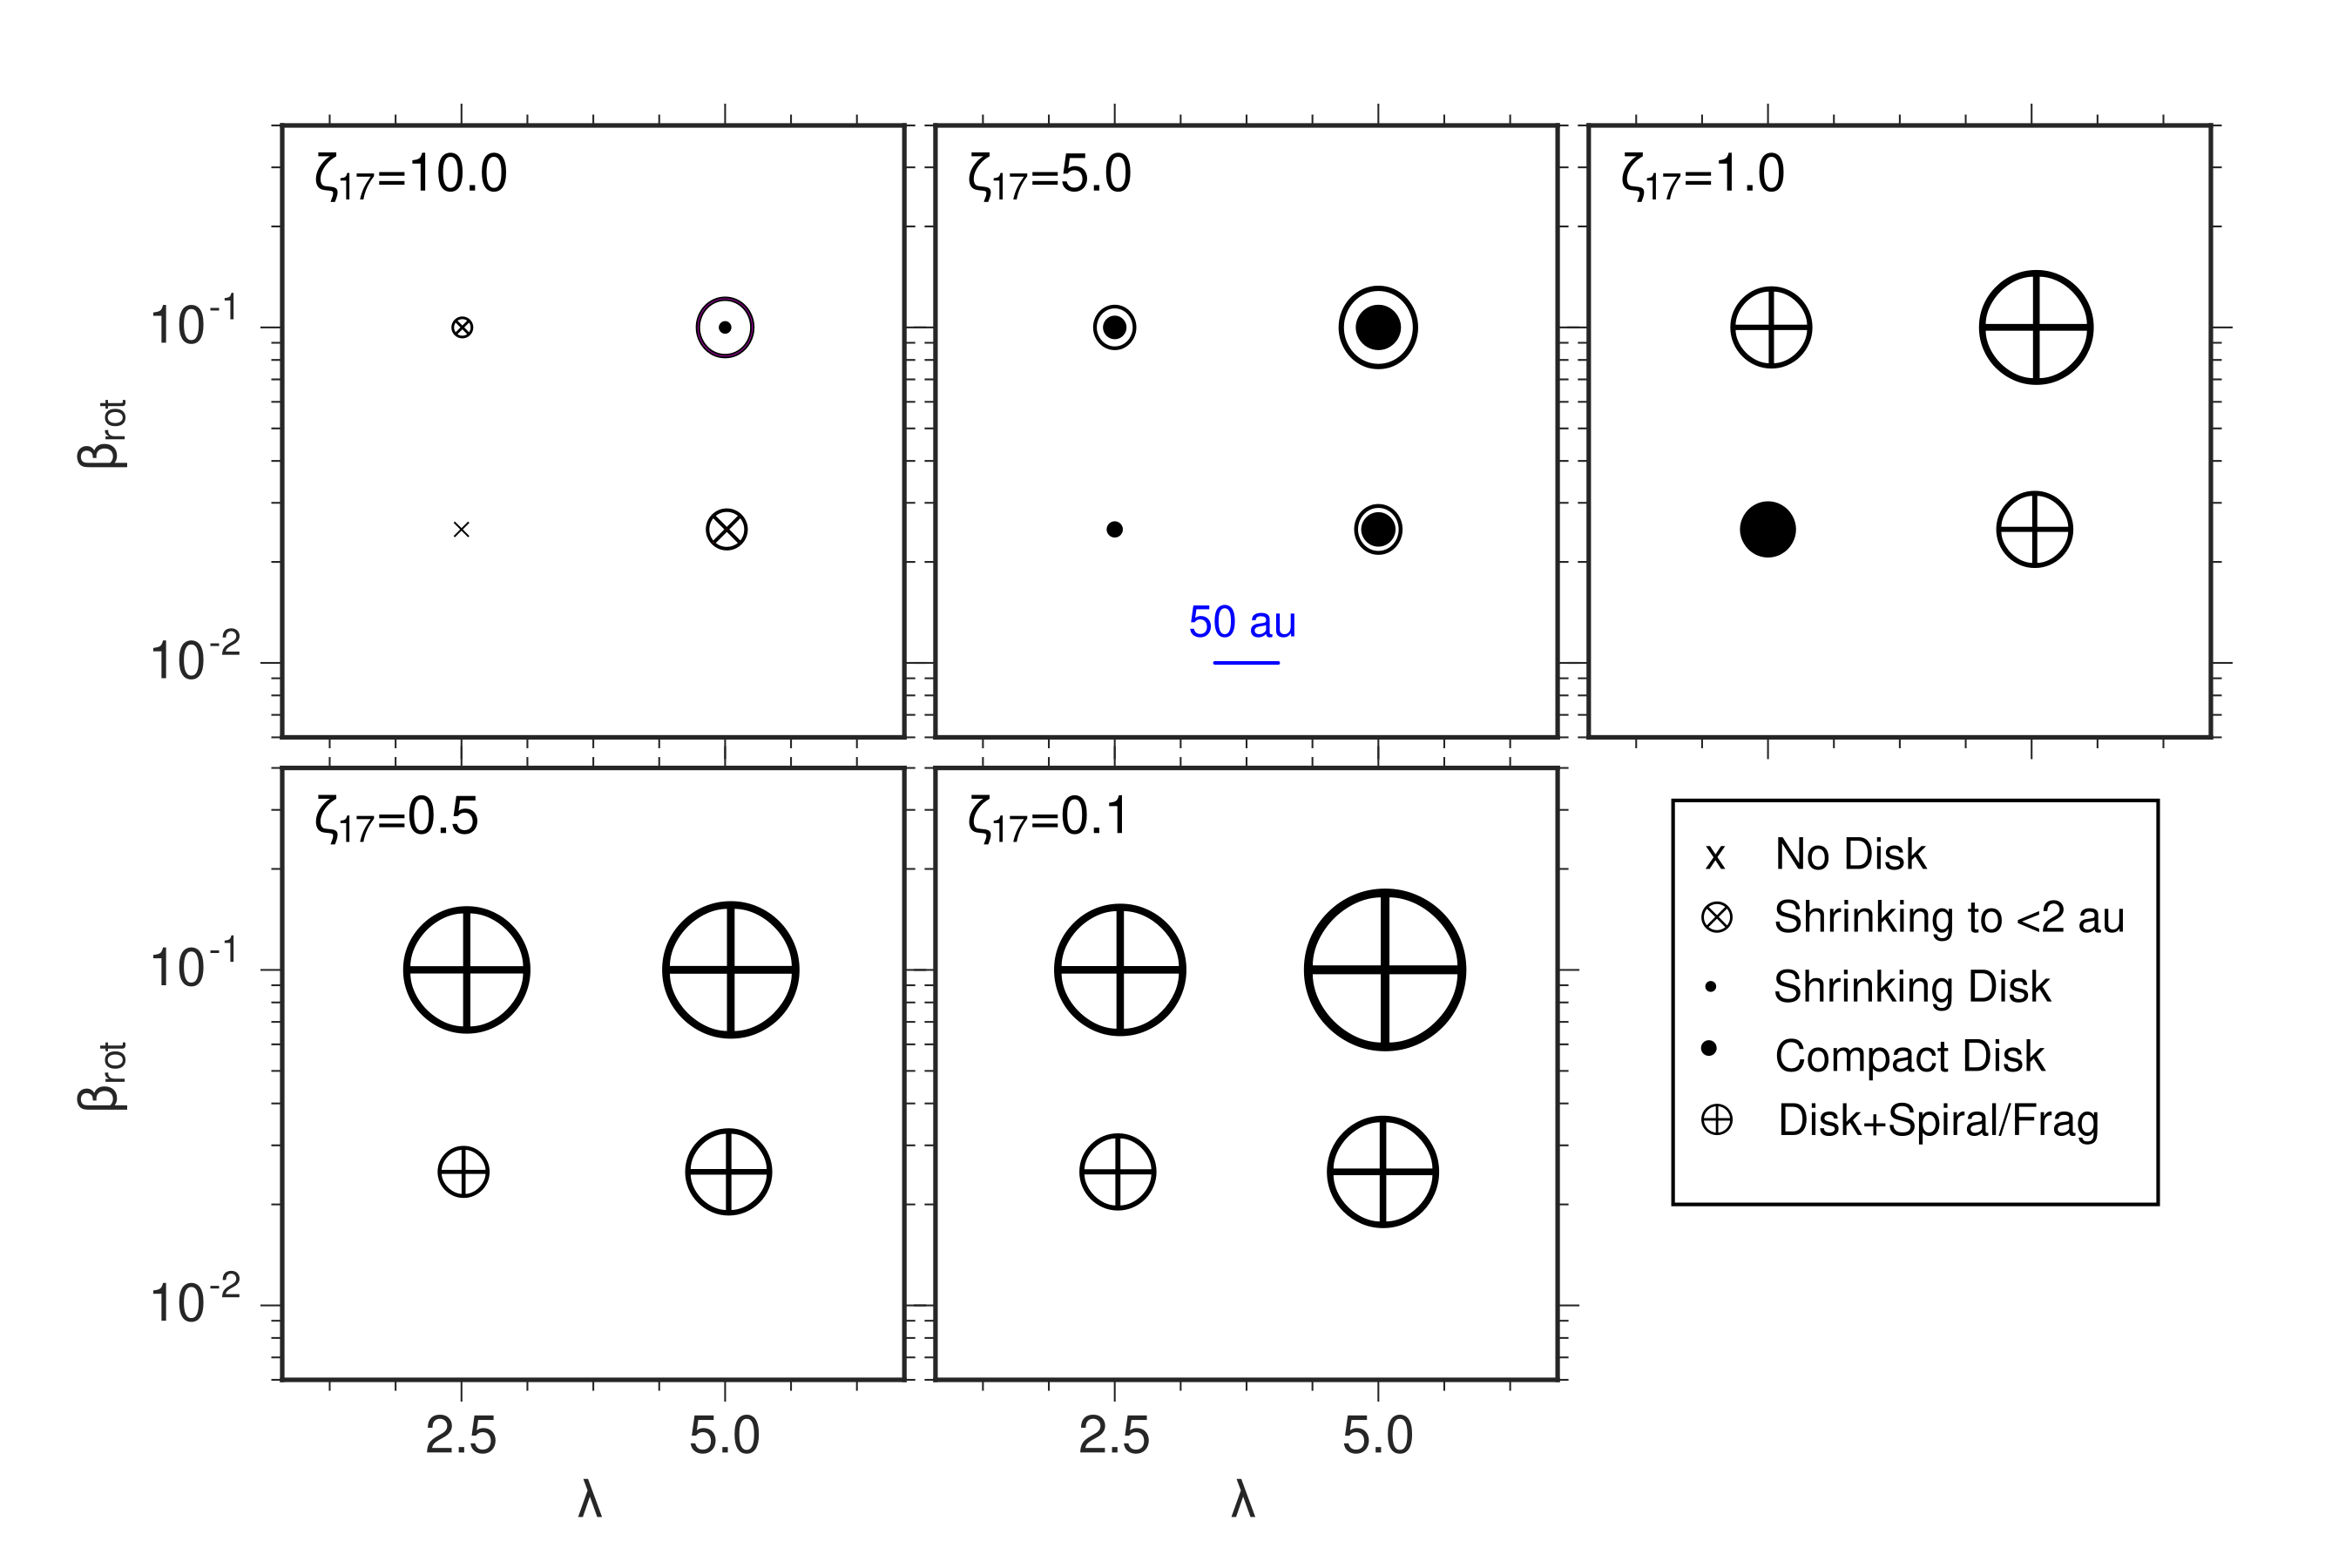
To summarize the results in a comprehensive form, the five plots in Fig. 4 display the rotational properties for varying ionization rates of , , , , and at ) of each simulation. Each plot shows the properties for four combinations of initial rotation or and mass-to-flux ratio or at a fixed ionization rate. The symbols indicate the characteristics of the rotational profile, including the size and evolution of the disk during the simulation.
Gas belongs to the disk when the density , the radial velocity component , and the vertical velocity components are lower than 50 of the azimuthal velocity ( and ). Because we only carried out 2D simulations, what we refer to as a disk may in reality be more spiral in structure in 3D simulations (see Zhao et al., 2018).
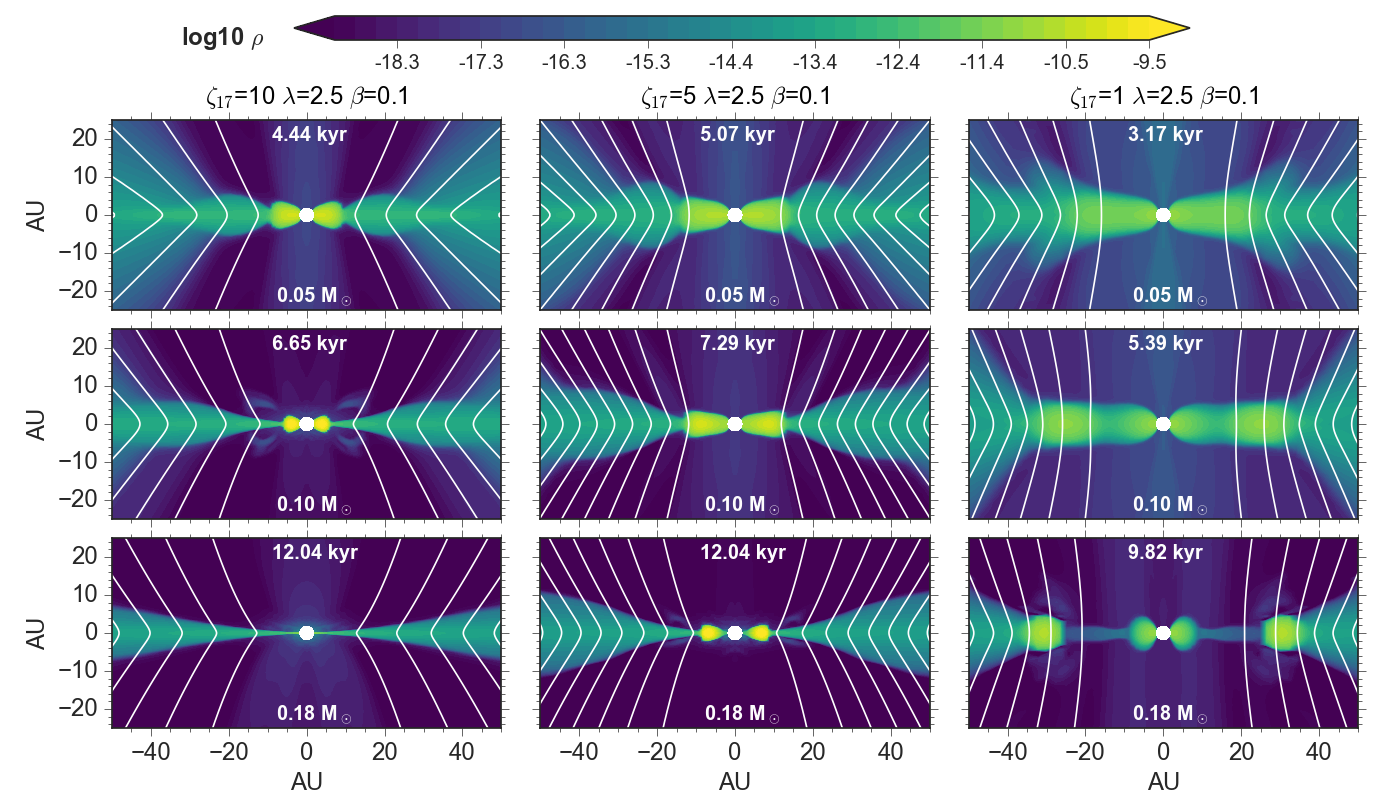
To illustrate the formation process in the plane of the 2D model for different levels of ionization, we show in Fig. 5 the density distribution for identical initial rotation and magnetization , but varying ionization rates of (left panels), (middle panels), and (right panels). The figure shows the density distribution, when the total mass of the star and the disk has reached a total mass of M⊙, M⊙ , and M⊙. For the lowest ionization rate of shown in Fig. 5, the final mass of M⊙ is reached earlier at than in the cases of higher ionization () because magnetic pressure support is less efficient. In addition, the plots show that for higher ionization levels, the size of the disk shrinks over time. In the case of (left panels), the disk even disappears altogether by the end of the simulation. The density distribution corresponding to the canonical ionization rate of (right panels) show a larger rotating structure more than au in radius. This larger rotational structure would likely correspond to the formation of a spiral structure in a 3D simulation instead of marking the radial extent of a smooth Keplerian disk (see the discussion in Zhao et al., 2018) 111We refer to Zhao et al. (2016), who presented an extensive analysis of other physical properties in the 2D setup for a given cosmic-ray ionization rate () and discussed the limitations of the model. Here, the 2D models serve as a proof of concept, demonstrating the effect of differences in the ionization rate. They are not used as a detailed study of disk properties. . A protostellar companion might form in the spiral in a 3D simulation. Likewise, as spiral arms can transport angular momentum outward, the increase in angular momentum at larger radii might lead to an expansion of the disk in radius. In any case, even if the actual disks are smaller than the radial extent of the spirals, Fig. 3 and Fig. 4 show a clear correlation: a decreasing level of ionization corresponds to the formation of larger rotationally supported disks.
3.2 Variation in initial magnetization and rotation
In addition to variations in cosmic-ray ionization rate, other parameters are also important for disk formation. Under the premise of an isolated collapsing core, we investigated the two most prominent effects for different cosmic-ray ionization rates using the previous model setup: the amount of angular momentum, and the initial magnetic field strength. In the runs displayed in Fig. 5, the initial mass-to-flux ratio is and the initial rotation of the core is set to . For comparison, we carried out simulations for the five ionization rates with the following combinations of and : and , and , and and .
Figure 4 shows that the correlation between decreasing ionization rate and increasing disk size is a robust result for any given combination of rotation and mass-to-flux ratio . Consistent with previous results by Zhao et al. (2016), the largest disks form for the combination of high mass-to-flux ratio and high initial rotation for the collapsing core at a given ionization rate (see Fig. 4). The plot also illustrates that a different ionization rate can lead to disks of similar size if the initial rotation or magnetization of the cloud differs as well. For instance, the radial extent of the disk-spiral structure is similar for with , to the case of lower ionization rate , but lower initial rotation . Nevertheless, the results demonstrate the important effect of the ionization rate on the disk size. In the case of the highest ionization rates , even for the most favorable scenario of a maximum initial rotation and minimum magnetization , the disk has a size of 20 au at most, and shrinks as a consequence of continuous magnetic braking to less than 4 au by the end of the simulation. In contrast, in the case of the lowest ionization rate , a disk-spiral structure of 20 to 30 au forms and the disk-spiral structure tends to grow further by the end of the simulation even for the least favorable combination of low initial rotation and high magnetization .
3.3 Comparison with other studies
Wurster et al. (2018b) conducted a similar parameter study of the core-collapse scenario up to densities of about g cm-3 . They computed the equations of nonideal MHD as based on different ionization rates and compared their results with the ideal MHD case. For rates down to s-1, the magnetic energy only differs by at most and the maximum magnetic field strength differs only up to at densities g cm-3. When rates of s-1 are considered, the properties of maximum density, magnetic energy, and maximum magnetic field strength differ by less than 1 compared to the ideal MHD case. We suggest that cosmic-ray ionization rates higher than the canonical value of s-1 might be more realistic in many disk-forming regions. The canonical value originally stems from an early estimate of the minimum cosmic-ray ionization on Earth (Spitzer & Tomasko, 1968). Based on the suggestion and model presented in Padovani et al. (2016), Gaches & Offner (2018) recently demonstrated that protostellar accretion shocks may accelerate cosmic rays, which results in cosmic-ray ionization rates of s-1 to s-1 at the shock surface and induces higher ionization rates of s-1 within the natal cloud of protoclusters. Offner et al. (2019) even found cosmic-ray ionization rates of s-1 on the disk surface. However, these high ionization rates of the disk surface occur already after the disk has formed, and therefore the ionization rate during the protostellar collapse is therefore essential for determining the disk size. The missing bimodality in the distribution of disk radii may indicate that is lower than , consistent with Fig. 2, and the Hall effect therefore only modestly affects the disk (see results for s-1 in Wurster et al., 2018a).
Considering later stages of disk evolution, Cleeves et al. (2013) suggested that stellar winds reduce cosmic-ray ionization to s-1, although Padovani et al. (2018) showed that ionization rates may be significantly higher when a higher flux of stellar protons is assumed. Nevertheless, even for very low cosmic-ray ionization rates, we expect a minimum ionization rate in the range of s-1 to s-1 of young protoplanetary disks yr (Umebayashi & Nakano, 2009) even if cosmic-rays were strongly shielded because the short-lived radionuclides 26Al also ionize the gas in disks of yr. Measurements of the cosmic-ray ionization rate of around TW Hya agree with this hypothesis considering the age of TW Hya (up to yr) and the decay time of 26Al ( yr).
However, can probably be higher in the initial phase of young disks, which are associated with a denser environment of a protocluster. The higher ionization rate would hence lead to the formation of smaller disks than in lower ionized regions, as shown in Fig. 4. Considering that the ONC as well as CrA host protostellar clusters, we suggest that these regions are more ionized than Taurus, Lupus, or Ophiucus and that the smaller disks in the ONC or CrA reflect the higher level of ionization in these regions. Large uncertainties are related to the ionization rates at the current time. We therefore strongly encourage carrying out observational programs to constrain the ionization rates in denser environments.
4 Discussion
4.1 Limitations of the chemical modeling
We have discussed the dependence of on density and magnetic field strength. Using values computed with the chemical network of Zhao et al. (2016), we also pointed out the dependence of the coefficients on temperature and chemical composition (see also Marchand et al., 2016). Prior to this study and the work by Wurster et al. (2018b), the effect of different resistivities has also been considered only for Ohmic dissipation in collapse simulations by Machida et al. (2007) or for Ohmic dissipation and ambipolar diffusion in a simplified setup with a thin-disk approximation by Dapp et al. (2012). However, to ensure that the appropriate resistivities are applied, possibly important nonequilibrium chemistry effects would need to be accounted for and the chemical reactions would need to be computed ’on the fly’ during computing time, for example, by employing the chemical framework krome (Grassi et al., 2014).
Related to this, the resistivities strongly depend on the distribution of grain sizes, and in particular, on the presence of very small grains ( VSGs; Dapp et al., 2012; Dzyurkevich et al., 2017; Zhao et al., 2018). With the caveat in mind that the underlying microphysical processes can be very complex (Grassi et al., 2019), it is an appropriate choice to rely on a separate chemical equilibrium model at the current stage, also to avoid excessive computing times. However, the ionization chemistry converges rather quickly on timescales of (Caselli et al., 2002), and accounting for nonequilibrium chemistry likely has only little effect. Generally, a more detailed treatment would not affect the overall result that lower ionization correlates with higher resistivity values.
4.2 Limitations of the physical model and setup
For individual star-forming regions, the surveys show that there is not just one characteristic disk radius or disk mass, but a distribution of disks with varying sizes and masses. This scatter is likely the result of the variations in prestellar core properties such as turbulence, magnetization, or level of rotation within individual giant molecular clouds (GMCs). Using zoom-in simulations of star-disk systems forming in a turbulent GMC, Kuffmeier et al. (2017) demonstrated that accretion onto the protostar is a diverse process that leads to the formation of disks of various size even when everywhere in the cloud ideal MHD is considered, that is, full ionization. Consistently, Bate (2018) also found differences in size and mass of disks in simulations without magnetic fields and hence without ionization. The variations in disk properties that are observed within individual star-forming regions therefore likely reflect the heterogeneity in the accretion and disk formation process (see also Kuffmeier et al., 2018, 2019). This would imply that the distribution of disk sizes is more random than is actually observed. Certainly, the ionization rate alone is not the only parameter that can cause differences in disk size. As shown in Fig. 4, differences in the amount of initial angular momentum or the level of magnetization induce differences in disk size as well. Moreover, many other factors might cause differences in disk size, such as turbulence (Seifried et al., 2012, 2013), misalignment of magnetic field and angular momentum vector (Joos et al., 2012; Krumholz et al., 2013), different initial density profiles of the collapsing prestellar core (Machida et al., 2014), or differences in the thermal to gravitational energy (Tsukamoto et al., 2018). These factors are without any doubt also important factors in determining the properties of disks. Nevertheless, the result presented in this study of 2D models shows that the level of ionization affects the radius and properties of young disks that are still forming.
In reality, protostellar collapse and disk formation is a 3D process that occurs in the environment of turbulent GMCs. Additionally, realistic prestellar cores can significantly deviate from the setup of a collapsing isolated sphere. For the purpose of illustrating the effect of varying ionization rates on the resulting disk size, the use of 2D models based on the spherical collapse assumption is justifiable.
4.3 Origin of the observed variations in disks
The question is whether the differences between the distributions are a result of observational biases that are due to different assumptions or methods. Related to this concern, assumptions on dust temperature, for instance, might be correct for one star-forming region, but different for another. Nevertheless, although there are uncertainties in measuring disk properties, the general consensus is that the differences between star-forming regions are real. It is also reassuring when the same group measures significant differences between star-forming regions (e.g., measurements by van Terwisga et al. (2019) of disks in the OMC-2, and by van Terwisga et al. (2020) in the eastern and western part of the NGC 2422.)
Our results show that the net shift toward on average larger or smaller disks can be induced by the variations in ionization between different star-forming regions during the disk formation stage. Because the ONC as well as CrA host massive protostellar clusters, we expect a higher level of ionization in these regions than in other regions, such as Lupus, Taurus, or Chamaeleon I.
We only modeled the early formation phase, that is, Class 0 in observational terms, while the shift in mean disk mass is predominantly observed for more evolved Class II disks. However, the idea that the observed discrepancy between disk sizes in different star-forming region originates from the formation phase rather than from the later evolution is also consistent with surveys of Class 0/I objects in Perseus and Orion. Although there is disagreement between surveys regarding the dust masses of disks in Perseus (the VLA/ALMA Nascent Disk and Multiplicity (VANDAM) survey (Tychoniec et al., 2018) finds higher masses than the Mass Assembly of Stellar Systems and their Evolution with the SMA (MASSES) survey (Andersen et al., 2019)), the results by Tobin et al. (2020) suggest that Class 0/I disks are smaller in Orion than in Perseus. Considering that Orion is a more active star-forming region than Perseus, we expect that the result of smaller disks in Orion compared to Perseus is real. Finally, we point out that even in the case of a constant but low cosmic-ray ionization rate for different prestellar cores, the level of ionization may still differ by factors of ten because of the differences in the distribution of 26Al, as shown in hydrodynamical simulations (Vasileiadis et al., 2013; Kuffmeier et al., 2016; Fujimoto et al., 2018).
We argue that differences in the ionization rates are a promising explanation for a shift of the observed mean disk size between star-forming regions. Other factors, such as a deviation in initial angular momentum, magnetization, or dust distribution, might be more relevant for governing the scatter of disk properties within an individual star-forming region we described above. Based on our results, we suggest that differences in the mean ionization level of individual star-forming regions are of fundamental importance for the observed systematic difference of the mean disk size between star-forming regions.
4.4 Outlook: future models
The results we obtained from 2D simulations of collapse simulations can certainly only serve as a first proof of concept. The aim for future studies is to constrain the effect of cosmic-ray ionization in more elaborate 3D models with more realistic initial and boundary conditions. An essential step toward deeper insight is a more detailed treatment of the propagation of cosmic rays, accounting for attenuation and focusing on the embedded phase of star formation. The ultimate goal would be a direct coupling of the resistivities to the ionization rate that is induced by the local cosmic-ray ionization.
5 Conclusion
We presented results from a nonideal MHD simulation of a collapsing protostar, accounting for the effects of ambipolar diffusion and Ohmic dissipation. In the models, we varied the ionization level to compute the resistivities with a chemical network. Consistent with the literature, we find that a higher level of ionization corresponds to a higher magnetization around the forming protostar and hence leads to the formation of smaller disks. The trend is robust for various combinations of initial rotation and magnetization of the collapsing core. Although disks of similar size can form for different ionization rates when the initial rotation or magnetization varies, the runs show that the ionization rate is a powerful regulator of disk formation. Therefore our results suggest that the observed differences in average disk sizes for star-forming regions of similar age are at least in part a consequence of the differences in the ionization level that most likely is induced by cosmic rays. In particular, we speculate that the protostellar clusters in the ONC and CrA cause a higher cosmic-ray ionization rate and thereby smaller disks in these regions than in regions such as Taurus, Ophiuchus, Chamaeleon I, or Lupus. Differences in disk size already occur during the early phase of star and disk formation, which is consistent with observations of Class 0/I disks in Perseus and Orion (Tobin et al., 2020). Our study shows the importance of observationally better constraining the cosmic-ray ionization rate in star-forming regions because it is an important parameter for the efficiency of magnetic braking during the disk formation process.
Acknowledgements.
We thank the referee for insightful comments and suggestions that helped to improve the manuscript. The research of MK is supported by a research grant of the Independent Research Foundation Denmark (IRFD) (international postdoctoral fellow, project number: 8028-00025B). MK acknowledges the support of the DFG Research Unit ‘Transition Disks’ (FOR 2634/1, DU 414/23-1).References
- Adams (2010) Adams, F. C. 2010, ARA&A, 48, 47
- Andersen et al. (2019) Andersen, B. C., Stephens, I. W., Dunham, M. M., et al. 2019, ApJ, 873, 54
- Ansdell et al. (2017) Ansdell, M., Williams, J. P., Manara, C. F., et al. 2017, AJ, 153, 240
- Ansdell et al. (2016) Ansdell, M., Williams, J. P., van der Marel, N., et al. 2016, ApJ, 828, 46
- Armitage (2000) Armitage, P. J. 2000, A&A, 362, 968
- Bai (2016) Bai, X.-N. 2016, The Astrophysical Journal, 821, 80
- Barenfeld et al. (2016) Barenfeld, S. A., Carpenter, J. M., Ricci, L., & Isella, A. 2016, ApJ, 827, 142
- Barenfeld et al. (2017) Barenfeld, S. A., Carpenter, J. M., Sargent, A. I., Isella, A., & Ricci, L. 2017, ApJ, 851, 85
- Bate (2018) Bate, M. R. 2018, MNRAS, 475, 5618
- Birnstiel et al. (2010) Birnstiel, T., Dullemond, C. P., & Brauer, F. 2010, A&A, 513, A79
- Caselli et al. (1998) Caselli, P., Walmsley, C. M., Terzieva, R., & Herbst, E. 1998, ApJ, 499, 234
- Caselli et al. (2002) Caselli, P., Walmsley, C. M., Zucconi, A., et al. 2002, ApJ, 565, 344
- Cazzoletti et al. (2019) Cazzoletti, P., Manara, C. F., Baobab Liu, H., et al. 2019, A&A, 626, A11
- Ceccarelli et al. (2014) Ceccarelli, C., Dominik, C., López-Sepulcre, A., et al. 2014, ApJ, 790, L1
- Cieza et al. (2019) Cieza, L. A., Ruíz-Rodríguez, D., Hales, A., et al. 2019, MNRAS, 482, 698
- Clarke & Pringle (1993) Clarke, C. J. & Pringle, J. E. 1993, MNRAS, 261, 190
- Cleeves et al. (2013) Cleeves, L. I., Adams, F. C., & Bergin, E. A. 2013, ApJ, 772, 5
- Dapp et al. (2012) Dapp, W. B., Basu, S., & Kunz, M. W. 2012, A&A, 541, A35
- Dzyurkevich et al. (2017) Dzyurkevich, N., Commerçon, B., Lesaffre, P., & Semenov, D. 2017, A&A, 603, A105
- Eisner et al. (2018) Eisner, J. A., Arce, H. G., Ballering, N. P., et al. 2018, ApJ, 860, 77
- Facchini et al. (2016) Facchini, S., Clarke, C. J., & Bisbas, T. G. 2016, MNRAS, 457, 3593
- Favre et al. (2018) Favre, C., Ceccarelli, C., López-Sepulcre, A., et al. 2018, ApJ, 859, 136
- Fontani et al. (2017) Fontani, F., Ceccarelli, C., Favre, C., et al. 2017, A&A, 605, A57
- Fujimoto et al. (2018) Fujimoto, Y., Krumholz, M. R., & Tachibana, S. 2018, MNRAS, 480, 4025
- Gaches & Offner (2018) Gaches, B. A. L. & Offner, S. S. R. 2018, ApJ, 861, 87
- Goodman et al. (1993) Goodman, A. A., Benson, P. J., Fuller, G. A., & Myers, P. C. 1993, ApJ, 406, 528
- Grassi et al. (2014) Grassi, T., Bovino, S., Schleicher, D. R. G., et al. 2014, MNRAS, 439, 2386
- Grassi et al. (2019) Grassi, T., Padovani, M., Ramsey, J. P., et al. 2019, MNRAS, 484, 161
- Gray et al. (2018) Gray, W. J., McKee, C. F., & Klein, R. I. 2018, MNRAS, 473, 2124
- Gressel et al. (2015) Gressel, O., Turner, N. J., Nelson, R. P., & McNally, C. P. 2015, ApJ, 801, 84
- Haworth et al. (2018) Haworth, T. J., Clarke, C. J., Rahman, W., Winter, A. J., & Facchini, S. 2018, MNRAS, 481, 452
- Hennebelle et al. (2016) Hennebelle, P., Commerçon, B., Chabrier, G., & Marchand, P. 2016, ApJ, 830, L8
- Hillenbrand (1997) Hillenbrand, L. A. 1997, AJ, 113, 1733
- Joos et al. (2012) Joos, M., Hennebelle, P., & Ciardi, A. 2012, A&A, 543, A128
- Joos et al. (2013) Joos, M., Hennebelle, P., Ciardi, A., & Fromang, S. 2013, A&A, 554, A17
- Jørgensen et al. (2009) Jørgensen, J. K., van Dishoeck, E. F., Visser, R., et al. 2009, A&A, 507, 861
- Krasnopolsky et al. (2010) Krasnopolsky, R., Li, Z.-Y., & Shang, H. 2010, ApJ, 716, 1541
- Krumholz et al. (2013) Krumholz, M. R., Crutcher, R. M., & Hull, C. L. H. 2013, ApJ, 767, L11
- Kuffmeier et al. (2019) Kuffmeier, M., Calcutt, H., & Kristensen, L. E. 2019, A&A, 628, A112
- Kuffmeier et al. (2018) Kuffmeier, M., Frimann, S., Jensen, S. S., & Haugbølle, T. 2018, MNRAS, 475, 2642
- Kuffmeier et al. (2016) Kuffmeier, M., Frostholm Mogensen, T., Haugbølle, T., Bizzarro, M., & Nordlund, Å. 2016, ApJ, 826, 22
- Kuffmeier et al. (2017) Kuffmeier, M., Haugbølle, T., & Nordlund, Å. 2017, ApJ, 846, 7
- Li et al. (2011) Li, Z.-Y., Krasnopolsky, R., & Shang, H. 2011, ApJ, 738, 180
- Long et al. (2018) Long, F., Pinilla, P., Herczeg, G. J., et al. 2018, ApJ, 869, 17
- Lüst & Schlüter (1955) Lüst, R. & Schlüter, A. 1955, ZAp, 38, 190
- Machida et al. (2007) Machida, M. N., Inutsuka, S.-i., & Matsumoto, T. 2007, ApJ, 670, 1198
- Machida et al. (2011) Machida, M. N., Inutsuka, S.-I., & Matsumoto, T. 2011, PASJ, 63, 555
- Machida et al. (2014) Machida, M. N., Inutsuka, S.-i., & Matsumoto, T. 2014, MNRAS, 438, 2278
- Machida & Matsumoto (2011) Machida, M. N. & Matsumoto, T. 2011, MNRAS, 413, 2767
- Marchand et al. (2018) Marchand, P., Commerçon, B., & Chabrier, G. 2018, A&A, 619, A37
- Marchand et al. (2016) Marchand, P., Masson, J., Chabrier, G., et al. 2016, A&A, 592, A18
- Masson et al. (2016) Masson, J., Chabrier, G., Hennebelle, P., Vaytet, N., & Commerçon, B. 2016, A&A, 587, A32
- Mathis et al. (1977) Mathis, J. S., Rumpl, W., & Nordsieck, K. H. 1977, ApJ, 217, 425
- Maucó et al. (2016) Maucó, K., Hernández, J., Calvet, N., et al. 2016, ApJ, 829, 38
- Maury et al. (2019) Maury, A. J., André, P., Testi, L., et al. 2019, A&A, 621, A76
- Mellon & Li (2008) Mellon, R. R. & Li, Z.-Y. 2008, ApJ, 681, 1356
- Mellon & Li (2009) Mellon, R. R. & Li, Z.-Y. 2009, ApJ, 698, 922
- Mestel & Spitzer (1956) Mestel, L. & Spitzer, Jr., L. 1956, MNRAS, 116, 503
- Nakano et al. (2002) Nakano, T., Nishi, R., & Umebayashi, T. 2002, ApJ, 573, 199
- Offner et al. (2019) Offner, S. S. R., Gaches, B. A. L., & Holdship, J. R. 2019, ApJ, 883, 121
- Oliveira et al. (2002) Oliveira, J. M., Jeffries, R. D., Kenyon, M. J., Thompson, S. A., & Naylor, T. 2002, A&A, 382, L22
- Oliveira et al. (2004) Oliveira, J. M., Jeffries, R. D., & van Loon, J. T. 2004, MNRAS, 347, 1327
- Ostriker (1994) Ostriker, E. C. 1994, ApJ, 424, 292
- Padovani & Galli (2011) Padovani, M. & Galli, D. 2011, A&A, 530, A109
- Padovani et al. (2009) Padovani, M., Galli, D., & Glassgold, A. E. 2009, A&A, 501, 619
- Padovani et al. (2018) Padovani, M., Ivlev, A. V., Galli, D., & Caselli, P. 2018, A&A, 614, A111
- Padovani et al. (2016) Padovani, M., Marcowith, A., Hennebelle, P., & Ferrière, K. 2016, A&A, 590, A8
- Pascucci et al. (2016) Pascucci, I., Testi, L., Herczeg, G. J., et al. 2016, ApJ, 831, 125
- Pfalzner et al. (2005) Pfalzner, S., Vogel, P., Scharwächter, J., & Olczak, C. 2005, A&A, 437, 967
- Podio et al. (2014) Podio, L., Lefloch, B., Ceccarelli, C., Codella, C., & Bachiller, R. 2014, A&A, 565, A64
- Prosser et al. (1994) Prosser, C. F., Stauffer, J. R., Hartmann, L., et al. 1994, ApJ, 421, 517
- Ruíz-Rodríguez et al. (2018) Ruíz-Rodríguez, D., Cieza, L. A., Williams, J. P., et al. 2018, MNRAS, 478, 3674
- Segura-Cox et al. (2018) Segura-Cox, D. M., Looney, L. W., Tobin, J. J., et al. 2018, ApJ, 866, 161
- Seifried et al. (2012) Seifried, D., Banerjee, R., Pudritz, R. E., & Klessen, R. S. 2012, MNRAS, 423, L40
- Seifried et al. (2013) Seifried, D., Banerjee, R., Pudritz, R. E., & Klessen, R. S. 2013, MNRAS, 432, 3320
- Silsbee et al. (2018) Silsbee, K., Ivlev, A. V., Padovani, M., & Caselli, P. 2018, ApJ, 863, 188
- Spitzer & Tomasko (1968) Spitzer, Lyman, J. & Tomasko, M. G. 1968, ApJ, 152, 971
- Störzer & Hollenbach (1999) Störzer, H. & Hollenbach, D. 1999, ApJ, 515, 669
- Tazzari et al. (2017) Tazzari, M., Testi, L., Natta, A., et al. 2017, A&A, 606, A88
- Tobin et al. (2020) Tobin, J. J., Sheehan, P. D., Megeath, S. T., et al. 2020, ApJ, 890, 130
- Tomida et al. (2015) Tomida, K., Okuzumi, S., & Machida, M. N. 2015, ApJ, 801, 117
- Tomida et al. (2013) Tomida, K., Tomisaka, K., Matsumoto, T., et al. 2013, ApJ, 763, 6
- Tripathi et al. (2017) Tripathi, A., Andrews, S. M., Birnstiel, T., & Wilner, D. J. 2017, ApJ, 845, 44
- Troland & Crutcher (2008) Troland, T. H. & Crutcher, R. M. 2008, ApJ, 680, 457
- Tsukamoto et al. (2015) Tsukamoto, Y., Iwasaki, K., Okuzumi, S., Machida, M. N., & Inutsuka, S. 2015, ApJ, 810, L26
- Tsukamoto et al. (2018) Tsukamoto, Y., Okuzumi, S., Iwasaki, K., Machida, M. N., & Inutsuka, S. 2018, ApJ, 868, 22
- Tychoniec et al. (2018) Tychoniec, Ł., Tobin, J. J., Karska, A., et al. 2018, ApJS, 238, 19
- Umebayashi & Nakano (2009) Umebayashi, T. & Nakano, T. 2009, ApJ, 690, 69
- van Terwisga et al. (2019) van Terwisga, S. E., Hacar, A., & van Dishoeck, E. F. 2019, A&A, 628, A85
- van Terwisga et al. (2020) van Terwisga, S. E., van Dishoeck, E. F., Mann, R. K., et al. 2020, arXiv e-prints, arXiv:2004.13551
- Vasileiadis et al. (2013) Vasileiadis, A., Nordlund, Å., & Bizzarro, M. 2013, ApJ, 769, L8
- Vaytet et al. (2018) Vaytet, N., Commerçon, B., Masson, J., González, M., & Chabrier, G. 2018, A&A, 615, A5
- Weidenschilling (1977) Weidenschilling, S. J. 1977, Ap&SS, 51, 153
- Whipple (1972) Whipple, F. L. 1972, in From Plasma to Planet, ed. A. Elvius, 211
- Williams et al. (2019) Williams, J. P., Cieza, L., Hales, A., et al. 2019, ApJ, 875, L9
- Winter et al. (2018a) Winter, A. J., Clarke, C. J., Rosotti, G., & Booth, R. A. 2018a, MNRAS, 475, 2314
- Winter et al. (2018b) Winter, A. J., Clarke, C. J., Rosotti, G., et al. 2018b, MNRAS, 478, 2700
- Wurster et al. (2018a) Wurster, J., Bate, M. R., & Price, D. J. 2018a, MNRAS, 475, 1859
- Wurster et al. (2018b) Wurster, J., Bate, M. R., & Price, D. J. 2018b, MNRAS, 476, 2063
- Wurster et al. (2019) Wurster, J., Bate, M. R., & Price, D. J. 2019, MNRAS, 2117
- Zhao et al. (2018) Zhao, B., Caselli, P., & Li, Z.-Y. 2018, MNRAS, 478, 2723
- Zhao et al. (2016) Zhao, B., Caselli, P., Li, Z.-Y., et al. 2016, MNRAS, 460, 2050