PHENIX Collaboration
Production of at forward rapidity in + collisions at GeV
Abstract
The cross section of bottom quark-antiquark () production in + collisions at GeV is measured with the PHENIX detector at the Relativistic Heavy Ion Collider. The results are based on the yield of high mass, like-sign muon pairs measured within the PHENIX muon arm acceptance (). The signal is extracted from like-sign dimuons by utilizing the unique properties of neutral meson oscillation. We report a differential cross section of nb for like-sign muons in the rapidity and ranges and GeV/, and dimuon mass of 5–10 GeV/. The extrapolated total cross section at this energy for production is b. The total cross section is compared to a perturbative quantum chromodynamics calculation and is consistent within uncertainties. The azimuthal opening angle between muon pairs from decays and their distributions are compared to distributions generated using ps pythia6, which includes next-to-leading order processes. The azimuthal correlations and pair distribution are not very well described by pythia calculations, but are still consistent within uncertainties. Flavor creation and flavor excitation subprocesses are favored over gluon splitting.
I Introduction
The bottom-quark production in hadron-hadron collisions is an important test of perturbative quantum chromodynamics (pQCD) calculations. Because of its large mass, , the -quark production cross section can be reliably calculated by including next-to-leading order (NLO) processes, especially at high center of mass energies Mangano et al. (1992). The measurement of the production cross section over a wide range of colliding energies in hadron-hadron collisions provides a meaningful test of pQCD theory calculations and a baseline measurement for studying modifications of heavy quark production in heavy ion collisions.
Cross section measurements for bottom production in hadron-hadron collision experiments have been made from lower energy fixed-target experiments Alexopoulos et al. (1999); Jansen et al. (1995); Abt et al. (2006) ( GeV) up to collider energies ( GeV). It was found that pQCD predictions match experimental results well at energies greater than TeV Acosta et al. (2005); Aaij et al. (2010, ); Aad et al. (2012); Abelev et al. (2013); Khachatryan et al. (2011); Chatrchyan et al. (2011, ), but less so at lower energies. Results at the wide range of collision energies of the Relativistic Heavy Ion Collider explore an important gap between the low-energy fixed-target and TeV-energy regimes.
Without displaced vertex -tagging capability at PHENIX, -quark production has been studied using unlike-sign dileptons from heavy quark decays Adare et al. (2015). The PHENIX and STAR collaborations have previously measured the bottom cross section in + collisions at GeV using electron-hadron correlations Adare et al. (2009a); Aggarwal et al. (2010) and using dilepton invariant mass and momentum distributions Aidala et al. (2017); Adare et al. (2009b); Aidala et al. (2019).
Like-sign dimuons have previously been used to investigate the phenomenon of neutral meson oscillations in collisions by the CLEO Collaboration Bean et al. (1987), the ARGUS Collaboration Albrecht et al. (1987), the ALEPH Collaboration Buskulic et al. (1994), and in collisions by the UA1 Collaboration Albajar et al. (1987). In this measurement, we use the yield of like-sign dimuons along with the properties of neutral meson oscillation to determine the cross section. The correlated like-sign pairs at high mass (5–10 GeV/) are dominated by the semileptonic decay of open bottom pairs and the other correlated sources (i.e. dijets or punch-through hadrons) amount to less than 10%, and therefore provide a clean probe to study the production.
In the Standard Model, neutral meson oscillation is a result of higher order weak interactions that transform a neutral meson into its antiparticle: because the flavor eigenstates differ from the physical mass eigenstates of the meson-antimeson system Glashow (1961); Abe et al. (1999). In the absence of oscillation as shown in Fig. 1(a), primary-primary decays, where the lepton’s direct parent is the meson, can only produce unlike-sign lepton pairs. For example and while like-sign lepton pairs can result from a mixture of primary and secondary decays (decay chain).
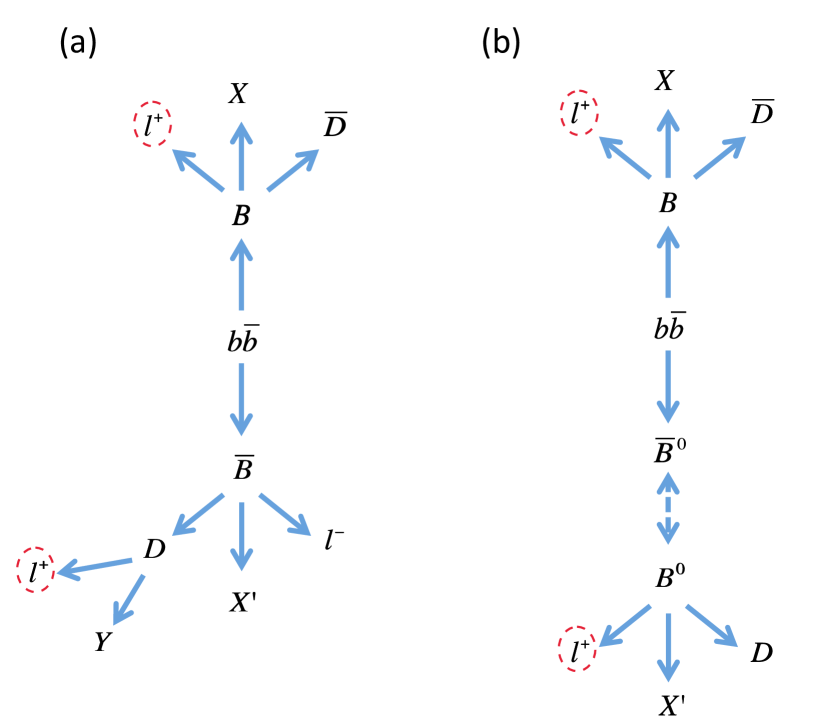
However, if oscillation occurs, as is the case for neutral mesons ( and ), the meson can spontaneously change into a meson as shown in Fig. 1(b). Unless otherwise noted, we denote () as a generic admixture of bottom (antibottom) hadrons with production ratios, from weak decays ( ) of: , , , and )-baryon Olive et al. (2014). The production ratio is negligible (0.2%) and less than the uncertainties associated with bottom hadrons listed above. The time-integrated probability for a neutral meson to oscillate before it decays is defined as
| (1) |
where is the mass difference between heavy and light mass eigenstates and is the decay rate of the weak eigenstates. These values are found to be and for the and mesons, respectively Olive et al. (2014). This process can result in a like-sign dilepton event from a primary-primary decay as sown in Fig. 1(b). Given the large branching ratio of the decay channel () Olive et al. (2014), the like-sign dilepton from a primary-primary decay provides a unique opportunity for extracting the cross section.
In this paper, we present measurements of production cross section through the like-sign dimuon decays and the azimuthal opening angle between the muon pair and their distributions in + collisions at GeV at forward () and backward () rapidities. The azimuthal opening angle and pair distributions are compared to distributions generated using pythia6 with parton-shower (ps) model Sjostrand et al. (2001). The model approximates the correction to all higher orders (almost next-to-leading-log) for production, which includes flavor creation, flavor excitation, and gluon splitting. The extrapolated total cross section, using ps pythia6 Sjostrand et al. (2001) and pythia8 Sjbstrand et al. (2015), and MCNLO Frixione and Webber calculations, is also presented and compared to pQCD calculation.
II Experimental Setup
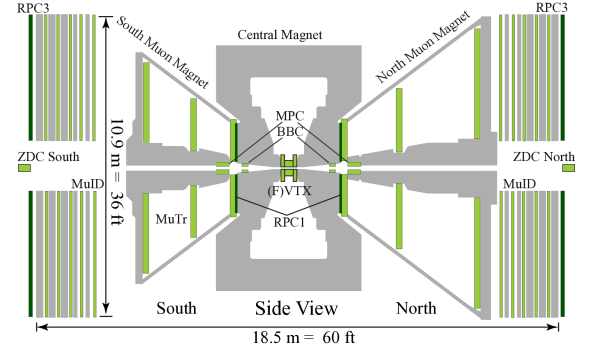
A complete description of the PHENIX detector can be found in Ref. Adcox et al. (2003). We briefly describe here only the detector subsystems used in these measurements. The relevant systems, which are shown in Fig. 2, include the PHENIX muon spectrometers covering forward and backward rapidities and the full azimuth. Each muon spectrometer comprises a hadronic absorber, a magnet, a muon tracker (MuTr), and a muon identifier (MuID). The absorbers comprise layers of copper, iron, and stainless steel and have about 7.2 interactions lengths. Following the absorber in each muon arm is the MuTr, which comprises three stations of cathode strip chambers in a radial magnetic field with an integrated bending power of 0.8 Tm. The MuID comprises five alternating steel absorbers and Iarocci tubes. The composite momentum resolution, , of particles in the analyzed momentum range is about 5%, independent of momentum and dominated by multiple scattering. Muon candidates are identified by reconstructed tracks in the muon spectrometers.
Another detector system relevant to this analysis is the beam-beam counter (BBC), consisting of two arrays of 64 Čerenkov counters, located on both sides of the interaction point and covering the pseudorapidity range . The BBC system was used to measure the + collision vertex position along the beam axis (), with 2 cm resolution, and initial collision time. It was also used to measure the beam luminosity and form a minimum bias trigger (MB). The MB trigger requires at least one hit in each BBC on the sides of the interaction point.
III Data Analysis
III.1 Data set and quality cuts
The data set for this analysis is collected by PHENIX during the 2013 + run at GeV. Events, in coincidence with the MB trigger, containing a muon pair within the acceptance of the spectrometer are selected by the level-1 dimuon trigger (MuIDLL1-2D) requiring that at least two tracks penetrate through the MuID to its last two layers. After applying a vertex cut of cm and extensive quality assurance checks, the data remaining correspond to MB events or to an integrated luminosity of 94.4 pb-1.
A set of cuts was used to select good muon candidates and improve the signal-to-background ratio. Hits in the MuTr are used to make MuTr tracks and hits in the MuID are used to make MuID roads. The MuTr track is required to have more than 9 hits out of the maximum possible of 16 while the MuID road is required to have more than 6 hits out of the maximum possible of 10. Additional cut is applied on MuTr track that is calculated from the difference between the measured hit positions of the track and the subsequent fit. MuTr tracks are then projected to the MuID at the first MuID gap and matched to MuID roads by applying cuts on maximum position and angle differences.
Muon candidates are required to have a minimum greater than 1 GeV/. This cut improves the sample quality by reducing background from pions and kaons. A minimum of 3.0 GeV/ is applied to single muon momentum along the beam axis, , which is reconstructed and energy-loss corrected at the collision vertex, corresponding to the momentum cut effectively imposed by the absorbers. Muon candidates are further restricted to the rapidity range of for the south muon arm and for the north muon arm. Additionally, a cut on the of the fit of the two muon tracks to the common vertex of the two candidate tracks near the interaction point is applied.
III.2 Detector acceptance and reconstruction efficiency
The product of the acceptance and reconstruction efficiency () is determined using Monte Carlo (MC) simulation. The is defined by the number of dimuons reconstructed in the muon spectrometers with respect to the number of dimuons generated in the same kinematic region. The kinematic distributions of pythia111We used pythia6 (ver 6.421), with parton distribution functions given by CTEQ6LL. The following parameters were modified: MSEL = 0, MSUB(86) = 1, PARP(91) = 2.1, MSTP(51) = 10041, MDME(858,1) = 0, MDME(859,1) = 1, MDME(860,1) = 0, and Tune A. Field and Group generated , rapidity, and mass shape were used as input into a full PHENIX geant4 simulation Agostinelli et al. (2003).
The and rapidity distributions were tuned such that the reconstructed distributions match those of 2013 data. Variations within the uncertainties of data are taken as systematic uncertainty.
The detector response in the simulation is tuned to a set of characteristics (dead and hot channel maps, gains, noise, etc.) that describes the performance of each detector subsystem. The simulated vertex distribution is also tuned to match that of the 2013 data. The simulated events are further embedded with real data to account for the effects of detector noise and other background tracks, and then are reconstructed in the same manner as the real data. A final cross check was done on invariant yield after correction, which matched very well within statistical uncertainties in all and rapidity bins Acharya et al. (2020).
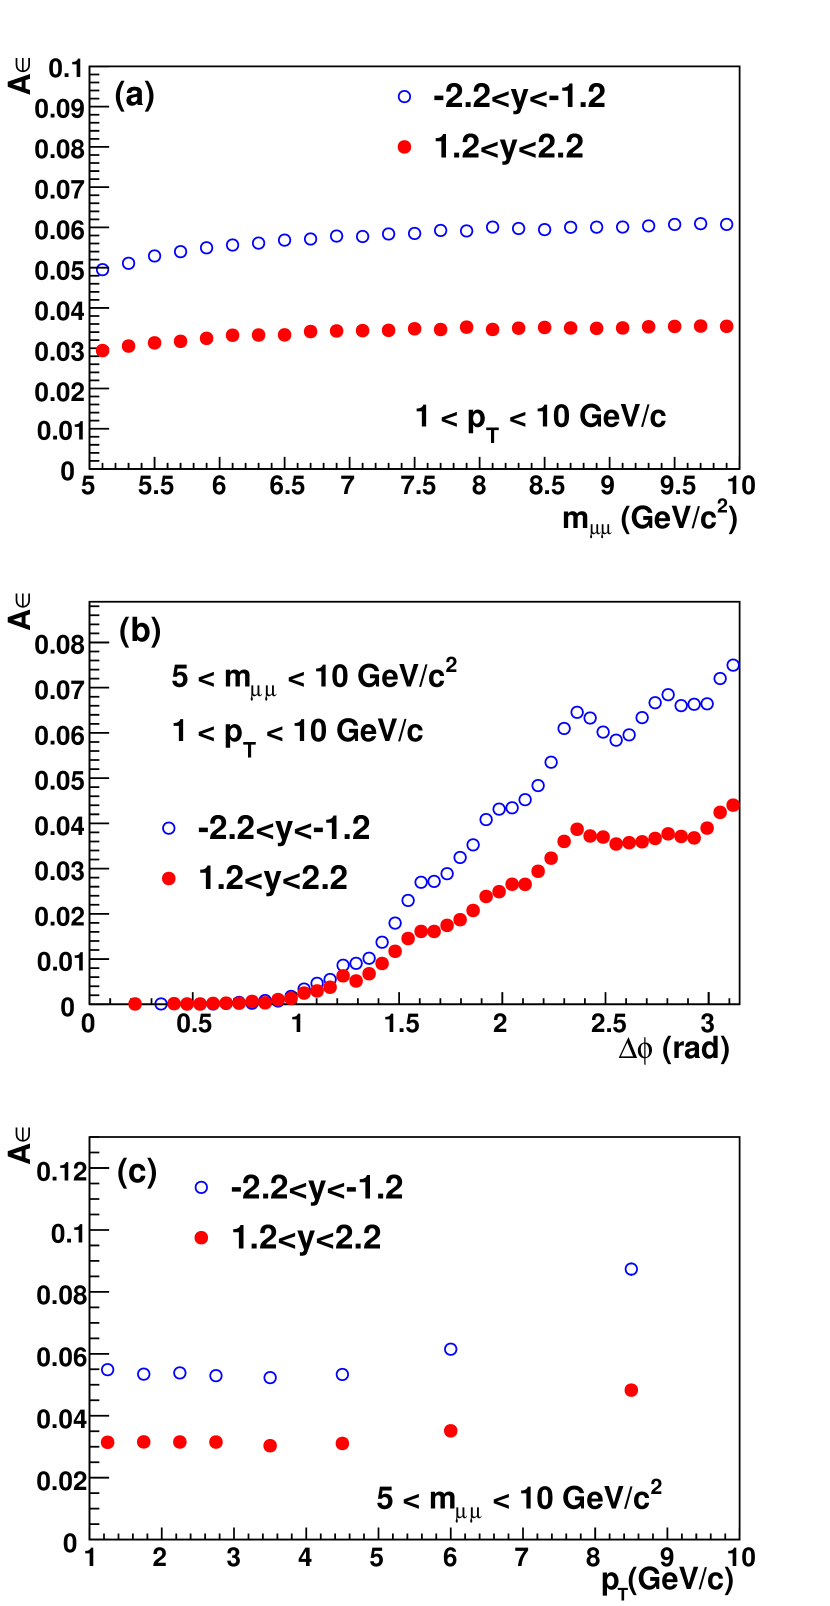
Figure 3 shows the as a function of (a) dimuon mass , (b) dimuon opening angle , and (c) dimuon . The relative difference in between the two spectrometers is due to different detection efficiencies of the MuTr and MuID systems and different amounts of absorber material.
III.3 Raw yield extraction
We measure like-sign dimuons in the same muon arm that have an invariant mass between 5 and 10 GeV/. In this mass range, the correlated pairs in the dimuon spectrum are dominated by the semileptonic decay of open bottom pairs either from the primary-secondary decay chain as shown in Fig. 1(a) or from the primary-primary pairs from neutral meson oscillation as shown in Fig. 1(b). Dileptons from the Drell-Yan process and quarkonia decays can only yield unlike-sign pairs. mesons can produce like-sign pairs through their decay chain. For example, and the other open charm decays as . However, in the mass range of interest the like-sign pairs from mesons are negligible. The contribution from neutral meson oscillation to the like-sign signal is expected to be very small because the oscillation probability is Aaij et al. (2013); therefore, it is not included.
III.3.1 Correlated background
Additional contribution to the correlated pairs could originate from correlated sources such as dijets or punch-through hadrons. Hadrons (particularly and ) can punch through to the last gap of the MuID or decay to muons creating a background to the correlated like-sign signal. These contributions are estimated using MC simulation by determining the -dependent survival probability that a hadron will traverse the muon arm detectors and applying it to pythia generated dihadron pairs to get the yield expected at the back of the muon arm detectors. and are generated with pythia222Non-default parameters used in Multiparton Interaction (MPI)“Tune-A” ps pythia6 simulation for hadron and jet production. The following parameters were modified:MSEL = 1, PMAS(5,1) = 4.1, PYTUNE 100, and PARP(90) = 0.25 Field and Group ; Aidala et al. (2019); Adare et al. (2011a) and then run through the PHENIX detector simulation chain to determine a -dependent probability that the hadrons penetrate the last gap of the MuID.
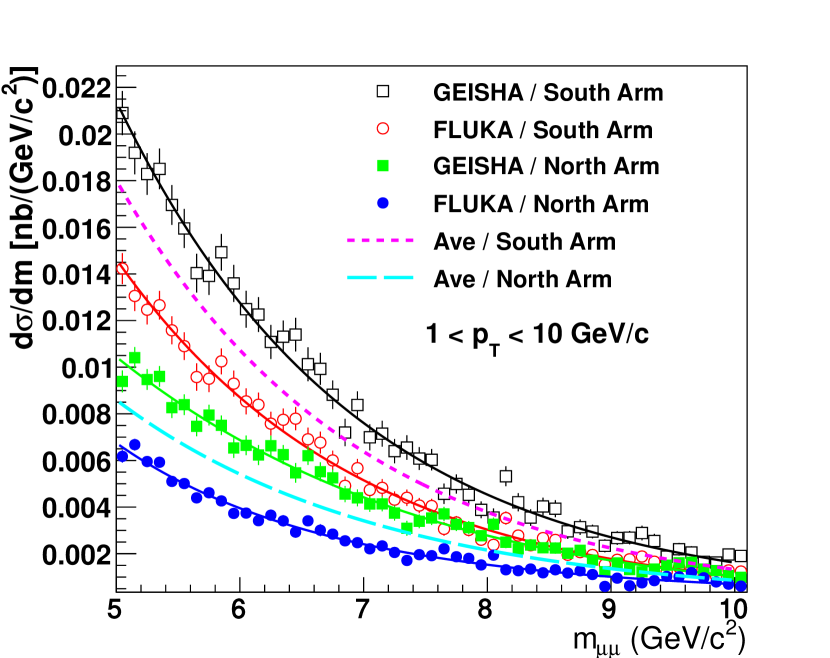
To get a better estimate of the survival probability, the hadron simulation is run using two different hadron interaction packages for geant: fluka and geisha Brun et al. ; Adare et al. (2012). Figure 4 shows the simulated invariant mass spectra from irreducible background are fitted with an exponential function of the form exp() between 5 and 10 GeV/, where is the invariant mass and , and are fit parameters. The average of the indicated results from geisha and fluka is used to subtract the hadronic background from like-sign pairs while the difference is considered as a systematic uncertainty.
The invariant mass distribution for like-sign pairs is then constructed from pythia generated dihadron pairs within the same event and from mixed events, with each entry weighted by the survival probability. Event-mixing procedure is discussed in the next section. Just as with data, the correlated like-sign signal is obtained by subtracting the mixed event spectrum from the like-sign spectrum, providing the correlated like-sign signal due to dijets or punch-through hadrons. The sum of and correlated like-sign signals is weighted based on their -dependent cross sections Adare et al. (2018); Albajar et al. (1990).
Fake like-sign pairs due to charge misidentification and like-sign pairs from Drell-Yan process or quarkonia decays and muon-decayed or punch-through hadrons were also studied and found to be negligible.
III.3.2 Uncorrelated background
The uncorrelated pair contribution is estimated using event mixing technique Crochet and Braun-Munzinger (2002), where like-sign pairs are constructed by pairing muons in the current event with those of the same sign and same arm in previous events of z-vertex position within 2 cm. The mixed event pairs ( and ) form the uncorrelated background spectrum which is normalized to the the foreground ( and ) using a normalization factor (). The normalization factor requires that the integrated counts from event mixing equal those from the like-sign in the low mass region where the correlated pairs are expected to be negligible Crochet and Braun-Munzinger (2002). The normalized like-sign pairs from event mixing are given as:
| (2) |
However, the specific range where the signal of interest is negligible is not well known, and the average of normalization factors over five mass ranges (0.6–2.6 GeV/, 1.0–2.0 GeV/, 1.6–3.2 GeV/, 2.6–3.8 GeV/, and 0.6–4.2 GeV/) is used. The correlated like-sign signal () is then isolated by subtracting the mixed-event spectrum () from the “foreground” like-sign pairs () according to the following,
| (3) |
To further improve the normalization process, the invariant mass distribution shape from ps pythia6 simulation is utilized. This is done by normalizing the integral of the ps pythia6 distribution to the result of Eq. (3), over the signal mass range 5–10 GeV/. The integral of the normalized mass distribution is then subtracted from the background distribution in Eq. (2) for each of the background ranges and the normalization factor is recalculated. The second step is then repeated until the value of the mixed-events normalization factor converges.
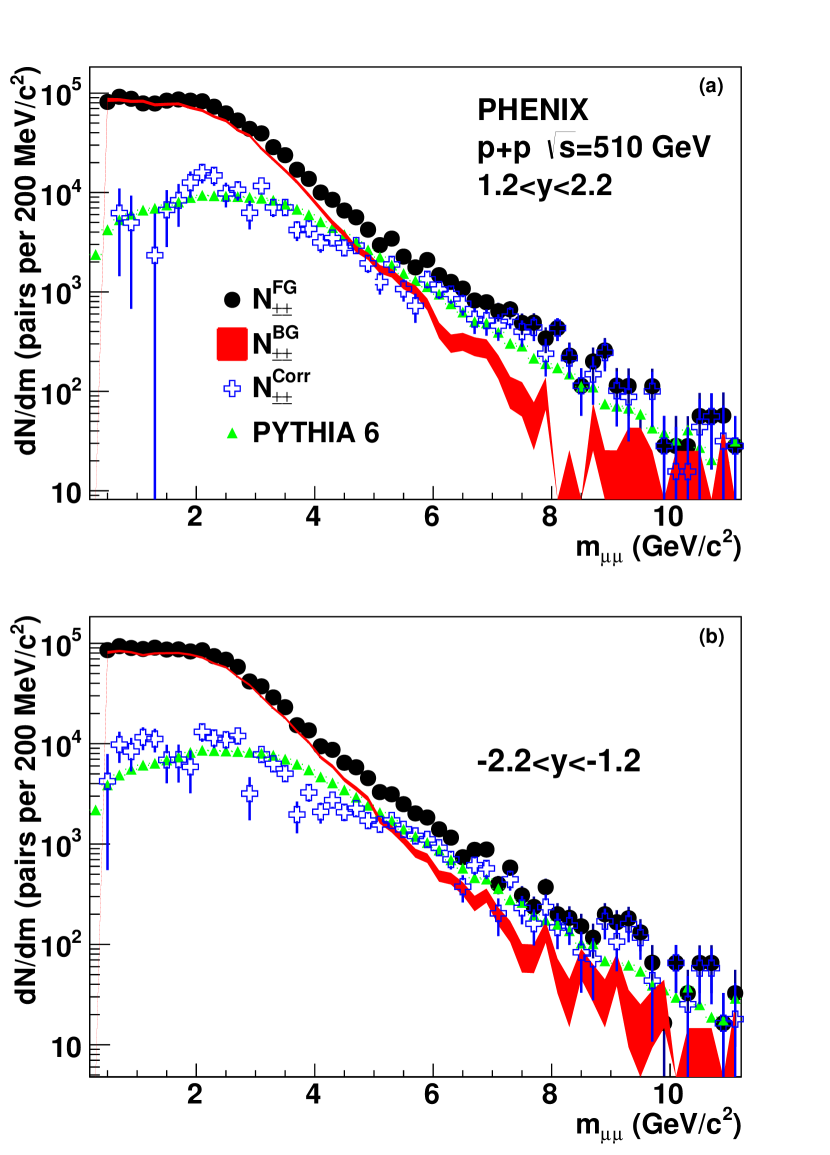
Figure 5 shows the resulting distributions of , and as a function of the invariant mass of the pairs. These distributions are corrected with . To extract the distribution as a function of the azimuthal opening angle between muon pairs () and their , the normalization factors obtained previously are used to normalize and mixed event distributions, which are then subtracted from and foreground distributions, respectively.
III.4 Systematic uncertainties
Table 1 summarizes the systematic uncertainties. Evaluated as standard deviations, they are divided into three categories based upon the effect each source has on the measured results:
- Type-A
-
Point-to-point uncorrelated uncertainties that allow the data points to move independently with respect to one another and are added in quadrature with statistical uncertainties; however, no systematic uncertainties of this type are associated with this measurement.
- Type-B
-
Point-to-point correlated uncertainties which allow the data points to move coherently within the quoted range to some degree. These systematic uncertainties include a 4% uncertainty from MuID tube efficiency and an 8.2% (2.8%) from MuTr overall efficiency for the north (south) arm. The systematic uncertainty associated with includes the uncertainties on the input and rapidity distributions which are extracted by varying these distributions over the range of the statistical uncertainty of the data, yielding 4.4% (5.0%) for the north (south) arm. To be consistent with the real data analysis, a trigger emulator was used to match the MuIDLL1-2D trigger for the data. The efficiency of the trigger emulator was studied by comparing the dimuon mass spectrum requiring the dimuon passes the trigger emulator to the dimuon mass spectrum requiring the dimuon passes the MuIDLL1-2D trigger, which resulted in a 1.5% (2%) uncertainty for the north (south) arm. Additional 11.2% (8.8%) systematic effect for the north (south) arm was also considered to account for the azimuthal angle distribution difference between data and simulation.
The source of systematic uncertainty in signal extraction is the normalization of mixed events which could come from the choice of the different normalization ranges in the mixed events or shape from pythia used to guide the signal extraction. A 1.9% uncertainty on the mixed events normalization was observed from using each of the five normalization windows by itself as well as the different combinations of these normalization windows. pythia shape is the sum of three subprocesses: flavor creation, flavor excitation and gluon splitting. A maximum variation of 3.1% on the extracted signal was observed from choosing each of the subprocesses by itself as the source of shape. Added in quadrature, they result in a 3.6% uncertainty on signal extraction.
The systematic uncertainty associated with correlated backgrounds could come from the input distribution, differences between geisha and fluka, and differences between geant3 and geant4. pythia distributions of and were compared separately to fits of UA1 data Adare et al. (2018); Albajar et al. (1990) and an overall difference of 18% was observed. Differences of up to 30% and 20% between fluka and geisha, see Fig. 4, were observed in the north and south arms, respectively. Additional 15% was considered to account for the difference between geant3 and geant4. Added in quadrature, all three sources give an overall effect on the hadronic background of 39% (31%) for the north (south) arm for the mass and distributions. For distribution, a -dependent correction was used for the effect on the input spectra and the other two sources gave an overall effect on the hadronic background of 34% (25%) for the north (south) arm. To extract the systematic uncertainty associated with the cross section (or invariant yields) for all distributions (mass, and ), the hadronic background was varied between the limits listed above which resulted in an overall systematic of 5.1% (4.5%) for north (south) arm.
The Type-B systematic uncertainties are added in quadrature and amount to 16.0% (12.8%) for the north (south) arm. They are shown as shaded bands on the associated data points.
- Type-C
-
An overall (global) normalization uncertainty of 10% was assigned for the BBC cross section and efficiency uncertainties Adler et al. (2003) which allows the data points to move together by a common multiplicative factor.
| Type | Origin | North (South) |
|---|---|---|
| B | MuID hit efficiency | 4.0% (4.0%) |
| B | MuTr hit efficiency | 8.2% (2.8%) |
| B | and input distributions | 4.4% (5.0%) |
| B | trigger emulator | 1.5% (2.0%) |
| B | distribution | 11.2% (8.8%) |
| B | Signal extraction | 3.6% (3.6%) |
| B | Correlated background | 5.1% (4.5%) |
| B | Quadratic sum | 16.4% (12.8)% |
| C | MB trigger efficiency | 10% |
IV Results and Discussion
IV.1 Differential cross section
The differential yield and cross section of meson pairs decaying into like-sign dimuons as a function of mass are calculated according to the following relations,
| (4) |
| (5) |
where is the yield of like-sign dimuons from meson decay normalized by in and bin with and widths, respectively. The yields of the north and south arms are calculated independently and are consistent within statistical uncertainties; therefore, the weighted average Nisius (2014) is used in the differential yield calculation. mb is the cross section as seen for the BBC in + collisions at GeV, which is determined from the van der Meer scan technique Adare et al. (2011b). is the fraction of inelastic + collisions recorded by the BBC Adare et al. (2009c). is the efficiency of the MB trigger for events containing a hard scattering Acharya et al. (2020). is the number of MB events.
The differential cross section of like-sign dimuons from meson decay is shown in Fig. 6. The gray shaded bands represent the weighted average of the quadratic sum of type-B systematic uncertainties of the north and south arms, 10.1%. The average is weighted based on the statistical uncertainties of each arm. In addition to type-B systematic uncertainties, we have a 10% global systematic uncertainty for BBC cross section and efficiencies Adler et al. (2003).
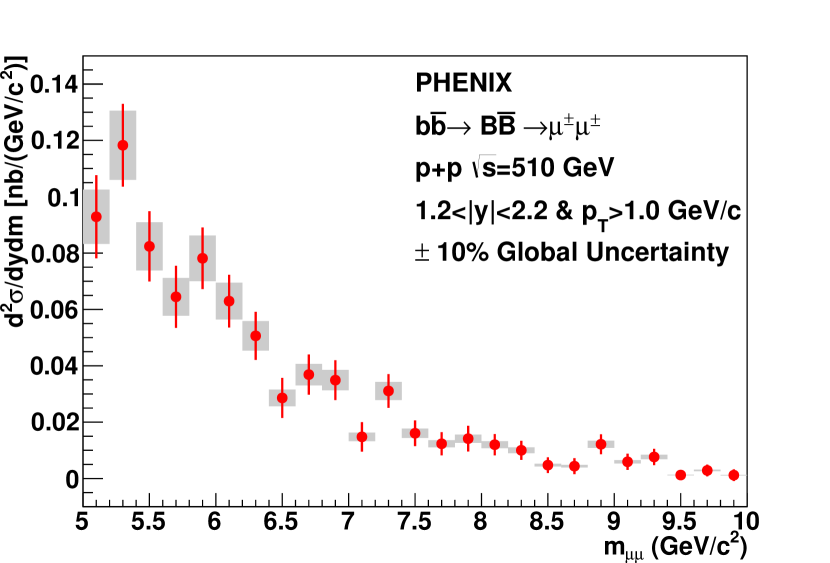
The total cross section, , within the mass range, GeV/, and rapidity and ranges, and 1 GeV/, respectively, is extracted by integrating , which resulted nb.
To obtain the differential cross section of all meson pairs that decay into dimuons, regardless of the muon pair charge, the differential cross section of like-sign dimuons from meson decay is scaled by the ratio of the total number of all meson pairs that decay into dimuons, regardless of their sign, to those of like-sign. For clarification purposes, the process is divided into two separate steps defined by two variables and , both of which depend on the signal from like-sign dimuons due to oscillation.
The ratio of like-sign dimuons at mass and from primary-primary decays due to oscillation to like-sign muon pairs resulting from primary-primary or a mixture of primary-secondary decays is defined as:
| (6) |
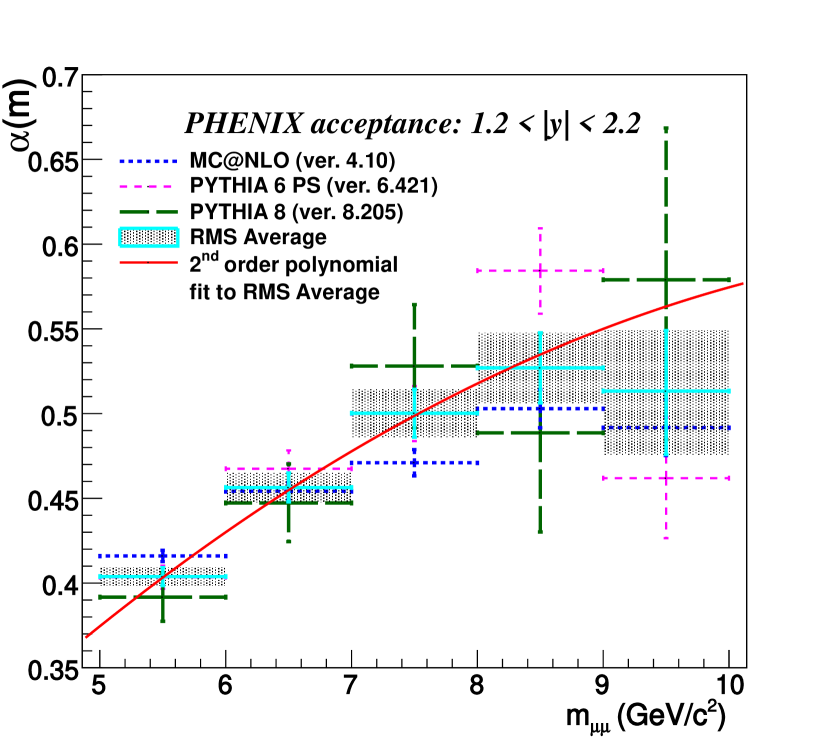
which is calculated in the mass range at and 1 GeV/ and extrapolates the correlated like-sign signal to an open bottom signal from oscillation, . The is obtained using open bottom events from three model calculations: mc@nlo (ver 4.10), ps pythia6 (ver 6.421) and pythia8 (ver 8.205) as shown in Fig. 8. The red line is a second-order polynomial fit with of 3.8/4. The shaded boxes represent the uncertainty based on the three model calculations.
is the ratio of primary-primary like-sign dimuons due to oscillation to all meson pairs that decay into primary-primary dimuons with all possible muon charge pairs ( and ). converts the number of muon pairs from oscillation into all meson pairs and is defined as:
| (7) |
The value of is which is the calculated RMS value from the three model simulations described above. The error of is the standard deviation of the three model calculations which represents the model-dependent uncertainty.
The differential cross section of all meson pairs that decay into a primary-primary dimuon, regardless of the muon pair charge, is then calculated as follows:
| (8) |
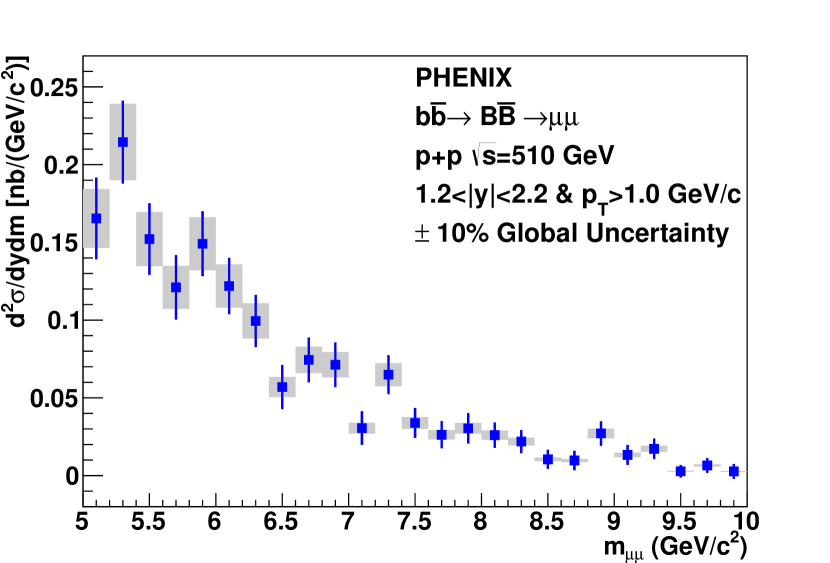
Figure 8 shows the differential cross section of all meson pairs that decay into a primary-primary dimuon. Additional type-B systematic uncertainties associated with this measurement due to and and amount to 1.9% and 4.5%, respectively, are included. This brings the type-B systematic uncertainties on to 11.2%.
The total cross section, , within the mass range, GeV/, and rapidity and ranges, and 1 GeV/, respectively, is extracted by integrating , which resulted nb.
IV.2 Total cross section
To extrapolate from the differential cross section in the muon decay channel within the acceptance of muon arms to a total cross section, the differential cross section is scaled by the ratio of pairs that decay to dimuons within the measured region to those over the entire kinematic range. This method is similar to that found in Ref. S. et al. .
The total cross section, , is extrapolated and corrected for the semileptonic branching ratio in the following manner:
| (9) |
where is the branching ratio of to muon through the primary decay channel (=10.99), and , defined as:
| (10) |
which is a factor used to convert from the visible kinematic region to full phase space. The factor is determined from pythia and mc@nlo simulations. It is taken as the average value, , of ps pythia6 (CTEQ6LL), ps pythia6 (CTEQ5M1), pythia8 (CTEQ6LL) and mc@nlo (CTEQ5M) as listed in Table 2.
| Simulation | Scale Factor |
|---|---|
| pythia8 (CTEQ6LL) | 0.00210 |
| ps pythia6 (CTEQ6LL) | 0.00207 |
| ps pythia6 (CTEQ5M1) | 0.00255 |
| mc@nlo (CTEQ5M) | 0.00113 |
| Average Value | 0.00196 |
The difference in the factor due to the different models and parton distribution functions is considered to be a global type-C uncertainty, which amounts to 18.1%. This results in a total cross section of b. Type-B systematic uncertainties are from the differential cross section while global uncertainties are the quadrature sum of type-C from the differential cross section and uncertainties arising from the extrapolation.
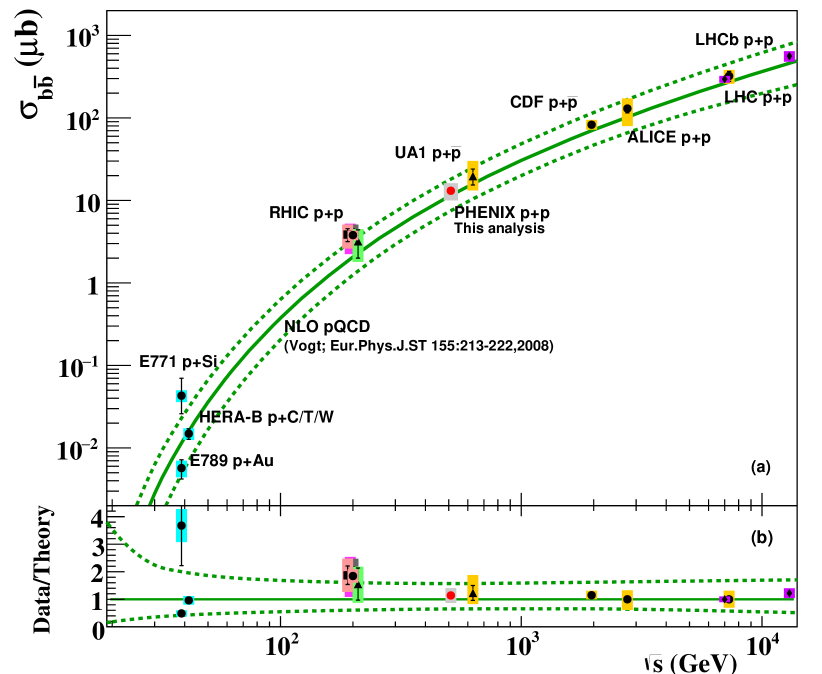
The measured at GeV is shown in Fig. 9 and compared to measurements from other experiments Adare et al. (2009b); Alexopoulos et al. (1999); Jansen et al. (1995); Abt et al. (2006); Albajar et al. (1991); Abelev et al. (2013). The solid line is the cross section from NLO pQCD calculations Vogt (2008) and the dashed lines are error bands, and they are obtained by varying the renormalization scale, factorization scale and bottom quark mass. At GeV, the NLO pQCD calculation predicts b, which is consistent with the extrapolated total cross section using the current dimuon analysis within uncertainties. Figure 9 also shows the ratio of data to theory.
IV.3 Azimuthal correlations and pair
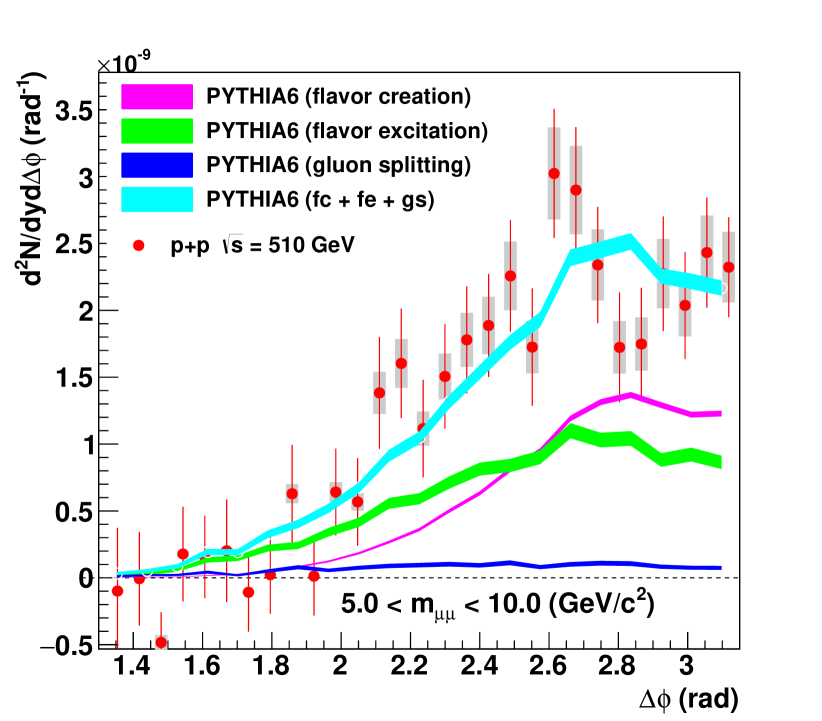
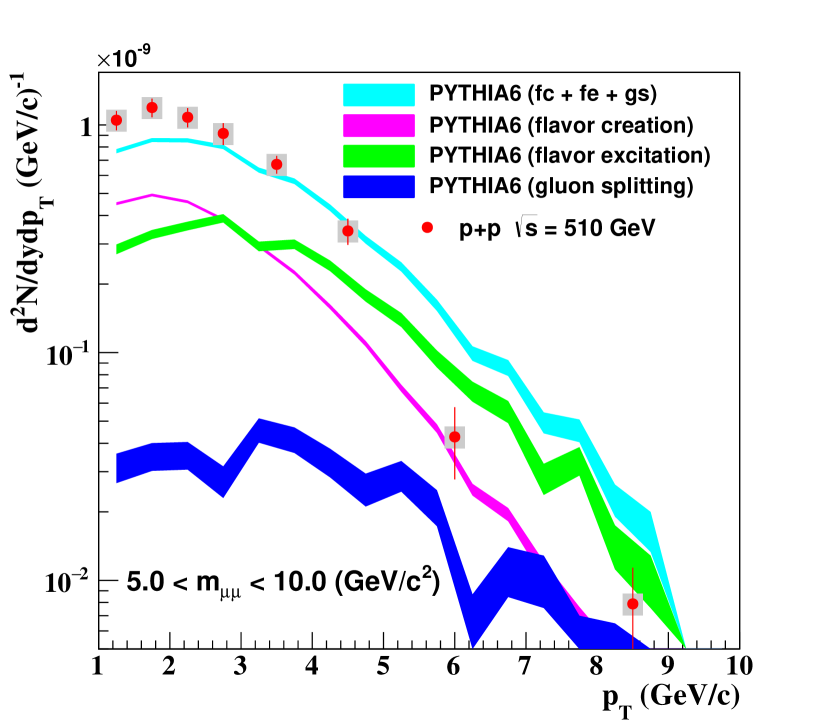
The like-sign pair yield from decays is shown in Fig. 11 and Fig. 11 as a function of and pair , respectively. The spectra are compared to model calculations based on ps pythia6 that are normalized by fitting the subprocesses sum to the data Aidala et al. (2019). The generated pairs are filtered with the same kinematic cuts that are applied in the data analysis.
The azimuthal opening angle distribution from ps pythia6 shows a similar pattern to that of the data, an increase until 2.6 rad and then drop, and it is consistent with the data with , when considering the quadrature sum of the statistical and systematic uncertainties. The data show steeper dependence than that of ps pythia6 but they are still consistent when considering the large statistical and systematic uncertainties. We note that flavor creation fits the data much better than any other subprocess with . These results show similar behavior to that observed at 200 GeV Aidala et al. (2019) where the data favors a dominant mix of flavor creation and flavor excitation subprocesses over gluon splitting.
V Summary and Conclusion
In summary, we presented first measurements of the differential cross section for dimuons from bottom quark-antiquark production in + collisions at GeV, which we found to be: nb. The analysis technique is based on the yield of high-mass correlated like-sign dimuons from parity-violating decays of meson pairs at forward and backward rapidities. Using a model dependent extrapolation, the measured differential cross section is converted to a total cross section of b. This extrapolated total cross section is consistent with NLO pQCD calculations within uncertainties. This agreement with NLO pQCD calculations at GeV is better than what was observed at 200 GeV Aidala et al. (2019), possibly indicating a better match with NLO pQCD calculations at higher energies. However, the measurement at GeV used the unlike-sign pairs method and could be impacted by the presence of Drell-Yan process and resonances.
The azimuthal opening angle between the muons from decays and the pair distributions are compared to distributions generated using ps pythia6 Sjostrand et al. (2001), which includes NLO processes. While the data tend to have a wider azimuthal distribution than ps pythia6 calculations and present a steeper distribution, both are still consistent within uncertainties with ps pythia6, where flavor creation and flavor excitation subprocesses are dominant. This is similar to what was observed at 200 GeV Aidala et al. (2019).
Acknowledgements.
We thank the staff of the Collider-Accelerator and Physics Departments at Brookhaven National Laboratory and the staff of the other PHENIX participating institutions for their vital contributions. We acknowledge support from the Office of Nuclear Physics in the Office of Science of the Department of Energy, the National Science Foundation, Abilene Christian University Research Council, Research Foundation of SUNY, and Dean of the College of Arts and Sciences, Vanderbilt University (U.S.A), Ministry of Education, Culture, Sports, Science, and Technology and the Japan Society for the Promotion of Science (Japan), Conselho Nacional de Desenvolvimento Científico e Tecnológico and Fundação de Amparo à Pesquisa do Estado de São Paulo (Brazil), Natural Science Foundation of China (People’s Republic of China), Croatian Science Foundation and Ministry of Science and Education (Croatia), Ministry of Education, Youth and Sports (Czech Republic), Centre National de la Recherche Scientifique, Commissariat à l’Énergie Atomique, and Institut National de Physique Nucléaire et de Physique des Particules (France), Bundesministerium für Bildung und Forschung, Deutscher Akademischer Austausch Dienst, and Alexander von Humboldt Stiftung (Germany), J. Bolyai Research Scholarship, EFOP, the New National Excellence Program (ÚNKP), NKFIH, and OTKA (Hungary), Department of Atomic Energy and Department of Science and Technology (India), Israel Science Foundation (Israel), Basic Science Research and SRC(CENuM) Programs through NRF funded by the Ministry of Education and the Ministry of Science and ICT (Korea). Physics Department, Lahore University of Management Sciences (Pakistan), Ministry of Education and Science, Russian Academy of Sciences, Federal Agency of Atomic Energy (Russia), VR and Wallenberg Foundation (Sweden), the U.S. Civilian Research and Development Foundation for the Independent States of the Former Soviet Union, the Hungarian American Enterprise Scholarship Fund, the US-Hungarian Fulbright Foundation, and the US-Israel Binational Science Foundation.References
- Mangano et al. (1992) M. L. Mangano, P. Nason, and G. Ridolfi, “Heavy-quark correlations in hadron collisions at next-to-leading order,” Nucl. Phys. B 373, 295 (1992).
- Alexopoulos et al. (1999) T. Alexopoulos et al. (E771 Collaboration), “Measurement of the Cross Section in 800 GeV/ Proton-Silicon Interactions,” Phys. Rev. Lett. 82, 41 (1999).
- Jansen et al. (1995) D. M. Jansen et al., “Measurement of the Bottom-Quark Production Cross Section in 800 GeV/ Proton-Gold Collisions,” Phys. Rev. Lett. 74, 3118 (1995).
- Abt et al. (2006) I. Abt et al. (HERA-B Collaboration), “Improved measurement of the production cross section in 920 GeV fixed-target proton-nucleus collisions,” Phys. Rev. D 73, 052005 (2006).
- Acosta et al. (2005) D. Acosta et al. (CDF Collaboration), “Measurement of the meson and -hadron production cross sections in collisions at GeV,” Phys. Rev. D 71, 032001 (2005).
- Aaij et al. (2010) R. Aaij et al. (LHCb Collaboration), “Measurement of at in the forward region,” Phys. Lett. B 694, 209 (2010).
- (7) R Aaij et al. (LHCb Collaboration), “Measurement of B meson production cross-sections in proton-proton collisions at = 7 TeV”, J. High Energy Phys. 08 (2013), 117.
- Aad et al. (2012) G. Aad et al. (ATLAS Collaboration), “Measurement of the b-hadron production cross section using decays to final states in collisions at TeV with the ATLAS detector,” Nucl. Phys. B 864, 341 (2012).
- Abelev et al. (2013) B. Abelev et al. (ALICE Collaboration), “Measurement of electrons from beauty hadron decays in collisions at TeV,” Phys. Lett. B 721, 13 (2013).
- Khachatryan et al. (2011) V. Khachatryan et al. (CMS Collaboration), “Measurement of the Production Cross Section in Collisions at TeV,” Phys. Rev. Lett. 106, 112001 (2011).
- Chatrchyan et al. (2011) S. Chatrchyan et al. (CMS Collaboration), “Measurement of the Production Cross Section in Collisions at TeV,” Phys. Rev. Lett. 106, 252001 (2011).
- (12) S. Chatrchyan et al. (CMS Collaboration), “Measurement of the cross section for production of , decaying to muons in collisions at TeV”, J. High Energy Phys. 06 (2012), 110.
- Adare et al. (2015) A. Adare et al. (PHENIX Collaboration), “Cross section for production via dielectrons in Au collisions at GeV,” Phys. Rev. C 91, 014907 (2015).
- Adare et al. (2009a) A. Adare et al. (PHENIX Collaboration), “Measurement of Bottom Versus Charm as a Function of Transverse Momentum with Electron-Hadron Correlations in Collisions at GeV,” Phys. Rev. Lett. 103, 082002 (2009a).
- Aggarwal et al. (2010) M. M. Aggarwal et al. (STAR Collaboration), “Measurement of the Bottom contribution to non-photonic electron production in collisions at GeV,” Phys. Rev. Lett. 105, 202301 (2010).
- Aidala et al. (2017) C. Aidala et al. (PHENIX Collaboration), “-meson production at forward and backward rapidity in and Cu + Au collisions at GeV,” Phys. Rev. C 96, 064901 (2017).
- Adare et al. (2009b) A. Adare et al. (PHENIX Collaboration), “Dilepton mass spectra in collisions at GeV and the contribution from open charm,” Phys. Lett. B 670, 313 (2009b).
- Aidala et al. (2019) C. Aidala et al. (PHENIX Collaboration), “Measurements of pairs from open heavy flavor and Drell-Yan in collisions at GeV,” Phys. Rev. D 99, 072003 (2019).
- Bean et al. (1987) A. Bean et al. (CLEO Collaboration), “Limits on Mixing and ,” Phys. Rev. Lett. 58, 183 (1987).
- Albrecht et al. (1987) H. Albrecht et al. (ARGUS Collaboration), “Observation of - Mixing,” Phys. Lett. B 192, 245 (1987).
- Buskulic et al. (1994) D. Buskulic et al. (ALEPHI Collaboration), “An investigation of and oscillation,” Phys. Lett. B 322, 441 (1994).
- Albajar et al. (1987) C. Albajar et al. (UA1 Collaboration), “Search for - oscillations at the CERN proton- antiproton collider,” Phys. Lett. B 186, 247 (1987), [Erratum: Phys. Lett. B 197, 565 (1987)].
- Glashow (1961) S. L. Glashow, “Partial Symmetries of Weak Interactions,” Nucl. Phys. 22, 579 (1961).
- Abe et al. (1999) F. Abe et al. (CDF Collaboration), “Measurement of flavor oscillations using jet-charge and lepton flavor tagging in collisions at TeV,” Phys. Rev. D 60, 072003 (1999).
- Olive et al. (2014) K. A. Olive et al. (Particle Data Group), “Review of Particle Physics,” Chin. Phys. C 38, 090001 (2014).
- Sjostrand et al. (2001) T. Sjostrand, P. Eden, C. Friberg, L. Lonnblad, G. Miu, S. Mrenna, and E. Norrbin, “High-energy-physics event generation with PYTHIA 6.1,” Comp. Phys. Commun. 135, 238 (2001).
- Sjbstrand et al. (2015) T. Sjbstrand, S. Ask, J. R. Christiansen, R. Corke, N. Desai, P. Ilten, S. Mrenna, S. Stefan Prestel, C. O. Rasmussen, and P. Z. Skands, “An introduction to pythia8.2,” Comp. Phys. Commun. 191, 159 (2015).
- (28) S. Frixione and B. R. Webber, “Matching NLO QCD Computations and Parton Shower Simulations”, J. High Energy Phys. 06 (2002), 029.
- Adcox et al. (2003) K. Adcox et al. (PHENIX Collaboration), “PHENIX detector overview,” Nucl. Instrum. Methods Phys. Res., Sec. A 499, 469 (2003).
- (30) R. Field and R. C. Group (CDF Collaboration), “pythia Tune A, herwig, and jimmy in Run 2 at CDF”, arXiv:hep-ph/0510198 (2005).
- Agostinelli et al. (2003) S. Agostinelli et al., “geant4 a simulation toolkit,” Nucl. Instrum. Methods Phys. Res., Sec. A 506, 250 (2003).
- Acharya et al. (2020) U. A. Acharya et al. (PHENIX Collaboration), “ and production at forward rapidity in collisions at GeV,” Phys. Rev. D 101, 052006 (2020).
- Aaij et al. (2013) R. Aaij et al. (LHCb Collaboration), “Observation of - oscillations,” Phys. Rev. Lett. 110, 101802 (2013).
- Adare et al. (2011a) A. Adare et al. (PHENIX Collaboration), “Event structure and double helicity asymmetry in jet production from polarized collisions at GeV,” Phys. Rev. D 84, 012006 (2011a).
- (35) R. Brun, F. Carminati, and S. Giani, “geant Detector Description and Simulation Tool”, CERN-W-5013 (1994).
- Adare et al. (2012) A. Adare et al. (PHENIX Collaboration), “Nuclear-modification factor for open-heavy-flavor production at forward rapidity in Cu+Cu collisions at GeV,” Phys. Rev. C 86, 024909 (2012).
- Adare et al. (2018) A. Adare et al. (PHENIX Collaboration), “Cross section and longitudinal single-spin asymmetry for forward production in polarized collisions at GeV,” Phys. Rev. D 98, 032007 (2018).
- Albajar et al. (1990) C. Albajar et al., “A study of the general characteristics of proton-antiproton collisions at to 0.9 TeV,” Nucl. Phys. B 335, 261 (1990).
- Crochet and Braun-Munzinger (2002) P. Crochet and P. Braun-Munzinger, “Investigation of background subtraction techniques for high mass dilepton physics,” Nucl. Instrum. Methods Phys. Res., Sec. A 484, 564 (2002).
- Adler et al. (2003) S. S. Adler et al. (PHENIX Collaboration), “Midrapidity Neutral-Pion Production in Proton-Proton Collisions at GeV,” Phys. Rev. Lett. 91, 241803 (2003).
- Nisius (2014) R. Nisius, “On the combination of correlated estimates of a physics observable,” Eur. Phys. J. C 74, 3004 (2014).
- Adare et al. (2011b) A. Adare et al. (PHENIX Collaboration), “Cross Section and Parity-Violating Spin Asymmetries of Boson Production in Polarized Collisions at GeV,” Phys. Rev. Lett. 106, 062001 (2011b).
- Adare et al. (2009c) A. Adare et al. (PHENIX Collaboration), “Inclusive cross section and double helicity asymmetry for production in collisions at GeV,” Phys. Rev. D 79, 012003 (2009c).
- Vogt (2008) R. Vogt, “The total charm cross-section,” Eur. Phys. J. Special Topics 155, 213 (2008).
- (45) Chekanov S. et al. (ZEUS Collaboration), “Measurement of beauty production from dimuon events at HERA”, J. High Energy Phys. 02 (2009), 032.
- Albajar et al. (1991) C. Albajar et al. (UA1 Collaboration), “Beauty production at the CERN collider,” Phys. Lett. B 256, 121 (1991).