The landscape of disk outflows from black hole - neutron star mergers
Abstract
We investigate mass ejection from accretion disks formed in mergers of black holes (BHs) and neutron stars (NSs). The third observing run of the LIGO/Virgo interferometers provided BH-NS candidate events that yielded no electromagnetic (EM) counterparts. The broad range of disk configurations expected from BH-NS mergers motivates a thorough exploration of parameter space to improve EM signal predictions. Here we conduct 27 high-resolution, axisymmetric, long-term hydrodynamic simulations of the viscous evolution of BH accretion disks that include neutrino emission/absorption effects and post-processing with a nuclear reaction network. In the absence of magnetic fields, these simulations provide a lower-limit to the fraction of the initial disk mass ejected. We find a nearly linear inverse dependence of this fraction on disk compactness (BH mass over initial disk radius). The dependence is related to the fraction of the disk mass accreted before the outflow is launched, which depends on the disk position relative to the innermost stable circular orbit. We also characterize a trend of decreasing ejected fraction and decreasing lanthanide/actinide content with increasing disk mass at fixed BH mass. This trend results from a longer time to reach weak freezout and an increasingly dominant role of neutrino absorption at higher disk masses. We estimate the radioactive luminosity from the disk outflow alone available to power kilonovae over the range of configurations studied, finding a spread of two orders of magnitude. For most of the BH-NS parameter space, the disk outflow contribution is well below the kilonova mass upper limits for GW190814.
keywords:
accretion, accretion disks – dense matter – gravitational waves – hydrodynamics – neutrinos – nuclear reactions, nucleosynthesis, abundances1 Introduction
The Advanced LIGO interferometer has completed three observing runs – with Advanced Virgo joining part of the way – resulting in the official detection of 11 binary black hole (BH) mergers and two neutron star (NS) mergers (Abbott et al., 2019, 2020a; LIGO Scientific Collaboration & Virgo Collaboration, 2020), with many more in candidate status at the time of this writing. The increased sensitivity of the third observing run also yielded an event that can be either a BH-BH or a BH-NS merger (GW190814) (e.g., Abbott et al. 2020b; Coughlin et al. 2020; Ackley et al. 2020; Andreoni et al. 2020; Vieira et al. 2020; Thakur et al. 2020). Only one of these events (GW170817), however, has had electromagnetic (EM) counterparts detected (Abbott et al., 2017). While multiple reasons can account for the lack of an EM detection (such as a large distance, large localization area, galactic extinction, or Sun constraints; e.g. Foley et al. 2020), the possibility remains that these sources were intrinsically fainter than the kilonova from GW170817.
BH-NS mergers can lead to a wide range of ejected masses depending on whether the NS is tidally disrupted by the BH. The outcome depends on the masses of the ingoing BH and NS, as well as on the spin of the BH and the compactness of the NS (e.g., Foucart et al. 2018). The dynamical ejecta emerges as a very neutron-rich, equatorial tidal tail that quickly leaves the system. The nucleosynthesis properties and contribution to the kilonova transient are mostly set at the time of ejection (e.g., Roberts et al. 2017), and its properties can be parameterized by direct comparison with dynamical merger simulations (e.g., Kawaguchi et al. 2016; Krüger & Foucart 2020).
The accretion disk, on the other hand, ejects mass on a longer timescale, as angular momentum is transported initially by gravitational torques and later by magnetohydrodynamic (MHD) turbulence (see, e.g., Fernández & Metzger 2016; Shibata & Hotokezaka 2019 for reviews). This longer evolutionary timescale allows weak interactions to modify the composition, resulting in a different -process yield (and possibly a different kilonova color) than the dynamical ejecta. The complexity of this evolution makes it very expensive to realistically model the disk, however. Only a handful of three-dimensional general-relativistic (GR) MHD simulations of disks around BHs have been carried out including at least some important microphysics or neutrino effects (Siegel & Metzger, 2017; Hossein Nouri et al., 2018; Siegel & Metzger, 2018; Fernández et al., 2019; Miller et al., 2019; Christie et al., 2019). Furthermore, all of these simulations either focus on a narrow subset of parameter space and/or do not evolve the system for long enough to achieve completion of mass ejection.
More extensive studies of BH accretion disks have been carried out using axisymmetric hydrodynamic simulations with a wide variety of approximations to the physics (Fernández & Metzger, 2013; Just et al., 2015; Fernández et al., 2015a; Fujibayashi et al., 2020). None of these studies covers a significant fraction of all the possible BH accretion disk configurations, however.
Despite missing the magnetic field, hydrodynamic simulations can provide a good description of the late-time thermal component of the outflow that arises when weak interactions freeze out (Metzger et al., 2009) and heating of the disk by viscous stresses (in lieu of MHD turbulence) is unbalanced. Close comparison between GRMHD and hydrodynamic simulations show that the latter provide a lower limit to the fraction of the disk ejected, with magnetic enhancements dependent on the strength of the initial poloidal field in the disk (Fernández et al., 2019; Christie et al., 2019).
Here we carry out an extensive set of long-term hydrodynamic simulations of accretion disks around BH remnants, with the aim of sampling the entirety of the parameter space resulting from BH-NS mergers, and thereby improving parameter estimation models that take disk outflow properties as input (e.g., Barbieri et al. 2019; Hinderer et al. 2019; Coughlin et al. 2020). Along the way, a broad probe of parameter space allows to identify trends in the disk ejection physics, helping to focus on areas where improvements in the physics (e.g. neutrino transport) have the most impact. Finally, by providing a lower limit to the disk mass ejected, we are also estimating the lower limit to the raw radioactive heating available to power kilonova transients.
The structure of the paper is as follows. Section 2 presents our methods, including our choice of initial conditions from the plausible parameter space of BH-NS mergers. Section 3 presents our results, divided into mass ejection, outflow composition, and implications for EM counterparts. We close with a summary and discussion in Section 4.
2 Methods
2.1 Initial conditions
In order to sample representative initial disk masses for our simulations, we map the parameter space of BH-NS merger remnants using analytical formulae that are calibrated to numerical relativity simulations. For a given ingoing BH mass and NS mass , we uniformly sample the range km for NS radii and for the ingoing BH spin, and compute distributions of (1) the remnant baryon mass left outside the BH using the formula of Foucart et al. (2018), (2) the disk mass using the formula of Krüger & Foucart (2020) for the dynamical ejecta, and (3) the post-merger BH mass and its spin using the formulae of Pannarale (2014) and the output from steps (1)-(2). This approach is intended to be agnostic about the properties of the EOS of dense matter and initial BH spin distribution, within plausible limits.
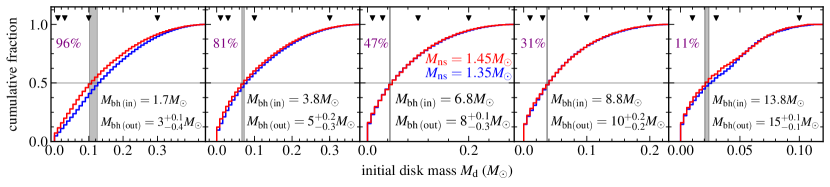
The resulting cumulative distributions of initial disk masses are shown in Figure 1 for two NS mases and ingoing BH masses such that the median value of is . The lowest post-merger BH mass is chosen to explore the hypothetical case of a very low-mass ingoing BH, or the prompt collapse of a NS-NS system. The highest BH mass is chosen such that at least of mergers result in disruption. Median disk masses range from for the post-merger BH, to for the BH. In most cases, sensitivity to the specific choice of NS mass does alter the shape of the histogram but not the extreme values. The post-merger BH spin distributions have medians in the range , except for the lowest mass BHs considered, which have spins .
For each post-merger BH mass, Figure 1 shows the disk masses sampled in our study. The lowest disk mass in all cases is taken to be , which is optically thin to neutrinos, while the largest disk mass is such that it is at the uppermost end of plausible values. In all of our models, we take the spin of the post-merger BH to be , which while somewhat lower than the median values of the distributions obtained, lies within the range of plausible values (except for ) and does not demand a prohibitively small time step. Furthermore, the effect of BH spin on the disk outflow properties is known, with more mass with higher average electron fraction being ejected for higher BH spins (Fernández et al., 2015a; Fujibayashi et al., 2020).
Our simulations start from idealized equilibrium tori (§2.2) which approach a Keplerian angular velocity distribution after a few orbits. This equilibrium configuration requires more parameters in addition to the disk mass: a radius of maximum density, an entropy (internal energy content), and an electron fraction (composition). While these parameter choices would not be necessary if we mapped the disk directly from a merger simulation, our broad coverage of possible BH-NS combinations would be limited by accessible merger simulation data. The remaining initial disk parameters are therefore chosen by inspecting the output of numerical relativity simulations of BH-NS mergers and making educated guesses about these values in regimes not covered by simulations.
We adopt initial disk radii that roughly follow the location of density maxima outside of the BH in published BH-NS simulations (Etienne et al., 2009; Kyutoku et al., 2010; Foucart et al., 2011; Foucart et al., 2013, 2014; Kawaguchi et al., 2015; Kyutoku et al., 2015; Foucart et al., 2017; Brege et al., 2018). This radius of maximum density is not well defined, however, since it depends on (1) the time at which it is measured, (2) the metric, and (3) on whether the local density, surface density, or enclosed mass are reported. Since there is no consistency across the literature for this quantity, we adopt a fiducial set of initial disk radii km for post-merger BH masses , respectively.
The entropy of all disks is taken to be per baryon, which results in ratios of isothermal sound speed to orbital speed at the point of maximum density. While this choice has some effect on the amount of mass ejected, we use a constant value for uniformity. Finally, the default electron fraction of the disks is set to , although we vary this parameter in our simulations given that it is dependent on the quality of the neutrino transport implementation in the merger simulation, and has a non-negligible effect on the disk outflow composition.
2.2 Hydrodynamic Simulations
We perform time-dependent hydrodynamic simulations with FLASH version 3.2 (Fryxell et al., 2000; Dubey et al., 2009), with the modifications described in Fernández & Metzger (2013), Metzger & Fernández (2014), Fernández et al. (2015a), and Lippuner et al. (2017). The code solves the Euler equations in axisymmetric spherical polar coordinates , subject to source terms that include the pseudo-Newtonian gravitational potential of a spinning BH (Artemova et al., 1996) without disk self-gravity, shear viscosity with an parameterization (Shakura & Sunyaev, 1973), and a leakage scheme for neutrino emission, with absorption included as a disk-like light bulb (Fernández & Metzger, 2013; Metzger & Fernández, 2014). We only include electron type neutrinos/antineutrinos interacting with nucleons via charged-current weak interactions. The code employs the equation of state (EOS) of Timmes & Swesty (2000) with the abundances of neutrons, protons, and alpha particles in nuclear statistical equilibrium (NSE) above a temperature K and accounting for the nuclear binding energy of these particles. The electron-positron quantities are extended above the high-density limit of the table using analytic expressions (Bludman & van Riper, 1978; Bethe et al., 1980).
The initial condition is an equilibrium torus with constant angular momentum, entropy, and electron fraction, with mass fractions assumed to be in NSE (e.g., Fernández & Metzger 2013). Parameters are chosen according to §2.1. The floor of density is set to g cm-3 at , and has an initial radial dependence . For , the radial exponent of the floor is smoothly brought to zero on a timescale of orbital times at , reaching a flat floor in this region (Fernández et al. 2019, see also Just et al. 2015). The initial ambient density is set at times the floor.
The computational domain extends from an inner radius midway between the radius of the innermost stable circular orbit (ISCO) and the BH horizon, to an outer radius , with the polar angle spanning the range . The grid is discretized logarithmically in radius, using cells per decade, and a polar grid equispaced in using cells. On the equatorial plane, this results in a spacing . This resolution is double that of the models in Fernández et al. (2017), equivalent to that of the high-resolution models of Fernández & Metzger (2013) and Fernández et al. (2015a), and the same as in Fahlman & Fernández (2018) and the hydrodynamic models of Fernández et al. (2019). The boundary conditions are set to outflow in radius and reflecting in .
2.3 Nuclear Reaction Network Post-Processing
Passive tracer particles are initially placed in the disk following the density distribution. For each hydrodynamic simulation we employ particles, each representing an equal amount of mass. Particles are advected with the flow and record various kinematic and thermodynamic quantities as a function of time. Particles that are ejected with positive Bernoulli parameter beyond a radius of cm by the end of the simulation are considered to be part of the disk outflow.
Outflow trajectories are post-processed with the nuclear reaction network SkyNet (Lippuner & Roberts, 2017), using the same settings as in Lippuner et al. (2017). The network employs 7843 nuclides and more than reactions, including strong forward reaction rates from the REACLIB database (Cyburt et al., 2010) with inverse rates computed from detailed balance; spontaneous and neutron-induced fission rates from Frankel & Metropolis (1947), Mamdouh et al. (2001), Wahl (2002), and Panov et al. (2010); weak rates from Fuller et al. (1982), Oda et al. (1994), Langanke & Martínez-Pinedo (2000), and the REACLIB database; and nuclear masses from the REACLIB database, which includes experimental values were available, or otherwise theoretical masses from the finite-range droplet macroscopic model (FRDM) of Möller et al. (2016).
The rates of electron neutrino/antineutrino absorption/emission recorded by the trajectory are included in the evolution of the proton and neutron fraction. Likewise, the temperature and entropy are evolved self-consistently by accounting for nuclear heating from the network, as well as viscous heating and neutrino heating/cooling in the hydrodynamic simulation as recorded by the trajectory.
Processing begins when the trajectory reaches GK for the last time, or when the temperature is maximal if lower than GK at all times. For the portion of the evolution in which the temperature is higher than GK, abundances are evolved in NSE, subject to neutrino interactions, while full network integration is carried out at lower temperatures. Trajectories are extended beyond the end of the simulation ( s) by assuming that the density decays with time as , to allow -process nuclei with long half-lives to decay. Since the -process is complete by the time this transition is made, most of the nuclear heating has already been deposited and the exact time dependence of the density decay is not important. While trajectories are evolved until yr, information is extracted at day and week to estimate the properties of the kilonova at peak.
2.4 Models Evolved
Table 1 shows all of the hydrodynamic models we evolve. As a baseline set, we take disks with initial conditions as described in §2.1: black hole and disk masses as in Figure 1, initial entropy per baryon, and initial electron fraction . Model names follow the convention bXXdYY, where XX and YY refer to the BH mass and disk mass, respectively. Tori are constructed as an equilibrium solution to the momentum equation with constant Bernoulli parameter, constant angular momentum, and the pseudo-Newtonian potential of the BH (Fernández & Metzger, 2013). The torus shape is controlled by a dimensionless distortion parameter (Stone et al., 1999) which is solved for by fixing the entropy, , and torus mass. The distortion parameter is related to the torus initial Bernoulli parameter , black hole mass , and radius of initial density peak by
| (1) |
The baseline set is evolved with a viscosity parameter
To assess the effects of initial composition, we evolve a few models with lower initial electron fraction than the baseline set . Likewise, we evolve two models with higher viscosity parameter, .
All hydrodynamic models are evolved for orbits at the initial density peak radius, which corresponds to s of physical time (Table 1). This time is chosen such that the mass ejection from the disk is mostly complete. Tracer particles from each simulation are then post-processed with the nuclear reaction network as described in §2.3
| Model | |||||||
|---|---|---|---|---|---|---|---|
| () | () | (km) | (s) | ||||
| b03d01 | 3 | 0.01 | 50 | 0.20 | 1.52 | 0.03 | 16.5 |
| b03d03 | 0.03 | 1.82 | |||||
| b03d10 | 0.10 | 2.40 | |||||
| b03d30 | 0.30 | 3.37 | |||||
| b05d01 | 5 | 0.01 | 1.39 | 12.2 | |||
| b05d03 | 0.03 | 1.59 | |||||
| b05d10 | 0.10 | 1.97 | |||||
| b05d30 | 0.30 | 2.57 | |||||
| b08d01 | 8 | 0.01 | 60 | 1.30 | 12.1 | ||
| b08d03 | 0.03 | 1.43 | |||||
| b08d10 | 0.10 | 1.67 | |||||
| b08d20 | 0.20 | 1.87 | |||||
| b10d01 | 10 | 0.01 | 90 | 1.20 | 20.6 | ||
| b10d03 | 0.03 | 1.30 | |||||
| b10d10 | 0.10 | 1.46 | |||||
| b10d20 | 0.20 | 1.59 | |||||
| b15d01 | 15 | 0.01 | 120 | 1.15 | 25.4 | ||
| b15d03 | 0.03 | 1.22 | |||||
| b15d10 | 0.10 | 1.32 | |||||
| b03d01-y10 | 3 | 0.01 | 50 | 0.10 | 1.50 | 16.5 | |
| b03d30-y10 | 0.30 | 3.30 | |||||
| b08d03-y10 | 8 | 0.03 | 60 | 1.42 | 12.1 | ||
| b03d01-y15 | 3 | 0.01 | 50 | 0.15 | 1.51 | 16.5 | |
| b03d30-y15 | 0.30 | 3.32 | |||||
| b08d03-y15 | 8 | 0.03 | 60 | 1.43 | 12.1 | ||
| b03d01-v10 | 3 | 0.01 | 50 | 0.20 | 1.52 | 0.10 | 16.5 |
| b08d03-v10 | 8 | 0.03 | 60 | 1.43 | 12.1 |
3 Results
The overall evolution of neutrino cooled accretion disks follows well-known stages (e.g., Ruffert & Janka 1999; Popham et al. 1999; Di Matteo et al. 2002; Setiawan et al. 2006; Chen & Beloborodov 2007; Lee et al. 2009). Depending on the initial disk mass, neutrinos can be trapped or escape freely. In the former case, an initial optically thick phase ensues until the density has decreased sufficiently for transparency. Thereafter, neutrino cooling is important compared to viscous heating, the inner disk is not too thick vertically, and accretion proceeds efficiently. After about a viscous time few ms (with the isothermal sound speed and the orbital frequency; Shakura & Sunyaev 1973), the density becomes low enough that weak interactions freeze out, shutting down cooling (e.g., Metzger et al. 2009). At this point, the disk is radiatively inefficient, with viscous heating and nuclear recombination of particles being unbalanced, thus an outflow is launched until no more mass is available to be ejected.
In the absence of magnetic fields, this thermal outflow is the only relevant mass ejection channel when a BH sits at the center, as neutrino-driven winds are weak given that self-irradiation is not efficient (e.g., Just et al. 2015). A comparison with long-term GRMHD simulations shows that the outflow from hydrodynamic simulations is of similar quantity and has similar velocities as the analog process occurring due to dissipation of MHD turbulence (Fernández et al., 2019). The magnetic field provides for additional, faster components that can eject a comparable amount of mass than the thermal outflow.
In the following, we discuss mass ejection properties across the range of models we evolve, the composition of these ouflows, and the implications for EM counterparts of BH-NS mergers.
| Model | |||||||||||
|---|---|---|---|---|---|---|---|---|---|---|---|
| () | () | ||||||||||
| b03d01 | 0.60 | 0.21 | 0.21 | 3.4 | 0.28 | 0.75 | 0.25 | 0.18 | 0.10 | 8.9 | 0.99 |
| b03d03 | 0.57 | 0.19 | 3.3 | 0.28 | 0.84 | 0.16 | 0.09 | 0.03 | 21 | 2.2 | |
| b03d10 | 1.8 | 0.18 | 3.4 | 0.29 | 0.93 | 0.07 | 0.03 | 0.01 | 60 | 5.9 | |
| b03d30 | 4.8 | 0.16 | 3.1 | 0.29 | 0.86 | 0.14 | 0.08 | 0.05 | 150 | 17 | |
| b05d01 | 1.00 | 0.11 | 0.11 | 3.4 | 0.29 | 0.72 | 0.28 | 0.20 | 0.09 | 4.5 | 0.51 |
| b05d03 | 0.32 | 0.11 | 3.4 | 0.30 | 0.87 | 0.13 | 0.04 | 0.02 | 12 | 1.2 | |
| b05d10 | 0.98 | 0.09 | 3.5 | 0.31 | 0.98 | 0.02 | 0.01 | 0.01 | 30 | 2.8 | |
| b05d30 | 2.7 | 0.09 | 3.1 | 0.31 | 0.98 | 0.02 | 0.02 | 0.01 | 72 | 6.3 | |
| b08d01 | 1.33 | 0.05 | 0.05 | 3.3 | 0.28 | 0.66 | 0.34 | 0.25 | 0.12 | 2.3 | 0.25 |
| b08d03 | 0.15 | 0.05 | 3.9 | 0.30 | 0.82 | 0.18 | 0.08 | 0.05 | 5.5 | 0.58 | |
| b08d10 | 0.49 | 0.05 | 3.6 | 0.33 | 0.99 | 0.01 | 0.01 | 0.00 | 13 | 1.1 | |
| b08d20 | 0.87 | 0.04 | 3.9 | 0.33 | 1.00 | 0.00 | 0.00 | 0.00 | 19 | 1.6 | |
| b10d01 | 1.11 | 0.09 | 0.09 | 3.4 | 0.29 | 0.72 | 0.28 | 0.20 | 0.12 | 3.9 | 0.47 |
| b10d03 | 0.27 | 0.09 | 3.4 | 0.31 | 0.86 | 0.14 | 0.06 | 0.02 | 8.6 | 0.99 | |
| b10d10 | 0.90 | 0.09 | 3.3 | 0.33 | 0.98 | 0.02 | 0.02 | 0.01 | 23 | 2.5 | |
| b10d20 | 1.7 | 0.08 | 3.5 | 0.34 | 0.99 | 0.01 | 0.01 | 0.00 | 40 | 4.3 | |
| b15d01 | 1.25 | 0.06 | 0.06 | 3.7 | 0.27 | 0.63 | 0.37 | 0.27 | 0.14 | 2.9 | 0.35 |
| b15d03 | 0.19 | 0.06 | 3.5 | 0.30 | 0.79 | 0.21 | 0.12 | 0.04 | 6.8 | 0.80 | |
| b15d10 | 0.62 | 0.06 | 3.5 | 0.34 | 0.98 | 0.02 | 0.01 | 0.01 | 16 | 1.6 | |
| b03d01-y10 | 0.60 | 0.21 | 0.21 | 3.4 | 0.26 | 0.62 | 0.38 | 0.32 | 0.25 | 9.0 | 1.1 |
| b03d30-y10 | 4.1 | 0.14 | 3.4 | 0.28 | 0.86 | 0.14 | 0.10 | 0.08 | 130 | 13 | |
| b08d03-y10 | 1.33 | 0.16 | 0.05 | 3.7 | 0.29 | 0.75 | 0.25 | 0.20 | 0.16 | 6.0 | 0.71 |
| b03d01-y15 | 0.60 | 0.20 | 0.20 | 3.3 | 0.27 | 0.69 | 0.31 | 0.25 | 0.19 | 8.9 | 1.1 |
| b03d30-y15 | 4.3 | 0.14 | 2.8 | 0.28 | 0.85 | 0.15 | 0.12 | 0.09 | 120 | 13 | |
| b08d03-y15 | 1.33 | 0.15 | 0.05 | 3.7 | 0.30 | 0.76 | 0.24 | 0.18 | 0.10 | 5.5 | 0.64 |
| b03d03-v10 | 0.60 | 0.28 | 0.28 | 5.6 | 0.27 | 0.55 | 0.45 | 0.41 | 0.34 | 13 | 1.2 |
| b08d03-v10 | 1.33 | 0.31 | 0.10 | 5.5 | 0.31 | 0.77 | 0.23 | 0.20 | 0.15 | 12 | 0.83 |
3.1 Mass ejection
The disk mass ejection rate in all directions is measured at a radius cm, far enough outside the disk that mostly complete ejection is achieved before the disk viscously spreads to that radius. Material is considered to be unbound when its Bernoulli parameter
| (2) |
is positive. In equation (2), and are the radial and meridional velocities, is the specific internal energy, is the pressure, is the density, is the specific angular momentum, and is the gravitational potential. Table 2 shows the ejected outflow mass – the time integral of over the simulation – for all models.
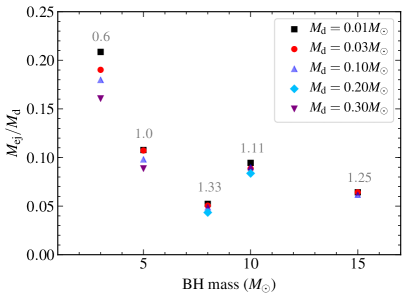
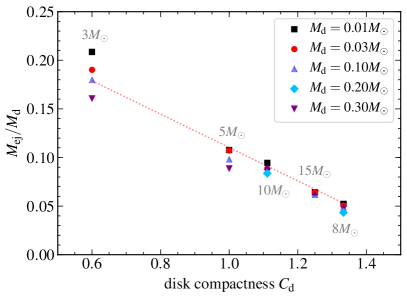
The fraction of the initial disk mass ejected is shown in Figure 2 for the baseline model sequence. This fraction ranges from for the heaviest disk with to for the lightest disk around the BH. The most important trend in mass ejection apparent from Table 2 is a monotonically decreasing ejected fraction with strength of gravity at the disk, . For convenience, we define a disk compactness parameter as
| (3) |
Figure 2 also shows that the dependence of the ejected fraction with compactness is approximately linear, although at low BH masses the disk mass becomes an additional factor. This dependence on the strength of gravity has previously been documented in Fernández & Metzger (2013), and is also apparent from the results of Just et al. (2015), Fernández et al. (2017), and Fujibayashi et al. (2020), although this is the first time that it is sampled over an extended region of parameter space.
The second mass ejection trend in all models of the baseline sequence is a monotonic decrease in the ejected fraction with increasing disk mass at constant compactness. Figure 2 shows that the strength of this dependence on disk mass is itself a function of disk compactness, with low-compactness disks being the most sensitive to the initial disk mass, while in high compactness systems this property has a smaller impact on the ejected fraction.
The physical origin of these trends in mass ejection can be traced back to the nature of the ejection mechanism. Most of the outflow is launched once weak interactions freeze out in the disk, removing the source of cooling. The fraction of the disk mass available to be ejected depends on how much has already been lost to accretion onto the BH by the time freezout occurs. This interplay is illustrated in Figure 3, which shows the evolution of the mass accretion rate () and cumulative mass accreted at the ISCO (), mass ejection rate at large radii (), and the electron neutrino luminosity.
In the model with the highest compactness (b08d03), accretion starts much earlier when measured in orbital times than in the lower-compactness models. By the time weak interactions freeze out (steep plummet in neutrino luminosity at about orbits) a significant fraction of the disk () has already been accreted to the BH. This earlier onset of accretion, despite having the same viscosity parameter, is due to the disk being closer to the ISCO. In terms of dimensionless numbers: for , respectively.
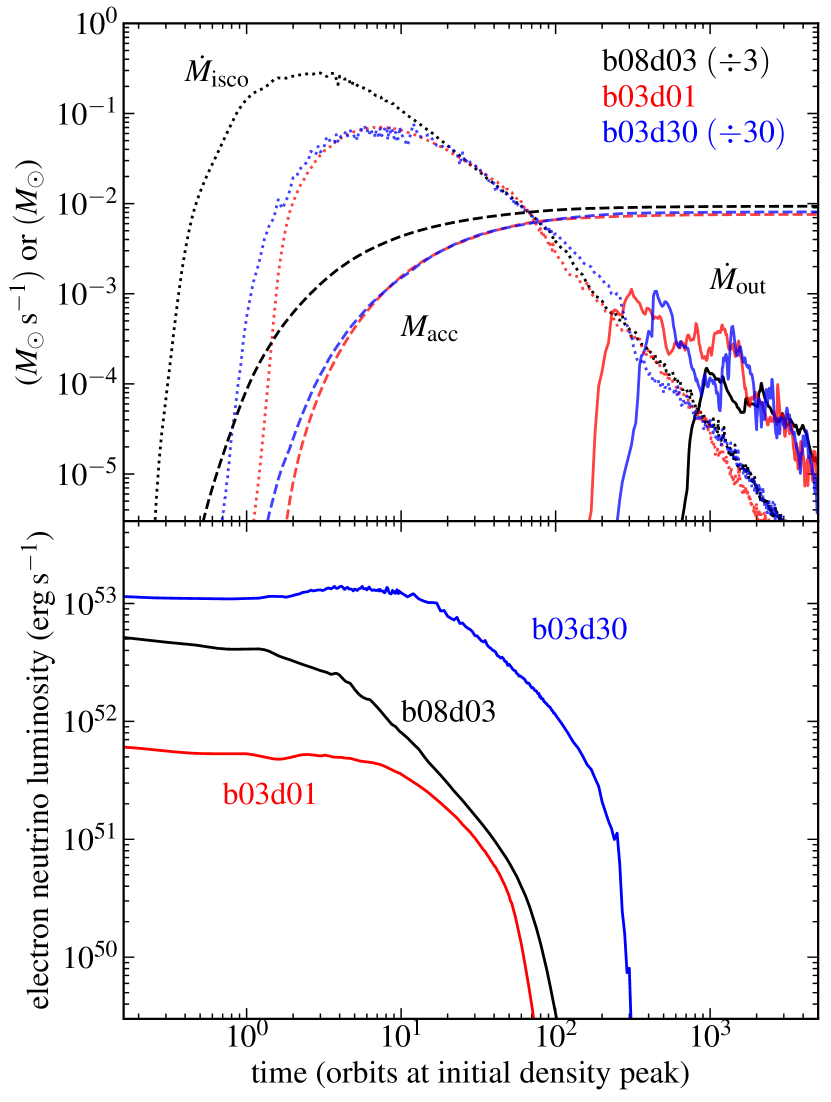
For disks of the same compactness, the evolution of the accretion rate is very similar. Figure 3 shows that mass ejection begins later in the more massive disk, which also takes longer time to reach freezout of weak interactions. More massive disks are more optically thick to neutrinos owing to their higher initial density, and for the same strength of viscosity, it takes more orbits for the density to decrease to a level where neutrino processes are no longer effective in cooling the disk. At the time when the neutrino luminosity reaches erg s-1, models b03d01 and b03d30 have accreted and of their initial disk masses, respectively.
| Model | ||||||||||||
|---|---|---|---|---|---|---|---|---|---|---|---|---|
| b03d01 | 0.81 | 2.1 | 2.6 | -0.8 | 0.3 | 0.08 | 0.42 | 0.45 | 0.07 | 0.01 | 0.03 | 0.05 |
| b03d03 | 0.79 | 1.7 | 2.5 | -1.1 | 0.3 | 0.08 | 0.64 | 0.61 | 0.15 | 0.04 | -0.03 | 0.12 |
| b03d10 | 0.91 | 1.5 | 2.8 | -1.6 | 0.3 | 0.09 | 1.00 | 0.91 | 0.25 | 0.07 | -0.09 | 0.18 |
| b03d30 | 1.12 | 1.3 | 2.9 | -1.9 | 0.3 | 0.09 | 1.12 | 1.04 | 0.26 | 0.08 | -0.08 | 0.18 |
| b08d01 | 0.51 | 3.5 | 3.9 | -0.7 | 0.3 | 0.09 | 0.34 | 0.41 | 0.03 | 0.01 | 0.07 | 0.02 |
| b08d03 | 0.55 | 3.4 | 4.2 | -1.1 | 0.4 | 0.10 | 0.53 | 0.58 | 0.07 | 0.02 | 0.05 | 0.05 |
| b08d10 | 0.60 | 3.2 | 4.5 | -1.7 | 0.4 | 0.11 | 0.81 | 0.83 | 0.13 | 0.04 | 0.02 | 0.09 |
| b08d20 | 0.66 | 3.1 | 4.9 | -2.2 | 0.4 | 0.13 | 1.10 | 1.08 | 0.21 | 0.06 | -0.02 | 0.15 |
| b03d01-y10 | 0.79 | 2.1 | 2.6 | -0.8 | 0.3 | 0.16 | 0.37 | 0.48 | 0.07 | 0.01 | 0.11 | 0.05 |
| b03d01-y15 | 0.78 | 2.1 | 2.6 | -0.8 | 0.3 | 0.12 | 0.40 | 0.47 | 0.07 | 0.01 | 0.07 | 0.05 |
| b03d01-v10 | 0.94 | 2.5 | 2.7 | -0.5 | 0.3 | 0.07 | 0.22 | 0.25 | 0.05 | 0.02 | 0.04 | 0.03 |
| b03d30-y10 | 1.16 | 1.4 | 3.1 | -2.1 | 0.3 | 0.19 | 1.16 | 1.16 | 0.27 | 0.08 | 0.00 | 0.19 |
| b03d30-y15 | 1.05 | 1.3 | 2.7 | -1.8 | 0.3 | 0.13 | 1.05 | 1.01 | 0.25 | 0.07 | -0.04 | 0.17 |
| b08d03-y10 | 0.53 | 3.3 | 4.0 | -1.1 | 0.3 | 0.19 | 0.46 | 0.60 | 0.07 | 0.02 | 0.14 | 0.05 |
| b08d03-y15 | 0.55 | 3.4 | 4.3 | -1.2 | 0.3 | 0.15 | 0.55 | 0.65 | 0.07 | 0.02 | 0.10 | 0.05 |
| b08d03-v10 | 0.67 | 4.2 | 4.9 | -1.0 | 0.4 | 0.12 | 0.40 | 0.48 | 0.06 | 0.02 | 0.08 | 0.04 |
The density dependence of the neutrino optical depth is not the only factor influencing the freezout time. Table 1 and equation (1) show that to keep the entropy constant, initial equilibrium disks with higher masses also have a higher internal energy content and therefore higher temperatures. This effect is stronger for lower compactness configurations. While disk material is more weakly bound, it can also radiate neutrinos at relevant levels for a longer time, and so this acts in the direction of delaying the onset of mass ejection. The post-merger entropy of the disk is thus an important parameter to keep track of in dynamical merger simulations given its effect on mass ejection efficiency.
Using the outflow trajectories from hydrodynamic simulations we can further analyze the energetics of mass ejection. In particular, we can quantify the strength and importance of different processes that change the heat content of the fluid: viscous heating, neutrino heating/cooling, and nuclear recombination of alpha particles. For each outflow trajectory, we compute the time integral of the local energy source term, yielding the heat gained or lost by the fluid element per unit mass:
| (4) | |||||
| (5) | |||||
| (6) | |||||
| (7) |
where stand for viscous heating and neutrino heating/cooling, respectively, erg g-1 is the specific nuclear binding energy of alpha particles, is the mass fraction of alpha particles, is the maximum time for the particle evolution, either when it leaves the outer boundary of the computational domain or when the simulation ends, whichever is shorter, and is the heat gained or lost from process . The resulting quantities are shown in Table 3 for selected models.
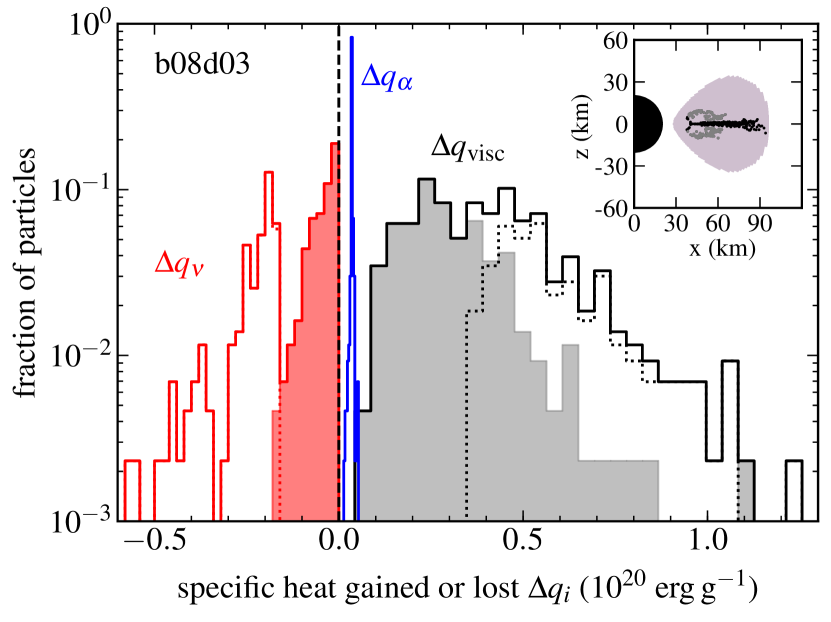
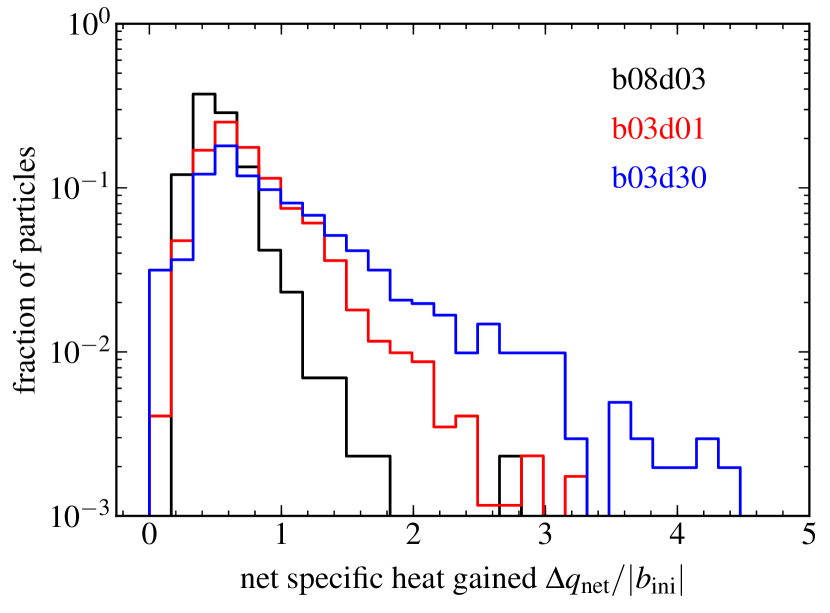
Figure 4 shows the distribution of net heat gained (eq. 7) by outflow particles for the same set of simulations shown in Figure 3. Specific energies are shown in units of the initial Bernoulli parameter of the disk (equation 1). In all three models, the distribution shows a peak at around of , with a tail toward high gain that is more extended for less compact models and higher disk masses. For a large fraction of the outflow, unbinding is not completely achieved by absorption of heat alone, which means that a significant part of the energy gain comes from adiabatic work. Disks with higher compactness are also less effective at absorbing heat, despite the fact that the absolute value of the net heat gain is higher (Table 3).
It is worth emphasizing that while disks with a higher compactness are more gravitationally bound in an absolute sense ( in eq. 1), they also undergo more net heating than lower compactness models (Table 3). Thus the absolute value of the gravitational potential (in a Newtonian sense), while correlating negatively with the fractional amount of heat absorbed, does not by itself explain the efficiency of mass ejection without accounting for how close the disk is to the ISCO radius.
For individual models, viscous heating and nuclear recombination contribute with net heating, while neutrinos primarily cool the disk (Table 3). This is illustrated in Figure 5, which shows the distribution of the individual heating/cooling terms for the outflow from model b08d03. While there is a non-negligible fraction of particles for which neutrinos provide net heating, the magnitude of this heating ( erg g-1) is dynamically negligible when compared to the dominant source terms ( erg g-1).
The integrated heat gain due to particle recombination in the hydrodynamic simulation is sub-dominant compared to that from viscous heating. Despite its low global value, however, the heating due to recombination is deposited over a short amount of time as the outflow is launched, and it can become comparable or even exceed the rate of viscous heating in this phase. The bulk of neutrino heating and cooling takes place before weak freezout. Figure 5 shows that the nuclear recombination gain is narrowly distributed around the mean value, erg g-1 (Table 3). This value can be understood from the fact that upon expansion and cooling, all fluid elements achieve the maximal alpha particle mass fraction set by charge conservation, . The average electron fraction of the outflow (Table 2), then sets the average amount of energy gained.
Figure 5 also shows that the tracer particles in model b08d03 follow bimodal distributions of viscous heating and neutrino cooling. This bimodality can be traced back to the initial positions of the particles in the disk. These particles originate from two regions: (1) the equatorial plane of the disk, and (2) regions above the equatorial plane around the initial density peak (see also Wu et al. 2016). The first group of particles experiences stronger viscous heating and neutrino cooling, while the second group experiences heating or cooling with less intensity. The latter group includes all the particles that experience net neutrino heating. The initial position of the particles is related to the way the disk overturns in the poloidal direction due to viscous heating, and may differ from that obtained when MHD turbulence transports angular momentum.
The fraction of the disk mass ejected and average outflow velocity are nearly insensitive to the initial of the disk except for very massive disks in low-compactness systems, where differences of a few percent of the disk mass can arise (Table 3). Changes in the viscosity parameter, on the other hand, result in important changes to both ejected fraction and outflow velocity. The average outflow radial velocity is in the range c for all models that use , while this average increases to c for the models with . The fraction of the disk mass ejected increases by for the model with low compactness (b03d01-v10) and by a factor of for the high compactness model (b08d03-v10). Table 3 shows that the increase in the viscosity parameter results in more viscous heating in the high-compactness model b08d03-v10 and less neutrino cooling in the least compact model b03d01-v10, in both cases increasing the net heat gain of the outflow.
3.2 Outflow Composition
Table 2 shows that the average electron fraction of the disk outflow is in the range for all simulated models. These values are just above the critical transition at which the nucleosynthesis changes from rich to poor in elements with mass numbers (e.g., Kasen et al. 2015; Lippuner & Roberts 2015). For the purposes of predicting kilonova properties, the mass fraction in lanthanides (, with the atomic number) and actinides () is the most important, since these species have an outsize influence on the ejecta opacity – and therefore on the kilonova color, luminosity, and duration – given their atomic complexity (Tanaka & Hotokezaka, 2013; Kasen et al., 2013; Barnes & Kasen, 2013; Fontes et al., 2015; Tanaka et al., 2020).
We therefore refine our diagnostic of the outflow composition by analyzing the output of post-processed tracer particles with SkyNet (§2.3). For each simulation, we report in Table 2 the fraction of the outflow particles with lanthanide and actinide mass fraction and define it as the ‘blue mass’
| (8) |
The value of is small enough that the outflow opacity is indistinguishable from that dominated by iron-group elements (Kasen et al., 2013). Likewise, we define three ‘red’ masses
| (9) |
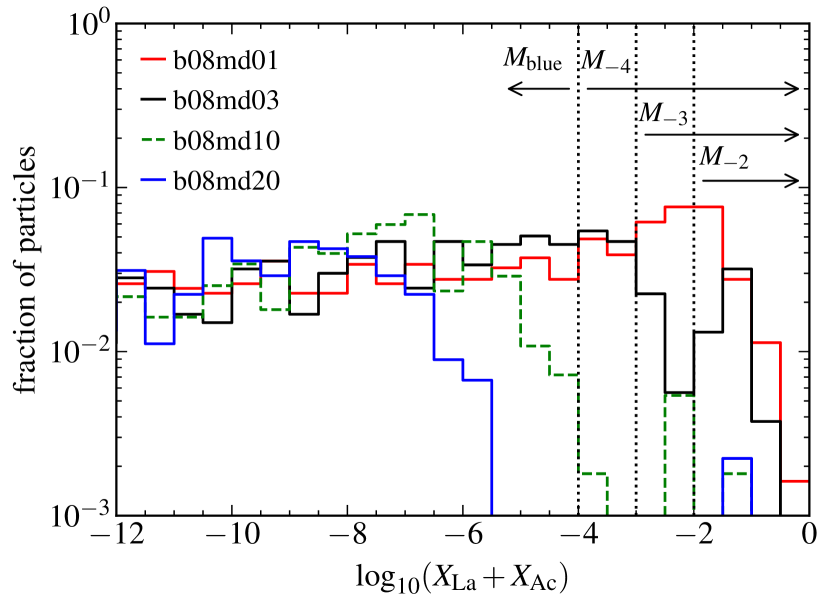
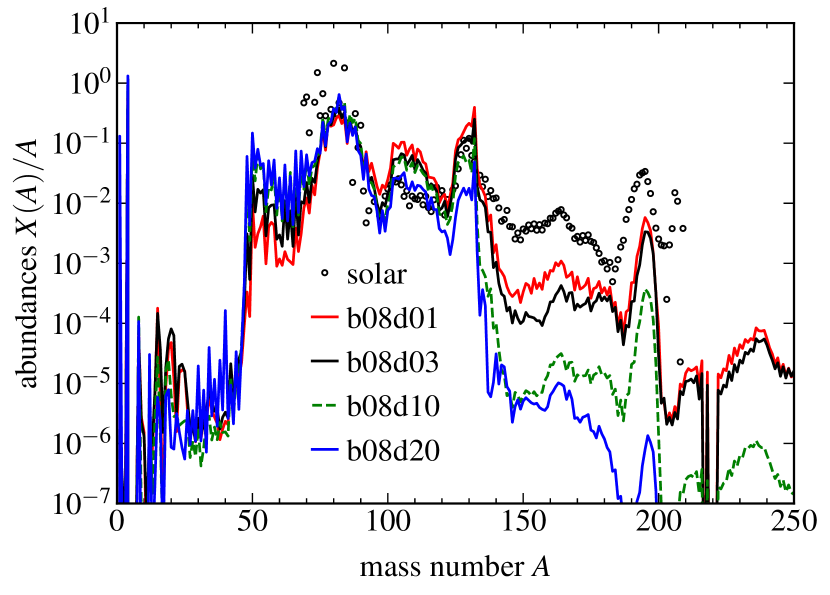
using . These four numbers provide a description of the incidence of heavy -process elements in the ejecta that, while coarser than detailed abundances, is more informative than just the electron fraction. Figure 6 shows the distribution of mass fractions at 1 day in the outflow particles from models b08d01-b08d20 (highest compactness), along with the regions encompassed by and , and the isotopic abundances for comparison. At 1 day, the mass fractions of actinides are in general times smaller than that of lanthanides in our models, and thus we lump them together when discussing composition effects (for more detailed studies on actinide production see Eichler et al. 2019 or Holmbeck et al. 2019).
The most robust composition trends from Table 2 are that (1) the majority of the disk outflow mass is lanthanide poor (), and that (2) the fraction of lanthanide poor material is a monotonically increasing function of the disk mass, for constant BH mass. The dependence on disk mass is clearly illustrated in Figure 6: the fraction of particles with high lanthanide abundance is a steep function of the disk mass, as is the abundance of of elements with (this dependence has also been reported by Just et al. 2015 and Fujibayashi et al. 2020). While there is some dependence on the compactness at constant disk mass, this dependence is not fully monotonic, and is weaker than the dependence on disk mass at fixed compactness. Therefore, this variation with compactness is more likely to be dependent on the details of how the disk evolution is modeled.
The trend of more lanthanide poor ejecta with increasing disk mass is apparent from the distribution of electron fraction (Figure 7). Despite having a very similar average value, the distribution of model b08d20 extends to significantly higher values than in model b08d01. Naively, one would expect that higher electron fraction is associated with a higher equilibrium arising from a higher abundance of positrons given higher entropies (e.g., Beloborodov 2003). However, the entropy distributions of models b08d01 and b08d20 show that the average entropy decreases with higher disk masses. The lower entropy can be understood from the fact that the temperature is primarily set by the strength of the gravitational potential once accretion is established, and is similar in both models. On the other hand, the densities are higher at any given time for a higher disk mass, with a correspondingly lower entropy than at lower disk masses.

We can further analyze the evolution of the electron fraction distribution of the outflow by computing the time-integrated contribution of the different neutrino processes that change . The net rate of change of due to neutrino emission and absorption arises from the following reactions:
| (10) | |||||
| (11) | |||||
| (12) | |||||
| (13) | |||||
| (14) | |||||
| (15) | |||||
| (16) |
with the net rate setting the overall evolution of the electron fraction in the hydrodynamic simulation: . For each tracer particle, we compute a separate time integral for each of the rates above, obtaining a contribution to the change in electron fraction:
| (17) |
where again is the maximum time of the particle in the simulation.
Table 3 shows that the rates of neutrino emission dominate over neutrino absorption for all models, in line with the overall dominance of neutrino cooling over neutrino heating (c.f. Figure 5). However, the change in is set by differences in the rates of neutrino/antineutrino emission and absorption. If the two emission rates are closer in magnitude than the two absorption rates, the latter can dominate the change in despite being smaller in magnitude than the former.
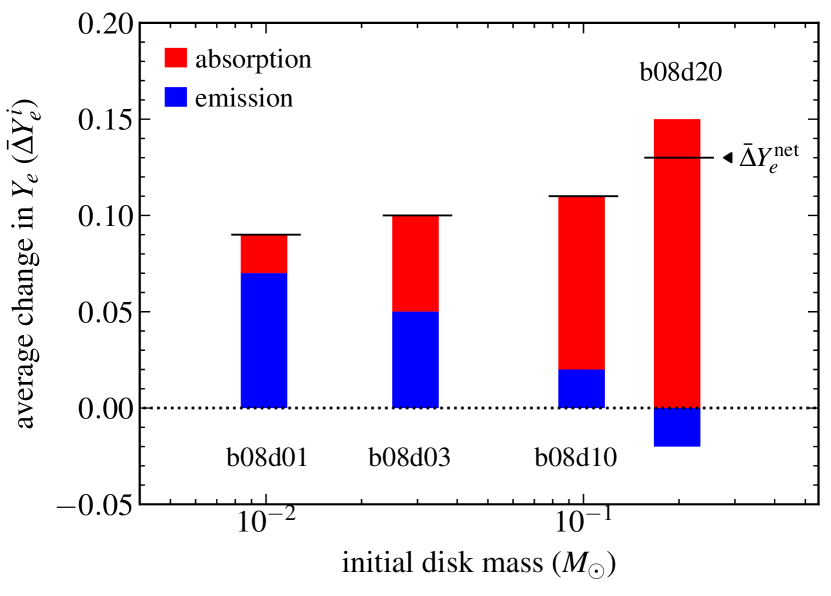
Figure 8 shows the average change in for tracer particles as a function of disk mass in the baseline sequence with , along with the breakdown of this change between emission and absorption of electron neutrinos/antineutrinos. At low disk masses, emission processes dominate the change in , with decreasing relative importance with increasing disk mass. Emission processes act toward driving to its local equilibrium value set by the entropy, and this equilibrium is lower at higher disk masses given the lower entropy (Figure 7). At the highest disk mass (model b08d20), this change in due to emission is even negative.
Absorption, on the other hand, is set by the ambient flux of incident neutrinos and the mass fractions of neutrons and protons. At higher disk masses, neutrino/antineutrino luminosities are higher and stay high for a longer time (Figure 3) thus increasing the ambient neutrino flux and the thus the magnitude of absorption terms. The asymmetry in the neutron-proton mass fraction then results in different absorption efficiencies and a net change in which always acts in the direction of increasing it (because the reaction in eqn. 12 occurs more frequently). Figure 8 shows that at high disk masses, absorption dominates the evolution of in the high-compactness models shown. Table 3 shows that this trend is also present in models with the lowest compactness (b03d01-b03d30), with an even stronger effect of absorption on than in the high compactness sequence.
Models with lower initial eject a higher proportion of lanthanides and actinides, as expected, although the change is at a level by mass relative to our baseline parameters (Figure 9). While the distributions extend to slightly lower electron fractions than the default models, the bulk of the outflow has in all cases. Table 3 shows that these changes are driven primarily by neutrino emission processes, which adjust to provide the required change in toward equilibrium.
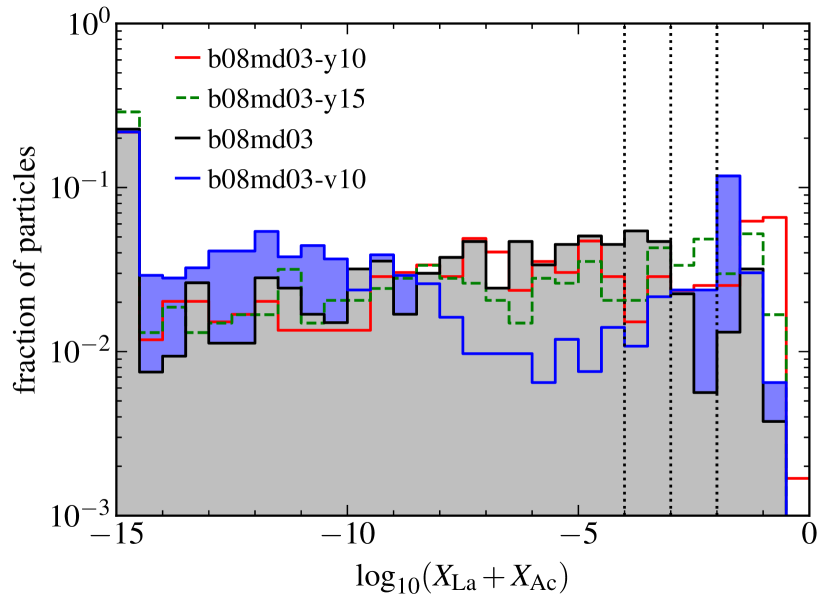
Models with higher viscosity have a similar average than their low-viscosity counterparts, but a significantly higher fraction of material rich in lanthanide and actinides. The electron fraction distribution of model b08d03-v10 has a tail to low that extends well below the lower limit of the distribution of model b08d01. Figure 7 shows that the material with the lowest is ejected at the earliest times in the high-viscosity model, in line with the general expectation that the faster the evolution of a disk, the stronger the sensitivity of the outflow composition to initial conditions. This is consistent with the results of GRMHD simulations, which show even stronger memory of initial conditions given their faster evolution; Fernández et al. 2019.
3.3 Implications for EM counterpart searches
The key question we are interested in is how does the disk outflow contribute to a kilonova transient. The answer depends on the amount of mass ejected and its velocity, its composition, as well as how efficiently does the radioactive heating thermalize (e.g., Metzger 2019).
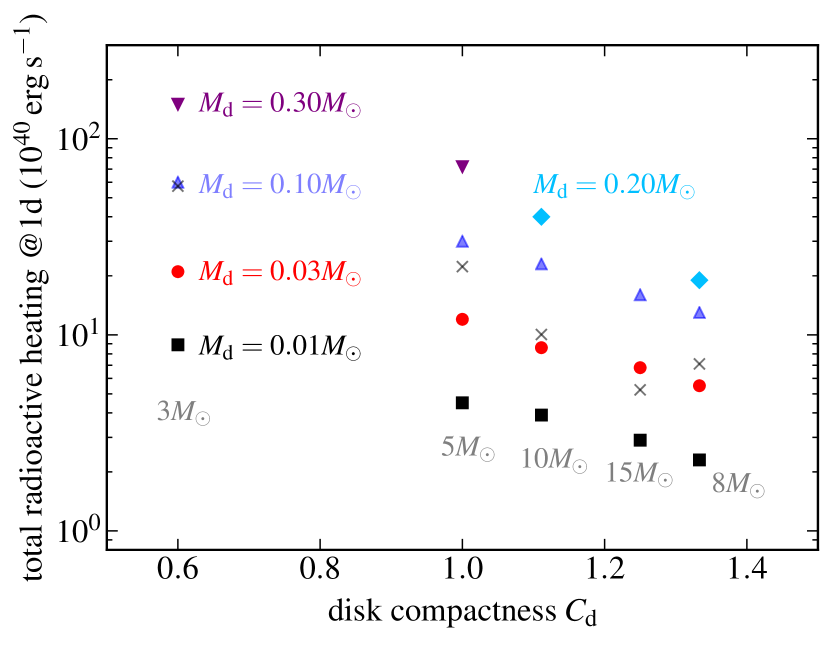
The mass ejected, and the composition to a lesser extent, determines how much radioactive power is available for a kilonova. Figure 10 shows the total radioactive heating luminosity at 1 day as a function of compactness parameter and initial disk mass. For fixed compactness, the total radioactive heating is proportional to the ejected mass, since the average radioactive heating per unit mass is close to erg g-1 s-1 for most models, given their similar composition. The dependence of ejected fraction on compactness results in an additional variation of a factor between the least and most compact models, for fixed disk mass.
The raw radioactive heating at 1 day ranges from erg s-1 for the lightest and most compact disk (b08d01) to erg s-1 for the heaviest disk in the least compact configuration (b03d30). Thermalization efficiency can result in a decrease in these values by a factor (Barnes et al., 2016; Waxman et al., 2019; Kasen & Barnes, 2019; Hotokezaka & Nakar, 2020), while radiative transfer effects (dependent on the opacity and thus on composition) set whether this power can readily escape the ejecta or is trapped until later times. Table 2 shows that the radioactive power at 1 week is about times smaller than that at 1 day for most models.
If we take the median disk masses from Figure 1 as representative values for each BH mass and interpolate the ejected masses from Table 2, we obtain disk outflow masses for BH masses , respectively. These values are subject to enhancement by a factor if GRMHD effects were to be included (Fernández et al., 2019; Christie et al., 2019).
In the case of GW190425, for which our lowest BH mass model would be applicable, the median disk outflow mass would be similar to the total ejecta from GW170817 within a factor of two, and hence it would have been detected with good sky coverage (Kyutoku et al., 2020). A BH-NS merger with a low-mass BH and high-mass NS is most efficient at tidally disrupting the NS and most inefficient at producing dynamical ejecta, with most mass ejection coming from the disk (Foucart et al., 2019). In contrast, two massive NS that collapse promptly to a BH are the least efficient configuration for ejecting mass and forming a disk (e.g., Radice et al. 2018, but see Kiuchi et al. 2019; Bernuzzi et al. 2020 for the case of an asymmetric mass ratio NS-NS merger generating a more massive BH accretion disk than a symmetric binary).
Regarding the BH-NS merger candidate GW190814, which had a much smaller localization area and deeper EM coverage relative to other events, constraints on the total mass ejection are in the range depending on viewing angle, composition, and distance. (e.g., Andreoni et al. 2020; Kawaguchi et al. 2020b; Morgan et al. 2020; Vieira et al. 2020). Our results indicate that, with the exception of a very low-mass BH and/or very high disk masses, most BH-NS merger systems would not have generated sufficient disk outflow for a detectable kilonova.
An additional factor influencing the kilonova appearance is the relative masses of the disk and the dynamical ejecta. In a BH-NS merger, the dynamical ejecta is produced along the equatorial plane, and it blocks only part of the viewing angles. It is expected to be very rich in lanthanides and thus have a high opacity that blocks the light from the disk toward most equatorial directions. The results of Fernández et al. (2015b) and Fernández et al. (2017) – who studied the combined long-term evolution of these two components mapped from dynamical merger simulations – show that the bulk of fallback accretion mixes in with the disk before weak freezout occurs and the disk outflow is launched. The net outflow has a very similar composition as the dynamical ejecta and disk when evolved separately, but with an added component that has intermediate electron fraction values. The expected kilonova color has an important dependence on viewing angle, as the bluer disk emission would only be detectable from directions not obscured by the dynamical ejecta (see, e.g., Bulla et al. 2019; Darbha & Kasen 2020; Kawaguchi et al. 2020a; Korobkin et al. 2020 for more recent work on viewing angle dependencies of different ejecta configurations).
In hydrodynamic simulations of BH accretion disks, the spatial dependence of the composition is quite generic, with the highest material being ejected first along intermediate latitudes, and then wrapping around the outermost edge of the disk outflow (Fernández et al., 2015a). This configuration would guarantee the existence of a blue spike at early times (albeit a faint one) if the merger remnant is viewable from polar latitudes. All of our models are such that at least of the disk outflow is lanthanide-poor, and in some cases this fraction can reach even (Table 2). GRMHD models show, however, that magnetic fields begin to eject matter much earlier than weak freezout, thus adding material that has not been sufficiently processed by weak interactions from the initial post-merger composition (e.g., Siegel & Metzger 2017; Fernández et al. 2019; Miller et al. 2019; Christie et al. 2019). This will likely increase the lanthanide-rich fraction at the leading edge of the disk outflow and thus modify the color of the disk-contributed kilonova.
4 Summary and Discussion
We have performed axisymmetric hydrodynamic simulations of the viscous
evolution of accretion disks formed in BH-NS mergers. Our models include
the effects of neutrino emission and absorption on the outflow composition,
and the results are post-processed with a nuclear reaction network for a
more precise diagnostic of the nucleosynthesis yield. These hydrodynamic
models provide a lower-limit to the amount of mass in the disk outflow
relative to three-dimensional GRMHD models, and hence provide a lower-limit to the
contribution of disk outflows to the kilonova transient. Our simulations cover,
for the first time, a large fraction of the plausible parameter space of BH
and disk masses expected from these mergers (Figure 1).
Our main results are the following:
1. – The fraction of the initial disk mass ejected as an unbound outflow
has an approximately inverse linear scaling with the initial
compactness of the disk, and can vary by a factor of
(Figure 2 and Table 2).
While this dependence on compactness was implicit in previous work,
this is the first time that it is systematically probed over a wide
parameter space.
The origin of this dependence can be traced back to the earlier onset
of accretion in more compact disks, as they are located closer to the
ISCO. Compared to lower compactness disks, a higher fraction of the
initial mass is accreted by the time weak interactions freeze out and
the outflow is launched (Figure 3).
2. – At constant compactness, the fraction of the disk mass ejected
decreases for higher disk masses. This effect is
related to the longer time to reach weak freezout in more
massive disks, which delays the onset of mass ejection to a time when
more mass has been accreted to the BH (Figure 3).
The dependence on initial disk mass is weaker for higher compactness
systems (Figure 2 and Table 2).
The initial density and entropy of the disk are the key variables regulating this
mass dependency of the ejection efficiency (§3.1).
3. – The disk outflow is more lanthanide/actinide-poor
for higher disk masses (Figure 6), at constant compactness
(this trend has also been found in previous studies).
This effect can be traced back to neutrino absorption becoming more important relative
to emission in increasing for more massive disks
(Figure 8 and Table 3).
Stronger absorption counteracts the action of neutrino emission in lowering given the lower entropy
of the outflow from more massive disks (Figure 7).
While our disk outflows are lanthanide-poor by mass, magnetically
driven contributions – not included here – can add a significant amount of
lanthanide-rich matter, hence the net composition of disk outflows requires
simulations with more complete physics for reliable predictions.
4. – The ejected fraction and final composition are sensitive to the viscosity parameter of the
disk, as known from previous work, with more mass ejected, at higher velocities, and with a higher
lanthanide-rich fraction for higher viscosity parameter (Table 2). The
most neutron-rich material is produced at the earliest times in the simulation (Figure 7)
and is thus related to the shorter evolution time of these disks.
5. – In most cases, the initial of the disk has a negligible effect on the amount of mass ejected,
with the exception of massive disks in low-compactness systems, where the effect modifies the
ejection efficiency by a few percent of the disk mass (similar to numerical resolution). Hence,
the ejected fraction is mostly
robust to variations in the initial composition (Table 2).
The final composition does depend on the initial conditions, with corrections of the order
of to the fraction of the outflow mass that is lanthanide-rich (Figure 9)
6. – The range of ejecta masses from the disk outflow can result
in a range of two orders of magnitude in raw radioactive luminosity over the BH-NS parameter
space probed (Figure 10). Except for very low-mass BHs and/or very
high disk masses, most BH-NS mergers should generate disk outflows that are below constraints
for the total ejecta mass from the BH-NS merger candidate GW190814 (§3.3).
Our results are consistent with previous hydrodynamic models of BH accretion disks. Model t-a80-hr from Fernández et al. (2015a) is equivalent to our model b03d01 but evolved until orbits. By that time, the total and unbound (positive energy) mass ejected in their model are and , respectively, while here we obtain and , respectively. The difference can be attributed to the lower ambient and floor of density used here, and on improvements in the neutrino implementation as reported in Lippuner et al. (2017). Similarly, model Fdisk of Fernández et al. (2017) falls in between models b08d03 and b08d10 in terms of compactness, but has a slightly higher BH spin (0.86). The higher ejected fraction in their model () can be partially accounted for by the higher value of the BH spin, and also by a more extended initial density distribution with radius in the torus mapped from the merger simulation (covering a wider range in compactness)
We have made specific choices for the disk entropy (§2.1), which can have implications for the sensitivity of the ejected fraction to initial disk mass. Similarly, the choice of viscosity parameter is on the low end of values that bracket the amount of angular momentum transport seen in GRMHD simulations of equivalent accretion disks (Fernández et al., 2019). More realistic values for these two parameters must come from direct mapping of the outcome of GRMHD simulations of BH-NS mergers that include neutrino transport, where the magnetic field geometry and strength replaces the viscosity parameter. A direct mapping would also avoid the need to make well-motivated but ultimately arbitrary choices for an initial torus radius, which is required by an equilibrium initial condition and directly enters the compactness parameter (equation 3). Mapping from merger simulations would also inform the initial distribution which, while not crucial for determining the amount of mass ejected, has implications for the outflow composition at the level of detail needed for accurate predictions of kilonovae and nucleosynthesis yields. Compact object merger simulations that account for both MHD and neutrino effects are few and only implement the latter via leakage schemes (e.g., Neilsen et al. 2014; Most et al. 2019). Simulations with more advanced (e.g., M1) neutrino transport do not yet include MHD effects.
Our results suggest that GRMHD simulations carried out with no neutrino absorption (e.g., Siegel & Metzger 2018; Fernández et al. 2019; Christie et al. 2019) can give reasonable distributions only for very low mass disks , for which the absorption contribution to is subdominant. For the configuration studied by Siegel & Metzger (2018), Fernández et al. (2019), and Christie et al. (2019) ( and ), we find that absorption is already more important than emission in setting the distribution (Table 3), in line with the results of Miller et al. (2019) who showed a significant increase in the of the outflow when including neutrino absorption.
Further GRMHD studies of BH accretion disks over a wide region of parameter space are needed to determine whether the ejected fraction has the same dependence on compactness as in pure hydrodynamic models, and whether the fraction of the outflow that is lanthanide-rich is significantly larger than what we find here. Both of these questions are crucial to improve predictions of EM counterparts to BH-NS and NS-NS sources, and require (1) models evolved for long timescales, (2) realistic initial field strengths, geometries, entropies, and electron fractions, and (3) inclusion of neutrino absorption. Such simulations remain challenging given current algorithms and computational resources.
Acknowledgements
We thank the anonymous referee for helpful comments that improved the presentation of the paper. RF acknowledges support from the National Sciences and Engineering Research Council (NSERC) of Canada through Discovery Grant RGPIN-2017-04286, and from the Faculty of Science at the University of Alberta. FF gratefully acknowledges support from the U.S. National Science Foundation (NSF) through grant PHY-1806278, from the National Aeronautics and Space Administration (NASA) through grant 80NSSC18K0565, and from the U.S. Department of Energy CAREER grant DE-SC0020435. This work was supported by the U.S. Department of Energy through the Los Alamos National Laboratory. Los Alamos National Laboratory is operated by Triad National Security, LLC, for the National Nuclear Security Administration of U.S. Department of Energy (Contract No. 89233218CNA000001). This work was assigned report number LA-UR-20-23877. The software used in this work was in part developed by the U.S. Department of Energy NNSA-ASC OASCR Flash Center at the University of Chicago. This research was enabled in part by support provided by WestGrid (www.westgrid.ca), the Shared Hierarchical Academic Research Computing Network (SHARCNET, www.sharcnet.ca), Calcul Québec (calculquebec.ca), and Compute Canada (www.computecanada.ca). Computations were performed on Graham, Cedar, and Béluga. This research also used storage resources of the U.S. National Energy Research Scientific Computing Center (NERSC), which is supported by the Office of Science of the U.S. Department of Energy under Contract No. DE-AC02-05CH11231 (repository m2058). Graphics were developed with matplotlib (Hunter, 2007).
Data Availability
The data underlying this article will be shared on reasonable request to the corresponding author.
References
- Abbott et al. (2017) Abbott B. P., et al., 2017, ApJ, 848, L12
- Abbott et al. (2019) Abbott B. P., et al., 2019, Physical Review X, 9, 031040
- Abbott et al. (2020a) Abbott B. P., et al., 2020a, ApJ, 892, L3
- Abbott et al. (2020b) Abbott R., et al., 2020b, ApJ, 896, L44
- Ackley et al. (2020) Ackley K., et al., 2020, preprint, arXiv:2002.01950
- Andreoni et al. (2020) Andreoni I., et al., 2020, ApJ, 890, 131
- Artemova et al. (1996) Artemova I. V., Bjoernsson G., Novikov I. D., 1996, ApJ, 461, 565
- Barbieri et al. (2019) Barbieri C., Salafia O. S., Colpi M., Ghirlanda G., Perego A., Colombo A., 2019, ApJ, 887, L35
- Barnes & Kasen (2013) Barnes J., Kasen D., 2013, ApJ, 775, 18
- Barnes et al. (2016) Barnes J., Kasen D., Wu M.-R., Martínez-Pinedo G., 2016, ApJ, 829, 110
- Beloborodov (2003) Beloborodov A. M., 2003, ApJ, 588, 931
- Bernuzzi et al. (2020) Bernuzzi S., et al., 2020, MNRAS, in press, arXiv:2003.06015
- Bethe et al. (1980) Bethe H. A., Applegate J. H., Brown G. E., 1980, ApJ, 241, 343
- Bludman & van Riper (1978) Bludman S. A., van Riper K. A., 1978, ApJ, 224, 631
- Brege et al. (2018) Brege W., et al., 2018, Phys. Rev. D, 98, 063009
- Bulla et al. (2019) Bulla M., et al., 2019, Nature Astronomy, 3, 99
- Chen & Beloborodov (2007) Chen W.-X., Beloborodov A. M., 2007, ApJ, 657, 383
- Christie et al. (2019) Christie I. M., Lalakos A., Tchekhovskoy A., Fernández R., Foucart F., Quataert E., Kasen D., 2019, MNRAS, 490, 4811
- Coughlin et al. (2020) Coughlin M. W., et al., 2020, MNRAS, 492, 863
- Cyburt et al. (2010) Cyburt R. H., et al., 2010, ApJS, 189, 240
- Darbha & Kasen (2020) Darbha S., Kasen D., 2020, preprint, arXiv:2002.00299
- Di Matteo et al. (2002) Di Matteo T., Perna R., Narayan R., 2002, ApJ, 579, 706
- Dubey et al. (2009) Dubey A., Antypas K., Ganapathy M. K., Reid L. B., Riley K., Sheeler D., Siegel A., Weide K., 2009, J. Par. Comp., 35, 512
- Eichler et al. (2019) Eichler M., Sayar W., Arcones A., Rauscher T., 2019, ApJ, 879, 47
- Etienne et al. (2009) Etienne Z. B., Liu Y. T., Shapiro S. L., Baumgarte T. W., 2009, Phys. Rev. D, 79, 044024
- Fahlman & Fernández (2018) Fahlman S., Fernández R., 2018, ApJ, 869, L3
- Fernández & Metzger (2013) Fernández R., Metzger B. D., 2013, MNRAS, 435, 502
- Fernández & Metzger (2016) Fernández R., Metzger B. D., 2016, ARNPS, 66, 23
- Fernández et al. (2015a) Fernández R., Kasen D., Metzger B. D., Quataert E., 2015a, MNRAS, 446, 750
- Fernández et al. (2015b) Fernández R., Quataert E., Schwab J., Kasen D., Rosswog S., 2015b, MNRAS, 449, 390
- Fernández et al. (2017) Fernández R., Foucart F., Kasen D., Lippuner J., Desai D., Roberts L. F., 2017, CQG, 34, 154001
- Fernández et al. (2019) Fernández R., Tchekhovskoy A., Quataert E., Foucart F., Kasen D., 2019, MNRAS, 482, 3373
- Foley et al. (2020) Foley R. J., Coulter D. A., Kilpatrick C. D., Piro A. L., Ramirez-Ruiz E., Schwab J., 2020, MNRAS, 494, 190
- Fontes et al. (2015) Fontes C. J., Fryer C. L., Hungerford A. L., Hakel P., Colgan J., Kilcrease D. P., Sherrill M. E., 2015, High Energy Density Physics, 16, 53
- Foucart et al. (2011) Foucart F., Duez M. D., Kidder L. E., Teukolsky S. A., 2011, Phys. Rev. D, 83, 024005
- Foucart et al. (2013) Foucart F., et al., 2013, PRD, 87, 084006
- Foucart et al. (2014) Foucart F., et al., 2014, PRD, 90, 024026
- Foucart et al. (2017) Foucart F., et al., 2017, Classical and Quantum Gravity, 34, 044002
- Foucart et al. (2018) Foucart F., Hinderer T., Nissanke S., 2018, Phys. Rev. D, 98, 081501
- Foucart et al. (2019) Foucart F., Duez M. D., Kidder L. E., Nissanke S. M., Pfeiffer H. P., Scheel M. A., 2019, Phys. Rev. D, 99, 103025
- Frankel & Metropolis (1947) Frankel S., Metropolis N., 1947, Physical Review, 72, 914
- Fryxell et al. (2000) Fryxell B., et al., 2000, ApJS, 131, 273
- Fujibayashi et al. (2020) Fujibayashi S., Shibata M., Wanajo S., Kiuchi K., Kyutoku K., Sekiguchi Y., 2020, PRD, 101, 083029
- Fuller et al. (1982) Fuller G. M., Fowler W. A., Newman M. J., 1982, ApJS, 48, 279
- Goriely (1999) Goriely S., 1999, A&A, 342, 881
- Hinderer et al. (2019) Hinderer T., et al., 2019, Phys. Rev. D, 100, 063021
- Holmbeck et al. (2019) Holmbeck E. M., Sprouse T. M., Mumpower M. R., Vassh N., Surman R., Beers T. C., Kawano T., 2019, ApJ, 870, 23
- Hossein Nouri et al. (2018) Hossein Nouri F., et al., 2018, Phys. Rev. D, 97, 083014
- Hotokezaka & Nakar (2020) Hotokezaka K., Nakar E., 2020, ApJ, 891, 152
- Hunter (2007) Hunter J. D., 2007, Computing In Science & Engineering, 9, 90
- Just et al. (2015) Just O., Bauswein A., Pulpillo R. A., Goriely S., Janka H.-T., 2015, MNRAS, 448, 541
- Kasen & Barnes (2019) Kasen D., Barnes J., 2019, ApJ, 876, 128
- Kasen et al. (2013) Kasen D., Badnell N. R., Barnes J., 2013, ApJ, 774, 25
- Kasen et al. (2015) Kasen D., Fernández R., Metzger B. D., 2015, MNRAS, 450, 1777
- Kawaguchi et al. (2015) Kawaguchi K., Kyutoku K., Nakano H., Okawa H., Shibata M., Taniguchi K., 2015, Phys. Rev. D, 92, 024014
- Kawaguchi et al. (2016) Kawaguchi K., Kyutoku K., Shibata M., Tanaka M., 2016, ApJ, 825, 52
- Kawaguchi et al. (2020a) Kawaguchi K., Shibata M., Tanaka M., 2020a, ApJ, 889, 171
- Kawaguchi et al. (2020b) Kawaguchi K., Shibata M., Tanaka M., 2020b, ApJ, 893, 153
- Kiuchi et al. (2019) Kiuchi K., Kyutoku K., Shibata M., Taniguchi K., 2019, ApJ, 876, L31
- Korobkin et al. (2020) Korobkin O., et al., 2020, preprint, arXiv:2004.00102
- Krüger & Foucart (2020) Krüger C. J., Foucart F., 2020, Phys. Rev. D, 101, 103002
- Kyutoku et al. (2010) Kyutoku K., Shibata M., Taniguchi K., 2010, Phys. Rev. D, 82, 044049
- Kyutoku et al. (2015) Kyutoku K., Ioka K., Okawa H., Shibata M., Taniguchi K., 2015, Phys. Rev. D, 92, 044028
- Kyutoku et al. (2020) Kyutoku K., Fujibayashi S., Hayashi K., Kawaguchi K., Kiuchi K., Shibata M., Tanaka M., 2020, ApJ, 890, L4
- LIGO Scientific Collaboration & Virgo Collaboration (2020) LIGO Scientific Collaboration Virgo Collaboration 2020, preprint, arXiv:2004.08342
- Langanke & Martínez-Pinedo (2000) Langanke K., Martínez-Pinedo G., 2000, Nuclear Phys. A, 673, 481
- Lee et al. (2009) Lee W. H., Ramirez-Ruiz E., López-Cámara D., 2009, ApJ, 699, L93
- Lippuner & Roberts (2015) Lippuner J., Roberts L. F., 2015, ApJ, 815, 82
- Lippuner & Roberts (2017) Lippuner J., Roberts L. F., 2017, ApJS, 233, 18
- Lippuner et al. (2017) Lippuner J., Fernández R., Roberts L. F., Foucart F., Kasen D., Metzger B. D., Ott C. D., 2017, MNRAS, 472, 904
- Mamdouh et al. (2001) Mamdouh A., Pearson J. M., Rayet M., Tondeur F., 2001, Nuclear Phys. A, 679, 337
- Metzger (2019) Metzger B. D., 2019, Living Reviews in Relativity, 23, 1
- Metzger & Fernández (2014) Metzger B. D., Fernández R., 2014, MNRAS, 441, 3444
- Metzger et al. (2009) Metzger B. D., Piro A. L., Quataert E., 2009, MNRAS, 396, 304
- Miller et al. (2019) Miller J. M., et al., 2019, Phys. Rev. D, 100, 023008
- Möller et al. (2016) Möller P., Sierk A. J., Ichikawa T., Sagawa H., 2016, Atomic Data and Nuclear Data Tables, 109, 1
- Morgan et al. (2020) Morgan R., et al., 2020, preprint, arXiv:2006.07385
- Most et al. (2019) Most E. R., Papenfort L. J., Tsokaros A., Rezzolla L., 2019, ApJ, 884, 40
- Neilsen et al. (2014) Neilsen D., Liebling S. L., Anderson M., Lehner L., O’Connor E., Palenzuela C., 2014, Phys. Rev. D, 89, 104029
- Oda et al. (1994) Oda T., Hino M., Muto K., Takahara M., Sato K., 1994, Atomic Data and Nuclear Data Tables, 56, 231
- Pannarale (2014) Pannarale F., 2014, Phys. Rev. D, 89, 044045
- Panov et al. (2010) Panov I. V., Korneev I. Y., Rauscher T., Martínez-Pinedo G., Kelić-Heil A., Zinner N. T., Thielemann F. K., 2010, A&A, 513, A61
- Popham et al. (1999) Popham R., Woosley S. E., Fryer C., 1999, ApJ, 518, 356
- Radice et al. (2018) Radice D., Perego A., Hotokezaka K., Fromm S. A., Bernuzzi S., Roberts L. F., 2018, ApJ, 869, 130
- Roberts et al. (2017) Roberts L. F., et al., 2017, MNRAS, 464, 3907
- Ruffert & Janka (1999) Ruffert M., Janka H.-T., 1999, A&A, 344, 573
- Setiawan et al. (2006) Setiawan S., Ruffert M., Janka H.-T., 2006, A&A, 458, 553
- Shakura & Sunyaev (1973) Shakura N. I., Sunyaev R. A., 1973, A&A, 24, 337
- Shibata & Hotokezaka (2019) Shibata M., Hotokezaka K., 2019, Annual Review of Nuclear and Particle Science, 69, 41
- Siegel & Metzger (2017) Siegel D. M., Metzger B. D., 2017, Physical Review Letters, 119, 231102
- Siegel & Metzger (2018) Siegel D. M., Metzger B. D., 2018, ApJ, 858, 52
- Stone et al. (1999) Stone J. M., Pringle J. E., Begelman M. C., 1999, MNRAS, 310, 1002
- Tanaka & Hotokezaka (2013) Tanaka M., Hotokezaka K., 2013, ApJ, 775, 113
- Tanaka et al. (2020) Tanaka M., Kato D., Gaigalas G., Kawaguchi K., 2020, MNRAS, 496, 1369
- Thakur et al. (2020) Thakur A. L., et al., 2020, preprint, arXiv:2007.04998
- Timmes & Swesty (2000) Timmes F. X., Swesty F. D., 2000, ApJS, 126, 501
- Vieira et al. (2020) Vieira N., et al., 2020, ApJ, 895, 96
- Wahl (2002) Wahl A. C., 2002, Technical Report LA-13928. Systematics of fission-product yields. Los Alamos National Laboratory, Los Alamos, NM
- Waxman et al. (2019) Waxman E., Ofek E. O., Kushnir D., 2019, ApJ, 878, 93
- Wu et al. (2016) Wu M.-R., Fernández R., Martínez-Pinedo G., Metzger B. D., 2016, MNRAS, 463, 2323