Gravitational waves from vacuum first-order phase transitions II:
from thin to thick walls
Abstract
In a vacuum first-order phase transition, gravitational waves are generated from collision of bubbles of the true vacuum. The spectrum from such collisions takes the form of a broken power law. We consider a toy model for such a phase transition, where the dynamics of the scalar field depends on a single parameter , which controls how thin the bubble wall is at nucleation and how close to degenerate the vacua are relative to the barrier. We extend on our previous work by performing a series of simulations with a range of . The peak of the gravitational-wave power spectrum varies by up to a factor of , which is probably an unobservable effect. We find that the ultraviolet (UV) power law in the gravitational-wave spectrum becomes steeper as , varying between and for the considered. This provides some evidence that the form of the underlying effective potential of a vacuum first-order phase transition could be determined from the gravitational-wave spectrum it produces.
I Introduction
Upcoming space-based gravitational-wave detectors like the Laser Interferometer Space Antenna [1] (LISA) are anticipated to dramatically increase our capability to probe early universe cosmology through gravitational waves [2]. In particular, LISA will be sensitive to first-order cosmological phase transitions at the electroweak scale [3, 4].
In the Standard Model, the electroweak transition is a crossover [5, 6], and as such there are no first-order phase transitions at the electroweak scale. However, there is a multitude of well-motivated extensions to the Standard Model that produce first-order phase transitions, ranging from singlet extensions [7, 8, 9, 10, 11], two-Higgs doublet models [12, 13, 14], models in which a conformal symmetry is spontaneously broken [15, 16, 17, 18, 19, 20, 21], to models with a phase transition in a hidden sector [22, 23, 24, 25, 26, 27, 28, 29, 30]. The gravitational wave signal generated by phase transitions in these Beyond the Standard Model extensions will enable LISA to detect or constrain their existence.
In a first-order cosmological phase transition, some effective scalar field is trapped in a metastable state (symmetric phase), separated by a potential barrier from the true vacuum state (broken phase) [31, 32, 33]. When the transition proceeds, bubbles of the true vacuum nucleate, expand and eventually collide, sourcing transverse-traceless modes of shear stress, which in turn source gravitational waves [34, 35]. The dynamics of the resulting phase transition can be split qualitatively according to whether the bubble wall reaches a terminal velocity before colliding, or whether the bubble wall continues to accelerate until collision. We denote these different transition types respectively as ‘thermal’ and ‘vacuum-like’.
In a thermal phase transition, bubbles nucleate in the presence of a hot relativistic plasma made up of the early universe particle content. The friction felt between the plasma and the expanding bubble wall is sufficient to eventually result in the wall approaching a terminal wall velocity. Shells of hotter plasma develop around the expanding bubbles, and after collision continue to propagate as long-lasting sound waves. Eventually, the sound waves are expected to decay, and the flow may become turbulent [34, 36].
In a vacuum-like transition, the vacuum pressure driving the phase transition overcomes the resulting friction from the plasma and the bubble wall continues to accelerate before collision. An early study predicted that in most electroweak scale phase transitions the bubble wall would undergo ‘run away’ acceleration, provided sufficient supercooling [37]. More recently, it has been shown that if the scalar field couples to heavy gauge bosons, next-to-leading-order effects cause the friction to grow proportionally to the Lorentz factor of the bubble wall [38]. In this case, the runaway condition in Ref. [37] is no longer fulfilled.
Several scenarios have been proposed that can still result in ‘vacuum-like’ behaviour. The friction term proportional to is generated by transition radiation of gauge bosons acquiring a mass as they cross the bubble wall. If the phase transition occurs in the absence of gauge fields, such as during the spontaneous breaking of an approximate global symmetry, then the dominant transition radiation process may grow as [4].
Alternatively, if there is an extreme level of supercooling, then there could be a sufficient dilution of the early universe plasma and resulting plasma friction to allow for the bubble walls to accelerate until collision. The levels of supercooling required for this to occur is large but can be achieved in transitions with a classically scale-invariant potential [39]. In other models, sufficient supercooling is difficult to achieve; at large supercooling the universe can start to inflate, meaning that the bubbles cannot percolate and the transition does not complete [40].
Finally, in a dark sector that is decoupled at the time of transition, runaway-type transitions are achieved more easily than in the visible electroweak sector [26].
The first attempts to model the gravitational-wave power spectrum from first-order phase transitions employed a seminumerical simulation method termed the ‘envelope approximation’. In this calculation, the stress-energy is assumed to be located in an infinitesimally thin shell at the bubble wall which disappears upon collision [41]. This technique was first applied to vacuum transitions, and then to thermal transitions [42, 43, 44]. When the bubble wall velocity is ultra-relativistic the resulting gravitational-wave spectrum was shown to be a broken power law rising in the infrared (IR) and falling in the ultraviolet (UV) as approximately and , respectively. Analytic studies which build upon the envelope approximation have confirmed the broken power laws found from numerical simulations [45].
Extensions to the envelope approximation in which the shell of shear-stress continues to propagate after collision have also been studied [46, 44]. We will follow Ref. [44] in referring to this as the bulk flow model. Simulations of the bulk flow model with ultra-relativistic wall velocities have found power laws of approximately and .
Many developments have been made in the study of thermal phase transitions. 3D hydrodynamical simulations of weak and intermediate strength transitions [47, 48, 49, 50] demonstrated that sound waves form the dominant contribution to the gravitational-wave signal and that while the contribution from bubble collisions is subdominant, for thermal phase transitions it is well represented by the envelope approximation [51]. Modelling has shown weak and intermediate strength transitions are well represented shortly after the transition by a linear superposition of propagating sound waves [52, 53].
Simulations of stronger first-order phase transitions indicated that for walls moving slower than the speed of sound, the formation of hot droplets of the symmetric phase in the later stages of the collisions can significantly reduce the gravitational-wave signal [54]. The gravitational wave production in extremely strong phase transitions has also been studied using a combination of 1D simulations and modelling [55]. It has been shown that for almost all observable transitions, the timescale on which nonlinearities in the fluid are expected to play a role (given by the ratio of the bubble radius to the root-mean-square fluid velocity) is shorter than a Hubble time [56]. On longer timescales, the flow may become turbulent. The gravitational wave spectrum from freely decaying turbulence has been modelled [42, 57, 58, 59, 60, 61], and recently numerically simulated [62].
Full 3D lattice simulations have also been employed to test the envelope approximation within vacuum transitions [63, 64]. In Ref. [63], it was seen that after percolation, the gravitational-wave signal in a vacuum transition was amplified by more than an order of magnitude during a what was termed a period of coalescence. A more recent study by the present authors identified this growth of gravitational waves with oscillations of the scalar field around the true vacuum, producing gravitational waves peaked at the broken-phase mass scale [64]. With a realistic separation of scales between the mass scale and the mean bubble separation, the signal generated by these oscillations would be negligible in comparison to that from bubble collisions, and peak at too high a frequency to be observable. It also found that while the peak frequency and amplitude of the spectrum were roughly predicted by the envelope approximation, the UV power law was slightly steeper at around .
Early studies of two colliding bubbles in the thin wall limit demonstrated that the scalar field in the overlap region rebounds to the false vacuum, and can become temporarily trapped [65, 66, 67]. Further simulations have shown that far away from the thin wall limit, the trapping is reduced [68].
The question of trapping has recently been revisited in light of the recent interest in the dynamics of cosmological first-order phase transitions. In Ref. [69] the collision of two ultra-relativistic planar bubble walls was studied for a variety of potential shapes. Depending on the shape of the potential, it was seen that the scalar field could become trapped temporarily in the false vacuum in the collision region. The authors proposed that if trapping indeed occurred, then the gravitational-wave power spectrum should be given by the envelope approximation, but if it did not then the bulk flow model should apply. This has been investigated by colliding two vacuum bubbles and measuring the resulting gravitational-wave power spectrum [70], where small changes were observed when varying the potential shape.
In this paper, we conduct a series of 3D lattice simulations of colliding vacuum bubbles, with the intention of exploring how modifying the shape of the effective potential changes the gravitational-wave spectrum. We consider a vacuum phase transition in a toy model with a quartic effective potential with a cubic term. We show that for this model, the effect of the potential on the scalar field dynamics can be shown to depend on a single parameter . As the potential approaches thin-wall limit, whereas for the bubble wall becomes thick in comparison to the critical radius. We see that as , less trapping occurs in the collision region. Our simulations span a range of and we analyse the effect changing has on the gravitational-wave power spectrum. The peak of the gravitational-wave power spectrum varies by a factor of up to between the values we consider. We find that UV power law in the gravitational-wave spectrum becomes steeper as , varying between for and for .
We also find some evidence that the power law in the IR continues to evolve after the bubbles finish colliding. While at early times it is proportional to (as one would expect from causality [60]), it becomes shallower after the bubbles have finished colliding. By visualising our simulations, we can see that there are outward-propagating shells of transverse-traceless shear-stress that continue to propagate outward. This provides some evidence for the bulk flow model which assumes the continued outward propagation of shear-stress after bubbles have collided.
In Section II we discuss the dynamics of the scalar field, and how it varies according to the potential shape in our toy model. We illustrate how the variation of modifies the critical bubble profile, the evolution of an isolated bubble, and the dynamics of the scalar field in the overlap region of two colliding bubbles. We detail the linearised gravity approach we employ within our simulations in Section III, and outline the current understanding of the gravitational-wave power spectrum produced in a vacuum transition. We describe the numerical methods we employ in our simulations in Section IV. The results we obtain are split into two sections, in Section V we show the behaviour of the scalar field and transverse traceless shear-stress, whereas in Section. VI we analyse the resulting gravitational-wave power spectrum and provide a fit for the power spectrum over time for each . Finally, in Section VII we list our conclusions.
II Scalar field dynamics
In a vacuum first-order phase transition, the universe transitions from a metastable false vacuum state into a true vacuum state. In a first-order phase transition, a potential barrier will separate these two states. Local patches of the universe will transition into the true vacuum state via quantum tunneling. These patches of the true vacuum state will form bubbles, with the interface between the true and false vacuum forming the bubble wall. After nucleating, these bubbles will expand, eventually reaching cosmological sizes and ultra-relativistic speeds before they collide.
We can describe the transition by using a scalar field order parameter which corresponds to the vacuum expectation value of the field transitioning. The equation of motion for this scalar field in our simulations is:
| (1) |
where we choose the scalar field potential to be given by
| (2) |
Note here that we are neglecting the expansion of the universe in the dynamics of the scalar field. This is equivalent to making the assumption that the duration of the phase transition is much shorter than a Hubble time at the time of the transition .
This potential has a degenerate second ground state when the mass is equal to the critical mass value,
| (3) |
It is useful to introduce the parameter . When this potential has two ground states, one of which is metastable. The metastable state (or symmetric phase) is at and the true vacuum state (or broken phase) is at
| (4) |
The symmetric phase at is separated from the broken phase at by a potential barrier, which peaks at
| (5) |
The broken phase mass is given by
| (6) |
Furthermore the potential difference between the two minima is given by
| (7) |
and the height of the potential barrier ,
| (8) |
The total energy density in the scalar field can be split into three components,
| (9) |
with the kinetic energy density,
| (10) |
the gradient energy density,
| (11) |
and the potential energy density,
| (12) |
We are free to rescale the potential by some constant value, and likewise the field, i.e or . After accounting for this there are only two interesting dimensionless quantities that describe our potential which can affect the dynamics.
The first of these quantities is the ratio of and ,
| (13) |
The second is the ratio of and . This is given by
| (14) |
Both of these ratios depend solely on rather than any other combination of the potential parameters.
Furthermore, we can reparameterize the scalar field as and rewrite the coordinates in order to obtain the following equation of motion,
| (15) |
where . Clearly the dynamics here depend only on the value of .
In the limit of the minima of the potential become degenerate, and this corresponds to the thin wall limit of our potential. In the limit the potential barrier becomes infinitesimally small in comparison to the potential energy difference. We call this the thick wall limit. To see how varying affects the scalar field potential, see Fig. 1.
By varying between one and zero we are able to fully explore the physically meaningful parameter space of our potential.

II.1 Nucleation
The probability of nucleating a bubble per unit volume per unit time is given by [32]
| (16) |
where is the Euclidean action,
| (17) |
In the previous work Ref. [64], several nucleation scenarios were investigated. These were denoted exponential nucleation, simultaneous nucleation, and constant nucleation.
An exponential nucleation rate can occur if there is a change in temperature or background field. Then the Euclidean action decreases slowly in time resulting in the following nucleation probability
| (18) |
where and is the time at which the fraction of the universe in the symmetric phase is [71].
For an exponential nucleation rate, the number density of bubble nucleation sites at the end of the transition can be shown to be
| (19) |
where for a vacuum transition the wall velocity can be approximated to unity.
Simultaneous nucleation can occur if there is a minimum in which is reached at time before a transition completes. Then the probability of nucleating a bubble per unit volume evolves as
| (20) |
where . Nucleation is then concentrated around time [72]. In the limit of , the number density of nucleation sites tends towards
| (21) |
A constant nucleation rate can occur if tends to a constant, see e.g Ref. [73]. The nucleation probability in this scenario is then simply
| (22) |
with the nucleation site number density given by
| (23) |
An important parameter for the gravitational wave power spectrum is the mean separation between bubble centres at the end of the transition, . This is simply given by
| (24) |
II.2 Critical profile
During a vacuum phase transition, the critical profile corresponds to the most likely field configuration for a nucleated bubble. The profile of a vacuum bubble is invariant under four-dimensional Euclidean rotations [31], i.e it obeys an symmetry. We can therefore express the field profile as a function of a single variable with the spatial radius from the bubble centre and the Euclidean time.
In the thin wall limit the scalar field profile of the critical bubble is given by
| (25) |
where is thickness of the critical bubble wall in the thin wall limit,
| (26) |
and is the radius of the critical bubble,
| (27) | ||||
| (28) |
Here
| (29) |
is interpreted as the surface tension of the bubble. Note that both the combination and are constructed from quantities that depend only on .
Taking inspiration from the thin wall approximation, we can define the “wall” of the bubble to correspond to the section of the field profile between and where and . Here is the value of the scalar field at the centre of the critical bubble, . We then say that the radius of the bubble is defined by .
For potentials with close to 1, we find that the profile of the critical bubble is close to a hyperbolic tangent, as expected from Eq. 25. At the centre of the critical bubble the field sits very close to . As is reduced, we see a deviation of the critical bubble radius, and initial wall width, , from those predicted in the thin wall limit. The lower the value of , the smaller the critical radius of the bubble becomes in comparison to the thickness of the wall. For small values of , the field profile can be approximated by a Gaussian, and the value of decreases such that as , we find that . We plot the critical bubble profile for a series of in Fig. 2. Note that with fixed, the profile as a function of is invariant under changes of the potential parameters.

II.3 Expansion
The energetically favourable state inside the bubble exerts an outward pressure on the bubble wall. Bubbles with the critical profile will begin to expand due to the pressure difference between the false and true vacuum states.
As bubbles with high expand, the field profile inside the bubble remains close to . In the frame in which the center of the bubble is at rest, the bubble wall will become thinner due to Lorentz contraction. Thick wall bubbles have substantially different dynamics. For these the field at the centre of the bubble will move towards from its initial value of as the bubble starts to expand. It will then proceed to oscillate around , resulting in outgoing waves of the scalar field following the bubble wall. We depict this behaviour for a thin wall bubble and a thick wall bubble in Fig. 3.


For times and for , the profile of the bubble should be given by . Therefore and . We define the Lorentz factor of the bubble wall by measuring how much the wall contracts, . This can be expressed as
| (30) |
We show how increases for a series of at early times in Fig. 4. It can be clearly seen that as , where and take smaller values, grows more rapidly.

II.4 Collision
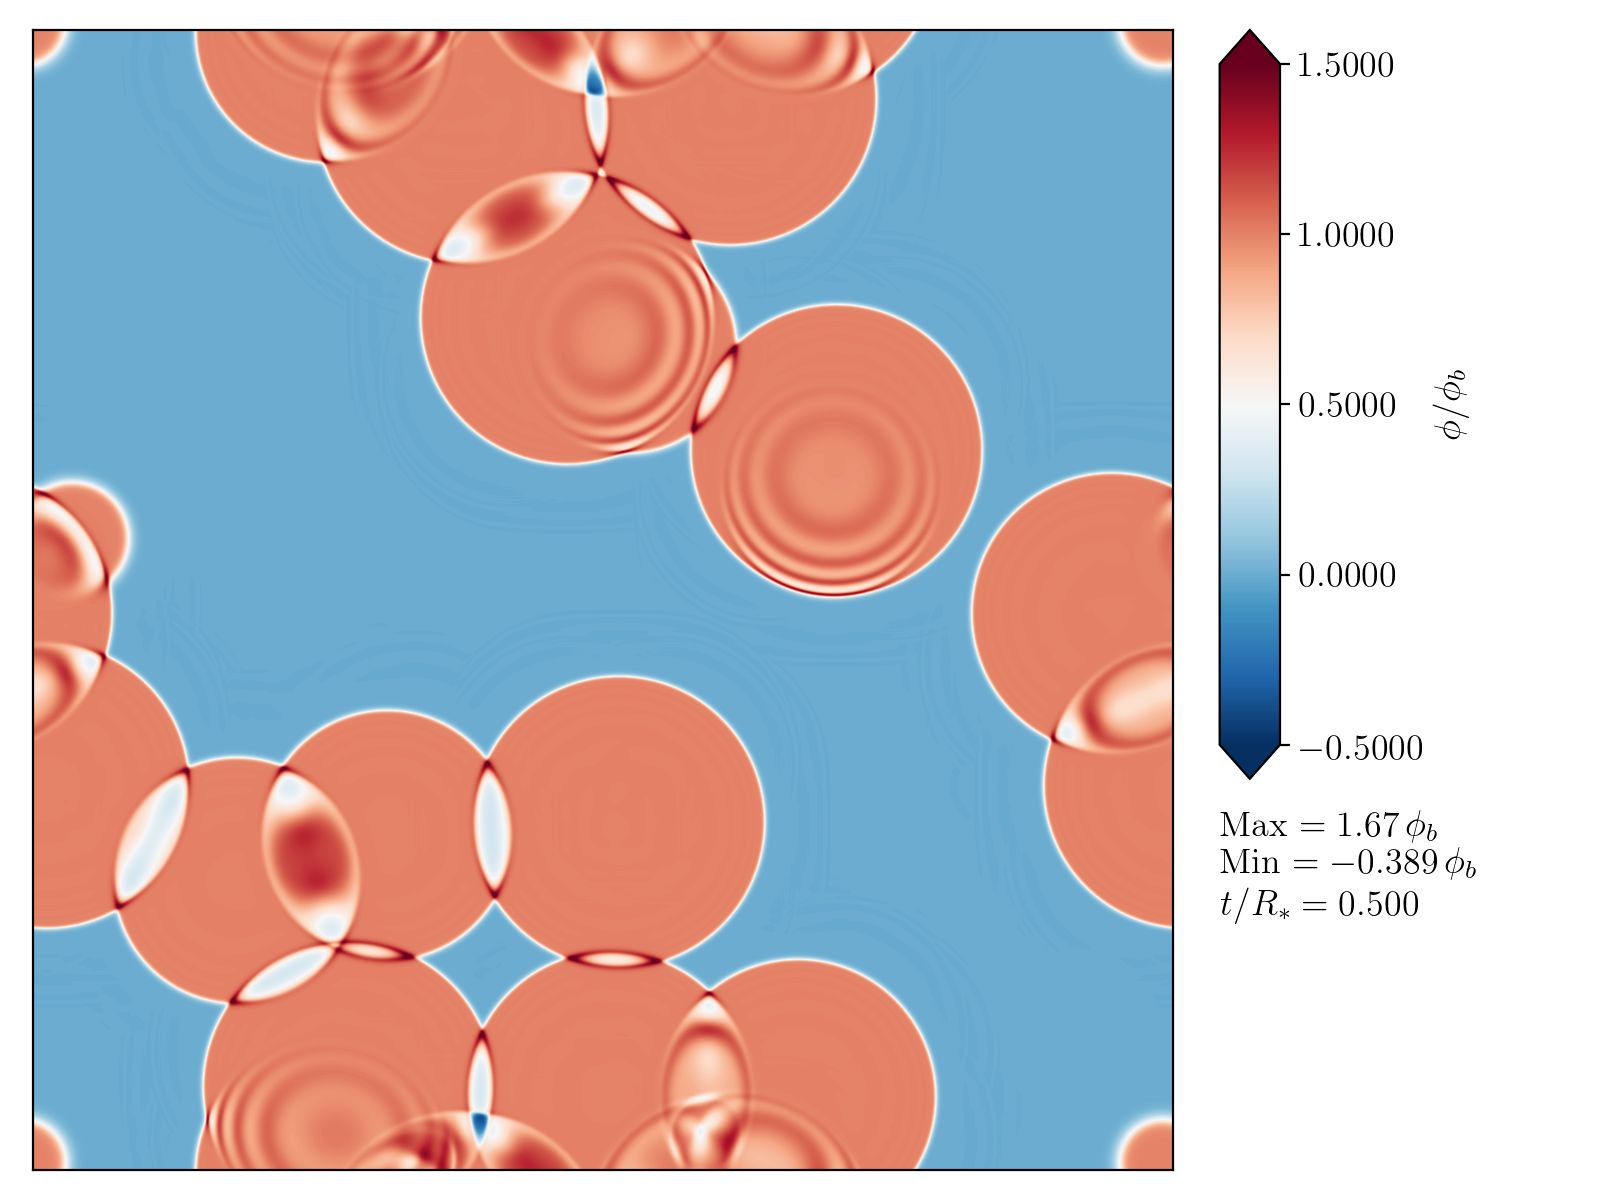
When two true vacuum bubbles collide, the scalar field begins to oscillate in the region where the bubbles overlap. During this oscillation the scalar field will rebound towards the false vacuum [65, 68]. For thin wall potentials with closer to 1, the scalar field in the overlap region can rebound over the potential barrier and return to the false vacuum. This corresponds to the trapping discussed in Ref. [69]. On the other hand, for thick wall potentials with smaller , the scalar field in the overlap region will instead oscillate around the true vacuum state. According to Ref. [69], this is where we would expect the bulk flow model to apply. The value of separating these behaviours has been demonstrated to depend on , see Fig. 13 of Ref. [69] for more details. We show both these behaviours in Fig. 5. In both cases, the oscillations produce scalar field radiation that is emitted at close to the speed of light. Neither of these effects is accounted for in the envelope approximation which instead assumes that all shear-stress disappears in the overlap region.
For all values of , the scalar field will continue to oscillate around the true vacuum after the true vacuum bubbles have finished colliding. It is known that the thermalisation of scalar fields is a long-lasting process in the absence of other interactions [74, 75, 76].


III Gravitational waves from a vacuum transition
To calculate the gravitational-wave power spectrum, we need to find the transverse traceless (TT) metric perturbations where
| (31) |
and is the transverse traceless projection of the energy-momentum tensor,
| (32) |
where is the Minkowski metric. The energy density in the gravitational waves can be defined as
| (33) |
Note that an average over many wavelengths and periods may be needed in order to reduce fluctuations in this quantity. In general, while gravitational waves are being sourced .
We introduce an auxiliary tensor which satisfies [77]
| (34) |
To obtain we use the projector on in momentum space,
| (35) |
where
| (36) |
and
| (37) |
We then define the spectral density of the metric perturbations as
| (38) |
Therefore, the power spectrum of gravitational wave energy density is
| (39) |
and by dividing through by the critical energy density we obtain
| (40) |
which we refer to as the gravitational-wave power spectrum.
III.1 Collision phase
Upon collision, the spherical symmetry of isolated bubbles is broken, and gravitational waves become sourced by the shear-stress located at the bubble walls. During the collision phase, gravitational waves are generated at large wavelengths associated with the scale of the bubble sizes at collision time.
This period has been studied both using lattice field theory simulations [63, 64] and using simplifying assumptions such as the envelope approximation [41, 43, 44] and bulk flow model [46, 44].
The envelope approximation [41] is based on two key assumptions. The first is that the shear-stress in the scalar field is entirely located in an infinitesimally thin shell located at the bubble wall. The second approximation is that when bubbles collide, the shear-stress is removed in the overlap region. Hence, to compute the transverse traceless shear-stress sourcing the gravitational waves, it is sufficient to consider the envelope from expanding bubbles. The gravitational-wave spectrum has been calculated for exponential nucleation rates using numerical simulations in Refs. [41, 43, 44].
The gravitational-wave power spectrum is well approximated by a broken power law
| (41) |
with power law exponents and , peak amplitude and peak wavenumber .
For a vacuum phase transition where the wall velocity approaches the speed of light, the power law exponents were found to be and [44]. The peak amplitude was given by
| (42) |
where is the vacuum energy density parameter. The peak wavenumber was estimated to be
| (43) |
Note that the value of that is expected for a vacuum transition with exponential nucleation rate is
| (44) |
Analytical investigations using the envelope approximation [45], have shown that the two-point correlator of the energy-momentum tensor can be expressed as a 1-dimensional integral. This then results in the gravitational-wave power spectrum being given by a broken power law with exponents and .
In the bulk flow model, the envelope approximation is modified [46, 44]. The shear-stress during the transition is still considered to be located in an infinitesimally thin shell located at the bubble wall. However, in the bulk flow model, the shear-stress in the bubble wall is not assumed to disappear upon collision. Instead, the bubble wall continues to propagate but is no longer driven by the latent heat of the transition. The bubble wall energy density per surface element then decays as , where refers to the bubble radius and the time of collision. The value of indicates the typical damping timescale of the wall and should be determined from the particle physics model. The value of corresponds to the envelope approximation, whereas corresponds to free propagation of the wall after collision. Analytical treatments for ultra-relativistic bubbles have shown that as , the IR power law in the gravitational-wave power spectrum becomes shallower than , tending towards [46].
The gravitational-wave power spectrum in the bulk flow model with and an exponential nucleation rate has also been studied with numerical simulations [44]. The resulting fit for ultra-relativistic wall velocities was given in the same form as Eq. 41 with power law exponents and . The peak amplitude was given as
| (45) |
and peak wave number
| (46) |
In Ref. [64], full lattice field theory simulations of colliding vacuum bubbles were conducted. The authors simulated the gravitational-wave power spectrum produced by colliding thin-wall bubbles, with . The bubbles were separated on average by a distance , which is then the typical diameter of bubbles when they collide. The value of in each simulation was chosen so that the Lorentz factor of a bubble with diameter was . A number of different nucleation scenarios were investigated, which did not have a significant effect on the resulting spectrum.
In the aforementioned work, a fit for the spectrum resulting from bubble collisions was provided in the form
| (47) |
where the value of was fixed to . From the simulations conducted it was found that
| (48) | ||||
| (49) | ||||
| (50) |
with the Hubble parameter at the time of the transition. This corresponds to a slightly reduced total gravitational-wave power compared to the envelope approximation, and furthermore a slightly steeper UV power law. It was suggested that the deviation from the envelope approximation was due to the behaviour of the scalar field in the overlap regions. While the envelope approximation assumes that the shear-stress in the bubble wall disappears upon collision, lattice field theory simulations indicate that the scalar field oscillates in the overlap region during bubble collisions.
The fits provided for the gravitational-wave power spectrum arising from the bulk flow model and the envelope approximation are both taken from simulations using an exponential nucleation rate. Caution should be used when comparing them to the simulations in this paper which correspond to simultaneous nucleation scenario. While the gravitational-wave power spectrum from lattice simulations did not show a strong dependence on the nucleation scenario in Ref. [64], it has been shown that the envelope approximation peak frequency can be shifted by up to a factor of and the peak amplitude by a factor of when changing between exponential and simultaneous nucleation [51]. It has also been demonstrated that varying the nucleation rate in the envelope approximation can affect the shape of the power spectrum around the peak, with simultaneous nucleation creating a sharper peak than exponential nucleation [72].
In this work we intend to extend the results in Ref. [64] to potentials with much smaller . The behaviour of the scalar field in the overlap region during bubble collisions varies depending on the value of , as described in Section II.4. If it is true that the deviation from the envelope approximation corresponds to the structure in overlap regions, the form of the power spectrum may depend on the value of . We will pay particular attention to whether there is a change in the total gravitational-wave power or the UV broken power law exponent due to a variation in .
III.2 Oscillation phase
Once the bubbles have finished colliding in a vacuum first-order phase transition, the scalar field is left in an excited state. In this state, oscillates around the true vacuum value, , and as such we refer to this period as the oscillation phase. Eventually, these oscillations are expected to subside as the scalar field thermalises and Hubble friction damps away gradients in the field. In previous lattice field theory simulations, it has been shown that gravitational waves continue to be sourced during this period [63, 64].
In Ref. [63], this phase was referred to as a coalescence phase. It was posited that the gravitational waves produced during this period would dominate over those produced from bubble collisions, and will furthermore shift the peak of the power spectrum towards the UV. However, in Ref. [64] it was shown that the peak frequency of the gravitational-wave power spectrum generated during this phase was associated with the microphysics of the system, namely , rather than the cosmological scales that correspond to . When the separation of these two scales was extrapolated from the simulations up to realistic values, the gravitational-wave power of the collision phase is expected to dominate. Furthermore, the peak frequency corresponding to the oscillation phase would be firmly out of range of any upcoming gravitational-wave detectors for any realistic early universe phase transition.
In this study we aim to resolve whether the result found in Ref. [64] extends to a wider range of , or whether the gravitational-wave power or peak frequency changes for thick wall bubbles.
IV Methods
To conduct our simulations in this paper, we employ an updated version of the code used in Ref. [64]. This is a 3D classical lattice field theory code built using the LATfield2 library in C++ [78].
For each simulation, the fields are evolved on a lattice of points using a Crank-Nicholson leapfrog algorithm. We impose periodic boundary conditions, which corresponds to the approximation that the universe is isotropic and homogeneous at the scale of the simulation box. We use a 7 point stencil for the Laplacian operator. We pick an appropriate lattice spacing and fix the timestep . The final simulation time is .
To understand how the gravitational-wave power spectrum changes between thin and thick wall bubbles, we perform simulations with four different values of . These, along with various corresponding parameters derived from the potential, are given in Table 1.
When choosing a lattice spacing, we perform a series of convergence tests for each set of simulations, which we detail in App. A. For the largest simulation for each choice of we perform a low, medium and high resolution run with a factor of two smaller lattice spacing for each increase in resolution. The lattice spacing for the high resolution run is then used in the rest of the paper. For the gravitational wave power spectrum we take the uncertainty for each bin to be given by the difference of the power found in the high and medium resolution run. For the number of bubbles used in the largest simulations, the uncertainty in each bin arising from performing multiple realisations is very small for all but the most infrared modes, and can be neglected compared to the lattice uncertainty. For more information on the convergence rate, see App. A.
To compare our choice of potential parameters with the quartic potential in Ref. [69], we use the conversion between and given below,
| (51) |
We list the corresponding values of for each in Table 1. In Fig. 13 of Ref. [69] it can be seen that trapping is exhibited for when . From this we infer that and exhibit trapping behaviour for , whereas and do not.
In Ref. [64] a range of different nucleation rates were used. The nucleation rate did not appear to have a detectable effect on the gravitational-wave power spectrum. To limit the computational cost, we choose to study only simultaneous nucleation, where we nucleate all bubbles at the start of the simulation on the zeroth timestep. Bubbles are nucleated randomly in the symmetric phase, providing that for all , the distance between the th and th bubble centres obeys the following relation
| (52) |
where is the time since nucleation of the th bubble. For simultaneous nucleation for all . We nucleate a total of bubbles in each simulation.
Bubbles are nucleated into the simulation with the corresponding critical profile. The critical profile is found by using a shooting algorithm to determine the bounce solution for a given potential.
The average separation between bubbles is , where is the volume of the simulation. When bubbles collide, they will on average have a diameter of , and so this quantity sets the length scale of the peak of the gravitational-wave power spectrum. In our simulations, we choose such that the value of the Lorentz factor for a bubble of diameter is .
Once and are fixed, the combination is also determined uniquely. This is important as effectively dictates the separation between the length scales of the physics from bubble collisions and the microscopic physics from oscillations about the true vacuum. In a true vacuum phase transition, these scales would be separated by many orders of magnitude as , but achieving this separation of scales numerically is not possible.
To supplement our 3D simulations, we also perform a series of spherically symmetric 1D simulations of isolated bubbles. This enables us to study the effect of the lattice on the evolution of , , and . This analysis is provided in Appendix A. We evaluate for an isolated bubble in both the 1D code and 3D code and list these values in Tables 2 and 3.
We also perform a series of simulations in order to understand the gravitational waves sourced by the oscillation phase of the scalar field. To do this we perform long-lasting simulations where the evolution of the metric perturbations is only turned on after the phase transition has completed, around . We list the simulations that we conduct to understand the gravitational waves sourced by the collision phase in Table 2, and for the oscillation phase in Table 3.
The simulations studying the collision phase all finish at , with the exception of the largest simulation with and which terminates at due to time limits imposed by the computing facilities utilised. The smaller but longer lasting simulations studying the oscillation phase terminate at .
V Results: scalar field
During a vacuum first-order phase transition, the scalar field undergoes several phases of evolution. First occurs the nucleation and expansion of bubbles. Next, the bubbles begin to collide and the field oscillates in the overlap regions. Finally, the bubbles finish colliding, and the scalar field oscillates around as the field thermalises.
It is useful to investigate the evolution of the total, kinetic, gradient and potential energy densities of the scalar field. We show this for several simulations with a range of and in Fig. 6. There appears to be little variation in the mean energy densities for different , nor any consistent trend as it changes. By tracking the evolution of we can see that in all cases the bubbles finish colliding shortly after . Around this time the kinetic, gradient and potential energy densities settle to constant values. As does not tend to zero at the end of the simulation, we know that the scalar field continues in the oscillation phase after the bubbles finish colliding. The scalar field does not thermalise during the duration of our simulations. We can also see that the total energy density in the scalar field is well conserved, with minimal energy being lost to the lattice.

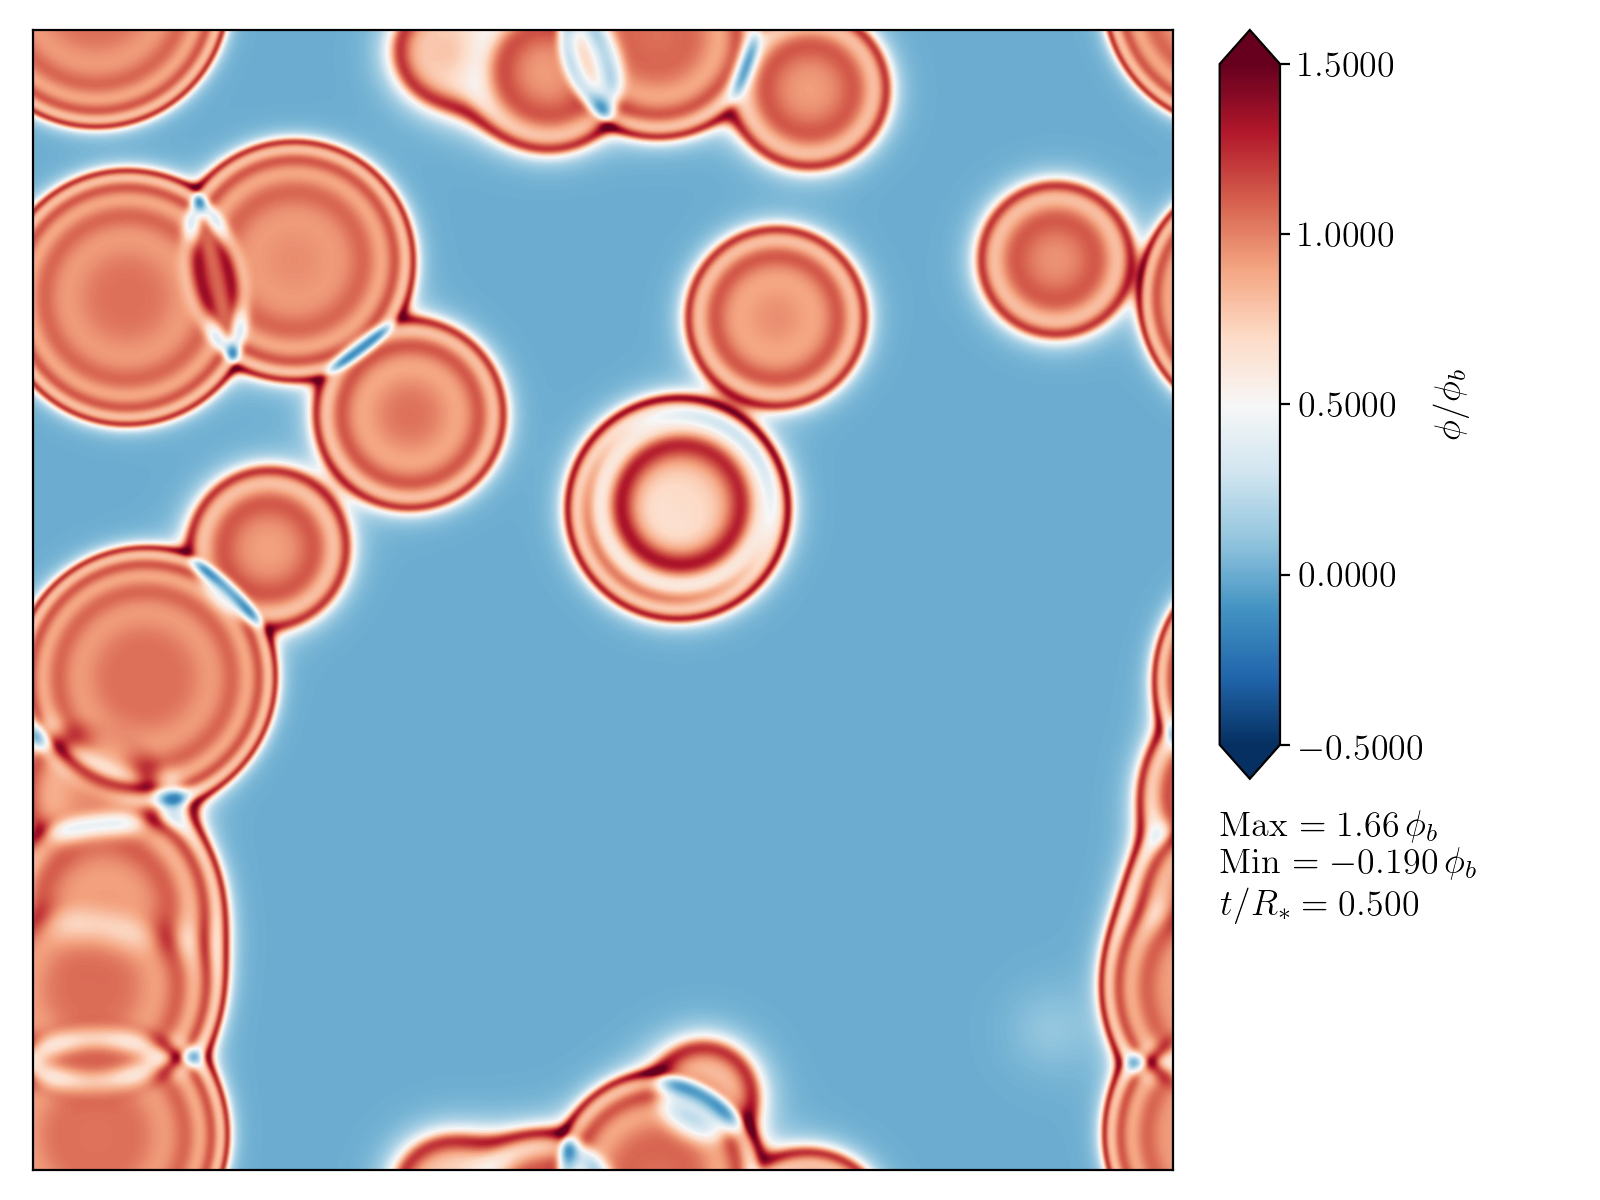
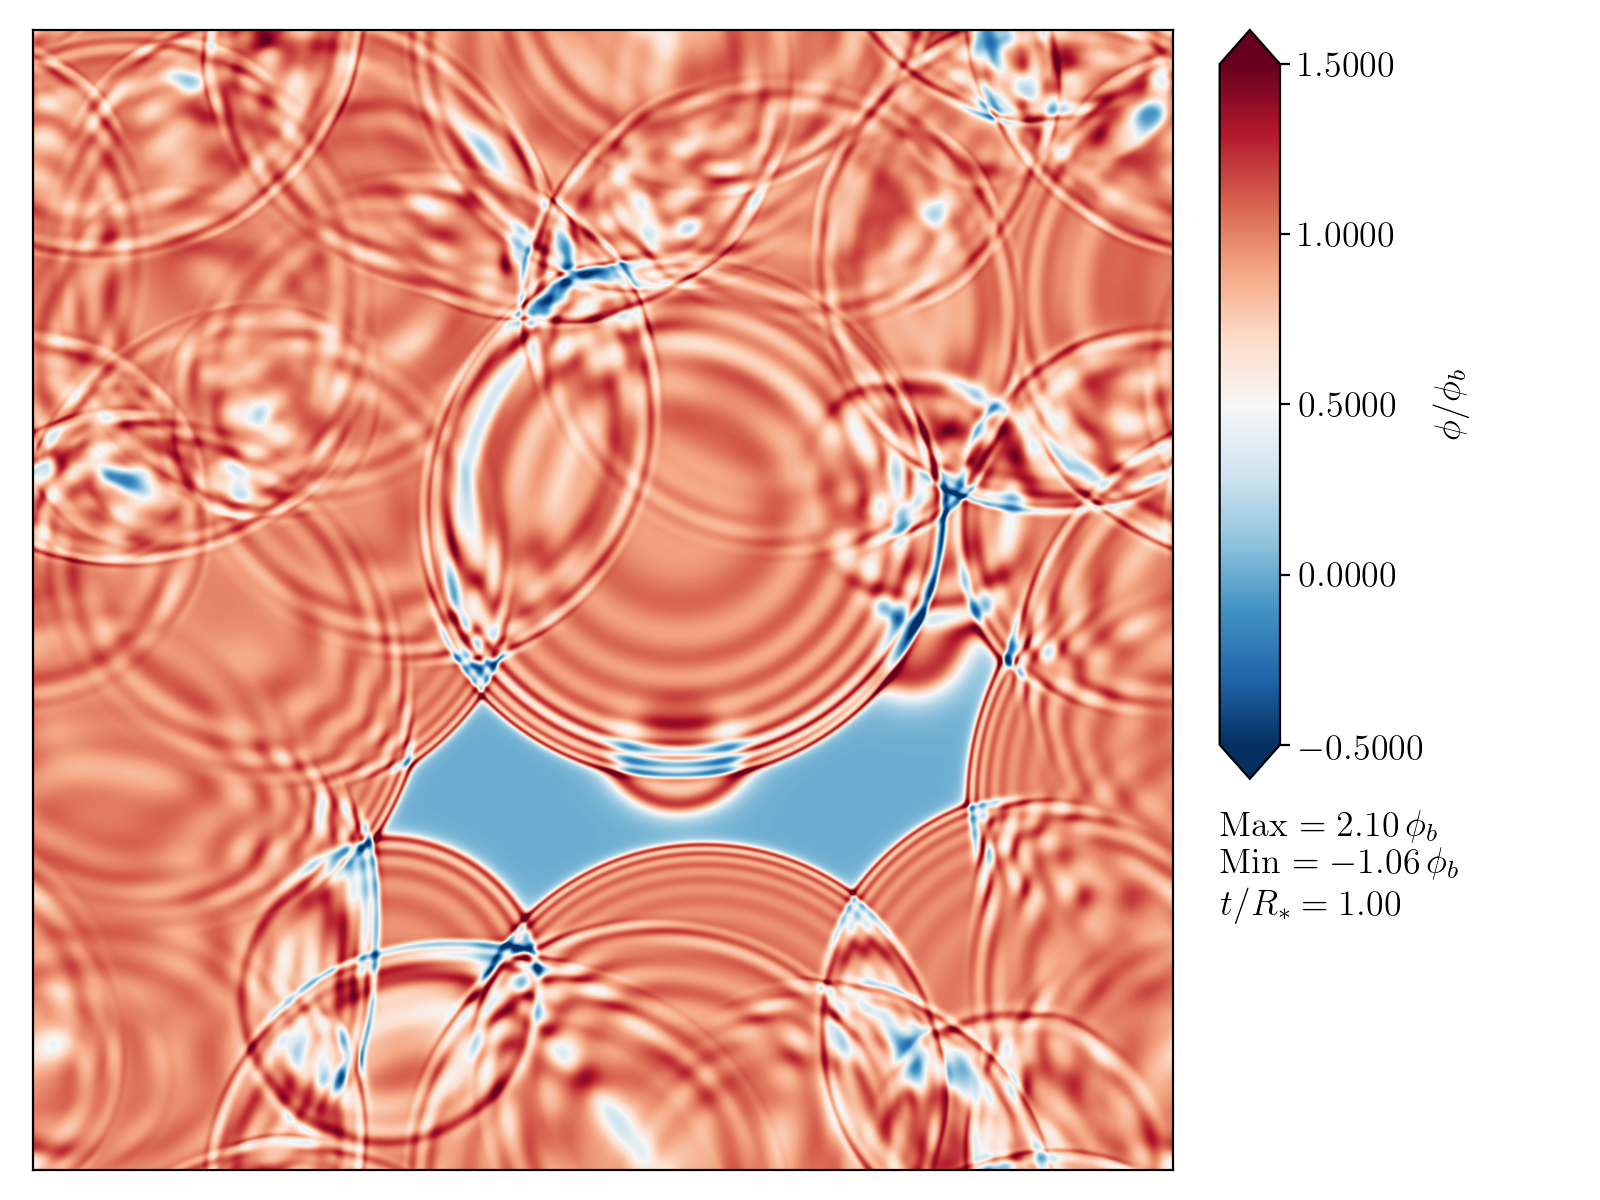
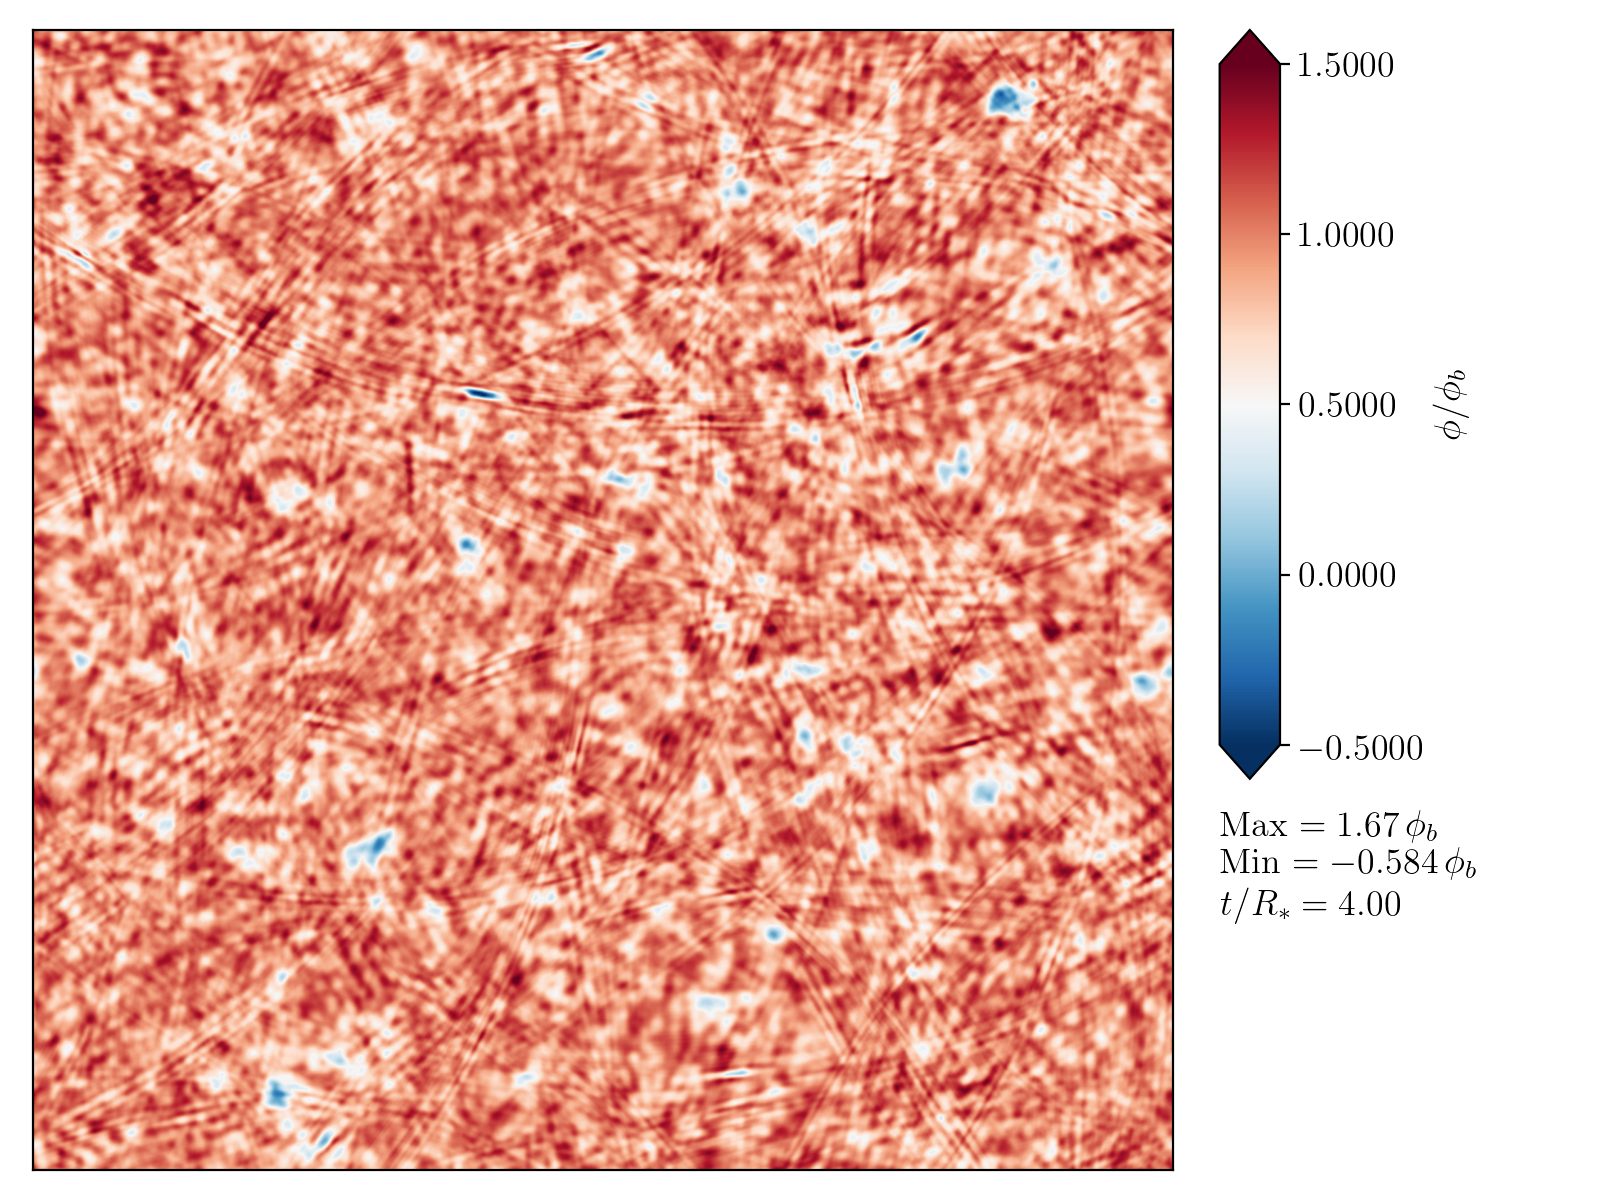
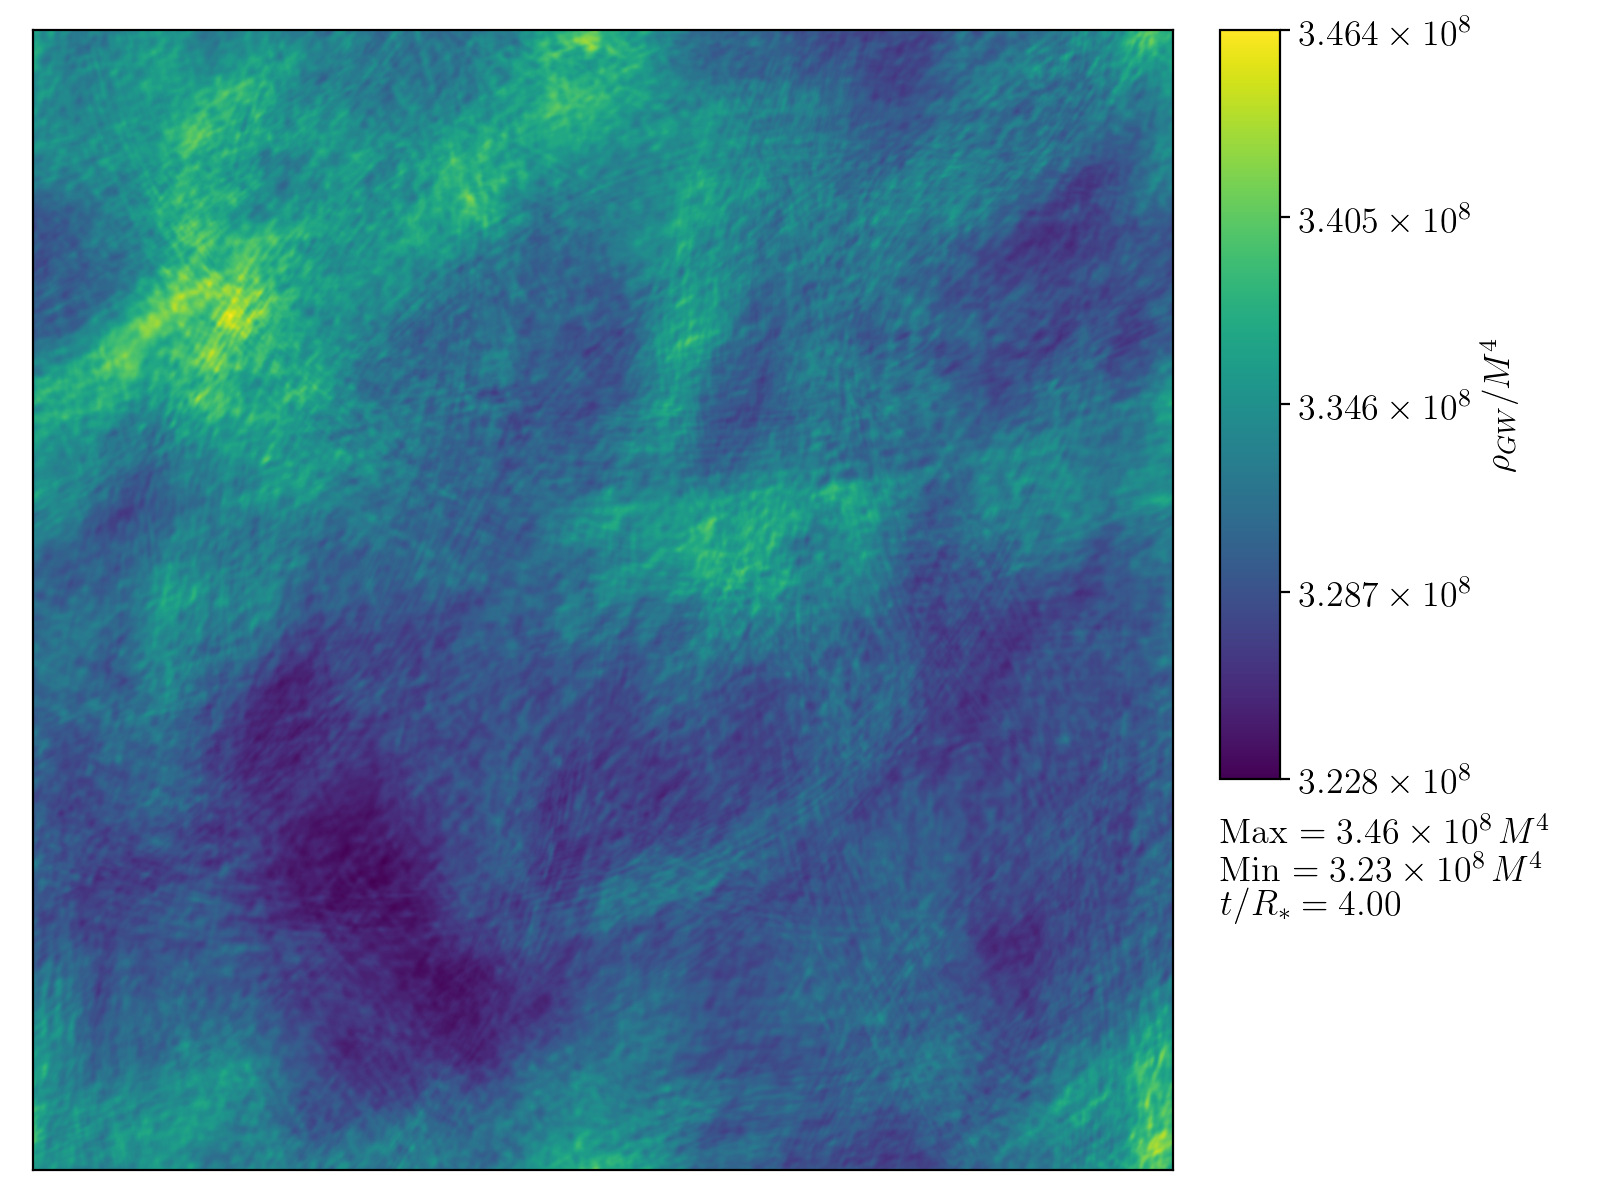
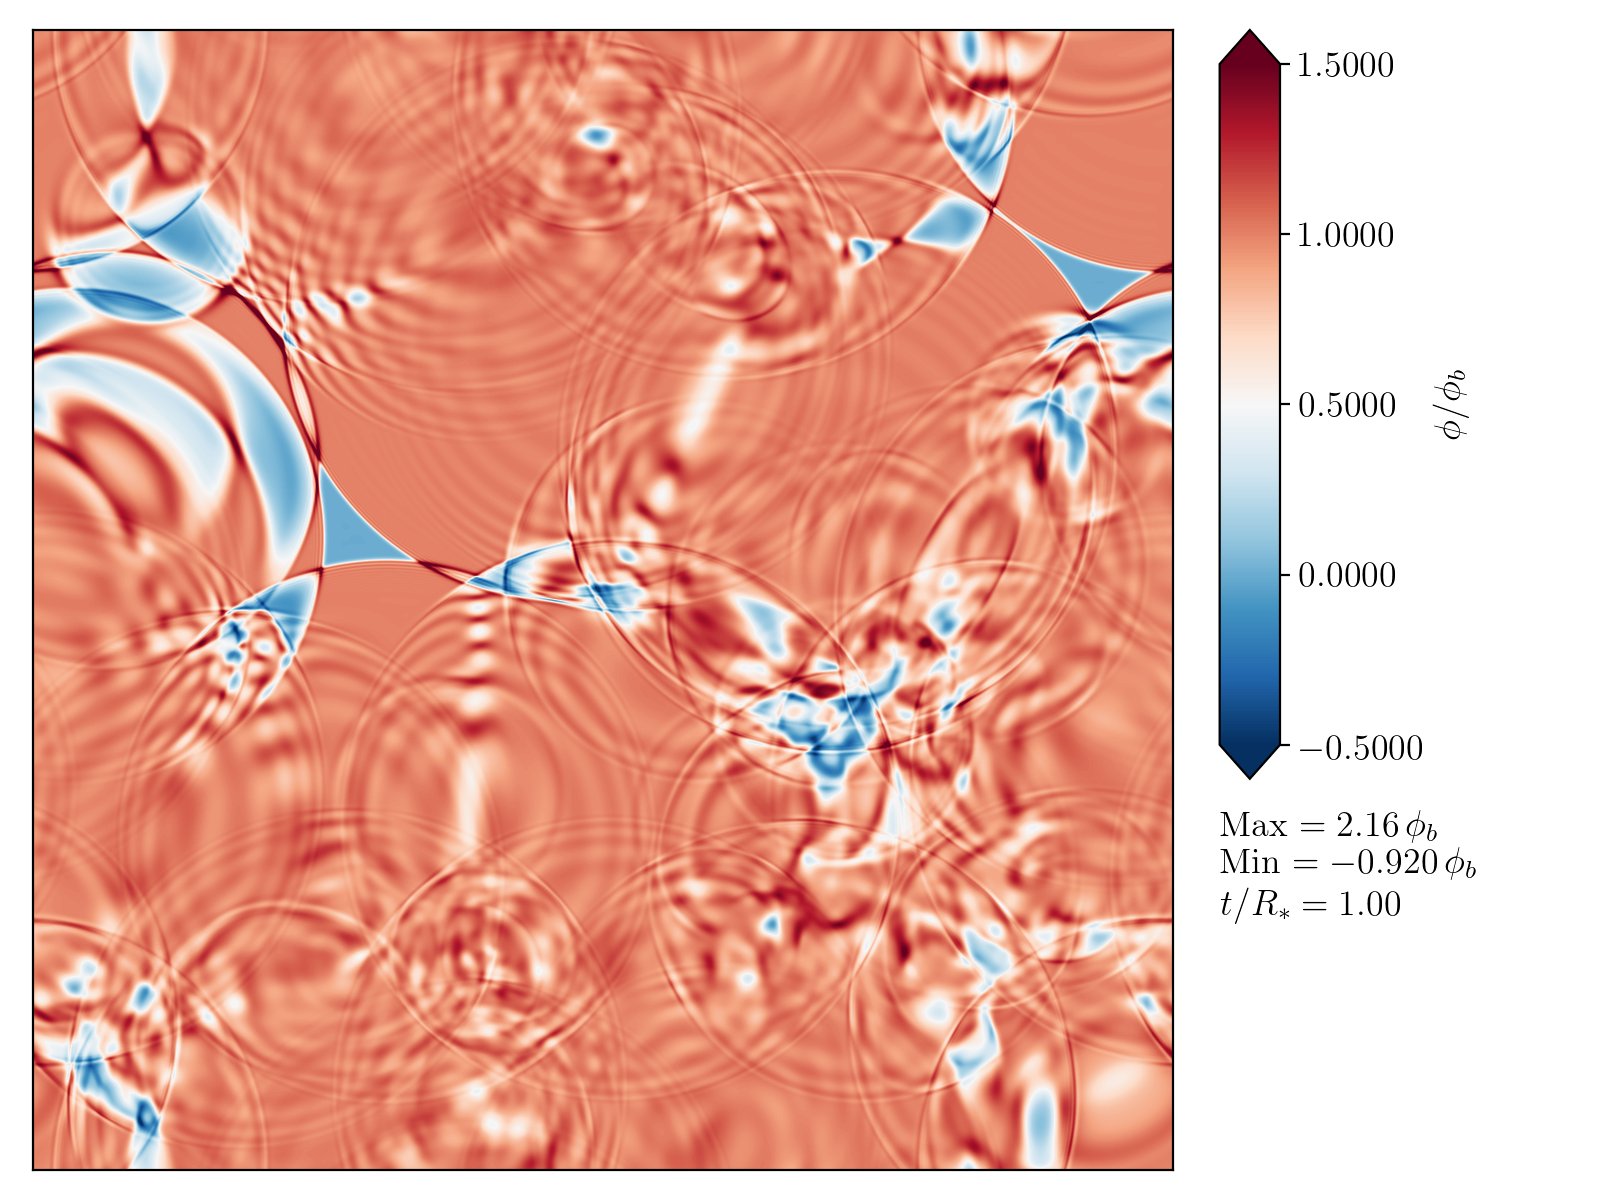
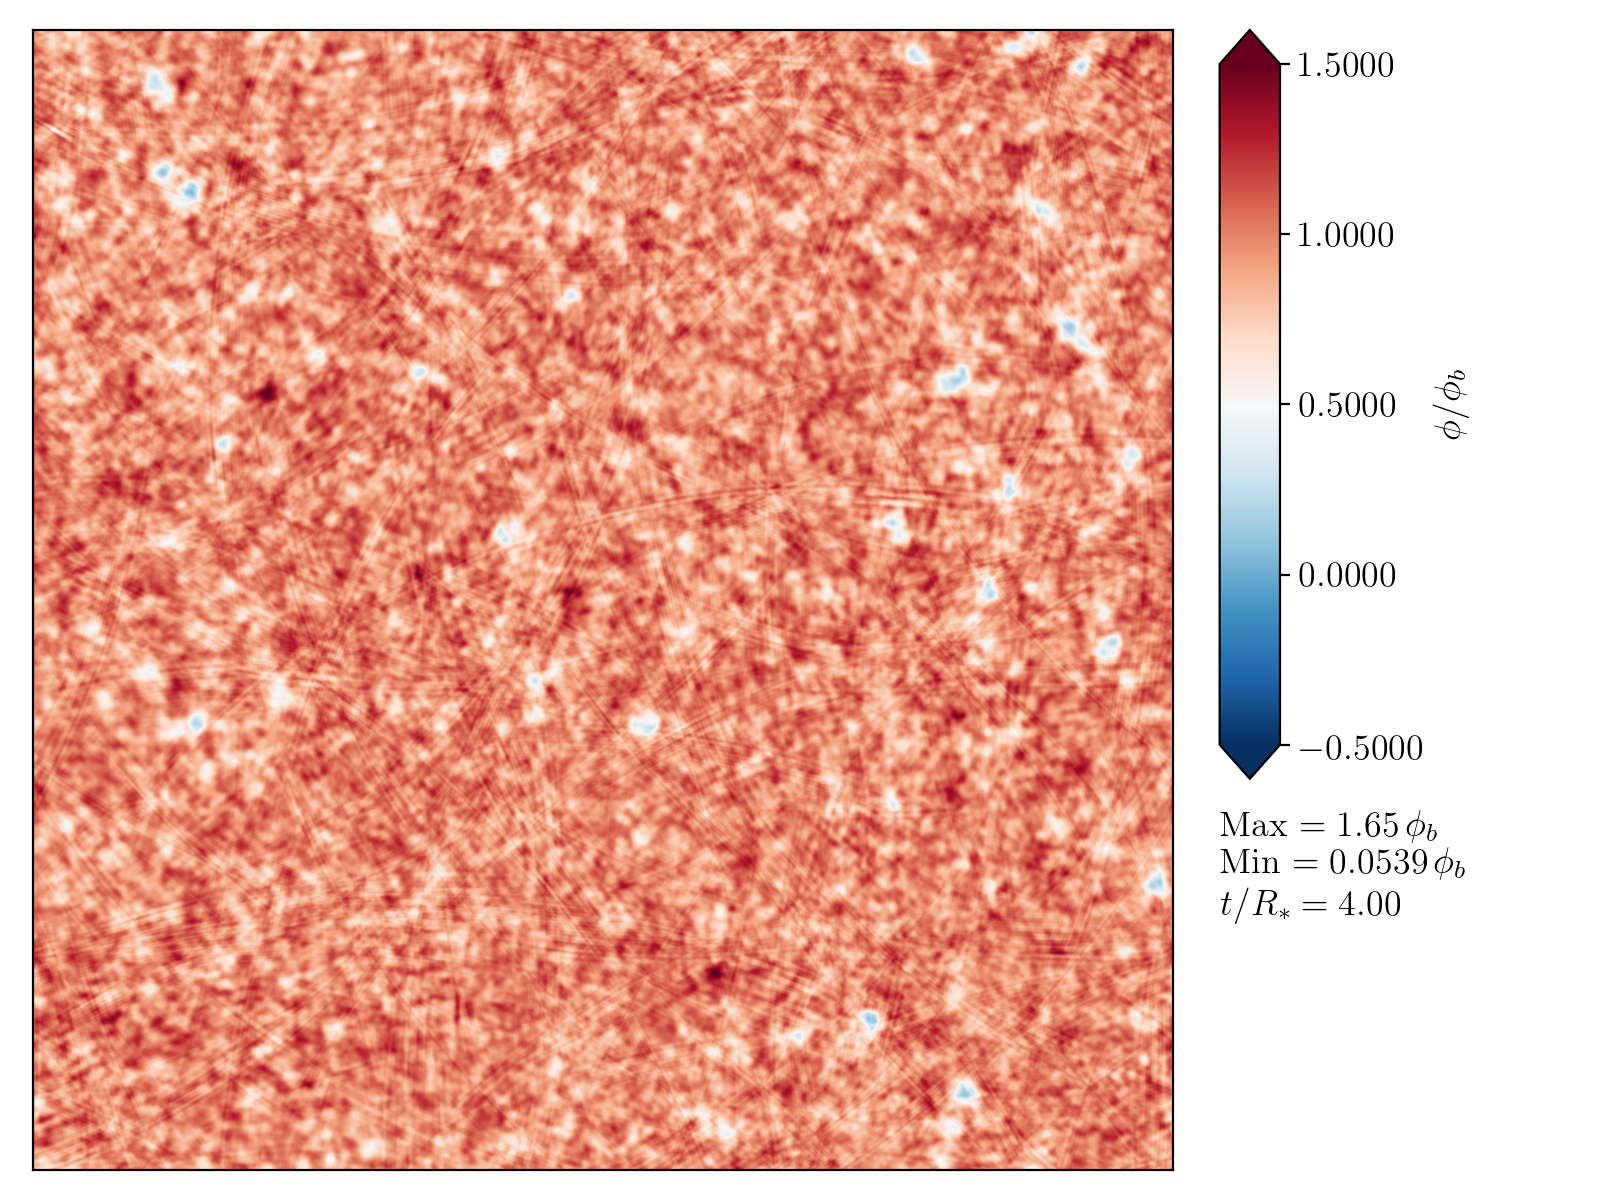
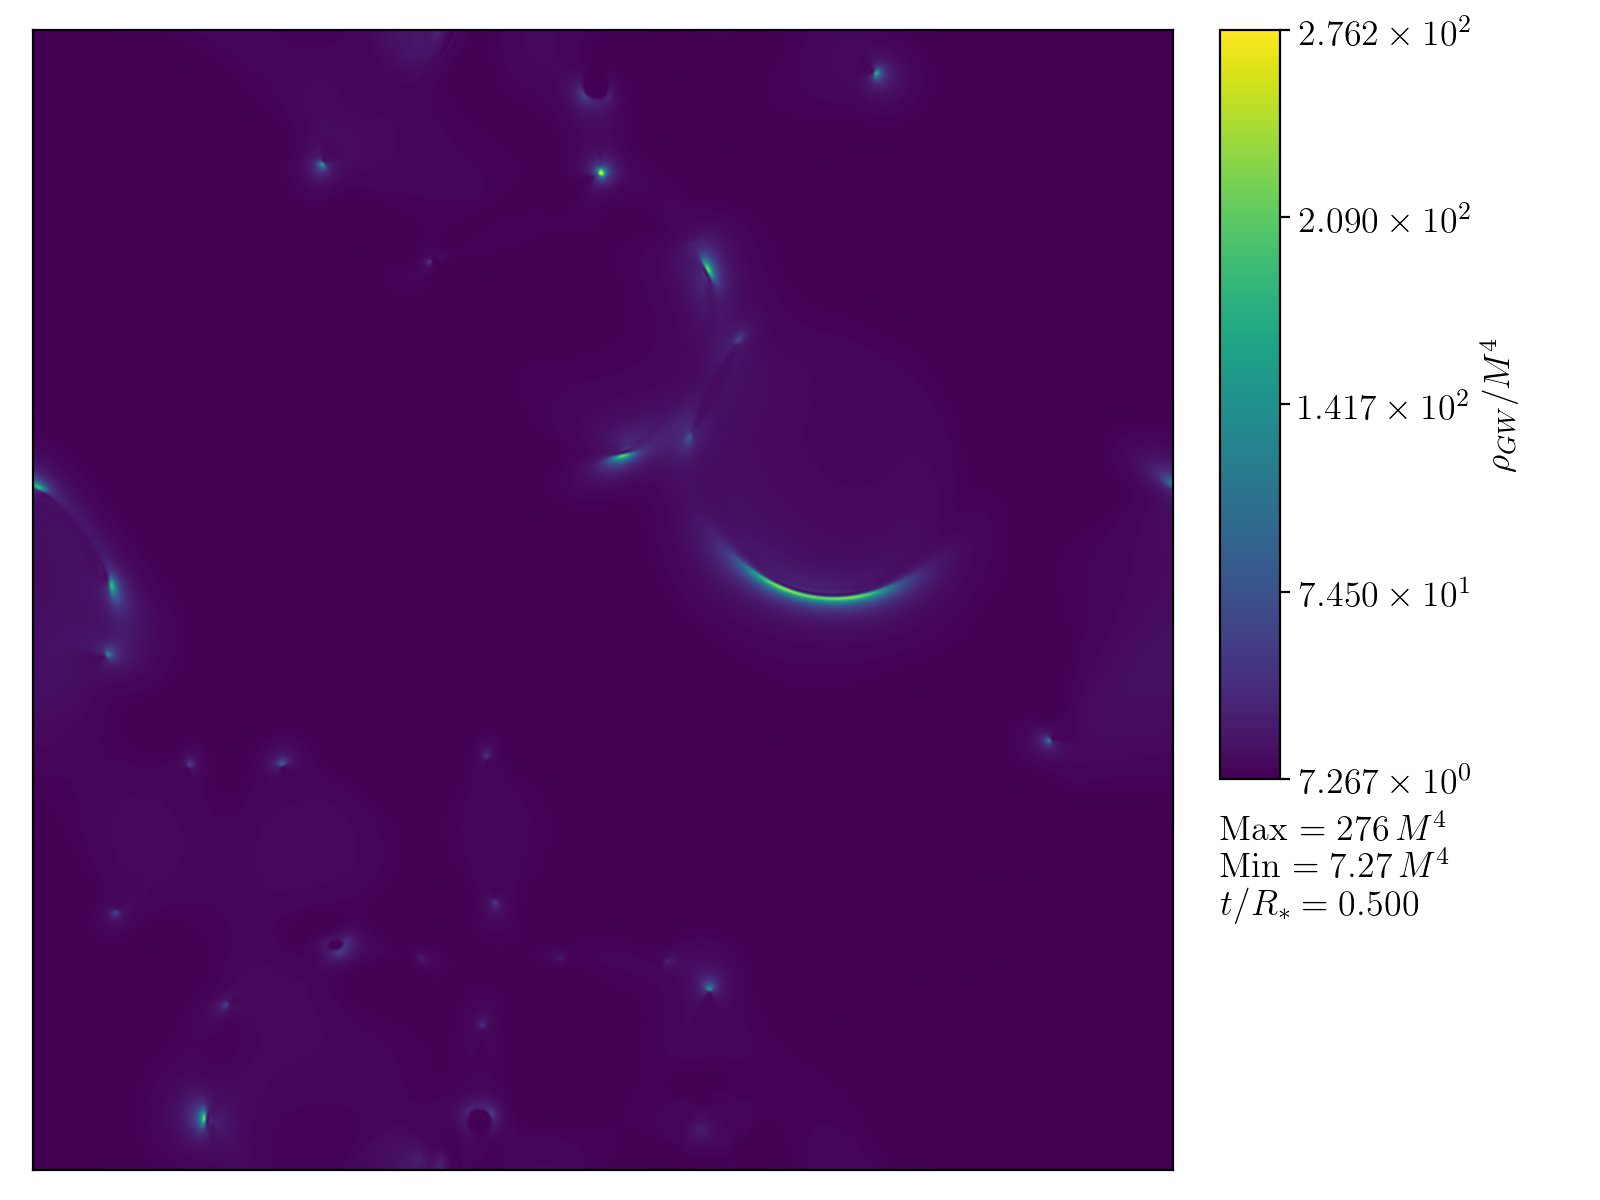
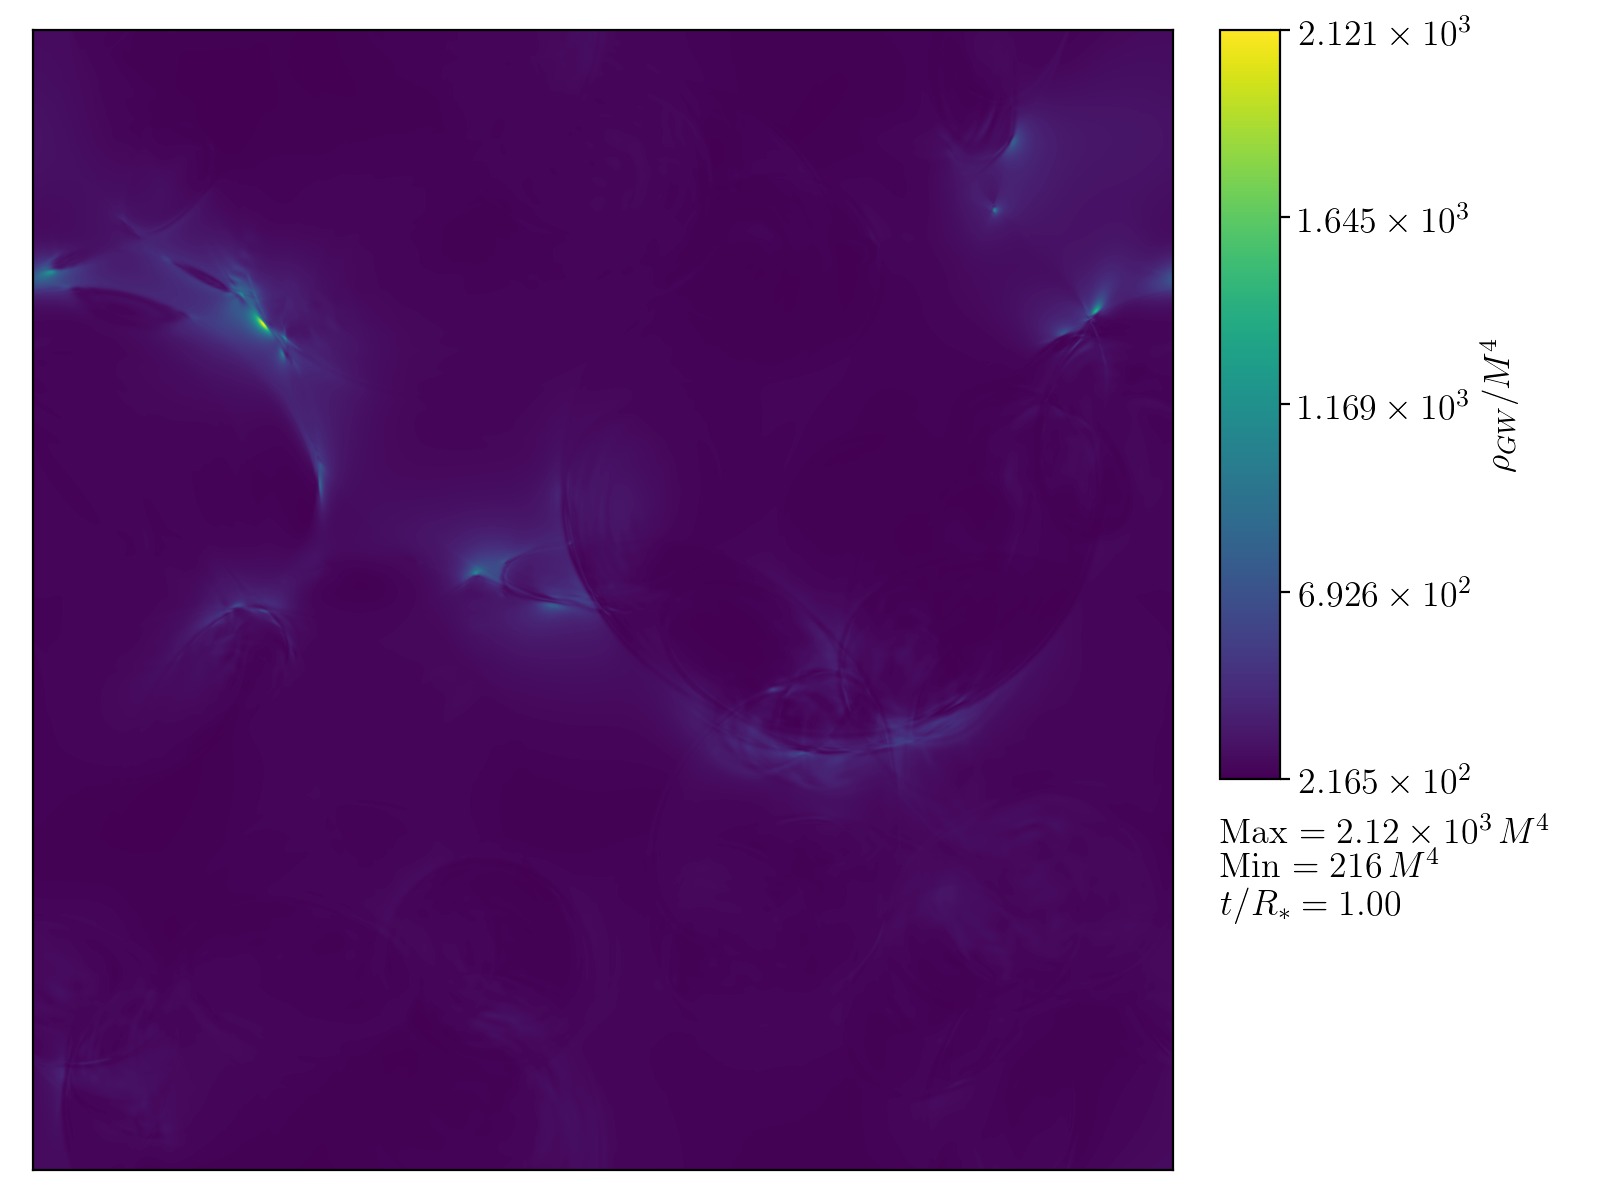
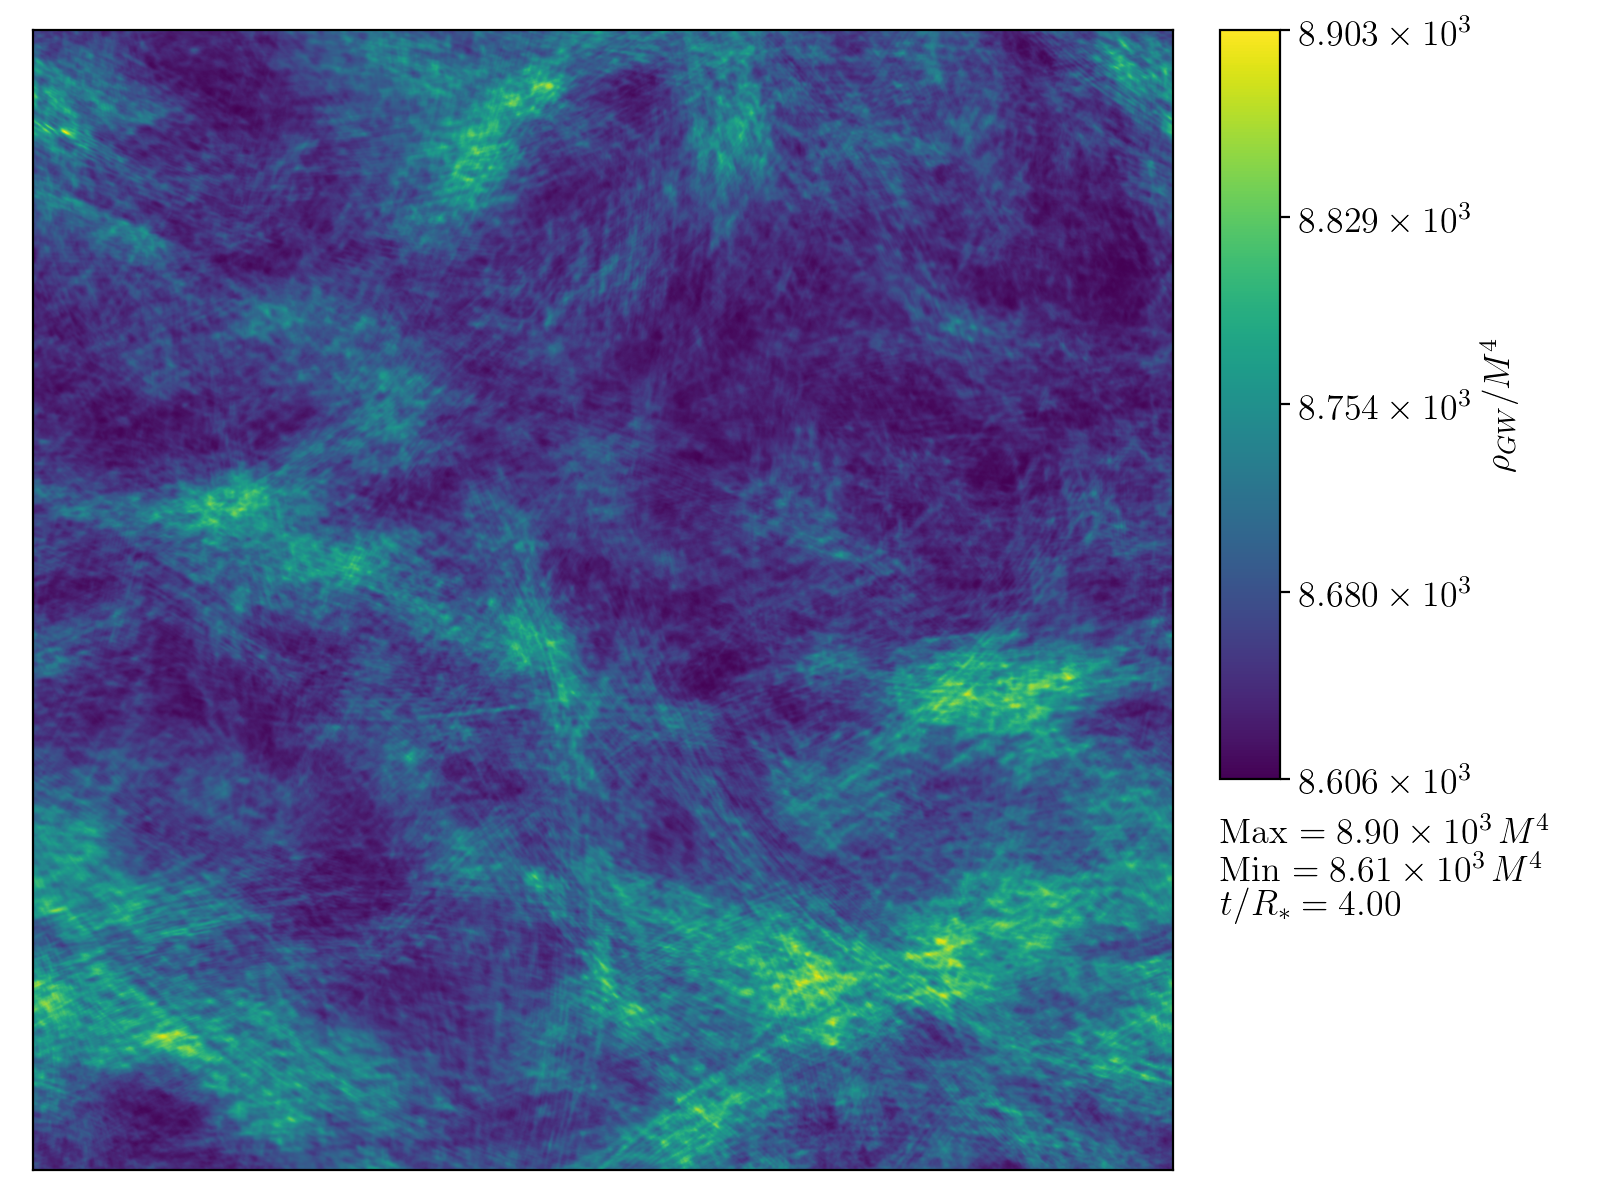
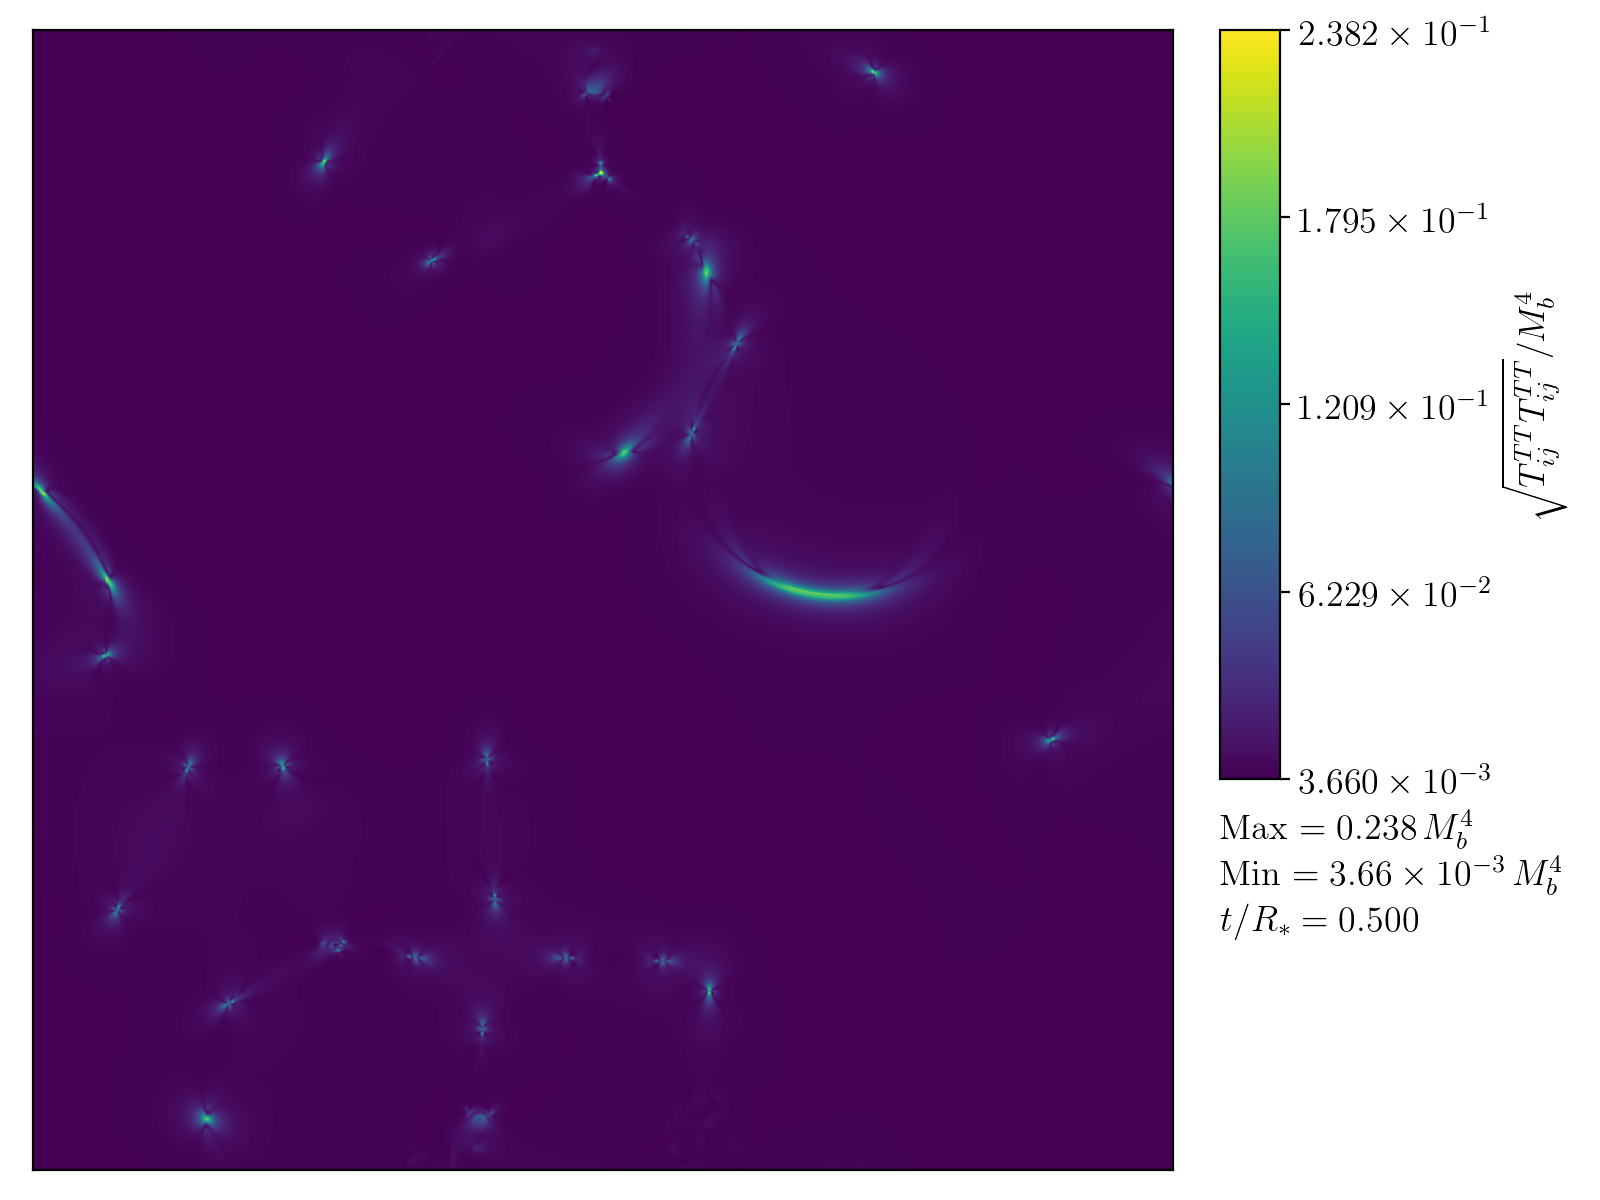
Further insight into the behaviour of the scalar field can be deduced from examining slices through the simulation box. In Appendix B we show slices of the scalar field for two simulations with and and . We plot these slices at three different times, . These correspond to early on in the bubble collision phase, towards the end of this phase where most bubbles have finished colliding, and much later during the oscillation phase. These simulation slices confirm the behaviour outlined in Section II.4. When is small, the expanding scalar field profile oscillates around and the rebound in the overlap region towards the symmetric phase is minimal. For larger , the rebound can be quite dramatic.
In Fig. 7 we show the power spectrum of the scalar field, for two simulations with and . We see that at early times while the bubble is expanding, the power spectrum is peaked around the scale of . At later times, as the scalar field begins to oscillate, the peak wavenumber for the power spectrum increases, moving further towards the length scale associated with . It is interesting to note that the decay of power in the IR is not as rapid as one might initially expect. Although the bubbles have finished colliding around , the power in the scalar field in the IR decays slower, reaching a minimum only after several .


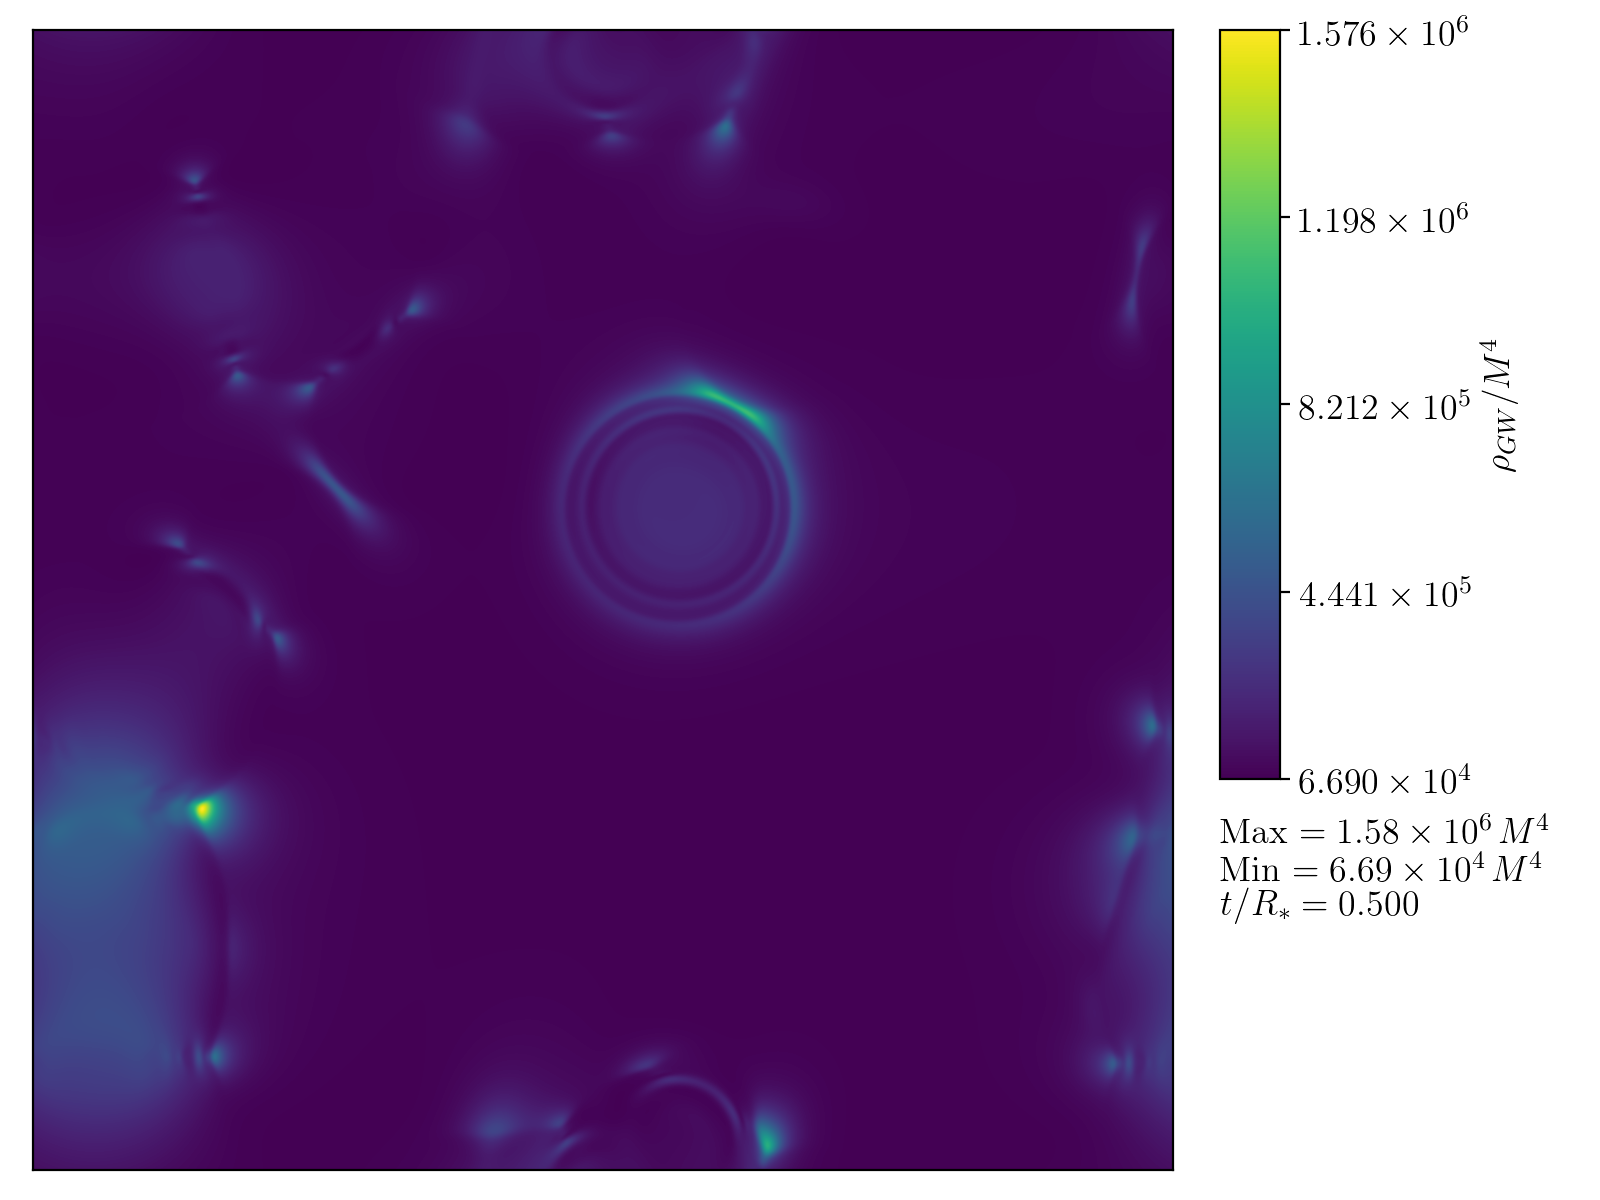
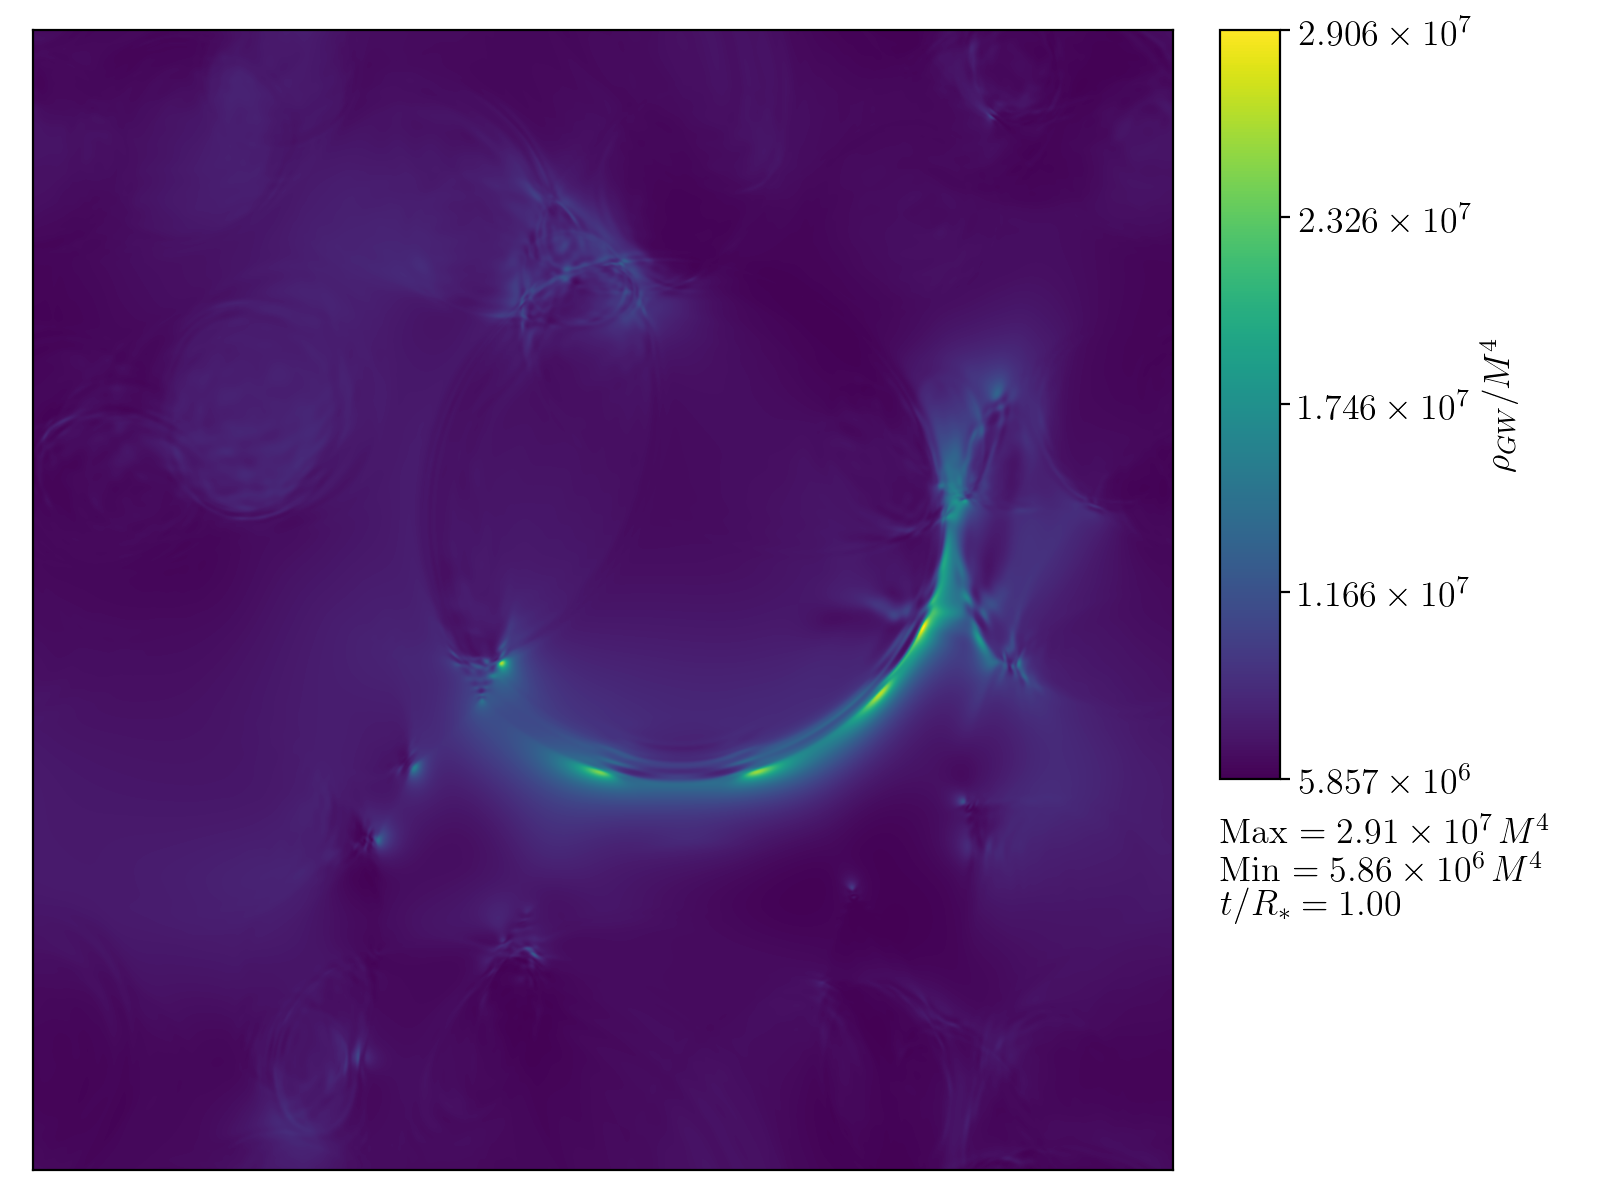
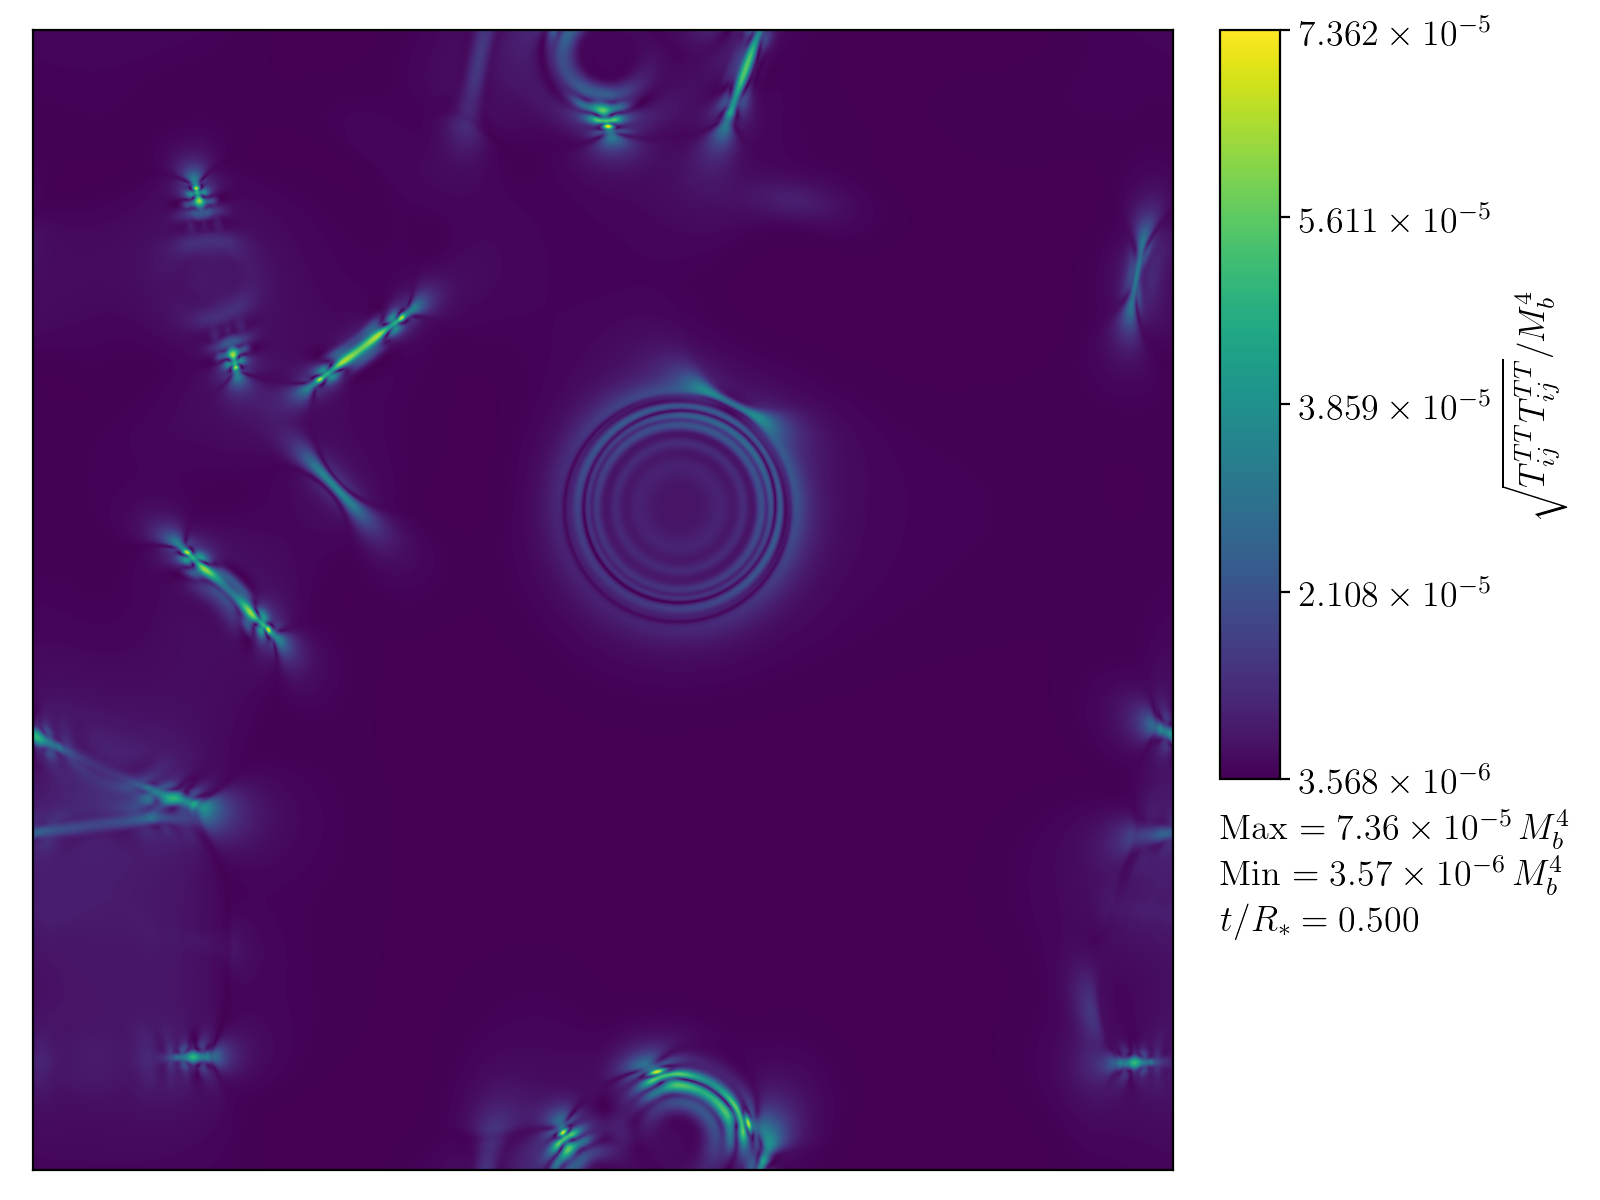
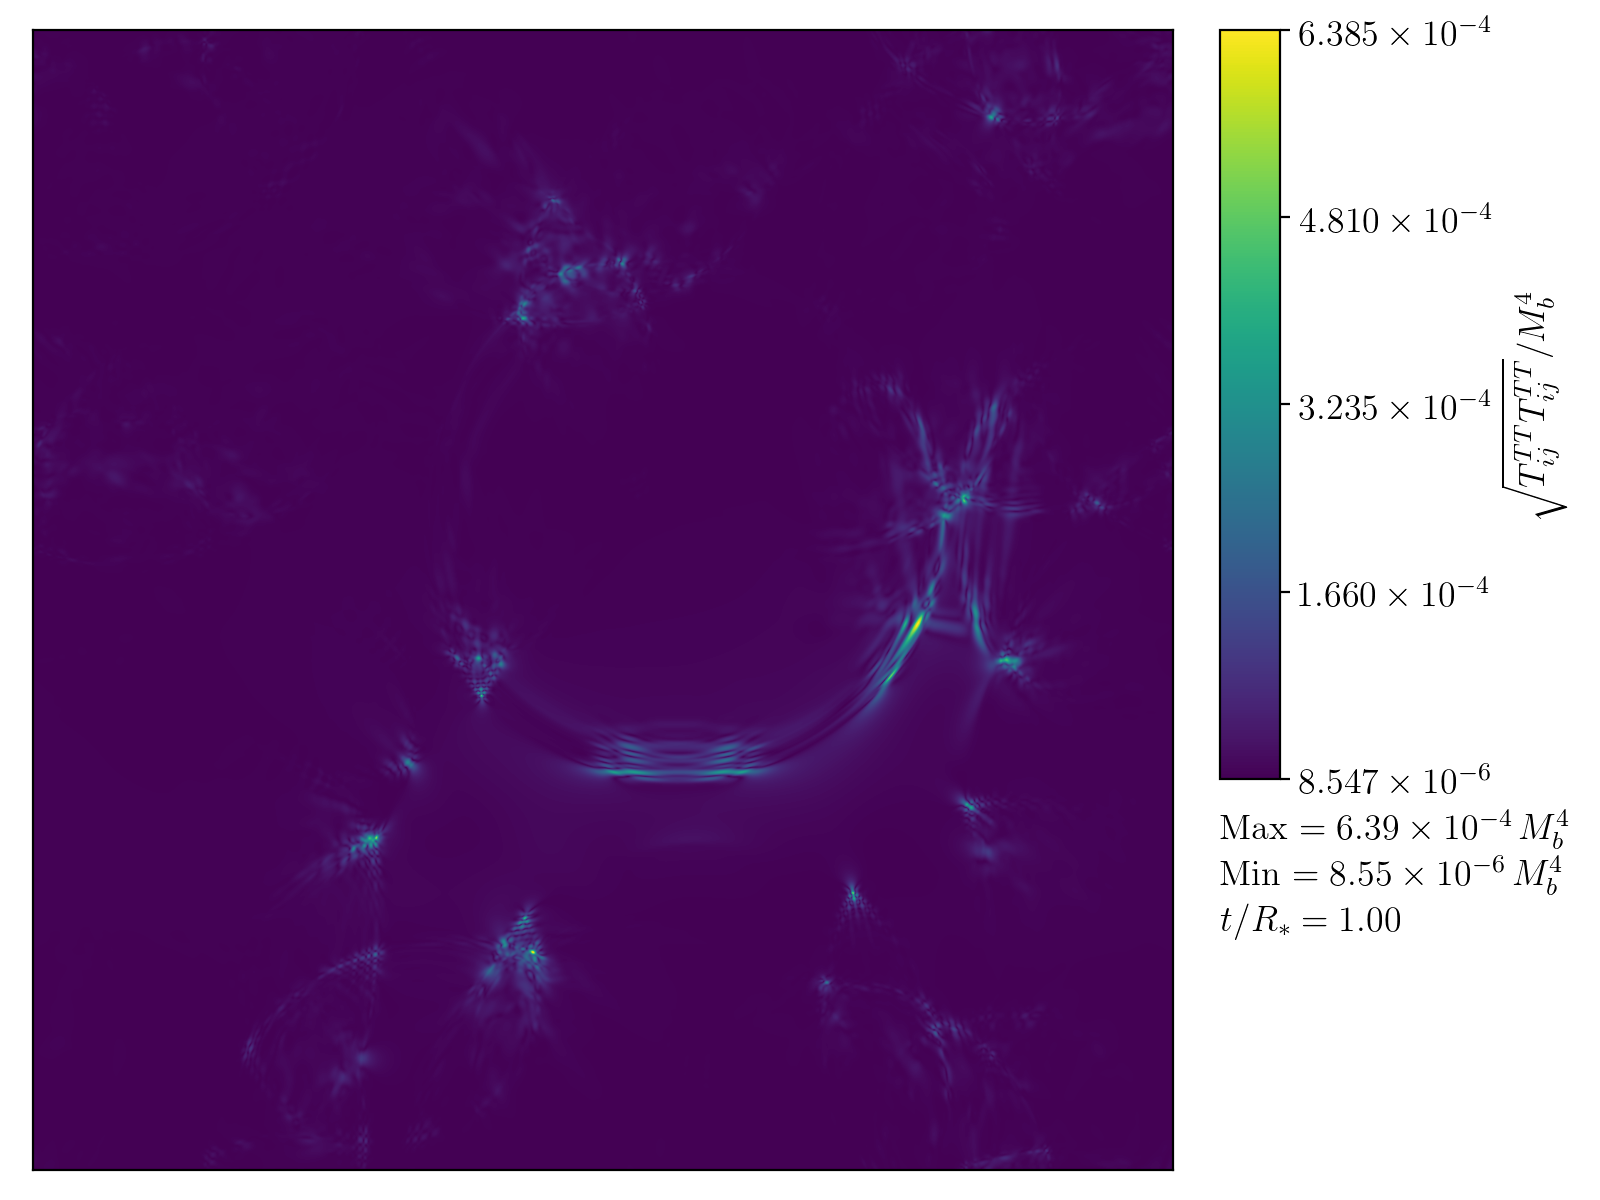
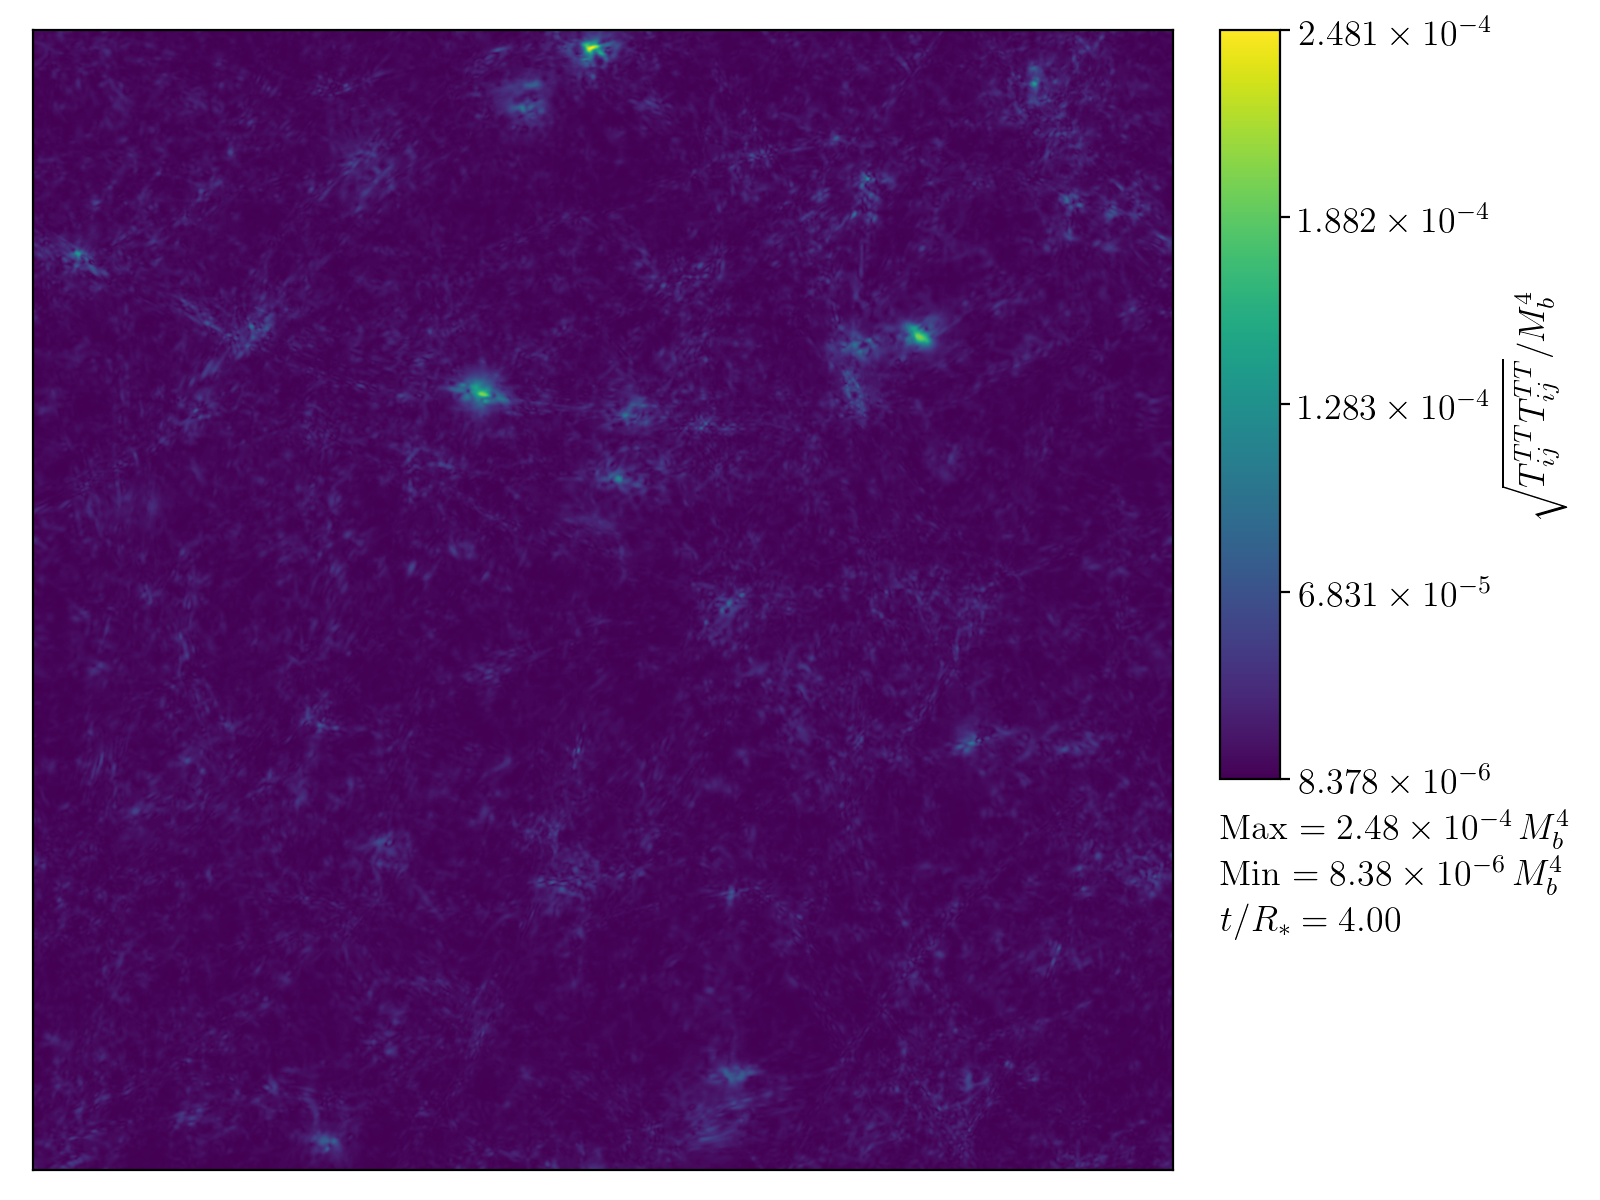
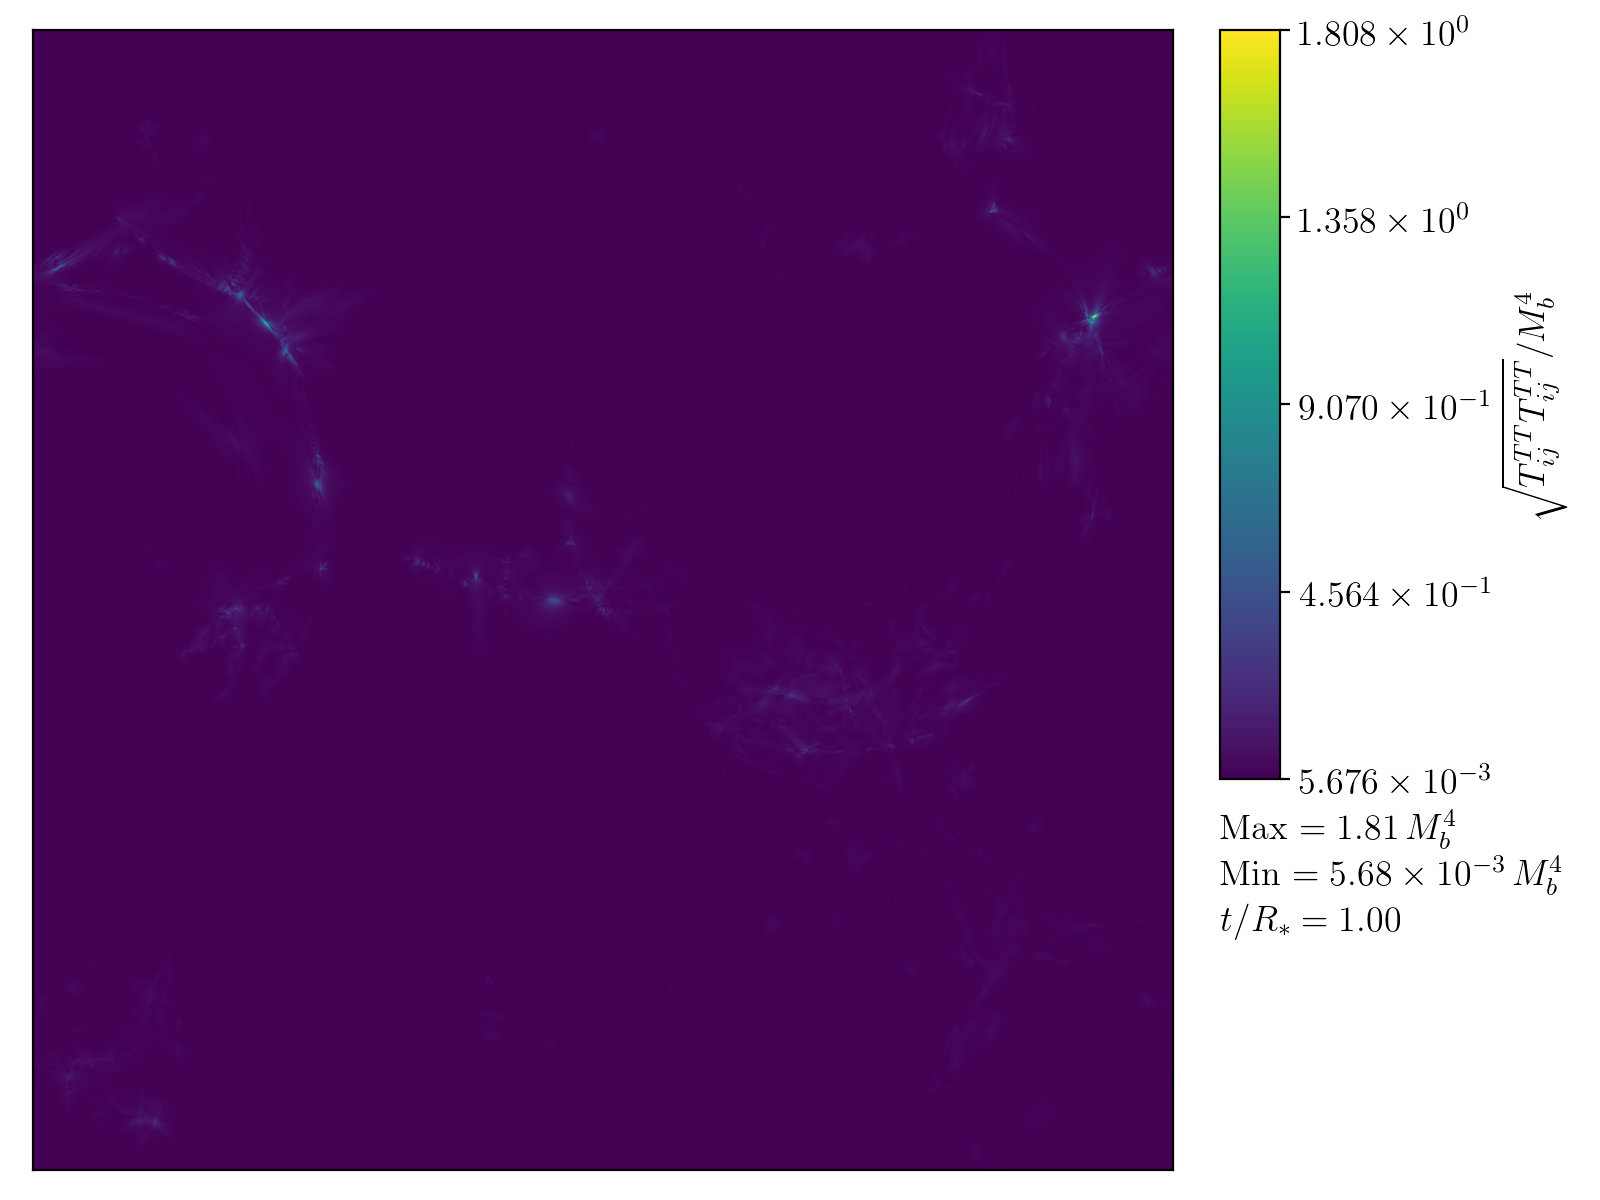
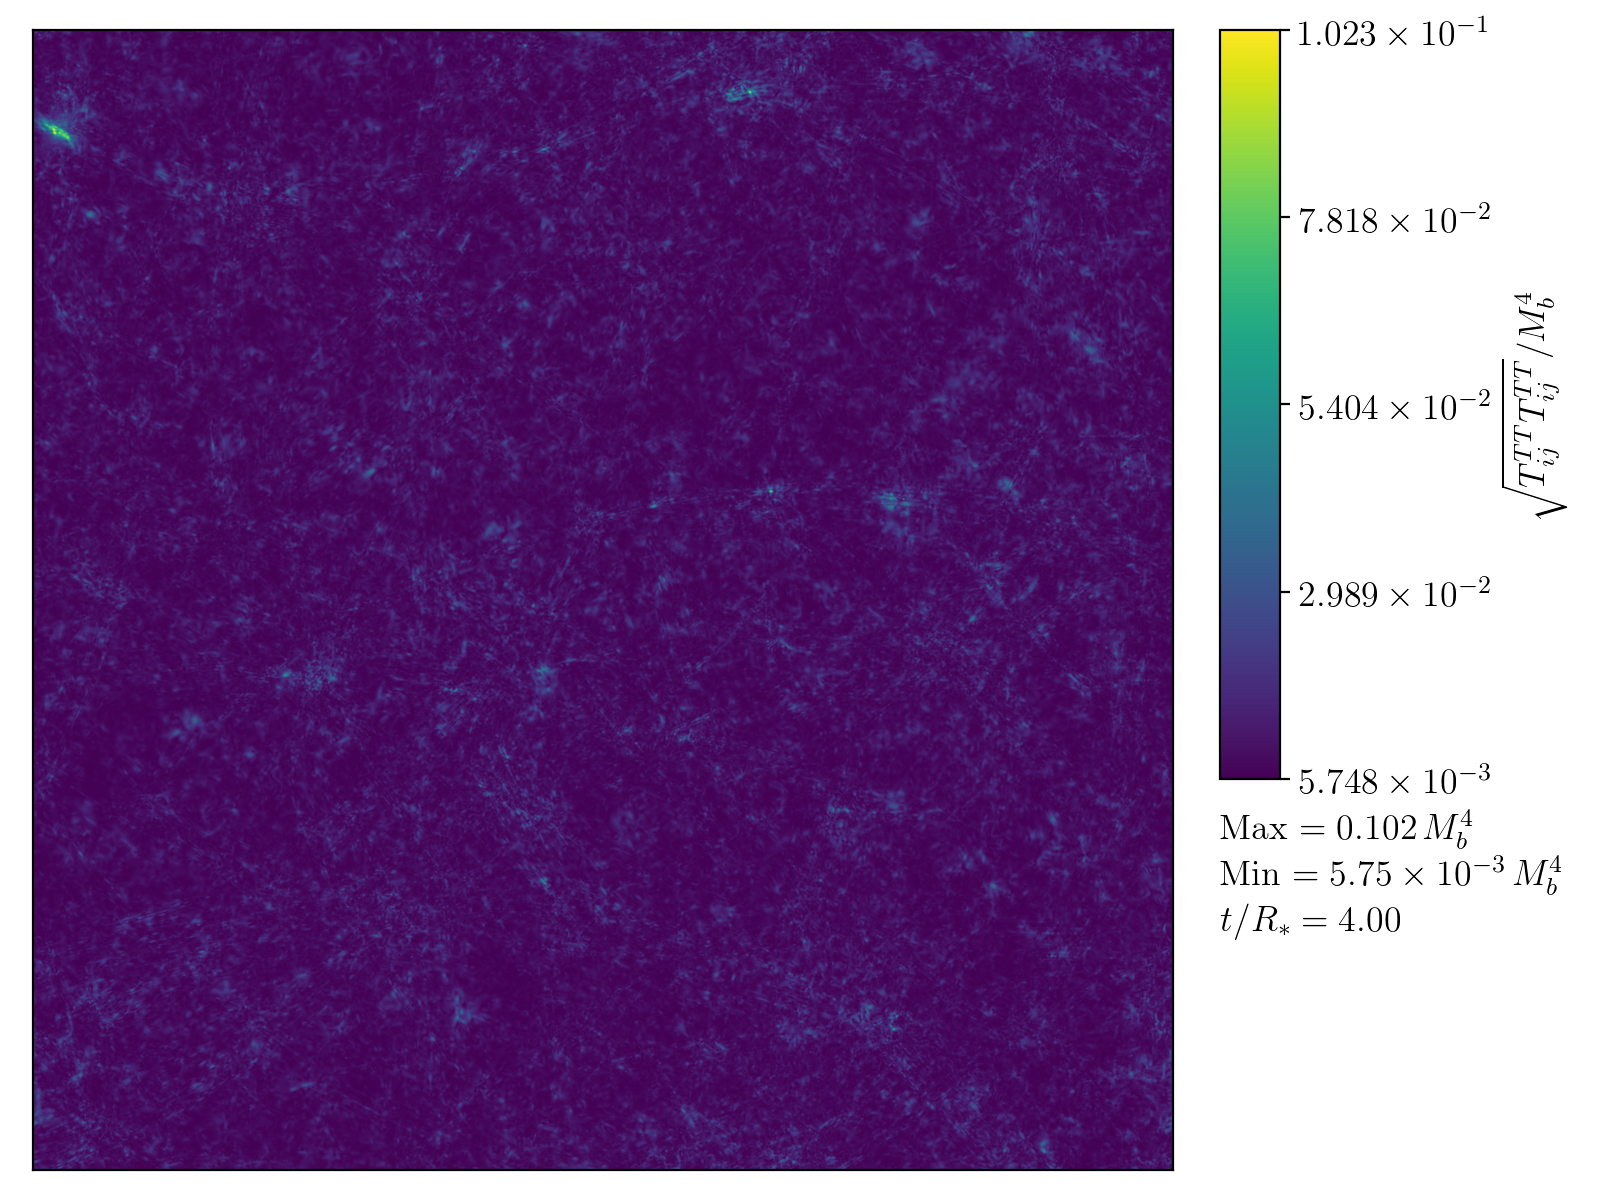
When trying to understand how the gradients in the scalar field source gravitational waves, it is useful to follow the evolution of . The transverse traceless shear-stress tells us about the instantaneous source of gravitational waves at any given point in the simulation. By examining slices of the modulus of the transverse traceless shear-stress, , we are able to determine also the location where gravitational waves are being sourced. We show this alongside the scalar field slices in Appendix B.


From the slices, we can see that, contrary to the prediction of the envelope approximation, there is substantial shear-stress in the overlap region of collided bubbles. This appears to be particularly true for potentials with smaller . Furthermore, even after the final bubbles have finished colliding, waves of shear-stress previously associated with the bubble collisions propagate outward with length scales of or larger. This shows some similarity to that which is predicted in the bulk flow model. At later times the shear stress appears to have power on much smaller length scales.
It is useful to study the power spectrum of the transverse traceless shear-stress, . We plot the evolution of for two simulations with and in Fig. 8. From , we can see that as the transition progresses, the shear-stress starts to grow as bubbles start to collide. Initially, there is substantial power in the IR, corresponding to typical length scales of the bubbles when they collide. At later times the power shifts more towards the UV, with a peak developing close to the scale associated with . This occurs as the scalar field has entered the oscillation phase of the transition.
Interestingly, we see that the power in the IR does not disappear immediately after the bubbles finish colliding, around . Instead the power slowly decreases for several . This appears to agree with what we saw in the slices of in which the shear-stress associated with the bubble wall and collision regions continued to propagate for some time after the bubbles finished colliding, giving further support to the bulk flow model. Unfortunately, we cannot resolve a sufficient distance into the IR to see any fall off of the shear-stress corresponding to the causal interval.
From our smaller, but much longer simulations outlined in Table 3 we can show how behaves at very late times. We plot the evolution of up to for two simulations with and for and in Fig. 9. It can clearly be seen that at very late times, the power spectrum settles into a shape with a characteristic power law of rising from the IR. In our simulations, we do not allow for the decay of the scalar field into other particles, and we also do not account for the damping of oscillations of the scalar field due to expansion. Both of these would reduce the power in . It is still interesting to note however that the non-linear behaviour in the scalar field continues to source gravitational waves long after the collisions phase terminates.


VI Results: gravitational waves
We measure the gravitational-wave power spectrum produced during each simulation. We compare the resulting power spectra with the fit predicted from the previous work in Ref. [64], as well as the envelope approximation and bulk flow model fits using an exponential nucleation rate, as detailed in Section III.1. In Fig. 10 we plot four snapshots showing the evolution of the gravitational-wave power spectrum (Eq. 40) for the largest simulations performed for each . These simulations are listed in Table 2. The uncertainty for each power spectrum bin is given by the difference between its value in our high and medium resolution runs.
We see that early on in the collision phase at , the power spectrum is growing with a peak at . At early times, for all there is a characteristic infrared power law in with exponent . Later in the collision phase at , most of the bubbles have finished colliding, and we see that for all the peak has shifted towards lower values of , aligning with the peak locations predicted in Ref. [64] and earlier studies of the envelope approximation. The peak gravitational-wave power at this point seems very close to that predicted for an exponential nucleation rate in the envelope approximation for all . With our limited resolution of the IR power law we see that it appears to still be roughly consistent with an exponent of . The UV power laws vary between different , with thicker potentials having steeper exponents. At later times in the collision phase, we see a rise in the first few bins for our gravitational-wave power spectra, consistent with the slow decay of the IR power in shown in Fig. 8. The limited range we have in the IR makes it difficult to be conclusive about this. The peak location appears to remain fixed. We also see for each simulation the steady growth of a bump in the power spectrum towards the UV, associated with the length scale of , consistent with that seen in Ref. [64].


We first turn our attention to understanding the evolution of the UV bump in the power spectrum. This is made up of gravitational waves sourced during the oscillation phase, where the scalar field is oscillating around the scale of . To see the shape of the power spectra produced from these oscillations, we conduct a series of long-lasting simulations where we only turn on the evolution of the metric perturbations at , long after the last bubbles have collided. These simulation runs are listed in Table 3.
We plot the resulting power spectra for and in Fig. 11. We see that for both the power spectra are characterised by a plateau in the IR, presumably turning over at wavelengths larger than we can access within our simulations, and a growing bump at a length scale associated with .


We can also use these simulations to calculate the growth rate of during the oscillation phase. We plot for our late time simulations in Fig. 12. From this plot, we can see that the growth rate is fairly similar for all . The rate appears to be slower than linear. Note that the growth of gravitational waves shown in our simulations is in effect an upper bound, as in reality other effects will come into play such as the decay of the scalar field into other particles and damping of the scalar field gradients due to the effects of expansion.
We find that the calculation of the growth of during the oscillation phase is similar for all to that found in Ref. [64]. Therefore, upon extrapolation to a realistic separation of scales, the gravitational wave energy density will be dominated by the production in the collision phase providing , with the Plank mass.

VI.1 Fitting
To attempt to distinguish between the resulting power spectra for different we calculate fits for the spectrum. We do this for the largest simulation performed for each . We choose to fit according to the following function,
| (53) |
where , , and are the fitting parameters. The fit is calculated using the difference in power between the high resolution and medium resolution runs as the one sigma uncertainty for each bin.
We are able to see from Fig. 10 that there appears to be some indication of time dependence in the power spectra, even after the bubbles have finished colliding. This is also indicated due to the evolution of shown in Fig.8. We, therefore, choose to perform our fit throughout the simulation and track how the fitting parameters evolve. We fit for values of up to in order to avoid the UV power law being affected by the growing bump associated with oscillations in the scalar field about the mass scale.
In Fig. 13, we plot how all four fitting parameters , , and evolve for the largest simulation for each in Table 2. We include lines to illustrate the predictions for each parameter by the envelope approximation and by the bulk flow model.
Note that the envelope and bulk flow predictions are taken from simulations with an exponential nucleation rate, whereas our simulations use simultaneous nucleation. This could result in a discrepancy between the peak frequency and amplitude [51], though the power law exponents are not typically affected by the nucleation scenario. In previous lattice simulations conducted in Ref. [64], no strong dependence on the nucleation rate was seen in the peak amplitude or frequency.


At early times the peak frequency is slightly more than , but as the bubbles finish colliding this shifts to smaller values, closer to . This behaviour is consistent across all . In all cases, the final value of is larger than predicted for an exponential rate in the bulk flow model and slightly larger than the envelope approximation prediction.
The peak gravitational-wave amplitude is obtained around the time of . At later times, the peak amplitude drops as the power spectrum becomes more broad. We observe that there is some deviation between with the peak gravitational-wave power larger for the two thin wall potentials, and smaller for the two thick wall potentials. This effect is overall quite small, and is the fitting parameter most sensitive to lattice effects, see App. A. The peak amplitude is smaller than that predicted for an exponential nucleation rate in the envelope approximation, which in turn is smaller than the amplitude predicted in the bulk flow model.
We see that at early times, for all , the IR power law is close to a white noise spectrum of . After the bubbles finish colliding, the IR power law decreases. This indicates that gravitational waves are being sourced on scales larger than . This agrees with what we have seen in both and Fig. 10. There is some indication of the IR power law exponent growing towards the end of the simulations. Our limited resolution in the IR and the small number of modes in the bins with smallest values mean that we cannot evaluate accurately the value of , particularly at late times where the peak frequency is smallest. However, the data that we do have do show a strong indication of an IR power law that becomes shallower than at late times after the bubbles have finished colliding. This is particularly true in the case of which has the largest number of bubbles, . For all , the final value of the IR power law is close to as predicted by the bulk flow model. We do see some indication that, as increases, the final IR power law becomes steeper.
At early times, the UV power law exponent grows for all . At late times we see that there is also a consistent trend in according to , with the UV power law becoming steeper as decreases. The final value of for is close to that of the bulk flow model prediction. As , the value of decreases, moving towards the value predicted in the envelope approximation, though it does not reach it for the values of we study.
There is some indication that there is a slow decrease in at late times. This is in part because and are anti-correlated around the peak of the spectrum, and as grows decreases. The limited separation of scales we obtain between and increases the influence of on . This effect is strongest for where the peak in the spectrum from bubble collisions and that from oscillations in the scalar field are closest together. Forcing to be fixed leads to a more stable value of at the end of the simulation, though a worse fit overall. To obtain a more accurate fit for , we need to improve our resolution in the IR to obtain a better estimate on . Alternatively, we could increase the separation between and by increasing . Both of these options require larger simulations and a dynamic range currently unavailable to us.
In Table 4 we provide the late time values of the fitting parameters for each . These are taken at the end of the simulation, corresponding to for and for the other . Caution should be taken when using these values, as from Fig. 13 it can be seen that the exponents and have not completely settled by the end of our simulations.
VII Conclusions
In this work, we have investigated whether the underlying potential for a vacuum phase transition can affect the resulting gravitational-wave signal. We note that, for a quartic effective potential with a cubic term, the effect of the potential on the dynamics of the scalar field is determined through a single parameter, . When , we are in the thin wall limit, and the critical profile can be approximated by a function. The thick wall limit is approached for , and in this case, the critical profile is approximated well by a Gaussian.
The dynamics of the scalar field in the overlap region between colliding bubbles depends on the value of . When is close to one, after bubbles collide, the scalar field rebounds in the overlap region towards the symmetric phase. The rebound is reduced as for fixed .
We have explored a range of in a series of simulations with up to lattice sites in which as many as bubbles are nucleated simultaneously. From these, we evaluate the transverse traceless shear-stress and compute the power spectrum . We find evidence that even after the bubbles have finished colliding, gravitational waves continue to be sourced at scales larger than . This could be as a result of energy density in the bubble walls continuing to propagate after collision. Continued propagation of shells of energy density after collision is a violation of one of the assumptions of the envelope approximation and matches closer to the bulk flow model.
After the bubbles have finished colliding, we enter an oscillation phase during which the scalar field is oscillating around . This produces a peak in around , and at very late times this develops a white noise IR power law of . While this feature is very long-lasting within our simulations, we would expect that in reality, the amplitude would decay as the scalar field gradients decrease due to quantum processes and Hubble friction.
During the oscillation phase, gravitational waves are sourced by a feature in with a peak around . This behaviour was already noted in Refs. [63, 64]. This feature produces a bump in the gravitational-wave power spectrum around for all . The growth rate of the during the oscillation phase is slightly slower than linear. As our simulations do not account for damping from Hubble friction or allow for the scalar field to decay via quantum processes, this should be taken as an upper bound on the growth rate for . Our results on the growth rate are consistent with those in Ref. [64], where it was shown that the total gravitational-wave power from the oscillation phase will be suppressed compared to that arising from bubble collisions providing that .
We also compute the gravitational wave energy density parameter power spectrum . We perform a fit for the spectrum arising from bubble collisions using Eq. 53. We calculate how the fitting parameters vary during our simulations.
There are some indications that can affect the resulting gravitational-wave power spectrum. The peak power of the gravitational-wave power spectrum varies according to , though the variation is probably not significant enough to be observable. The values of found at the end of our simulations are larger for , and decreases for smaller . The peak amplitude varies between for , and for .
More hopeful is the possibility that we could distinguish vacuum transitions with different potentials due to the UV power law. The UV power laws we find at the end of the simulations become steeper as decreases. The gravitational-wave power spectrum falls as for and for .
The IR power law is close to when bubbles start to collide, with a peak in the spectrum around . At later times the peak shifts slightly towards the IR. The section of the IR power law that we can resolve appears to become shallower with an exponent . Our limited resolution in the IR means that we can only infer the power law from the first few bins in our power spectrum. We find that at the end of our simulations the IR power law is shallower for smaller , varying between for and for . Presumably, at larger scales than we can resolve within our simulations, the power law turns over to a white noise spectrum as causality dictates.
We find that neither the envelope approximation or the bulk flow model correctly predict the final gravitational-wave power spectrum. For all , the peak power is slightly smaller than predicted by the envelope approximation which is itself smaller than the bulk flow model predicts. The peak location is closer to that predicted by the envelope approximation. The UV power law is similar to the bulk flow model for small , and moves towards the envelope approximation prediction as increases. The value of the IR power law also seems to be closer to the bulk flow model, though as increases, it does become steeper, shifting towards the envelope approximation value. This roughly follows the picture proposed in Ref. [69]. It remains to be determined if simulations with larger become even closer to the envelope approximation, and whether at larger the proposal of Ref. [69] becomes more exact.
Overall, we have shown that for vacuum phase transitions, the underlying effective potential can affect the resulting gravitational wave power spectrum. In particular, we have seen that, for the quartic potential that we investigated, the UV power law appears sensitive to . The IR power law is challenging to resolve with our simulations, but we see some indication that it may be shallower than a spectrum, and it appears to be evolving long after the bubbles have finished colliding. Further explorations into the IR power law and behaviour of the gravitational-wave power spectrum as we extrapolate to larger will require new techniques as we have reached the limit of the computing resources available to us.
Acknowledgements.
We thank Oliver Gould, Rysuke Jinno, Thomas Konstandin, Eugene Lim, Satumaaria Sukuvaara and Essi Vilhonen for useful discussions. DC, DJW, and MH would like to thank Nordita for their hospitality during the “Gravitational Waves from the Early Universe” workshop. Our simulations were carried out at the Finnish Centre for Scientific Computing CSC. DC (ORCID ID 0000-0002-7395-7802) is supported by a Science and Technology Facilities Council Studentship and the University of Sussex. EGE was supported by the Academy of Finland, grant 320123. EGE and DJW were supported by the Research Funds of the University of Helsinki. DJW (ORCID ID 0000-0001-6986-0517) was supported by a Science and Technology Facilities Council Ernest Rutherford Fellowship, grant no. ST/R003904/1, and by the Academy of Finland, grants 324882 and 328958. MH was supported by the Science and Technology Facilities Council (grant number ST/P000819/1) and the Academy of Finland (grant number 286769).References
- Audley et al. [2017] H. Audley et al., (2017), arXiv:1702.00786 [astro-ph.IM] .
- Caprini and Figueroa [2018] C. Caprini and D. G. Figueroa, (2018), arXiv:1801.04268 [astro-ph.CO] .
- Caprini et al. [2016] C. Caprini et al., JCAP 1604, 001 (2016), arXiv:1512.06239 [astro-ph.CO] .
- Caprini et al. [2020] C. Caprini et al., JCAP 2003, 024 (2020), arXiv:1910.13125 [astro-ph.CO] .
- Kajantie et al. [1996] K. Kajantie, M. Laine, K. Rummukainen, and M. E. Shaposhnikov, Phys.Rev.Lett. 77, 2887 (1996), arXiv:hep-ph/9605288 [hep-ph] .
- Kajantie et al. [1997] K. Kajantie, M. Laine, K. Rummukainen, and M. E. Shaposhnikov, Nucl.Phys. B493, 413 (1997), arXiv:hep-lat/9612006 [hep-lat] .
- Profumo et al. [2007] S. Profumo, M. J. Ramsey-Musolf, and G. Shaughnessy, JHEP 08, 010 (2007), arXiv:0705.2425 [hep-ph] .
- Espinosa et al. [2012] J. R. Espinosa, T. Konstandin, and F. Riva, Nucl. Phys. B854, 592 (2012), arXiv:1107.5441 [hep-ph] .
- Cline and Kainulainen [2013] J. M. Cline and K. Kainulainen, JCAP 1301, 012 (2013), arXiv:1210.4196 [hep-ph] .
- Profumo et al. [2015] S. Profumo, M. J. Ramsey-Musolf, C. L. Wainwright, and P. Winslow, Phys. Rev. D91, 035018 (2015), arXiv:1407.5342 [hep-ph] .
- Beniwal et al. [2019] A. Beniwal, M. Lewicki, M. White, and A. G. Williams, JHEP 02, 183 (2019), arXiv:1810.02380 [hep-ph] .
- Kakizaki et al. [2015] M. Kakizaki, S. Kanemura, and T. Matsui, Phys. Rev. D92, 115007 (2015), arXiv:1509.08394 [hep-ph] .
- Dorsch et al. [2017] G. C. Dorsch, S. J. Huber, T. Konstandin, and J. M. No, JCAP 1705, 052 (2017), arXiv:1611.05874 [hep-ph] .
- Basler et al. [2017] P. Basler, M. Krause, M. Muhlleitner, J. Wittbrodt, and A. Wlotzka, JHEP 02, 121 (2017), arXiv:1612.04086 [hep-ph] .
- Randall and Servant [2007] L. Randall and G. Servant, JHEP 05, 054 (2007), arXiv:hep-ph/0607158 [hep-ph] .
- Konstandin et al. [2010] T. Konstandin, G. Nardini, and M. Quiros, Phys. Rev. D 82, 083513 (2010).
- Konstandin and Servant [2011] T. Konstandin and G. Servant, JCAP 1112, 009 (2011), arXiv:1104.4791 [hep-ph] .
- von Harling and Servant [2018] B. von Harling and G. Servant, JHEP 01, 159 (2018), arXiv:1711.11554 [hep-ph] .
- Dillon et al. [2018] B. M. Dillon, B. K. El-Menoufi, S. J. Huber, and J. P. Manuel, Phys. Rev. D98, 086005 (2018), arXiv:1708.02953 [hep-th] .
- Megías et al. [2018] E. Megías, G. Nardini, and M. Quirós, JHEP 09, 095 (2018), arXiv:1806.04877 [hep-ph] .
- Bruggisser et al. [2018] S. Bruggisser, B. Von Harling, O. Matsedonskyi, and G. Servant, JHEP 12, 099 (2018), arXiv:1804.07314 [hep-ph] .
- Schwaller [2015] P. Schwaller, Phys. Rev. Lett. 115, 181101 (2015), arXiv:1504.07263 [hep-ph] .
- Addazi and Marciano [2018] A. Addazi and A. Marciano, Chin. Phys. C42, 023107 (2018), arXiv:1703.03248 [hep-ph] .
- Aoki et al. [2017] M. Aoki, H. Goto, and J. Kubo, Phys. Rev. D96, 075045 (2017), arXiv:1709.07572 [hep-ph] .
- Croon et al. [2018] D. Croon, V. Sanz, and G. White, JHEP 08, 203 (2018), arXiv:1806.02332 [hep-ph] .
- Breitbach et al. [2018] M. Breitbach, J. Kopp, E. Madge, T. Opferkuch, and P. Schwaller, (2018), arXiv:1811.11175 [hep-ph] .
- Okada and Seto [2018] N. Okada and O. Seto, Phys. Rev. D98, 063532 (2018), arXiv:1807.00336 [hep-ph] .
- Hasegawa et al. [2019] T. Hasegawa, N. Okada, and O. Seto, Phys. Rev. D99, 095039 (2019), arXiv:1904.03020 [hep-ph] .
- Hall et al. [2019] E. Hall, T. Konstandin, R. McGehee, and H. Murayama, (2019), arXiv:1911.12342 [hep-ph] .
- Hall et al. [2020] E. Hall, T. Konstandin, R. McGehee, H. Murayama, and G. Servant, JHEP 04, 042 (2020), arXiv:1910.08068 [hep-ph] .
- Coleman [1977] S. R. Coleman, Phys. Rev. D15, 2929 (1977), [Erratum: Phys. Rev.D16,1248(1977)].
- Linde [1983] A. D. Linde, Nucl.Phys. B216, 421 (1983).
- Steinhardt [1982] P. J. Steinhardt, Phys.Rev. D25, 2074 (1982).
- Witten [1984] E. Witten, Phys.Rev. D30, 272 (1984).
- Hogan [1986] C. J. Hogan, MNRAS 218, 629 (1986).
- Kurki-Suonio [1985] H. Kurki-Suonio, Nucl.Phys. B255, 231 (1985).
- Bodeker and Moore [2009] D. Bodeker and G. D. Moore, JCAP 0905, 009 (2009), arXiv:0903.4099 [hep-ph] .
- Bodeker and Moore [2017] D. Bodeker and G. D. Moore, (2017), arXiv:1703.08215 [hep-ph] .
- Ellis et al. [2019a] J. Ellis, M. Lewicki, J. M. No, and V. Vaskonen, (2019a), arXiv:1903.09642 [hep-ph] .
- Ellis et al. [2019b] J. Ellis, M. Lewicki, and J. M. No, JCAP 04, 003 (2019b), arXiv:1809.08242 [hep-ph] .
- Kosowsky and Turner [1993] A. Kosowsky and M. S. Turner, Phys.Rev. D47, 4372 (1993), arXiv:astro-ph/9211004 [astro-ph] .
- Kamionkowski et al. [1994] M. Kamionkowski, A. Kosowsky, and M. S. Turner, Phys.Rev. D49, 2837 (1994), arXiv:astro-ph/9310044 [astro-ph] .
- Huber and Konstandin [2008] S. J. Huber and T. Konstandin, JCAP 0809, 022 (2008), arXiv:0806.1828 [hep-ph] .
- Konstandin [2018] T. Konstandin, JCAP 1803, 047 (2018), arXiv:1712.06869 [astro-ph.CO] .
- Jinno and Takimoto [2017] R. Jinno and M. Takimoto, Phys. Rev. D95, 024009 (2017), arXiv:1605.01403 [astro-ph.CO] .
- Jinno and Takimoto [2019] R. Jinno and M. Takimoto, JCAP 01, 060 (2019), arXiv:1707.03111 [hep-ph] .
- Hindmarsh et al. [2014] M. Hindmarsh, S. J. Huber, K. Rummukainen, and D. J. Weir, Phys.Rev.Lett. 112, 041301 (2014), arXiv:1304.2433 [hep-ph] .
- Giblin and Mertens [2014] J. T. Giblin and J. B. Mertens, Phys.Rev. D90, 023532 (2014), arXiv:1405.4005 [astro-ph.CO] .
- Hindmarsh et al. [2015] M. Hindmarsh, S. J. Huber, K. Rummukainen, and D. J. Weir, Phys. Rev. D92, 123009 (2015), arXiv:1504.03291 [astro-ph.CO] .
- Hindmarsh et al. [2017] M. Hindmarsh, S. J. Huber, K. Rummukainen, and D. J. Weir, Phys. Rev. D96, 103520 (2017), arXiv:1704.05871 [astro-ph.CO] .
- Weir [2016] D. J. Weir, Phys. Rev. D93, 124037 (2016), arXiv:1604.08429 [astro-ph.CO] .
- Hindmarsh [2018] M. Hindmarsh, Phys. Rev. Lett. 120, 071301 (2018), arXiv:1608.04735 [astro-ph.CO] .
- Hindmarsh and Hijazi [2019] M. Hindmarsh and M. Hijazi, JCAP 12, 062 (2019), arXiv:1909.10040 [astro-ph.CO] .
- Cutting et al. [2019] D. Cutting, M. Hindmarsh, and D. J. Weir, (2019), arXiv:1906.00480 [hep-ph] .
- Jinno et al. [2019a] R. Jinno, H. Seong, M. Takimoto, and C. M. Um, JCAP 10, 033 (2019a), arXiv:1905.00899 [astro-ph.CO] .
- Ellis et al. [2020] J. Ellis, M. Lewicki, and J. M. No, (2020), arXiv:2003.07360 [hep-ph] .
- Caprini et al. [2008] C. Caprini, R. Durrer, and G. Servant, Phys.Rev. D77, 124015 (2008), arXiv:0711.2593 [astro-ph] .
- Gogoberidze et al. [2007] G. Gogoberidze, T. Kahniashvili, and A. Kosowsky, Phys.Rev. D76, 083002 (2007), arXiv:0705.1733 [astro-ph] .
- Caprini et al. [2009a] C. Caprini, R. Durrer, and G. Servant, JCAP 0912, 024 (2009a), arXiv:0909.0622 [astro-ph.CO] .
- Caprini et al. [2009b] C. Caprini, R. Durrer, T. Konstandin, and G. Servant, Phys.Rev. D79, 083519 (2009b), arXiv:0901.1661 [astro-ph.CO] .
- Niksa et al. [2018] P. Niksa, M. Schlederer, and G. Sigl, Class. Quant. Grav. 35, 144001 (2018), arXiv:1803.02271 [astro-ph.CO] .
- Pol et al. [2019] A. R. Pol, S. Mandal, A. Brandenburg, T. Kahniashvili, and A. Kosowsky, (2019), arXiv:1903.08585 [astro-ph.CO] .
- Child and Giblin [2012] H. L. Child and J. Giblin, John T., JCAP 1210, 001 (2012), arXiv:1207.6408 [astro-ph.CO] .
- Cutting et al. [2018] D. Cutting, M. Hindmarsh, and D. J. Weir, Phys. Rev. D97, 123513 (2018), arXiv:1802.05712 [astro-ph.CO] .
- Hawking et al. [1982] S. Hawking, I. Moss, and J. Stewart, Phys.Rev. D26, 2681 (1982).
- Kosowsky et al. [1992] A. Kosowsky, M. S. Turner, and R. Watkins, Phys. Rev. D45, 4514 (1992).
- Watkins and Widrow [1992] R. Watkins and L. M. Widrow, Nucl. Phys. B 374, 446 (1992).
- Braden et al. [2015] J. Braden, J. R. Bond, and L. Mersini-Houghton, JCAP 1503, 007 (2015), arXiv:1412.5591 [hep-th] .
- Jinno et al. [2019b] R. Jinno, T. Konstandin, and M. Takimoto, JCAP 09, 035 (2019b), arXiv:1906.02588 [hep-ph] .
- Lewicki and Vaskonen [2019] M. Lewicki and V. Vaskonen, (2019), arXiv:1912.00997 [astro-ph.CO] .
- Enqvist et al. [1992] K. Enqvist, J. Ignatius, K. Kajantie, and K. Rummukainen, Phys.Rev. D45, 3415 (1992).
- Jinno et al. [2017] R. Jinno, S. Lee, H. Seong, and M. Takimoto, JCAP 1711, 050 (2017), arXiv:1708.01253 [hep-ph] .
- Garcia Garcia et al. [2016] I. Garcia Garcia, S. Krippendorf, and J. March-Russell, (2016), arXiv:1607.06813 [hep-ph] .
- Aarts et al. [2000] G. Aarts, G. F. Bonini, and C. Wetterich, Nucl. Phys. B587, 403 (2000), arXiv:hep-ph/0003262 [hep-ph] .
- Micha and Tkachev [2003] R. Micha and I. I. Tkachev, Phys. Rev. Lett. 90, 121301 (2003), arXiv:hep-ph/0210202 [hep-ph] .
- Arrizabalaga et al. [2005] A. Arrizabalaga, J. Smit, and A. Tranberg, Phys. Rev. D72, 025014 (2005), arXiv:hep-ph/0503287 [hep-ph] .
- Garcia-Bellido et al. [2008] J. Garcia-Bellido, D. G. Figueroa, and A. Sastre, Phys.Rev. D77, 043517 (2008), arXiv:0707.0839 [hep-ph] .
- Daverio et al. [2015] D. Daverio, M. Hindmarsh, and N. Bevis, (2015), arXiv:1508.05610 [physics.comp-ph] .
Appendix A Convergence tests
A.1 Gravitational waves
Our convergence tests for the gravitational-wave power spectrum consist of performing a series of simulations in which the bubbles are nucleated in the same position, but the lattice spacing is varied while keeping the timestep . We refer to the value of used in the main paper as . Tables 2 and 3 contain the values of this and other important simulation parameters. The captions to these tables are also useful as reminders of the symbols used in the following discussion.
In Fig. 14 we plot the gravitational-wave power spectrum at for with . We do this for equal to , , and . From this plot, we can see that the gravitational-wave power generated by oscillations around the mass scale is well behaved at these lattice spacings. The spectrum due to bubble collisions varies more substantially. The peak location remains fairly fixed, and the IR and UV power laws seem consistent across lattice spacings. The amplitude of the spectrum increases as is decreased. From this, we can clearly see that it is the total gravitational-wave power rather than the peak location or power law exponents that is most sensitive to the lattice spacing.

From our convergence tests, we can estimate the lattice errors on the fitting parameters reported in Table 4. To do this, we must vary the lattice spacing of the simulations with the most bubbles. This corresponds to for , and for all other . We perform additional simulations with and . We find the fitting parameters in Eq. 53 at the end of each simulation. We then plot how the fitting parameters vary with in Fig. 15. Differences between the parameter values at and the values quoted in Table 4 arise as we use a uniform uncertainty across all bins111We use the SciPy library function optimize.curve_fit with arguments sigma=None and absolute_sigma=False. This weights each bin power spectrum bin used in the fit equally with a uniform uncertainty.. This differs to the results listed in the main body of the paper where the difference in power at each bin between high and mid resolutions runs was used as the uncertainty.
We see that the change in , and between and is at the level, whereas it is at the level for . Extrapolating a linear fit on as a function of to the continuum shows us that the error on at is on the order of . Even in the continuum limit is smaller than the envelope prediction.


To check the behaviour of the gravitational-wave power spectrum for , we must reduce the size of the simulations and number of bubbles. We perform a series of simulations with for each . In this case we can no longer fit the power spectrum according to Eq. 53, as the peak of the spectrum is not resolved. Instead we fit the UV power law according to the following equation,
| (54) |
where is the UV power law exponent and corresponds to the amplitude of the spectrum at . We provide the resulting evaluation of and at in Fig. 16. We do not see any indication of a change in behaviour at smaller lattice spacing than .


A.2 Scalar field
To study the effect of the lattice spacing on the scalar field, we perform a series of simulations of isolated bubbles. We do this both in a simplified 1D code with spherical symmetry and compare the results to an isolated bubble expanding in our 3D code. From this, we are able to measure the deviation of the scalar field profile from its expected behaviour outlined in Section II.3. The deviation then provides some measure of the lattice effects. We show the deviation of bubble radius parameters , and for a series of lattice spacings and two in Fig. 17. The resulting effect on estimated from the wall thickness is shown in Fig. 18.
We see that even a small deviation in , and can result in a large change in the measured value of . The finer the lattice spacing the larger can grow with remaining close to the theoretical value. We also see that for the same lattice spacing, the 3D runs show smaller lattice effects during expansion. For large , as increases will decrease, whereas for small we see that first, the lattice effects cause the ratio to grow before eventually it also decreases below unity.


Appendix B Slices
In Fig. 19 and Fig. 20 we show slices through simulations with and respectively. Both simulations have , and . The slices show , and at equal to , and .
