Gender and Collaboration Patterns
in a Temporal Scientific Authorship Network
Abstract
One can point to a variety of historical milestones for gender equality in STEM (science, technology, engineering, and mathematics), however, the practical effects are gradual and ongoing. It is important to quantify gender differences in subdomains of scientific work in order to detect potential biases and to monitor progress. In this work, we studied the relevance of gender in scientific collaboration patterns in the Institute for Operations Research and the Management Sciences (INFORMS), a professional organization with sixteen peer-reviewed journals. We constructed a large temporal bipartite network between authors and publications, using the organization’s publication data from 1952 to 2016, and augmented the author nodes with gender labels. We characterized differences in several basic statistics of this network over time, highlighting how they change with respect to relevant historical events. We found a steady increase in participation by women (e.g., fraction of authorships by women and of new women authors) starting 1980. However, women still comprise less than 25 of the INFORMS society, and are additionally underrepresented among authors with many publications. Finally, we describe a methodology for quantifying differences in the role that authorships by women and men play in the overall connectivity of the network. Specifically, we propose a degree-preserving temporal and geometric null model with emergent communities. We use two measures of edge importance related to diffusion throughout the network, namely effective resistance and edge contraction importance to quantify gender differences in collaboration patterns that go beyond differences in local statistics.
keywords:
Research
Introduction
Recent years have seen increasing awareness and discussion of systematic gender biases in academia. A slew of studies and opinion publications [1, 2] have highlighted often unintentional, but nevertheless pervasive, biases in integral aspects of academic careers such as hiring practices [3], funding decisions [4], peer review [5], and representation of women as speakers in conferences [6]. It is therefore important to precisely quantify gender differences in subdomains of academic work as a first step towards detecting potential biases and finding appropriate solutions.
One domain in which network science could offer insight is in the study of gender differences in authorship and collaboration patterns. Indeed, there have been several studies on this topic. For example, Araújo et al. [7] analyzed a dataset containing more than 270,000 academics from a wide variety of fields (engineering, arts, biological, exact, and social sciences) in Brazil. They found that, across all fields, men were more likely to collaborate with other men, while the collaboration gender ratios of women more closely matched that of the relevant academic population. In contrast, Karimi et al. [8] showed that, in a research community in organizational science based in the US and Europe, women exhibited more gender homophily. Jadidi et al. [9] investigated gender differences in a temporal network spanning 47 years with publication and citation data of over one million computer scientists, concluding that homophily has been increasing recently for both genders. Additionally, they found that women have a higher dropout rate than men, especially at the beginning of their careers. West et al. [10] studied gender differences in a corpus containing over eight million publications across a variety of fields (humanities, social, and natural sciences). They found that, overall, gender differences in number of publications have been decreasing over time. However, in some fields, women remain disproportionately underrepresented as first, last, and solo authors.
While these studies provide a glimpse into gender differences in authorship and collaboration networks in academia, they tend to focus on local statistics (i.e., measures that depend only on neighboring connections, such as number of publications, homophily, and author order). In contrast, relatively less is known about the correlation between author gender and their roles in the global structure of the network. Indeed, appropriately characterizing these differences is a nontrivial task, as local and global measures are often intertwined.
In this work, we investigate gender differences over time using both local and global measures in a large corpus of publications from 1952 to 2016 in journals affiliated with the Institute for Operations Research and the Management Science (INFORMS) – the predominant professional society for the disciplines of operations research and management science [11]. These fields are both squarely within STEM (science, technology, engineering, and mathematics), where the degree of gender imbalance has traditionally been considered more severe (but see [12]).
We represent the data as a temporal bipartite (between authors and publications) network, and first characterize several “local” statistics of this network, highlighting their change with respect to potentially relevant historical events. We then describe a methodology for quantifying differences with respect to “global” structure (conditioned on several relevant local statistics), which could be of independent interest.
Specifically, we consider “global” structure to be related to the prototypical global process of diffusion. To this end, we selected two measures related to such dynamics, namely, effective resistance [13, 14, 15] and edge contraction importance [16], to measure the global importance of an author–publication connection. To account for local statistics, we describe a simple temporal and geometric null model, with only two free parameters that control the emergence and size of communities. This null model explicitly replicates the observed yearly degree distributions for publications, as well as the genders and publication histories of each individual author. Importantly, the mechanism it uses to decide which authors participate in which publications is blind to the author gender. By comparing the null model to the observed network data, we can identify gender-related differences in the structural role played by men and women authorships that go beyond local statistics. Given the increased interest in the relatively new field of fairness in machine learning [17, 18], the type of graph-theoretical analysis that we propose here could be useful for bias detection in other social networks.
The dataset: a temporal, bipartite network
between authors and their publications in INFORMS
In this section, we introduce some relevant information about the INFORMS society, and describe our data acquisition and cleaning methods.
The INFORMS society
INFORMS was founded in 1995 with the merging of two societies: the Operations Research Society of America (ORSA) and The Institute of Management Sciences (TIMS) [19], two societies that had already been linked prior to this time. For instance, they had many members in common [20], had hosted joint meetings since 1961 [21], and jointly sponsored two journals (Mathematics of Operations Research [22], founded in 1976, and Marketing Science [23], founded in 1982). INFORMS currently publishes 16 peer-reviewed journals [24], the oldest of which are the flagship journals of the two original societies: Operations Research, first published in 1952 by ORSA and Management Science, first published in 1954 by TIMS. As of December 2017, the society reports to have over 12,500 members [11], around 20% of which identify as women [25].
The INFORMS society has historically worked towards identifying and mitigating gender bias, making it particularly attractive for our study. For example, in 2006, then-president Mark S. Daskin founded a diversity committee “to assess whether or not there is any sort of problem with diversity within INFORMS” [26]. In 2017, the society created a “Diversity, Equity, and Inclusion” initiative, including the formation of a committee with
“[…] a broad charge that includes monitoring the diversity of our membership and seeking out, creating and maintaining best practices for INFORMS to improve diversity and inclusion-related performance.” [25]
Data acquisition, data cleaning, and gender assignments
We constructed a bipartite authorship network using the publications from 16 peer-reviewed journals affiliated with INFORMS from 1952 to 2016.iiiThe 16 journals in our dataset are not identical to the 16 journals currently published by INFORMS as one journal was removed during our period of interest (Management Technology merged with Management Science in 1965), and one was added after our period of interest (INFORMS introduced a new journal, INFORMS Journal on Optimization in 2018). Publication records were acquired using INFORMS PubsOnline (in the form of BibTeX entries) and the CrossRef REST API [27, 28]. Nodes in the network are of two types: author or publication, and edges denote an authorship of a publication. Metadata include author name, author order, publication title, year, and journal.
We classified authors by gender using the commercial package Genderize.io API [29], which associates to each first name a gender (woman or man) and a confidence score ranging from 0 to 100. We thresholded acceptable gender labels as those with a confidence level above 80, noting that this could still yield misclassifications. Author nodes for whom the confidence was below 80 were initially marked as “unknown” gender.
We performed two data cleaning steps: (1) additional gender classification and (2) author node combination. For (1), all unknown-labeled authors with more than 6 publications were manually classified via internet searches, and based on our personal knowledge of authors in the field. In addition, we verified the gender of the most prolific woman-labeled authors, as well as the most prolific men-labeled authors, and corrected the labels for any who had been misclassified. These misclassifications had occurred mostly for given names that were historically used for men and shifted to women over time (e.g., Aubrey, Leslie, Sandy). For (2), we combined multiple nodes that referenced the same author (usually due to publication under a variety of names). For example, Robert Eugene Donald Woolsey, a prolific and well-known figure in the INFORMS society, published under the names “Eugene Woolsey”, “Gene Woolsey”, “R. E. D. Woolsey”, “R. E. Woolsey”, and “Robert E. D. Woolsey”. We manually verified the most prolific author nodes (along with any others noticed while examining the data) by searching for duplicate last (family) names and combining authors as needed.
The resulting network was composed of publication nodes, author nodes, edges, and connected components. Of the author nodes, were labeled as men, as women, and as unknown. The giant (i.e., largest) component of the network contained author nodes, publication nodes, and edges. Often, in studies of collaboration networks, one “projects” the network to a single type of node (e.g., by keeping the author nodes and replacing the publication nodes with cliques of edges between those authors) [7, 8, 30, 31, 32, 9]. However, we kept the original bipartite structure in all of our analysis as projecting the network loses structural information [33] (e.g, a publication with three authors would be identical to three publications between all pairs of those authors). We also kept the connections by authors of unknown gender to maintain the overall network connectivity.
Local statistics: participation rates by women are increasing,
but remain far from gender parity
The broad strokes of gender asymmetry are easily seen with simple measures, such as participation rates. In this section, we quantify and discuss the evolution of several local statistics in the INFORMS authorship network. Additional local statistics are contained in Supplementary Information Table 1.
Relevant historical milestones
While gender discrimination continues to be an issue in academic environments, actions have been taken to mitigate this discrepancy. To place the data in the relevant historical context, we highlight in our graphs the timing of two notable examples of such events:iiiiiiBoth actions we mention took place in the United States, where 70% of INFORMS members are currently based [34].
-
1.
Title IX of the Education Amendments Act of 1972, which states:
No person in the United States shall, on the basis of sex, be excluded from participation in, be denied the benefits of, or be subjected to discrimination under any education program or activity receiving Federal financial assistance [35].
While Title IX focused primarily on student athletics, the policy has had far-reaching consequences. For example, the law has been credited with increasing access to college education for women [36] and supporting applications to further gender equality for those employed in academia [37].
-
2.
The Family and Medical Leave Act of 1993 (FMLA) [38]. This law protects employees who take leave from work for family or medical reasons. As women have traditionally performed most of the child care in the family, it represents another major milestone for women’s rights in the United States, where family leave (including for childbirth) was not otherwise available or protected by law [39].
Participation rates by women and men over time
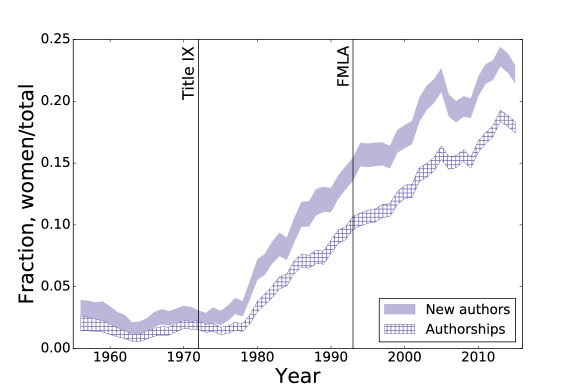
The fractions of new women authors and of authorships by women have both been increasing since 1980 (Figure 1). However, both measures remain more than a factor of 2 from gender parity. In fact, a crude extrapolation of the fraction of new women authors (a weighted linear regression from 1976–2016) yields an estimate of gender parity by 20625. The same extrapolation for the fraction of women authorships gives an estimate of gender parity by 20833 (standard deviations were computed by propagating the errors due to the covariance of the slope and intercept of the linear fit).
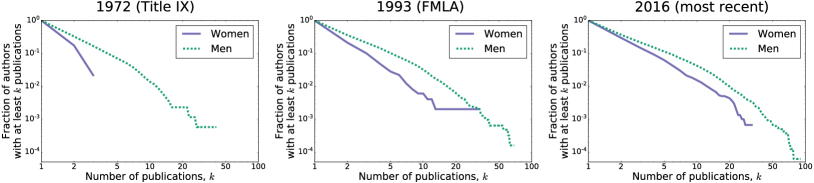
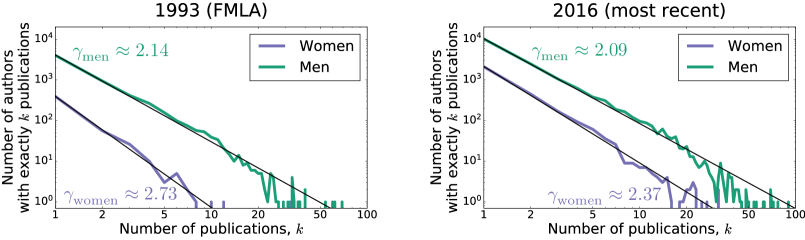
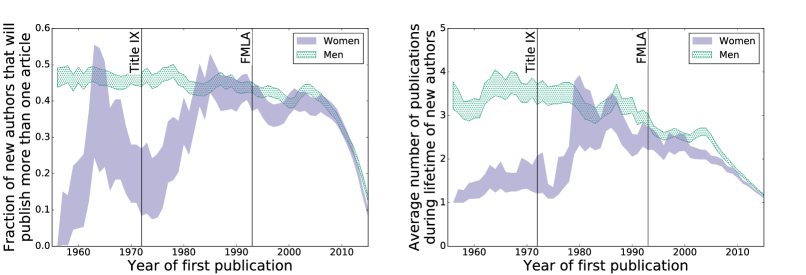
The fraction of authorships by women is consistently lower than the fraction of new women authors, reflecting the fact that women continue to have a lower average number of publications than men (Figure 2 and Movie S1). Moreover, the cumulative degree distributions further suggest that women who have many publications are disproportionately rare. We quantified this effect by measuring the power-law exponent of the degree distributions, and found a significantly steeper slope for women (Figure 3). This claim is further supported by the results shown in Figure 4.
Two diffusion-based measures for quantifying the importance
of a connection to the global structure of the network
We now discuss the measures we used to quantify the importance of a connection between an author and publication to the overall connectivity of the network (as opposed to local characteristics such as degree, clustering, or other node/edge attributes). Our motivation for focusing on these particular measures is twofold: their use in graph algorithms relevant to the field of network science, and their direct relation with diffusion (arguably the simplest process that is sensitive to the global structure of a network). Additional global statistics of the INFORMS network are contained in Supplementary Information Table 1.
The evolution of diffusion is governed by the graph Laplacian (defined as , where is the adjacency matrix, and is the diagonal matrix of node degrees). Indeed, many questions about the connectivity of a network (e.g., max-cut/min-flow problems [15], community detection [40]) have efficient solutions that rely on the graph Laplacian [41]. In this section, we describe two measures of edge importance derived from the action of the Laplacian (more specifically, its pseudoinverse).
Effective resistance
A measure known as effective resistance naturally arises when quantifying the importance of an edge with respect to preserving the action of the graph Laplacian [13]. The effective resistance of an edge is defined as
| (1) |
where is the Laplacian pseudoinverse, and is the signed incidence (column) vector associated with edge , with nonzero entries for the two nodes adjacent to that edge:
| (5) |
Aside from its algorithmic applications, has a variety of intuitive interpretations. For example, it is: the fraction of spanning trees that include this edge [42]; the fraction of random walkers that use this edge during their stochastic transit between the two nodes joined by this edge [43]; and, if one imagines the network as an electrical circuit where all the edges have unit resistance, it is the voltage difference between the two nodes when passing a unit of current between them [15, 14].
Hence, an edge with higher effective resistance is more important for diffusion between its adjacent nodes. In the context of authorship networks such as ours, these connections often form “bridges” between communities, whereas edges that are more redundant (i.e., have lower effective resistance) will tend to appear within well-connected groups.
Edge contraction importance
However, the effective resistance measure assigns its maximal value () to every edge whose removal would lead to a disconnection of the network, regardless of the sizes of the resulting components. This applies not only to edges that would disconnect large groups, but also to isolated edges and edges connecting a single node at the periphery of the network, which are intuitively less important. Hence, we also consider the “contraction importance” [16] of edges, a recently proposed measure that is sensitive to these differences and also uses the graph Laplacian.
The contraction importance reflects how much the dynamics of diffusion throughout the network would change if an author were merged with their publication. Specifically, it is the change in the Laplacian pseudoinverse incurred by this merge, as quantified by the Frobenius norm. With this measure, an author who is a bridge between two communities is considered more important than an author who is only connected to the periphery of the network (see Figure 5). The contraction importance of an edge is defined as:
| (6) |
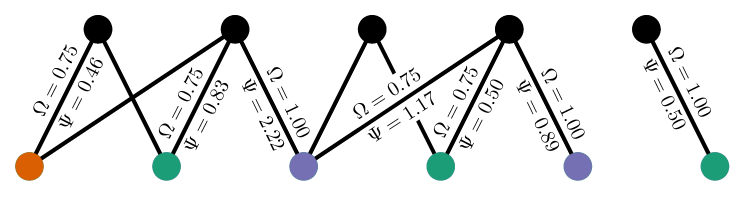
To summarize, while both and give a measure of the importance of an edge to the overall connectivity of the network, there are some notable differences, particularly in the way they treat edges whose removal would disconnect a component of the network. considers how much the diffusion between a given author and one of their publications would be reduced if this connection were to be deleted (i.e., removing the author from this publication). Thus, if this connection is the only path from this author to this publication, it would be considered maximally important (). In contrast, measures how much the contraction of an author–publication connection (i.e., considering this author and publication as the same entity) would alter diffusion throughout the entire network. Therefore, contraction importance does not treat all edges with equally, instead assigning smaller values to those that are less important for large-scale diffusion throughout the network (indeed the case for most edges with ).
Effective resistance and contraction importance distributions
in the INFORMS network
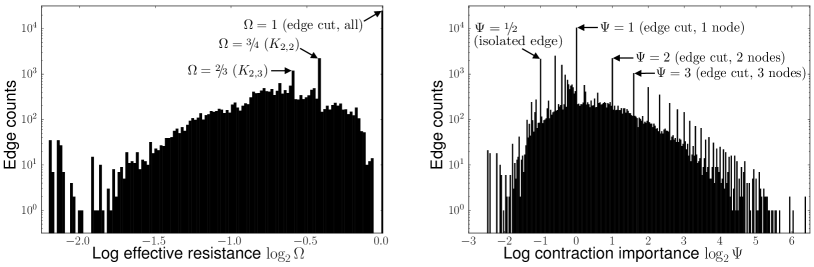
When comparing the relative importance of different edges, one should consider their ratio. Hence, we take the log of these measures before computing means and other statistics. Figure 6 displays the histogram of both measures in the entire cumulative INFORMS network, illustrating how they provide relevant information about the connectivity of the network. For example, the contraction importance exhibits peaks at , corresponding to edges whose removal would separate nodes from the bulk of the network, and the effective resistance exhibits peaks at and , corresponding to the complete bipartite subgraphs and (i.e., two authors/publications connected to three or two publications/authors).
Both measures have similarly shaped distributions when conditioned on the genders. However, the average log contraction importance of authorships by women is lower than for authorships by men, while the average log effective resistance of authorships by women is higher (see Figure 8). In order to provide a meaningful comparison of these measures between the genders, we constructed a null model that explicitly replicates the yearly degree distributions for publications, women authors, and men authors, but assigns author–publication connections irrespective of gender.
A degree-preserving temporal and geometric null model
with emergent communities
Gender differences in global importance measures could be attributable to gender differences in local statistics. For example, edges connecting nodes with higher degrees tend to have lower effective resistance, thus the sole fact that men have a higher number of publications could directly lead to the observed difference between the effective resistance of authorships by women and men. Therefore, in order to determine if differences in collaboration patterns require an explanation beyond basic local statistics, it is crucial to have a null model that replicates the relevant local properties of the original network. Such a null model can then be used to determine whether other properties of interest are simply consequences of these local statistics.
In this section, we describe a novel degree-preserving temporal and geometric null model with emergent communities, which we believe could be of independent interest. The model employs a combination of geometric embedding to mimic clustering due to node similarity [44], and a self-reinforcing node-placement mechanism to encourage community formation [45].
The model explicitly replicates the observed yearly degree distributions for publications, as well as the gender and publication histories of each individual author (i.e., their number of publications each year). These are taken from the data as fixed inputs to the model. As we are interested in the effect of gender on collaboration patterns, our null model is blind to gender when assigning author–publication connections.
Aside from these inputs, the model has two free parameters: , the dimension of the embedding space, and , a parameter controlling the propensity for clustering. We set these parameters so as to best match the data in other relevant aspects, such as the component size distribution over time.
Specifically, for each year, the model performs the following steps:
-
1.
Choose a length scale for this year, such that there will be expected number of authors within a ball of radius , i.e., , where is the number of author nodes already placed (from previous years).
-
2.
Add the new author nodes from this year (simultaneously) at locations in a -dimensional unit torus, with probability proportional to the “attractiveness” of that location:
(7) where are the locations of the existing author nodes from previous years.
-
3.
Add a “half-edge” to each of the author nodes, for each publication they authored this year.
-
4.
Sequentially add the publication nodes from this year, in order of decreasing number of authors. The probability of placing a publication at a location is
(8) where is the number of authors on the publication, and are the locations of the nearest authors with available half-edges.
-
5.
The publication then connects to each of its requisite number of authors with probability
(9) where and are the positions of the publication and an author with an unused half-edge, respectively.
-
6.
Repeat steps 4–5 until all publications haven placed (and author half-edges used).
In the network created by this algorithm, every woman and man author has exactly the same number of publications for each year as they do in the INFORMS network. However, importantly, the mechanism by which the null model decides which publication to give to an author does not consider gender, and thus the resulting networks can be used as a null model to study gender differences in global statistics.
The null model mimics emergent network properties
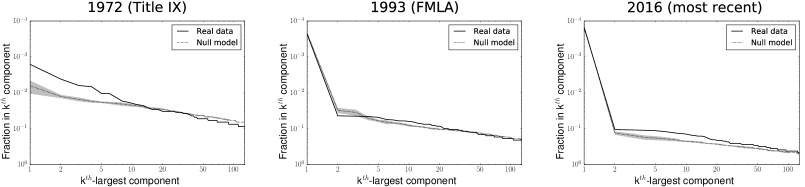
Aside from the explicitly matched temporal degree distributions, our null model is able to capture other relevant network features (see Figure 7). Namely, certain settings of the free parameters (e.g., ) allow the null model to replicate the initial appearance of the giant component, while others (e.g., ) match better the behavior in later years.
Correlations between author gender and the role of their authorships
in the global network structure
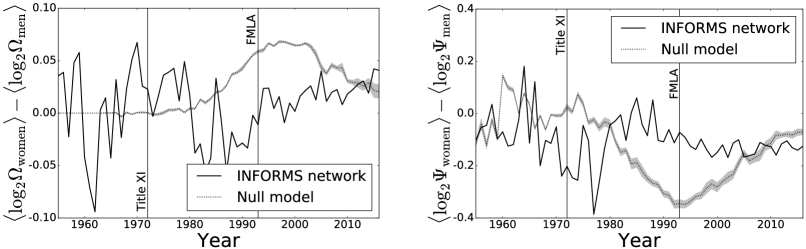
We used our null model to evaluate the effect of gender in determining the importance of an authorship to the global network structure. For every year, we calculated the difference in average edge importance measures ( and ) between the genders for the INFORMS network and for multiple simulations of the null model (all with and ). As shown in Figure 8, the data and null model deviate considerably.
Until around 1980, the null model predicted no difference between the effective resistance of authorships by women and men. This is likely due to the prevalence of author–publication connections with . In fact, until 1966, there were only 21 women in the dataset, and all had only one publication; this means that all of their effective resistances are precisely in both the data and the null model. Moreover, as the null model predicted no difference during this period between the effective resistance of authorships by women and men, authorships by men similarly have effective resistance close to . This is in contrast to the easily-discernible clustering present in the earlier years of the actual INFORMS network – our choice of parameters for the null model resulted in networks containing more tree-like components (for which all edges have ) during this period. We chose these parameters in order to qualitatively match the bulk of the available data, namely the emergence (1980) and size of the giant component. While our model captured this feature of the data, none of the parameter settings we tried allowed it to capture the clustering present before 1980. Therefore, it is difficult to interpret differences between the null-model and the actual data during this early period. The average contraction importance does, however, show gender differences in the null model during this period (Figure 8, right), highlighting the higher sensitivity of this measure of edge importance.
From around 1980 until around 2005, the null model begins to predict gender differences in both and . This is a particular relevant period as 1980 coincides with the onset the of a consistent increase in women participating in INFORMS (see Figure 1) and the emergence of the giant component (see Supplementary Video 1), and we choose the parameters of the null model to best replicate the component size distribution during this period (see Figure 7). Interestingly, the two measures deviate in opposite directions: the null model predicts that women should have a higher effective resistance and lower contraction importance than men. Neither of these changes were observed in the actual data, which instead display gender differences closer to zero for both and . This suggests that the gender differences in global statistics found in the INFORMS network during this period cannot be explained using only local statistics. Finally, from , the predicted gender differences are closer to those observed in the actual data, where authorships by women have effective resistance slightly higher and contraction importance slightly lower than authorships by men. This suggests that the more recent gender differences in global statistics can be explained mostly by differences in local statistics, such as the underrepresentation of women in the network.
Discussion
In this work, we investigated the relevance of gender in scientific publication patterns by analyzing a temporal bipartite network between authors and publications in the INFORMS journals. Our study provides two methodological contributions: 1) We develop a simple temporal geometric null model (with two free parameters) that encourages emergent communities (a hallmark feature of real-world networks); and 2) we present a case study for applying two measures of edge importance related to diffusion throughout the network, namely effective resistance and contraction importance .
While conventional measures of importance/centrality (e.g., edge betweenness [46]) may give qualitatively similar results, the measures we chose are particularly relevant due to their use in the analysis and implementation of a variety of graph algorithms. For example, they serve as a measure of edge importance in several graph reduction algorithms [13, 47], which are often used as primitives in other efficient algorithms for massive networks. As the field of applied network science often deals with such structures, it is relevant to investigate how such algorithms might interact with datasets containing metadata.
At the level of local statistics, we found that both the fractions of new women authors and of authorships by women in the INFORMS network have been increasing steadily since 1980 (see Figure 1). Before then, the fraction of new women authors hovered around less than 3%. While multiple factors may have contributed to the sudden change in derivative around 1980, it is not unreasonable to hypothesize that the introduction of Title IX legislation in the United States in 1972 played a role that is still unfolding, and such quantification of long-term effects could serve as a good argument for similar policies.
Despite the continued increase in the fraction of new women authors in INFORMS, more than four decades after Title IX, women still comprise less than of the network (Figure 1). Moreover, women are disproportionately underrepresented among authors with many publications (Figures 2 and 3). While this could be due to a variety of factors, we draw attention to gender biases in the peer-review process and visibility of researchers in the community (e.g., invitations to present work at conferences and colloquia [48]). These issues have been the focus of several recent studies. For example, Murray et al. [49] studied the review process in the journal eLife, and found that reviewers appear to favor authors with demographic characteristics (gender and nationality) similar to their own. In analyzing data from a longitudinal experiment by the Canadian Institutes of Health Research, Witteman et al. [4] found that women were less likely to be awarded a grant when the review focus was on “the principal investigator” as compared to “the proposed science”. Nittrouer et al. [6] found that men were more likely than women to be colloquium speakers at top US universities (even when controlling for speaker rank and the gender ratio in the field, and despite men and women declining invitations at similar rates. Due to enhanced scrutiny and attention to these issues, these trends have been changing more recently. For example, BiasWatchNeuro.com [50], a website dedicated to monitoring gender representation of invited speakers at conferences in the field of neuroscience, has documented a steady increase in the rate of women invited to present at conferences, with this rate now approaching a conservative estimate of the base rate of women in the field (, [51]).
Indeed, much effort is being invested in methods for mitigating these biases, such as compiling online lists of women researchers to facilitate their invitation as conference speakers and nomination for prizes [52, 53, 54]; making data on the gender balance in conferences and panels more visible online [50]; and encouraging journals to adopt a policy of double-blind reviews, which has been showed to reduce biases (such as increasing representation of women authors [55]). Such efforts might help improve scientific productivity by increasing gender heterogeneity in the scientific workforce [56]. For a thorough review on the issue of gender bias in science (with a focus on neuroscience) and recommended efforts to mitigate it, see Schrouff et al. [2].
By accurately quantifying the nature of systematic asymmetries, one can more precisely inform policies intended to remedy them [57, 58, 59]. For example, simulations of STEM faculty retention in a US university [60] suggest that in order for gender parity to be reached in those data, the higher rate of women resigning must be addressed. Follow-up studies investigating the reasons behind the higher resignation rate of women in STEM fields could be particularly helpful in informing policies targeting this attrition. Indeed, a recent study [61] analyzing a longitudinal national survey of US STEM professionals, suggests that this higher rate might be due to women leaving their full-time STEM jobs upon becoming parents for the first time ( resignation of women vs. of men). Additionally, it was found that, among those that continued to hold full-time jobs, parents were less likely to remain in their STEM jobs than their child-less peers. This suggests that policies to render work in STEM fields more compatible with caregiving may be critical to increase gender diversity. Likewise, network science analysis such as ours could help inform diversity efforts by indicating potential connections that are more likely to decrease gender disparities, for example, by funding research with author–publication connections that are diverse and important to the connectivity of the network. This type of analysis could also help evaluate the global impact of such efforts. For instance, future work could focus on trends that might correlate with more recent diversity initiatives in the INFORMS society (e.g., in 2006 and 2017). However, as the time-scale of our dataset is on the order of a typical career length, results for the last decade or so of our data are still unfolding; thus, it is presently difficult to measure the effect of policy changes during this time.
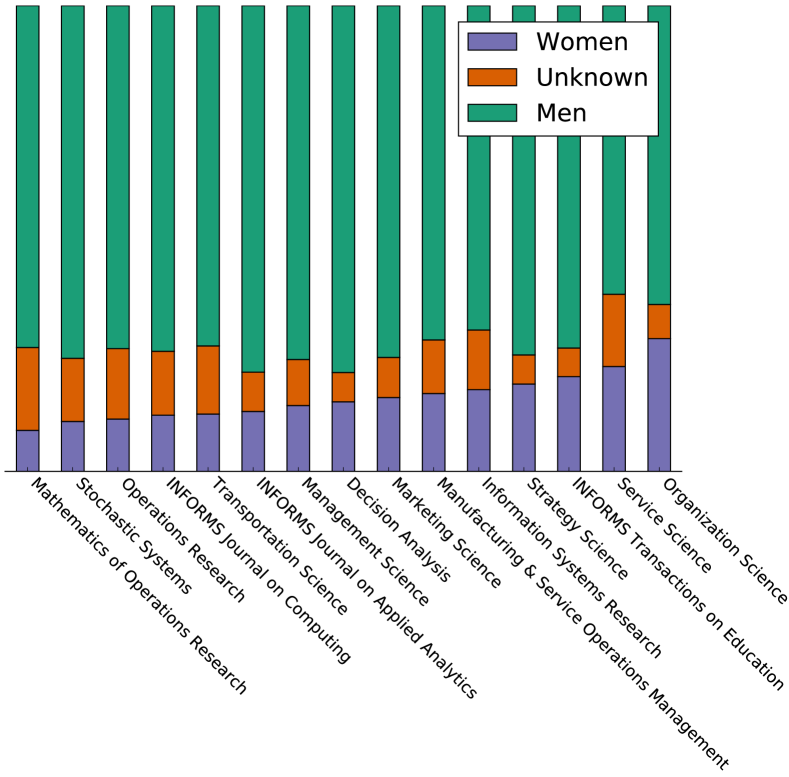
To shed light on where to focus such efforts, future work could focus on correlations between gender differences and various subcommunities. For example, in the current INFORMS dataset, some journals have a relatively higher rate of women authors (e.g., in Organization Science), while others have a much lower rate (e.g., in Mathematics of Operations Research; see supplementary Figure 9). Another interesting research avenue is to understand how particular collaboration patterns and homophily correlate with academic success (as measured, for instance, by number of future publications). The period of 1980–2005 in the INFORMS network is especially interesting in this regard, given indications that collaborative and publication patterns were different between genders in those years in ways that are not explained by local statistics. Our results suggest that, on average, women and men had more similar effective resistance and contraction importance in those years than predicted by the local statistics incorporated in our null model. This discrepancy between the data and the null model could indicate that women entering the INFORMS network had similar network roles as men. Another possibility is that women and men formed somewhat separate collaborative networks with similar statistics. Future work could investigate whether these, or other patterns, are dominant in the network.
It is important to recognize the limitations of our methodology. For instance, our data cleaning methods are likely biased: Genderize.io (the software we used to classify the genders of the authors) has a higher misclassification rate for non-Western names [62]. Moreover, as first names in many contemporary Western cultures are frequently indicative of only two genders, the API reduces the multidimensional continuum of genders to a single binary variable. In addition, the data selected for manual gender classification (i.e., all authors with more than six publications) are also likely correlated with gender,iiiiiiiiiOf authors with 6 or fewer publications, were classified as women, as men and as unknown, whereas the composition of those with more than 6 publications was women and men. biasing the ratio of known author genders (as women have disproportionately fewer publications than men). It is also important to acknowledge that our simple and physically-motivated null model does not replicate all of the relevant gender-ambivalent network properties. For example, we did not precisely match the component size distributions throughout the development of the network; lower dimensional embeddings better matched the earlier distributions, and higher dimensional embeddings better matched the later distributions. A time-varying will likely describe the data better, and thus provide a better comparison for evaluating the roles of women and men in the network over time, in particular, in early years of the network. However, from a practical point of view, those early years may be less informative regarding the effectiveness of current policies, and suggestions for further interventions to mitigate gender biases.
Overall, our results indicate that the INFORMS society remains far from gender parity in many important local statistics. However, since 1980 these differences have been steadily decreasing, and recent (2005) global statistics are more in agreement with our null model, indicating some progress. More generally, we hope that building a quantitative understanding of gender publication and collaboration patterns in academia will ultimately help accelerate the path towards gender equality by bringing awareness to the issue and informing future studies and policies.
Supplementary information
Video of evolution of cumulative degree distributions by gender.
The file with this video is provided in the Supplementary Material.
Additional descriptive statistics.
Table 1 displays additional descriptive statistics of the INFORMS dataset. We defined the time between publications for each author as , and computed the averages including only authors with more than one publication (35% of authors; 31% of women, 39% of men and 23% of unknown gender).
| women authors | men authors | unknown authors | |
| num. of authors | |||
| avg. num. of publications per author | |||
| avg. num. of co-authors | |||
| avg. num. of journals published in | |||
| percentage of authorships | |||
| percentage of authorships | |||
| percentage of solo authorships | |||
| avg. time between publications | |||
| median time between publications | |||
| median time of first publication | |||
| num. publications of top 5 (range) | up to | up to | up to |
| avg. log effective resistance | |||
| avg. log contraction importance | |||
| avg. normalized edge betweenness |
Authors gender in individual INFORMS journals.
List of abbreviations
INFORMS: Institute for Operations Research and the Management Sciences; STEM: science, technology, engineering, and mathematics; ORSA: the Operations Research Society of America; TIMS: the Institute of Management Sciences; Title IX: Title IX of the Education Amendments Act of 1972; FMLA: The Family and Medical Leave Act of 1993
Declarations
Competing interests
The authors declare that they have no competing interests.
Funding
This work was funded in part by a diversity grant from the Simons Foundation (VF,YN) and internal funds from Princeton University (GBH,YN).
Author’s contributions
ER, JM, and MEH conceived the overarching question and constructed the dataset. ER, GBH, MEH and VF performed data cleaning and validation. GBH and LMG designed and performed the analysis and discussed the results with ER, MEH, VF and YN. GBH, LMG, VF, and YN wrote the manuscript with input from ER and MEH. All authors read and approved the final manuscript.
Availability of data and material
Data are available from the authors upon reasonable request and with permission of INFORMS.
References
- [1] Raymond, J.: Most of us are biased. Nature 495(7439), 33–34 (2013). doi:10.1038/495033a
- [2] Schrouff, J., Pischedda, D., Genon, S., Fryns, G., Pinho, A.L., Vassena, E., Liuzzi, A.G., Ferreira, F.S.: Gender bias in (neuro) science: facts, consequences and solutions. European Journal of Neuroscience (2019)
- [3] Moss-Racusin, C.A., Dovidio, J.F., Brescoll, V.L., Graham, M.J., Handelsman, J.: Science faculty’s subtle gender biases favor male students. Proceedings of the National Academy of Sciences 109(41), 16474–16479 (2012). doi:10.1073/pnas.1211286109. https://www.pnas.org/content/109/41/16474.full.pdf
- [4] Witteman, H.O., Hendricks, M., Straus, S., Tannenbaum, C.: Are gender gaps due to evaluations of the applicant or the science? A natural experiment at a national funding agency. The Lancet 393(10171), 531–540 (2019). doi:10.1016/S0140-6736(18)32611-4
- [5] Helmer, M., Schottdorf, M., Neef, A., Battaglia, D.: Gender bias in scholarly peer review. eLife 6 (2017). doi:10.7554/elife.21718
- [6] Nittrouer, C.L., Hebl, M.R., Ashburn-Nardo, L., Trump-Steele, R.C.E., Lane, D.M., Valian, V.: Gender disparities in colloquium speakers at top universities. Proceedings of the National Academy of Sciences 115(1), 104–108 (2017). doi:10.1073/pnas.1708414115
- [7] Araújo, E.B., Araújo, N.A.M., Moreira, A.A., Herrmann, H.J., Andrade, J.S.: Gender differences in scientific collaborations: Women are more egalitarian than men. PLOS ONE 12(5), 0176791 (2017). doi:10.1371/journal.pone.0176791
- [8] Karimi, F., Mayr, P., Momeni, F.: Analyzing the network structure and gender differences among the members of the Networked Knowledge Organization Systems (NKOS) community. International Journal on Digital Libraries (2018). doi:10.1007/s00799-018-0243-0
- [9] Jadidi, M., Karimi, F., Lietz, H., Wagner, C.: Gender disparities in science? dropout, productivity, collaborations and success of male and female computer scientists. Advances in Complex Systems 21(03n04), 1750011 (2018)
- [10] West, J.D., Jacquet, J., King, M.M., Correll, S.J., Bergstrom, C.T.: The role of gender in scholarly authorship. PLoS ONE 8(7), 66212 (2013). doi:10.1371/journal.pone.0066212
- [11] About INFORMS. https://www.informs.org/About-INFORMS
- [12] Leslie, S.-J., Cimpian, A., Meyer, M., Freeland, E.: Expectations of brilliance underlie gender distributions across academic disciplines. Science 347(6219), 262–265 (2015). doi:10.1126/science.1261375. http://science.sciencemag.org/content/347/6219/262.full.pdf
- [13] Spielman, D.A., Srivastava, N.: Graph sparsification by effective resistances. SIAM Journal on Computing 40(6), 1913–1926 (2011). doi:10.1137/080734029
- [14] Chandra, A.K., Raghavan, P., Ruzzo, W.L., Smolensky, R.: The electrical resistance of a graph captures its commute and cover times. In: Proceedings of the Twenty-first Annual ACM Symposium on Theory of Computing. STOC ’89, pp. 574–586. ACM, New York, NY, USA (1989). doi:10.1145/73007.73062. http://doi.acm.org/10.1145/73007.73062
- [15] Christiano, P., Kelner, J.A., Madry, A., Spielman, D.A., Teng, S.-H.: Electrical flows, Laplacian systems, and faster approximation of maximum flow in undirected graphs. In: Proceedings of the Forty-third Annual ACM Symposium on Theory of Computing. STOC ’11, pp. 273–282. ACM, New York, NY, USA (2011). doi:10.1145/1993636.1993674. http://doi.acm.org/10.1145/1993636.1993674
- [16] Hermsdorff, G.B., Gunderson, L.M.: A unifying framework for spectrum-preserving graph sparsification and coarsening (2019). 1902.09702
- [17] Liu, L.T., Dean, S., Rolf, E., Simchowitz, M., Hardt, M.: Delayed impact of fair machine learning. In: Dy, J., Krause, A. (eds.) Proceedings of the 35th International Conference on Machine Learnin. Proceedings of Machine Learning Research, vol. 80, pp. 3150–3158. PMLR, Stockholmsmässan, Stockholm Sweden (2018). http://proceedings.mlr.press/v80/liu18c.html
- [18] Chouldechova, A., Roth, A.: The frontiers of fairness in machine learning. arXiv preprint arXiv:1810.08810 (2018)
- [19] Horner, P.: History lesson: The evolution of INFORMS. OR/MS Today 44(1) (2017)
- [20] ORSA/TIMS collaboration. Interfaces 3(4), 32–42 (1973)
- [21] Hall, J.R.: An issue-oriented history of TIMS. Interfaces 13(4), 9–19 (1983)
- [22] Mathematics of Operations Research: The first four years. Mathematics of Operations Research 5(1), (1980)
- [23] Morrison, D.G.: Founding Marketing Science. Marketing Science 20(4), 357–359 (2001). doi:10.1287/mksc.20.4.357. https://pubsonline.informs.org/doi/pdf/10.1287/mksc.20.4.357
- [24] INFORMS Publications. https://www.informs.org/Publications
- [25] Denton, B.: INFORMS membership – diversity, equity and inclusion. OR/MS Today 44(6), 8–9 (2017)
- [26] Nagurney, A.: What Professional Societies Can Do from the Top Down. Presented at Women in Science Panel of the Association for Women In Science Massachusetts Chapter (2007). https://supernet.isenberg.umass.edu/visuals/nagurney-awis.pdf
- [27] The Institute for Operations Research and the Management Sciences. INFORMS PubsOnLine. www.pubsonline.informs.org
- [28] CrossRef REST API. www.crossref.org/services/metadata-delivery/rest-api/
- [29] Genderize.io. www.genderize.io
- [30] Liu, X., Bollen, J., Nelson, M.L., de Sompel, H.V.: Co-authorship networks in the digital library research community. Information Processing & Management 41(6), 1462–1480 (2005). doi:10.1016/j.ipm.2005.03.012
- [31] Abbasi, A., Chung, K.S.K., Hossain, L.: Egocentric analysis of co-authorship network structure, position and performance. Information Processing & Management 48(4), 671–679 (2012). doi:10.1016/j.ipm.2011.09.001
- [32] Chen, Y., Ding, C., Hu, J., Chen, R., Hui, P., Fu, X.: Building and analyzing a global co-authorship network using google scholar data. In: Proceedings of the 26th International Conference on World Wide Web Companion. WWW ’17 Companion, pp. 1219–1224. International World Wide Web Conferences Steering Committee, Republic and Canton of Geneva, Switzerland (2017). doi:10.1145/3041021.3053056. https://doi.org/10.1145/3041021.3053056
- [33] Kitsak, M.: Latent geometry of bipartite networks. Physical Review E 95(3) (2017). doi:10.1103/PhysRevE.95.032309
- [34] Magrogan, M.T. Personal Communication (2019)
- [35] Title IX of the Education Amendments of 1972, 20 U.S.C. §1681–1683.
- [36] US Department of Justice: Equal Access to Education: Forty Years of Title IX (2012). https://www.justice.gov/sites/default/files/crt/legacy/2012/06/20/titleixreport.pdf
- [37] Walters, J., McNeely, C.L.: Recasting Title IX: Addressing gender equity in the science, technology, engineering, and mathematics professoriate. Review of Policy Research 27(3), 317–332 (2010). doi:10.1111/j.1541-1338.2010.00444.x
- [38] Family and Medical Leave Act of 1993, 29 U.S.C. sec. 2601.
- [39] Klerman, J.A., Daley, K., Pozniak, A.: Family and medical leave in 2012: Technical report. Cambridge, MA: Abt Associates Inc (2012)
- [40] Fiedler, M.: Algebraic connectivity of graphs. Czechoslovak Mathematical Journal 23, 298–305 (1973)
- [41] Teng, S.-H.: The Laplacian paradigm: Emerging algorithms for massive graphs. In: Kratochvíl, J., Li, A., Fiala, J., Kolman, P. (eds.) Theory and Applications of Models of Computation, pp. 2–14. Springer, Berlin, Heidelberg (2010)
- [42] Bollobás, B.: Random Graphs. Cambridge University Press, Cambridge New York (2001)
- [43] Tetali, P.: Random walks and the effective resistance of networks. Journal of Theoretical Probability 4, 101–109 (1991). doi:10.1007/BF01046996
- [44] Krioukov, D.: Clustering implies geometry in networks. Physical Review Letters 116(20) (2016). doi:10.1103/PhysRevLett.116.208302
- [45] Zuev, K., Boguñá, M., Bianconi, G., Krioukov, D.: Emergence of soft communities from geometric preferential attachment. Scientific Reports 5(1) (2015). doi:10.1038/srep09421
- [46] Girvan, M., Newman, M.E.J.: Community structure in social and biological networks. Proceedings of the National Academy of Sciences 99(12), 7821–7826 (2002). doi:10.1073/pnas.122653799
- [47] Fung, W.-S., Hariharan, R., Harvey, N.J., Panigrahi, D.: A general framework for graph sparsification. SIAM Journal on Computing 48(4), 1196–1223 (2019)
- [48] Women need to be seen and heard at conferences. Nature 538(7625), 290–290 (2016). doi:10.1038/538290b
- [49] Murray, D., Siler, K., Lariviére, V., Chan, W.M., Collings, A.M., Raymond, J., Sugimoto, C.R.: Gender and international diversity improves equity in peer review. bioRxiv (2018). doi:10.1101/400515. https://www.biorxiv.org/content/early/2018/08/29/400515.full.pdf
- [50] BiasWatchNeuro. https://biaswatchneuro.com/
- [51] Summarizing 3.33 years of BWN: we’ve moved the needle! (2018). https://biaswatchneuro.com/2018/12/29/summarizing-3-33-years-of-bwn-weve-moved-the-needle/
- [52] Request a Woman Scientist. https://500womenscientists.org/request-a-scientist
- [53] AcademiaNet: The Portal to Excellent Women Academics. http://www.academia-net.org/
- [54] Women in Neuroscience Repository. https://www.winrepo.org/
- [55] Budden, A.E., Tregenza, T., Aarssen, L.W., Koricheva, J., Leimu, R., Lortie, C.J.: Double-blind review favours increased representation of female authors. Trends in ecology & evolution 23(1), 4–6 (2008)
- [56] Campbell, L.G., Mehtani, S., Dozier, M.E., Rinehart, J.: Gender-heterogeneous working groups produce higher quality science. PloS one 8(10), 79147 (2013)
- [57] Fagan, J., Eddens, K., Dolly, J., Vanderford, N., Weiss, H., Levens, J.: Assessing research collaboration through co-authorship network analysis (2018)
- [58] Luke, D.A., Baumann, A.A., Carothers, B.J., Landsverk, J., Proctor, E.K.: Forging a link between mentoring and collaboration: a new training model for implementation science. Implementation Science 11(1), 137 (2016)
- [59] Okamoto, J., Centers for Population Health and Health Disparities Evaluation Working Group: Scientific collaboration and team science: a social network analysis of the centers for population health and health disparities. Translational behavioral medicine 5(1), 12–23 (2014)
- [60] Thomas, N.R., Poole, D.J., Herbers, J.M.: Gender in science and engineering faculties: Demographic inertia revisited. PLOS ONE 10(10), 1–9 (2015). doi:10.1371/journal.pone.0139767
- [61] Cech, E.A., Blair-Loy, M.: The changing career trajectories of new parents in STEM. Proceedings of the National Academy of Sciences, 201810862 (2019). doi:10.1073/pnas.1810862116
- [62] Santamaría, L., Mihaljević, H.: Comparison and benchmark of name-to-gender inference services. PeerJ Computer Science 4, 156 (2018)