Linear and nonlinear optical responses in the chiral multifold semimetal RhSi
Abstract
Chiral topological semimetals are materials that break both inversion and mirror symmetries. They host interesting phenomena such as the quantized circular photogalvanic effect (CPGE) and the chiral magnetic effect. In this work, we report a comprehensive theoretical and experimental analysis of the linear and non-linear optical responses of the chiral topological semimetal RhSi, which is known to host multifold fermions. We show that the characteristic features of the optical conductivity, which display two distinct quasi-linear regimes above and below 0.4 eV, can be linked to excitations of different kinds of multifold fermions. The characteristic features of the CPGE, which displays a sign change at 0.4 eV and a large non-quantized response peak of around 160 at 0.7 eV, are explained by assuming that the chemical potential crosses a flat hole band at the Brillouin zone center. Our theory predicts that, in order to observe a quantized CPGE in RhSi, it is necessary to increase the chemical potential as well as the quasiparticle lifetime. More broadly our methodology, especially the development of the broadband terahertz emission spectroscopy, could be widely applied to study photo-galvanic effects in noncentrosymmetric materials and in topological insulators in a contact-less way and accelerate the technological development of efficient infrared detectors based on topological semimetals.
Introduction
The robust and intrinsic electronic properties of topological metals—a class of quantum materials—can potentially protect or enhance useful electromagnetic responsesMurakamiNJP07 ; WanPRB2011 ; BurkovPRL2011 ; armitageRMP2018 . However, direct and unambiguous detection of these properties is often challenging. For example, in Dirac semimetals such as Cd3As2 and Na3BiwangPRB2012 ; wangPRB2013 two doubly degenerate bands cross linearly at a single point, the Dirac point, and this crossing is protected by rotational symmetry liuScience2014 ; neupaneNatComm2014 ; liuNatMat2014 . A Dirac point can be understood as two coincident topological crossings with equal but opposite topological chargearmitageRMP2018 , and as a result, the topological contributions to the response to external probes cancel in this class of materials, rendering external probes insensitive to the topological charge.
Weyl semimetals may offer an alternative, as this class of topological metals is defined by the presence of isolated twofold topological band crossings, separated in momentum space from a partner crossing with opposite topological charge. This requires the breaking of either time-reversal or inversion symmetry. The Weyl semimetal phases discovered in materials of the transition monopnictide family such as TaAsWengPRX2015 ; HuangNatComm2015 ; XuScience2015 ; LvPRX2015 ; lvNatPhys2015 ; xuNatphys2015 ; YangNatPhys2015 ; xuNatComm2016 lack inversion symmetry, which allows for nonzero second-order nonlinear optical responses and has motivated the search for topological responses using techniques of nonlinear optics. This search has resulted in the observation of giant second harmonic generationwuNatPhys2017 ; patankarPRB2018 , as well as interesting photo-galvanic effectsmaNatPhys2017 ; sunCPL2017 ; osterhoudtNatMat2019 ; siricaPRL2019 ; gaoNatComm2020 . However, neither response can be directly attributed to the topological charge of a single band crossing, since mirror symmetry—present in most known Weyl semimetals—imposes that charges with opposite sign lie at the same energy and thus contribute equally patankarPRB2018 ; zhangPRB2018 . This is similar for other types of Weyl semimetal materials, such as type-II Weyl semimetalssoluyanovNature2015 . Type-II Weyl semimetals display open Fermi surfaces to lowest order in momentumsoluyanovNature2015 ; wangPRL2016 ; changNatComm2016 ; huangNatComm2016 ; belopolskiNatComm2016 ; dengNatPhys2016 ; jiangNatComm2017 , giving rise to remarkable photogalvanic effectsyangarXiv2017 ; limPRB2018 ; jiNatMat2019 ; maNatMat2019 ; wangNatComm2019 , but not directly linked to their topological charge.
Materials with even lower symmetry can hold the key to measuring the topological charge directly. Chiral topological metals do not possess any inversion or mirror symmetriesManes:2012fi ; wiederPRL2016 ; bradlynScience2016 ; changNatMat2018 , and as a result, the topological band crossings do not only occur at different momenta but also at different energies, making them accessible to external probes. Notably, the circular photogalvanic effect (CPGE), i.e., the part of the photocurrent that reverses sign with the sense of polarization, was predicted to be quantized in chiral Weyl semimetalsdejuanNatComm2017 . However, chiral Weyl semimetals with sizable Weyl node separations, such as SrSi2Huang:2016is , have not been synthesized as single crystals.
Recently, a class of chiral single crystals has emerged as a promising venue for studying topological semimetallic behavior deriving from topological band crossings. Following a theoretical predictionManes:2012fi ; wiederPRL2016 ; bradlynScience2016 ; changPRL2017 ; tangPRL2017 ; changNatMat2018 , experimental evidence provided proof that a family of silicides, including CoSi sanchez2019topological ; raoNature2019 ; takanePRL2019 and RhSi sanchez2019topological , hosts topological band crossings with nonzero topological charge at which more than two bands meet. Such band crossings, known as multifold nodes, may be viewed as generalizations of Weyl points and are enforced by crystal symmetries. These materials are good candidates to study signatures of topological excitations in optical conductivity measurements, as the Lifshitz energy which separates the topological from the trivial excitations is on the order of eV. In contrast, the Lifshitz energy in previous Dirac/Weyl semimetals such as Cd3As2 wangPRB2013 , Na3Bi wangPRB2012 and TaAs WengPRX2015 ; HuangNatComm2015 is below 100 meV.
The prediction of a quantized CPGE was extended to materials in this class, specifically to RhSi in space group 198changPRL2017 ; flickerPRB2018 ; deJuan:2020jm . These materials display a protected three-band crossing of topological charge , known as a threefold fermion at the zone center and a protected double Weyl node of opposite topological charge at the zone boundary. In RhSi, theory predicts that below 0.7 eV, only the point is excited, resulting in a CPGE plateau when the chemical potential is above the threefold nodechangPRL2017 ; flickerPRB2018 ; deJuan:2020jm . Above 0.7 eV, the R point contribution of opposite charge compensates it, resulting in a vanishing CPGE at large frequencieschangPRL2017 ; flickerPRB2018 ; deJuan:2020jm . The predicted energy dependence above 0.5 eV is qualitatively consistent with a recent experiment in RhSi performed within photon energies ranging between 0.5 eV to 1.1 eV reesarxiv2019 .
Despite this preliminary progress, the challenge to determine if and how quantization can be observed in practice in these materials has remained unanswered, largely since multiple effects such as the quadratic correction flickerPRB2018 ; deJuan:2020jm and short hot-carrier lifetime dejuanNatComm2017 ; Konig2017 can conspire to destroy it. Furthermore, thus far, the experimental signatures of the existence of multifold fermions have been limited to band structure measurements sanchez2019topological ; raoNature2019 ; takanePRL2019 . A comprehensive understanding of the linear maulanaPRR2020 and nonlinear optical responses reesarxiv2019 , targeting the energy range where the multifold fermions dominate optical transitions and transport signatures, is still lacking.
In this work we report the measurement of the linear and non-linear response of RhSi, analyzed using different theoretical models of increasing complexity, and provide a consistent picture of (i) the way in which multifold fermions manifest in optical responses, and (ii) how quantization can be observed. We performed optical conductivity measurements from 4 meV to 6 eV and 10 K to 300 K, as well as terahertz (THz) emission spectroscopy with incident photon energy from 0.2 eV to 1.1 eV at 300 K. Our optical conductivity measurements, combined with tight-binding and ab-initio calculations, show that interband transitions eV are mainly dominated by the vertical transitions near the multifold nodes at the Brillouin zone center, the point. We found that the transport lifetime is relatively short in RhSi, fs at 300 K and fs at 10 K. The measured CPGE response shows a sign change and no clear plateau. Our optical conductivity and CPGE experiments are reasonably well reproduced by tight-binding and first-principle calculations when the chemical potential lies below the threefold node at the point, crossing a relatively flat band, and when the hot-carrier lifetime is chosen to be - fs. We argue that these observations are behind the absence of quantization. Our ab-initio calculation predicts that a quantized CPGE could be observed by increasing the electronic doping by meV with respect to the chemical potential in the current generation of samples sanchez2019topological ; reesarxiv2019 ; maulanaPRR2020 , if it is accompanied by an improvement in the sample quality that can significantly increase the hot carrier lifetime.
Results and Discussion
Optical conductivity measurement
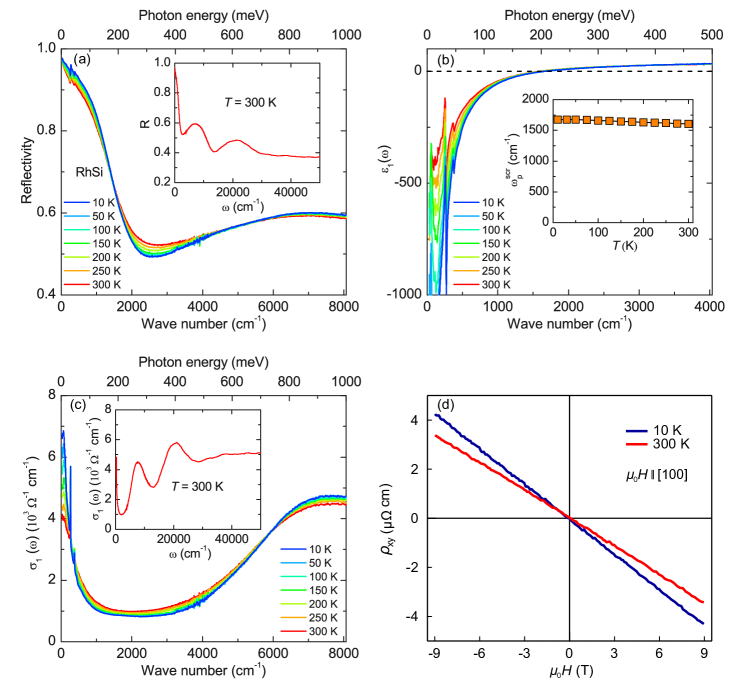
The measured frequency-dependent reflectivity by a FTIR spectrometer (see Methods) is shown in Fig. 1(a) in the frequency range from 0 to 8 000 for several selected temperatures. (1 meV corresponds to 8.06and 0.24 THz.) at room temperature is shown over a much larger range up to 50 000 in the inset. In the low-frequency range, is rather high and has a response characteristic of a metal in the Hagen-Rubens regime. Around 2 000 a temperature-independent plasma frequency is observed in the reflectivity. For 8000 the reflectivity is approximately temperature independent.
The results of the Kramers-Kronig analysis of are shown in Figs. 1(b) and 1(c) in terms of the real part of the dielectric function and the real part of optical conductivity . At low frequencies, is negative, a defining property of a metal. With increasing photon energy , crosses zero around 1 600 and reaches values up to 33 around 4 000. The crossing point, where , is related to the screened plasma frequency of free carriers. As shown by the inset of Fig. 1(b), is almost temperature independent. Similar temperature dependence and values of have been recently reported in another work for RhSi maulanaPRR2020 , indicating similar large carrier densities and small transport lifetime in RhSi samples.
Fig. 1(c) shows the temperature dependence of for RhSi. Overall, is dominated by a narrow Dude-like peak in the far-infrared region, followed by a relativety flat tail in the frequency region between 1 000 and 3 500. As the temperature decreases, the Drude-like peak narrows with a concomitant increase of the low-frequency optical conductivity. In addition, the inset shows the spectrum at room temperature over the entire measurement range, in which the high-frequency is dominated by two interband transition peaks around 8 000and 20 000.
To perform a quantitative analysis of the optical data at low frequencies, we fit the spectra with a Drude-Lorentz model
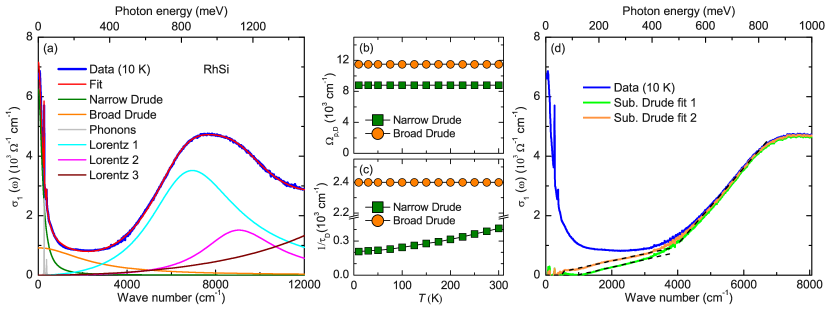
| (1) |
where is the vacuum impedance. The first sum of Drude-terms describes the response of the itinerant carriers in the different bands that are crossing the Fermi-level, each characterized by a plasma frequency and a transport scattering rate (Drude peak width) . The second term contains a sum of Lorentz oscillators, each with a different resonance frequency , a line width , and an oscillator strength . The corresponding fit to the conductivity at 10 K (thick blue line) using the function of Eq. (1) (red line) is shown in Fig. 2(a) up to 12 000. As shown by the thin colored lines, the fitting curve is composed of two Drude terms with small and large transport scattering rates, respectively, and several Lorentz terms that account for the phonons at low energy and the interband transitions at higher energy. Fits of the curves at all the measured temperatures return the temperature dependence of the fitting parameters. Figure 2(b) shows the temperature dependence of the plasma frequencies of the two Drude terms, which remain constant within the error bar of the measurement, indicating that the band structure hardly changes with temperature. Figure 2(c) displays the temperature dependence of the corresponding transport scattering rates of the two Drude terms. The transport scattering rate of the broad Drude term remains temperature independent, while that of the narrow Drude decreases at low temperature. Note that the temperature dependence of the Drude responses appears to be slightly stronger than in Ref. maulanaPRR2020, probably due to a slightly better crystal quality in our studies.
The need for two Drude terms indicates that RhSi has two types of charge carriers with very different transport scattering rates. Such a two-Drude fit is often used to describe the optical response of multiband systems. Prominent examples of such multiband materials are the iron-based superconductors Wu2010PRB ; Dai2013PRL ; Xu2019PRB . As we discuss below, in the case of RhSi two main pockets are expected to cross the Fermi level, centered around the (heavy hole pocket) and the point (electron pocket) changPRL2017 ; tangPRL2017 . (See the band structure in Fig. 3.) Note that there might be a small hole pocket at the point as well. Accordingly, the two-Drude fit can most likely be assigned to the intraband response around the (broad Drude term) and (narrow Drude term) points of the Brillouin zone because the effective mass of the holes from the flat bands at is much heavier than the electrons at . This is further supported by the observation of dominant electron contribution in Hall resistivity measurement on a typical RhSi sample, which is linear as a function of magnetic field up to 9 T, as shown in Fig. 1(d). A third Drude peak for the pocket at could be included but its contribution must be very small as the two pockets at and are much larger. Note that the two Drude terms could also come from two scattering processes with different scattering rates maulanaPRR2020 . We use the transport lifetime of the narrow Drude peak as the upper bound and estimate that transport lifetime is fs at 300 K and fs at 10 K, consistent with previous studies reesarxiv2019 ; maulanaPRR2020 .
Having examined the evolution of the two-Drude response with temperature, we next investigate the spectrum associated with interband transitions. To single out this contribution, we show in Fig. 2(d) the spectra, after subtracting the two-Drude response and the sharp phonon modes. With the subtraction of two Drude peaks with transport scattering rates of 200 and 2 400 (Drude fit 1 in Fig. 2(d)), we reveal a quasi-linear behavior of in the low-frequency regime (up to about 3 500). Such behavior is a strong indication for the presence of three-dimensional linearly dispersing bands near the Fermi level SanchezMartinez:2019he . Indeed, from band structure calculations (see Fig. 3), we see that this low-energy quasi-linear interband conductivity ( 3 500) could be attributed to the interband transitions around the point. At higher energy, the interband contributions around the point become allowed and can be responsible for the second quasi-linear interband conductivity region (3 500 6 500). At 6 500, the optical conductivity flattens and forms a broad maximum around 8 000. From Fig. 2(a) we see that this maximum is a consequence of the Lorentzian peak around 0.85 eV (light blue) and around 1.1 eV (magenta). As analyzed by density-functional theory below, the peak around 0.85 eV is most likely attributed to broadened interband transitions centered at the point, which was previously systematically studied in CoSi xuarXiv2020 . See more discussion in the calculation below. Note that our interpretation of the peak is different from Ref. maulanaPRR2020, .
Before analyzing these further, it is important to note that the fit to the broader Drude peak might suffer from more uncertainty than that of the narrow Drude peak. Small changes in its width might result in appreciable changes when subtracting it from the full data set to obtain the interband response. Here we use a different method, which does not make use of Drude Lorentz fits since the low-frequency tails of Lorentian terms might also look quasi-linear. Instead, we fit and then subtract the two Drude and two phonon terms directly. By subtracting the broad Drude peak this time with a smaller transport scatter rate of 1 350 (Drude fit 2 in Fig. 2(d)), the onset frequency at which the interband conductivity emerges decreases and the magnitude of below 4 000 increases, with respect to the Drude fit 1. However, the resulting slope below 3 500 is not significantly modified as the wide Drude response contributes as a flat background in this regime. Note that another recent study used a similar method and also found that the quasi-linear behavour is robust within the uncertainty of the fit parameters maulanaPRR2020 . Therefore, we conclude that the low-frequency quasi-linear conductivity is contributed from interband excitations and will be analyzed next in our theoretical modeling.
Optical conductivity calculation
To gain insight into the low-frequency interband optical conductivity of RhSi, we now put these predictions to the test based on a low-energy linearized model around the point, a four-band tight-binding model, and ab-initio calculations (see Methods).
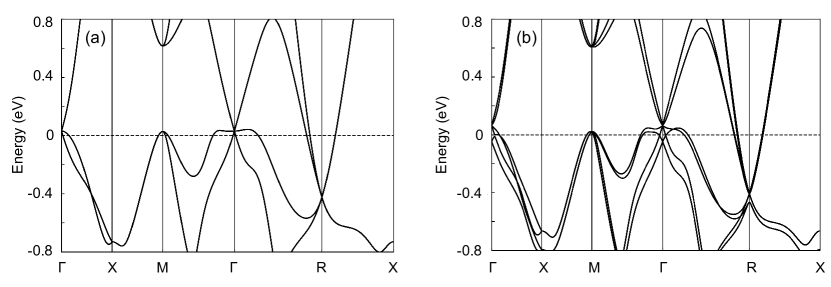
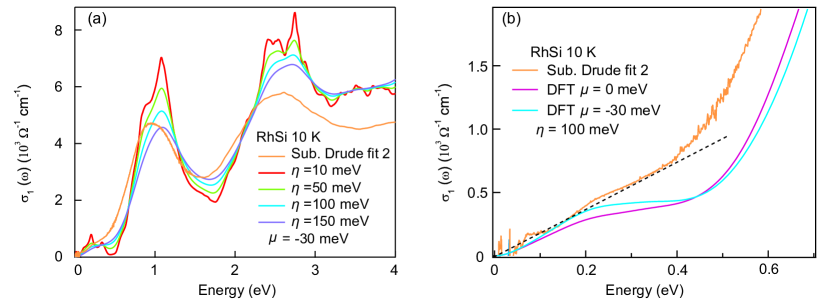
We start from simpler linear and tight-binding models to explain the two low-energy quasi-linear behavior. The band structure of RhSi calculated using Density Functional Theory (DFT) is shown in Fig. 3. The band structure calculations of Fig. 3 suggest that at low frequencies, eV, the optical conductivity is dominated by interband transitions close to the point as the point is 0.4 eV below the chemical potential. To linear order in momentum, the middle band at is flat (see Fig. 3(a)), and the only parameter is the Fermi velocity of the upper and lower dispersing bands . The optical conductivity of a threefold fermion is SanchezMartinez:2019he and is plotted in Fig. 4(b)(solid gray line). We observe that the low energy shows a smaller average slope compared to the low-energy part of our experimental data. In addition, a purely linear conductivity is insufficient to describe a small shoulder at around meV (see a more zoomed-in data in Fig. 5(b) compared to the linear guide to the eye).
The position of the chemical potential in Fig. 3 indicates that the deviations from linearity of the central band at can play a significant role in optical transitions. To include them we use a four-band tight-binding lattice model that incorporates the lattice symmetries of space-group 198 changPRL2017 ; flickerPRB2018 . The resulting tight-binding band structure is shown in Fig. 4(a) by following the method developed in Ref. flickerPRB2018, . (See Methods). In Fig. 4(b) we compare the tight-binding model with different chemical potentials indicated in Fig. 4(a) and the experimental optical conductivity in the interval eV (sub. Drude fit 2), as the extrapolation is expected to go through zero SanchezMartinez:2019he . By choosing different chemical potentials below and above the node without yet including a hot-carrier scattering time , we observe that if the chemical potential is below the threefold node (see meV curves in Fig. 4 (b)), a peak appears (around meV for meV), followed by a dip in the optical conductivity at larger frequencies, before the activation of the transitions centered at the point.
The peak-dip feature observed in the optical conductivity can be traced back to the allowed optical transitions and the curvature of the middle band. When the Fermi level lies below the node, the interband transitions with the lowest activation frequency connect the lower to the middle threefold band at . Increasing the frequency could activate transitions between the bottom and upper threefold bands, allowed by quadratic corrections, but these are largely suppressed due to the selection rules as the change of angular momentum between these bands is SanchezMartinez:2019he . Because of the curvature of the middle band, the transitions connecting the lower and the middle threefold bands die out as frequency is increased further, resulting in the peak-dip structure visible in Fig. 4 (b). Since the curvature of the middle band is absent by construction in the linear model but captured by the tight-binding model, it is only the latter model that shows a conductivity peak-dip. As a side remark, we observe that the transitions involving the R point bands activate at lower frequencies as the chemical potential is decreased.
Although placing the chemical potential below the node results in a marked peak around 0.2 eV, it is clearly sharper, and overshoots compared to the data, for which the sudden drop at frequencies above the peak is also absent. It is likely that this drop is masked by the finite and relatively larger disorder related broadening . This scale is expected to be large for RhSi given the broad nature of the low-energy Drude peak width in Eq. 4. Note that is the hot-carrier lifetime, which is different from the transport lifetime estimated from the Drude peaks. In Fig. 4(c) we compare different hot-carrier scattering times for meV. Upon increasing the sharp features in Fig. 4(b) are broadened, turning the sharp peak into a shoulder, which was observed in the experimental data. When meV the resulting optical conductivity falls close to our experimental data, including the upturn at eV, associated to the activation of the broadened transitions around the point, which agrees with the experimental data. Note that the large disorder scale is similar to the spin-orbit coupling ( 100 meV) and, therefore, washes out any feature narrower than 100 meV and justifies our discussion based on a tight-binding model without spin-orbit coupling.
We note that despite the general agreement below eV, the intuitive tight-binding calculations deviate from the data above eV. This is likely due to the tight-binding model’s known limitations, which fails to accurately capture the band structure curvature and orbital character at other high-symmetry points such as the point, which is a saddle point. These limitations will also play a role in our discussion of the CPGE.
To refine our understanding of these aspects and to further examine the role of spin-orbit coupling, we have used the DFT method to calculate the optical conductivity, including spin-orbit coupling on a wider frequency range up to eV (See Methods). The optical conductivity we obtained is compared to our data in Fig. 5(a) for a wide range of frequencies, and in Fig.5(b) within a low energy frequency window. The smaller broadening factors, meV, reveal fine features due to spin-orbit coupling such as the peaks at low energies, due to the spin-orbit splitting of the and points (see Fig. 3(b)). These features are absent in the data as they are smoothened as the broadening is increased (see Fig. 5(a)), consistent with the tight-binding model discussion above. As shown in Fig. 5(b), the low-energy conductivity below 0.2 eV is better explained if the chemical potential is at - 30 meV. The dip at around 0.5 eV, seen in Fig. 5(b) for low broadening, is filled with spectral weight as broadening is increased, consistent with our tight-binding calculations. Note that the DFT calculation underestimates the conductivity in the range of 0.2 - 0.4 eV, which is probably because the contribution of surface arcs is not considered changPRL2020 .
At higher energies the DFT calculation recovers a peak at eV, seen also in our data (see Fig. 5(a)). If the broadening is small (=10 meV), the peak is sharper compared to the measurement and exhibits a double feature with a shoulder around 0.85 eV and a sharp peak around 1.08 eV . Although smoothened by disordered, this double feature is consistent with the need of two Lorentzian functions (Lorentz 1 and Lorentz 2 in Fig. 2(a)) to model this peak phenomenologically with Eq. (1). Fig. 3(b) shows that the excitation energy at the point is around 0.7 eV. In a recent work on CoSi, in the same space group 198 as RhSi, a momentum-resolved study shows that the dominant contribution of this Lorentzian function (Lorentz 1) arises from the saddle point at xuarXiv2020 . The peaks around 1.1 eV and 2.5 eV could arise from other saddle points with a gap size larger than that at the point.
Overall, the curves with broadening factor meV and with chemical potential below the nodes at in both the tight-binding and DFT calculations show a good qualitative agreement with the experimentally measured curve in a wide frequency range. This observation determines approximately the hot-carrier lifetime in RhSi to be fs.
CPGE measurement
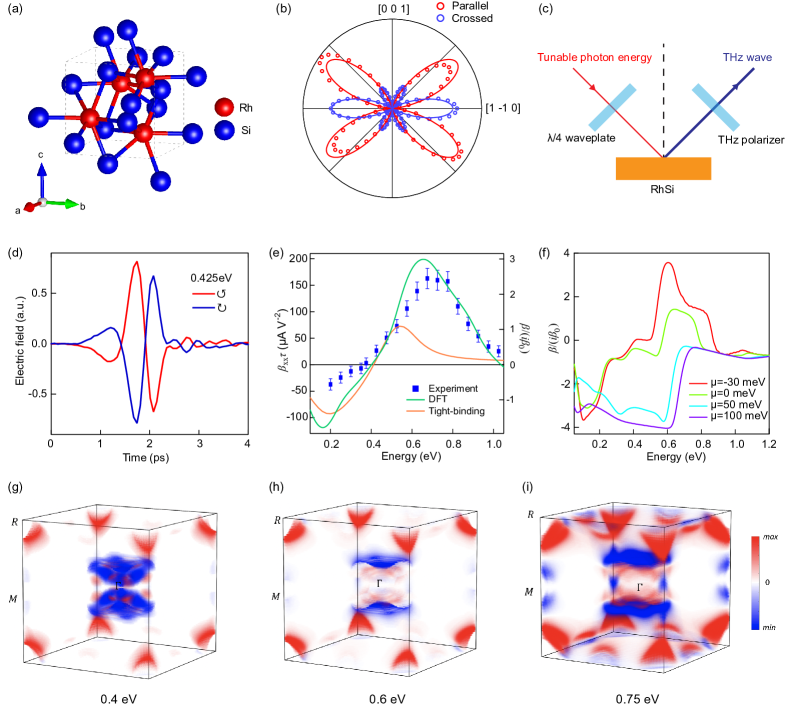
As a first step of the CPGE experiment, we determined the high symmetry axes, [0,0,1] and [1,-1,0] directions of the RhSi (110) sample (See Fig. 6(a)) respectively by second harmonic generation (SHG). To stimulate SHG, pulses of 800 nm wavelength were focused at near-normal incidence to a spot with a 10- m diameter on the (110) facet wuNatPhys2017 . Fig. 6(b) shows the polar patterns of SHG as a a function of the polarization of the linear light in the co-rotating parallel-polarizer (red) and crossed-polarizer (blue) configurationswuNatPhys2017 ; patankarPRB2018 . The solid lines are the fit constrained by the point group symmetry with only one non-zero term and the angle dependence of the SHG are:
| (2) |
| (3) |
where is the angle between the polarization of the incident light and the [1,-1,0] axis.
Next, we perform THz emission spectroscopy to measure the longitudinal CPGE in RhSi (See Methods). As shown in Fig. 6(c), an ultrafast circularly-polarized laser pulse is incident on the sample at 45 degrees to generate a transient photocurrent. Due to the longitudinal direction of the CPGE, the transient current flows along the light propogation direction inside RhSi, and therefore, in the incident planedejuanNatComm2017 ; changPRL2017 ; flickerPRB2018 . The THz electric fields radiated by the time-dependent photocurrent is collected and measured by a standard electro-optical sampling method with a ZnTe detectorshan2004terahertz . The component in the incident plane is measured by placing a THz wire-grid polarizer before the detector. Fig. 6(d) shows a typical response of the component of emitted THz pulses in the incident plane under left-handed and right-handed circularly polarized light at an incident energy of 0.425 eV. The nearly opposite curves demonstrate the dominating CPGE contribution to the photocurrent with an almost vanishing linear photogalvanic effect (LPGE) at this incident energy. The CPGE contribution can be extracted by taking the difference between the two emitted THz pulses under circularly polarized light with opposite helicity. During our measurement, the [0 0 1] axis is kept horizontally in the lab, even though the CPGE signal does not depend on the crystal orientation due to the cubic crystalline structure.
In order to measure the amplitude of the CPGE photocurrent, we use a motorized delay stage to move a standard candle ZnTe at the same position to perform the THz emission experiment right after measuring RhSi for every photon energy between 0.2 eV to 1.1 eV SotomePNAS19 . ZnTe is a good benchmark due to its relatively flat frequency dependence on the electric-optical sampling coefficient for photon energy below the gap Cabrera1985 ; boyd2003nonlinear . The use of ZnTe circumvents assumptions regarding the incident pulse length, the wavelength dependent focus spot size on the sample, and the calculation of collection efficiency of the off-axis parabolic mirrors SotomePNAS19 ; niCoSi2020 . The details of the derivation can be found in Ref. niCoSi2020, and this method was previously used in the shift current measurement on a ferroelectric insulator SotomePNAS19 . A spectrum of CPGE photo-conductivity as a function of incident photon energy is shown in Fig. 6(e) in units of (squares). Upon decreasing the incident photon energy from 1.1 eV to 0.7 eV, we observe a rapid increase of CPGE response with a peak value of 163 (19) at 0.7 eV. The features of this line resemble those observed in Ref. reesarxiv2019, . Further decreasing the photon energy from 0.7 eV to 0.2 eV, the CPGE conductivity displays a sharp drop with a striking sign change at 0.4 eV, which was not seen before as the lowest photon energy measured in a previous study was around 0.5 eV reesarxiv2019 . Interestingly, the peak photoconductivity at 0.7 eV is much larger than the photo-galvanic effect in BaTiO3feiPRB2020 , single-layer monochalcogenides rangelPRL2017 ; feiPRB2020 other chiral crystalszhangPRB2019 and it is comparable to the colossal bulk-photovoltaic response in TaAsosterhoudtNatMat2019 . It is also one order of magnitude larger than the previous study on RhSi reesarxiv2019 probably due to a larger hot-carrier lifetime. Interestingly, the sign change at 0.4 eV was not predicted in previous theory studies eitherchangPRL2017 ; flickerPRB2018 ; deJuan:2020jm . The quantized CPGE below 0.7 eV predicted in RhSi in previous theory studies changPRL2017 ; flickerPRB2018 ; deJuan:2020jm is absent in the experiment. Note that CPGE from the surface Fermi arcs, which might exist below 0.5 eV on the (110) facet, is generally one order of magnitude smaller than the bulk contribution. It is better to be detected under normal incidence and therefore not the focus of this work changPRL2020 .
CPGE calculation
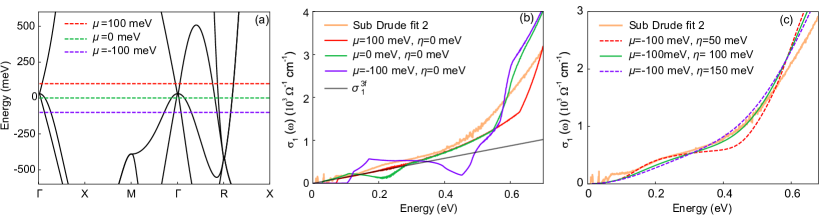
In order to understand the absence of quantized CPGE and the origin of the sign change in our CPGE data, we have calculated the CPGE response, , using a first-principle calculation via FPLO (full-potential local-orbital minimum-basis) as DFT captures the curvature of the flat bands at and the saddle point Koepernik1999 ; perdew1996 (See Methods). Due to cubic symmetry, the only finite CPGE component is flickerPRB2018 . In our convention, the tensor determines the photocurrent rate. When the hot-carrier lifetime is short compared to the pulse width, the total photocurrent is given deJuan:2020jm . is directly calculated from the band structure at meV and we assume a constant as a function of energy. is the only fitting parameter to match both the peak and width in the CPGE current.
In Fig. 6(e) we plot , with the hot-carrier scattering time corresponding to a broadening meV ( fs) calculated using the DFT ( meV, K). The DFT calculation captures quantitatively the features seen in the CPGE data: the existence of a peak around eV, its width, and the sign change of the response. Together they support the conclusion that the chemical potential lies below the node (see Fig. 3), consistent with the features of the optical conductivity. Fig. 6 (g-i) shows the momentum-resolved contribution to the CPGE current at different incident photon energies. Below 0.6 eV, the main contributions are centered around the and points with opposite signs while the point is turned on at 0.75 eV. The sign change at 0.4 eV is due to the turn on of the excitations at with an opposite sign in , which was also derived in a simpler model recently niCoSi2020 . Note that at 0.4 eV, the point already contributes to the CPGE due to the large broadening 100 meV in this material. The certain remaining differences between the data and the calculations suggests that a constant, energy independent hot-carrier scattering time might be an oversimplified phenomenological model for the disorder. In general, the hot-carrier scattering time is energy and momentum dependent Konig2017 and including these effects might give even better agreement.
It is illustrative to compare these results, especially the striking sign change, with a four-band tight-binding calculations for the CPGE as the latter is the simplest model to capture both the multifold fermions at the and points. Following Ref. flickerPRB2018, we computed the CPGE with parameters meV and meV (Fig. 6(e) orange line), which match the optical conductivity (see Fig. 4(c), solid line), but it underestimates the position of the peak and the overall magnitude of the CPGE. This is mainly attributed to the failure of the tight-binding to capture the point. However, it shows the overall peak-dip structure of the response and its sign change around 0.4 eV, which is contributed from the negative chemical potential at . By lowering the chemical potential, the tight-binding result can be made to match the data, paying the price that the optical conductivity will no longer be reproduced.
We end by discussing the possibility of observing a quantized CPGE in this sample. In Fig. 6(f) we show the effect of changing the chemical potential on the DFT calculated CPGE tensor trace in units of the quantization constant . For an ideal multifold fermion with linear dispersion, and taking into account spin-degeneracy, the CPGE is expected to be quantized to a Chern number of four, as , corresponding to the total charge of the nodes at flickerPRB2018 , . A finer analysis and density functional theory calculationsflickerPRB2018 ; deJuan:2020jm indicates that, unlike in the case of Weyl nodes, quadratic corrections can spoil quantization beyond the linear dispersion regime in multifold fermion materials. Upon decreasing the broadening to 10 meV and changing the Fermi level by 100 meV compared to the chemical potential found in our DFT calculations, a narrow frequency window around 0.6 eV emerges with a close-to-quantized value, shown as purple line in Fig. 6(f). We note that when the chemical potential is above the nodes, there is no sign change below 0.7 eV.
In conclusion, we have established a consistent picture of the optical transitions in RhSi using a broad set of theoretical models applied to interpret the linear and nonlinear optical responses. Our data is explained if the chemical potential crosses a large hole-like band at , and with a relatively short hot-carrier lifetime fs. The combined analysis of both linear and nonlinear responses illustrates the crucial role played by the curvature of the flat-band at the point and the saddle point at .
Interband optical conductivity shows two quasi-linear regions where the conductivity increases smoothly with frequency and a slope change around 0.4 eV. The slope in the first region is determined by a disorder-broadened contribution associated with a threefold fermion at the point. The slope in the second region is determined by the onset of a broadened point conductivity.
The circular photogalvanic effect exhibits a sign change close to eV, and a non-quantized peak at eV. The magnitude of the CPGE response is approximately captured by our density functional theory (DFT) calculations for a wide range of frequencies. Lastly, our calculations suggest that by electron-doping RhSi by meV, a close-to-quantized value could be observed in a narrow energy window around 0.6 eV, if the hot-carrier scattering time is significantly increased. To realize the quantized CPGE, it would be also desirable to identify a material candidate with smaller spin-orbit coupling than RhSi le2020ab ; niCoSi2020 .
Our systematic methodology can be applied to other non-centrosymmetric topological materials bradlynScience2016 ; changNatMat2018 to reveal signature of topological excitations. We observed THz emssion in the mid-infared regime (0.2 eV - 0.5 eV). We expect that the development of broadband THz emission spectroscopy provides the opportunity to reveal bulk photovoltanic SotomePNAS19 ; siricaPRL2019 ; gaoNatComm2020 and spintronic responses nvemecnatphys18 in a low-energy regime and also the possibility of probing Berry curvature in surface-state photo-galvanic effect in topological insulators hosurPRB2011 .
Methods
Crystal growth The high-quality single crystal of RhSi was grown by the Bridgeman method sanchez2019topological . 2 mm5 mm large RhSi with a (110) facet is used in this study.
Optical conductivity measurement The in-plane reflectivity was measured at a near-normal angle of incidence using a Bruker VERTEX 70v FTIR spectrometer with an in situ gold overfilling technique Homes1993 . Data from 30 to 12 000 ( 4 meV to 1.5 eV) were collected at different temperatures from 10 to 300 K with a ARS-Helitran cryostat. The optical response function in the near-infrared to the ultraviolet range (4 000 – 50 000) was extended by a commercial ellipsometer (Woollam VASE) in order to obtain more accurate results for the Kramers-Kronig analysis of Dressel2002 . The beam is focused down to 2 mm and not polarized as the conductivity is isotropic due to cubic symmetry.
THz emission experiment The THz emission experiment is performed at dry air environment with relative humidity less than 3 at room temperature. An ultrafast laser pulse is incident on the sample at 45 degrees to the surface normal and is focused down to 1 mm2 to induce THz emission. The THz pulse is focused by a pair of 3-inch off-axis parabolic mirrors on the ZnTe (110) detector. The temporal THz electric field can be directly measured with a gated probe pulse of 1.55 eV and 35 fs durationshan2004terahertz . The polarization of incident light is controlled by either a near-infrared achromatic or a mid-infrared quarter-wave plate. A wire-grid THz polarizer is utilized to pick out the THz electric field component in the incident plane. The photon energy of the incident light is tunable from 0.2 eV to 1.1 eV by an optical parametric amplifier and difference frequency generation. Pulse energy of is used for 0.4-1.1 eV and is used for 0.2-0.4 eV. The repetition rate of the laser used is 1 kHz.
Four-band tight-binding model In the main text we use a four-band tight-binding model introduced in Ref. changPRL2017, and further expanded in Ref. flickerPRB2018, . Since this model has been extensively studied before, we briefly review its main features relevant to this work. Our notation and the model is detailed in appendix F of Ref. SanchezMartinez:2019he, .
Without spin-orbit coupling, the four-band tight-binding model is determined by three-material dependent parameters, , , and . By fitting the band structure in Fig 3(b) we set , and . Our DFT fits deliver parameters that differ from those obtained in Ref. changPRL2017, , subsequently used in Ref. SanchezMartinez:2019he, . Our current parameters result in a better agreement to the observed optical conductivity and circular photogalvanic effect data. Additionally, we rigidly shift the zero of energies of the tight-binding model by meV with respect to Ref. SanchezMartinez:2019he, to facilitate comparison with the DFT calculation. As described in Ref. flickerPRB2018, we additionally incorporate the orbital embedding in this model, which takes into account the position of the atoms in the unit cell. It amounts to a unitary transformation of the Hamiltonian which depends on the atomic coordinates through a material dependent parameter , where for RhSi flickerPRB2018 ; SanchezMartinez:2019he .
Details of the optical conductivity calculations
Since RhSi crystallizes in a cubic lattice it is sufficient to calculate one component of the real part of the longitudinal optical conductivity, , given by the expression Sipe93
| (4) |
defined for a system of volume described by a Hamiltonian with eigenvalues and eigenvectors and , respectively, and a velocity matrix element . The chemical potential and temperature enter through the difference in Fermi functions , and we define . We have replaced the sharp Dirac delta function that governs the allowed transitions by a Lorentzian distribution to phenomenologically incorporate disorder with a constant hot-carrier scattering time .
The DFT calculations of the optical conductivity are also performed via Eq. (4), with the ab-initio tight binding Hamiltonian constructed from DFT calculations. We use a dense momentum grid for the small broadening factor meV, and a momentum grid for broadenings meV.
Details of the CPGE calculations For our ab-initio CPGE calculations we projected the ab-initio DFT Bloch wave function into atomic-orbital-like Wannier functions first_wannier . To ensure the accuracy of the Wannier projection, we have included the outermost , , and orbitals for transition metals (, , and orbitals for Rh) and the outermost and orbitals for main-group elements. Based on the highly symmetric Wannier functions, we constructed an effective tight-binding model Hamiltonian and calculated the CPGE evaluating Sipe93 ; deJuan:2020jm
| (5) |
using a dense momentum grid. Here , and is the interband transition matrix element or off-diagonal Berry connection. As for the optical conductivity, the chemical potential and temperature are considered via the Fermi-Dirac distribution , and the Lorentzian function accounts for a finite hot-carrier scattering time.
Data and materials availability: All data needed to evaluate the conclusions are present in the paper. Additional data related to this paper could be requested from the authors.
Acknowledgements
We thank G. Chang and Z. Fang for helpful discussions. Z.N. and L.W. are supported by Army Research Office under Grant W911NF1910342. J.W.F.V. is supported by a seed grant from NSF MRSEC at Penn under the Grant DMR-1720530. B.X. and C.B. were supported by the Schweizerische Nationalfonds (SNF) by Grant No. 200020-172611. M. A. S. M acknowledges support from the European Union’s Horizon 2020 research and innovation programme under the Marie-Sklodowska-Curie grant agreement No. 754303 and the GreQuE Cofund programme. A. G. G. is supported by the ANR under the grant ANR-18-CE30-0001-01 (TOPODRIVE) and the European Union Horizon 2020 research and innovation programme under grant agreement No. 829044 (SCHINES). F. J. acknowledges funding from the Spanish MCI/AEI through grant No. PGC2018-101988-B-C21. Y.Z. is currently supported by the the DOE Office of Basic Energy Sciences under Award desc0018945 to Liang Fu. Y.Z., K.M. and C.F. acknowledge financial support from the European Research Council (ERC) Advanced Grant No.742068 “TOP-MAT” and Deutsche Forschungsgemeinschaft (Project-ID 258499086 and FE 63330-1). This research was supported in part by the National Science Foundation under Grant No. NSF PHY11-25915. The DFT calculations were carried out on the Draco cluster of MPCDF, Max Planck society.
Author Contribution: L.W. conceived the project and coordinated the experiments and theory. Z.N. performed the THz emission experiments and analyzed the data with L.W.. B.X. and C.B. performed the optical conductivity measurement, and analyzed the data together with L.W. J.W.F.V. fitted the DFT band structure. M.A.S.M and A.G.G. performed the tight-binding calculation. Y.Z. performed the DFT calculation. K.M and C.F. grew the crystals. L.W., A.G.G. and F.J. interpreted the data jointly with the calculations. L.W. and A.G.G. wrote the manuscript with inputs from B.X., Y.Z. and N.Z.. All authors edited the manuscript.
Z.N. and B.X. contributed equally to this project.
Competing interests: The authors declare that they have no competing interests.
References
- (1) Murakami, S. Phase transition between the quantum spin Hall and insulator phases in 3D: emergence of a topological gapless phase. New J. Phys. 9, 356 (2007).
- (2) Wan, X., Turner, A. M., Vishwanath, A. & Savrasov, S. Y. Topological semimetal and Fermi-arc surface states in the electronic structure of pyrochlore iridates. Phys. Rev. B 83, 205101 (2011).
- (3) Burkov, A. & Balents, L. Weyl semimetal in a topological insulator multilayer. Phys. Rev. Lett. 107, 127205 (2011).
- (4) Armitage, N., Mele, E. & Vishwanath, A. Weyl and Dirac semimetals in three-dimensional solids. Rev. Mod. Phys 90, 015001 (2018).
- (5) Wang, Z. et al. Dirac semimetal and topological phase transitions in A3Bi (A= Na, K, Rb). Phys. Rev. B 85, 195320 (2012).
- (6) Wang, Z., Weng, H., Wu, Q., Dai, X. & Fang, Z. Three-dimensional Dirac semimetal and quantum transport in Cd3As2. Phys. Rev. B 88, 125427 (2013).
- (7) Liu, Z. et al. Discovery of a three-dimensional topological Dirac semimetal, Na3Bi. Science 343, 864–867 (2014).
- (8) Neupane, M. et al. Observation of a three-dimensional topological Dirac semimetal phase in high-mobility Cd3As2. Nat. Commun. 5, 3786 (2014).
- (9) Liu, Z. et al. A stable three-dimensional topological Dirac semimetal Cd3As2. Nat. Mater. 13, 677–681 (2014).
- (10) Weng, H., Fang, C., Fang, Z., Bernevig, B. A. & Dai, X. Weyl semimetal phase in noncentrosymmetric transition-metal monophosphides. Phys. Rev. X 5, 011029 (2015).
- (11) Huang, S.-M. et al. A Weyl Fermion semimetal with surface Fermi arcs in the transition metal monopnictide TaAs class. Nat. Commun. 6 (2015).
- (12) Xu, S.-Y. et al. Discovery of a Weyl fermion semimetal and topological Fermi arcs. Science 349, 613–617 (2015).
- (13) Lv, B. et al. Experimental discovery of Weyl semimetal TaAs. Phys. Rev. X 5, 031013 (2015).
- (14) Lv, B. et al. Observation of Weyl nodes in TaAs. Nat. Phys. 11, 724–727 (2015).
- (15) Xu, S.-Y. et al. Discovery of a Weyl fermion state with Fermi arcs in niobium arsenide. Nat. Phys. 11, 748–754 (2015).
- (16) Yang, L. et al. Weyl semimetal phase in the non-centrosymmetric compound TaAs. Nat. Phys. 11, 728–732 (2015).
- (17) Xu, N. et al. Observation of Weyl nodes and Fermi arcs in tantalum phosphide. Nat. Commun. 7, 11006 (2016).
- (18) Wu, L. et al. Giant anisotropic nonlinear optical response in transition metal monopnictide Weyl semimetals. Nat. Phys. 13, 350–355 (2017).
- (19) Patankar, S. et al. Resonance-enhanced optical nonlinearity in the Weyl semimetal TaAs. Phys. Rev. B 98, 165113 (2018).
- (20) Ma, Q. et al. Direct optical detection of Weyl fermion chirality in a topological semimetal. Nat. Phys. 13, 842-847 (2017).
- (21) Sun, K. et al. Circular photogalvanic effect in the Weyl semimetal TaAs. Chin. Phys. Lett. 34, 117203 (2017).
- (22) Osterhoudt, G. B. et al. Colossal mid-infrared bulk photovoltaic effect in a type-I Weyl semimetal. Nat. Mater. 18, 471–475 (2019).
- (23) Sirica, N. et al. Tracking ultrafast photocurrents in the Weyl semimetal TaAs using THz emission spectroscopy. Phys. Rev. Lett. 122, 197401 (2019).
- (24) Gao, Y. et al. Chiral terahertz wave emission from the Weyl semimetal TaAs. Nat. Commun. 11, 720 (2020).
- (25) Zhang, Y. et al. Photogalvanic effect in Weyl semimetals from first principles. Phys. Rev. B 97, 241118 (2018).
- (26) Soluyanov, A. A. et al. Type-II Weyl semimetals. Nature 527, 495–498 (2015).
- (27) Wang, Z. et al. MoTe2: a type-II Weyl topological metal. Phys. Rev. Lett. 117, 056805 (2016).
- (28) Chang, T.-R. et al. Prediction of an arc-tunable Weyl Fermion metallic state in MoxW1-xTe2. Nat. Commun. 7, 10639 (2016).
- (29) Huang, L. et al. Spectroscopic evidence for a type II Weyl semimetallic state in MoTe2. Nat. Mater. 15, 1155–1160 (2016).
- (30) Belopolski, I. et al. Discovery of a new type of topological Weyl fermion semimetal state in MoxW1-xTe2. Nat. Commun. 7, 13643 (2016).
- (31) Deng, K. et al. Experimental observation of topological Fermi arcs in type-II Weyl semimetal MoTe2. Nat. Phys. 12, 1105–1100 (2016).
- (32) Jiang, J. et al. Signature of type-II Weyl semimetal phase in MoTe2. Nat. Commun. 8, 13973 (2017).
- (33) Yang, X., Burch, K. & Ran, Y. Divergent bulk photovoltaic effect in Weyl semimetals. Preprint at https://arxiv.org/abs/1712.09363 (2017).
- (34) Lim, S., Rajamathi, C. R., Süß, V., Felser, C. & Kapitulnik, A. Temperature-induced inversion of the spin-photogalvanic effect in WTe2 and MoTe2. Phys. Rev. B 98, 121301 (2018).
- (35) Ji, Z. et al. Spatially dispersive circular photogalvanic effect in a Weyl semimetal. Nat. Mater. 18, 955–962 (2019).
- (36) Ma, J. et al. Nonlinear photoresponse of type-II Weyl semimetals. Nat. Mater. 18, 476–481 (2019).
- (37) Wang, Q. et al. Robust edge photocurrent response on layered type II Weyl semimetal WTe2. Nat. Commun. 10, 5736 (2019).
- (38) Mañes, J. L. Existence of bulk chiral fermions and crystal symmetry. Phys. Rev. B 85, 155118 (2012).
- (39) Wieder, B. J., Kim, Y., Rappe, A. & Kane, C. Double Dirac semimetals in three dimensions. Phys. Rev. Lett. 116, 186402 (2016).
- (40) Bradlyn, B. et al. Beyond Dirac and Weyl fermions: Unconventional quasiparticles in conventional crystals. Science 353, aaf5037 (2016).
- (41) Chang, G. et al. Topological quantum properties of chiral crystals. Nat. Mater. 17, 978–985 (2018).
- (42) de Juan, F., Grushin, A. G., Morimoto, T. & Moore, J. E. Quantized circular photogalvanic effect in Weyl semimetals. Nat. Commun. 8, 15995 (2017).
- (43) Huang, S.-M. et al. New type of Weyl semimetal with quadratic double Weyl fermions. Proc. Natl. Acad. Sci. U.S.A. 113, 1180–1185 (2016).
- (44) Chang, G. et al. Unconventional chiral fermions and large topological Fermi arcs in RhSi. Phys. Rev. Lett. 119, 206401 (2017).
- (45) Tang, P., Zhou, Q. & Zhang, S.-C. Multiple types of topological fermions in transition metal silicides. Phys. Rev. Lett. 119, 206402 (2017).
- (46) Sanchez, D. S. et al. Topological chiral crystals with helicoid-arc quantum states. Nature 567, 500–505 (2019).
- (47) Rao, Z. et al. Observation of unconventional chiral fermions with long Fermi arcs in CoSi. Nature 567, 496–499 (2019).
- (48) Takane, D. et al. Observation of chiral fermions with a large topological charge and associated Fermi-arc surface states in CoSi. Phys. Rev. Lett. 122, 076402 (2019).
- (49) Flicker, F. et al. Chiral optical response of multifold fermions. Phys. Rev. B 98, 155145 (2018).
- (50) de Juan, F. et al. Difference frequency generation in topological semimetals. Phys. Rev. Research 2, 012017 (2020).
- (51) Rees, D. et al. Helicity-dependent photocurrents in the chiral Weyl semimetal RhSi. Sci. Adv 6, eaba0509 (2020).
- (52) König, E. J., Xie, H.-Y., Pesin, D. A. & Levchenko, A. Photogalvanic effect in Weyl semimetals. Phys. Rev. B 96, 075123 (2017).
- (53) Maulana, L. et al. Optical conductivity of multifold fermions: The case of RhSi. Phys. Rev. Research 2, 023018 (2020).
- (54) Wu, D. et al. Optical investigations of the normal and superconducting states reveal two electronic subsystems in iron pnictides. Phys. Rev. B 81, 100512 (2010).
- (55) Dai, Y. M. et al. Hidden -Linear Scattering Rate in Revealed by Optical Spectroscopy. Phys. Rev. Lett. 111, 117001 (2013).
- (56) Xu, B. et al. Band-selective clean-limit and dirty-limit superconductivity with nodeless gaps in the bilayer iron-based superconductor . Phys. Rev. B 99, 125119 (2019).
- (57) Sánchez-Martínez, M.-Á., de Juan, F. & Grushin, A. G. Linear optical conductivity of chiral multifold fermions. Phys. Rev. B 99, 155145 (2019).
- (58) Xu, B. et al. Optical signatures of multifold fermions in the chiral topological semimetal CoSi. Proc. Natl. Acad. Sci. U.S.A. https://doi.org/10.1073/pnas.2010752117 (2020).
- (59) Chang, G. et al. Unconventional photocurrents from surface Fermi arcs in topological chiral semimetals. Phys. Rev. Lett. 124, 166404 (2020).
- (60) Shan, J. & Heinz, T. F. Terahertz radiation from semiconductors. In Ultrafast Dynamical Processes in Semiconductors, 1–56 (Springer, 2004).
- (61) Sotome, M. et al. Spectral dynamics of shift current in ferroelectric semiconductor SbSI. Proc. Natl. Acad. Sci. U.S.A. 116, 1929–1933 (2019).
- (62) Hernández-Cabrera, A., Tejedor, C. & Meseguer, F. Linear electro-optic effects in zinc blende semiconductors. J. Appl. Phys 58, 4666–4669 (1985).
- (63) Boyd, R. W. Nonlinear optics (Academic press, 2003).
- (64) Ni, Z. et al. Giant topological longitudinal circuarly photogalvanic effect in the chiral multifold semimetal CoSi. Preprint at https://arxiv.org/abs/2006.09612 (2020).
- (65) Fei, R., Tan, L. Z. & Rappe, A. M. Shift-current bulk photovoltaic effect influenced by quasiparticle and exciton. Phys. Rev. B 101, 045104 (2020).
- (66) Rangel, T. et al. Large bulk photovoltaic effect and spontaneous polarization of single-layer monochalcogenides. Phys. Rev. Lett. 119, 067402 (2017).
- (67) Zhang, Y., de Juan, F., Grushin, A. G., Felser, C. & Sun, Y. Strong bulk photovoltaic effect in chiral crystals in the visible spectrum. Phys. Rev. B 100, 245206 (2019).
- (68) Koepernik, K. & Eschrig, H. Full-potential nonorthogonal local-orbital minimum-basis band-structure scheme. Phys. Rev. B 59, 1743 (1999).
- (69) Perdew, J. P., Burke, K. & Ernzerhof, M. Generalized gradient approximation made simple. Phys. Rev. Lett. 77, 3865 (1996).
- (70) Le, C., Zhang, Y., Felser, C. & Sun, Y. Ab initio study of quantized circular photogalvanic effect in chiral multifold semimetals. Phys. Rev. B 102, 121111 (2020).
- (71) Němec, P., Fiebig, M., Kampfrath, T. & Kimel, A. V. Antiferromagnetic opto-spintronics. Nat. Phys 14, 229–241 (2018).
- (72) Homes, C. C., Reedyk, M., Cradles, D. A. & Timusk, T. Technique for measuring the reflectance of irregular, submillimeter-sized samples. Appl. Opt. 32, 2976–2983 (1993).
- (73) Dressel, M. & Grüner, G. Electrodynamics of Solids (Cambridge University press, 2002).
- (74) Sipe, J. E. & Ghahramani, E. Nonlinear optical response of semiconductors in the independent-particle approximation. Phys. Rev. B 48, 11705–11722 (1993).
- (75) Yates, J. R., Wang, X., Vanderbilt, D. & Souza, I. Spectral and Fermi surface properties from Wannier interpolation. Phys. Rev. B 75, 195121 (2007).
- (76) Hosur P. Circular photogalvanic effect on topological insulator surfaces: Berry-curvature-dependent response. Phys. Rev. B 83, 035309 (2011).