Polarity-field driven conductivity in SrTiO3/LaAlO3: a hybrid functional study
Abstract
The origin of the 2-dimensional electron system (2DES) appearing at the (001) interface of band insulators and has been rationalized in the framework of a polar catastrophe scenario. This implies the existence of a critical thickness of polar overlayer () for the appearance of the 2DES: polar catastrophe for thick overlayer is avoided either through a Zener breakdown or a stabilization of donor defects at the surface, both providing electrons to dope the substrate. The observation of a critical thickness is observed in experiments, supporting these hypotheses. Yet, there remains an open debate about which of these possible mechanisms actually occurs first. Using hybrid functional Density Functional Theory, we re-examine these mechanisms at the same level of approximation. Particularly, we clarify the role of donor defects in these heterostructures, and argue that, under usual growth conditions, electric-field driven stabilization of oxygen vacancies and hydrogen adsorbates at the LAO surface occur at a smaller LAO thickness than required for Zener breakdown.
I Introduction
Functionalities offered by oxides compounds (TMOs), related to their electronic structures, sparked tremendous interest for technological applications. Moreover, further interests has been attracted by interfaces between TMO compounds, which exhibit emerging properties not present in either parent compounds at the bulk level. One of the most studied emerging property is 2-dimensional conductivity at interfaces between wide-gap insulator TMOs, which has been originally observed at the (001) interface between (LAO) and (STO). The origin of the observed conductivity is mainly attributed to a 2-dimensional electron system (2DES). In addition to conductivity, several other properties have been attributed to this 2DES, such as superconductivity, magnetism, confinement effects, etc Gariglio et al. (2009); Zubko et al. (2011); Hwang et al. (2012); Banerjee et al. (2013); Salluzzo et al. (2013); Chakhalian et al. (2014); Khomskii (2014); Gariglio et al. (2016). The appearance of the 2DES has been attributed to a polar discontinuity Ohtomo and Hwang (2004) between between STO and LAO. Hence, growing a LAO overlayer on top of a STO(001) substrate can trigger conductivity as long as the LAO film is thicker than 3 units cells (u.c.). This critical thickness is though to originate from to the presence of an electric field in the LAO layer: for a sufficiently thick overlayer, charge transfer occurs to avoid a divergence of the electrostatic potential.
In spite of considerable research, there remains a debate around the origin of the 2DES. The polarity-driven mechanism has been formulated either as a purely electronic reconstruction Ohtomo and Hwang (2004); Savoia et al. (2009) (or Zener breakdown), or as a polarity-driven stabilization of oxygen vacancies (or other donor defects) at the LAO surface Li et al. (2011); Bristowe et al. (2011); Yu and Zunger (2014), providing electrons which remain confined near the interface. Nevertheless, the existence of an electric field in the LAO layer remains debated, although some experiments support this Cancellieri et al. (2011); Reinle-Schmitt et al. (2012); Li et al. (2018). Other hypotheses include as-grown oxygen deficiency, off-stoichiometry, or surface adsorption Kim et al. (2014); Scheiderer et al. (2015); Brown et al. (2016); Zhang et al. (2018). It remains unclear how these mechanisms coexist or dominate.
In this study we re-examine, using a combination of first-principles calculations and phenomenological models, the electric-field driven mechanisms at the origin of the 2DES. The different models are analyzed in turn and explored through hybrid functional DFT calculations. We then compare them and rationalize experimental findings obtained from STO/LAO heterostructures. A specific focus is given to the surface redox model, and we discuss how the tunability of the crystal thickness obtained by alloying the polar overlayer is rationalized within this model.
II Technical details
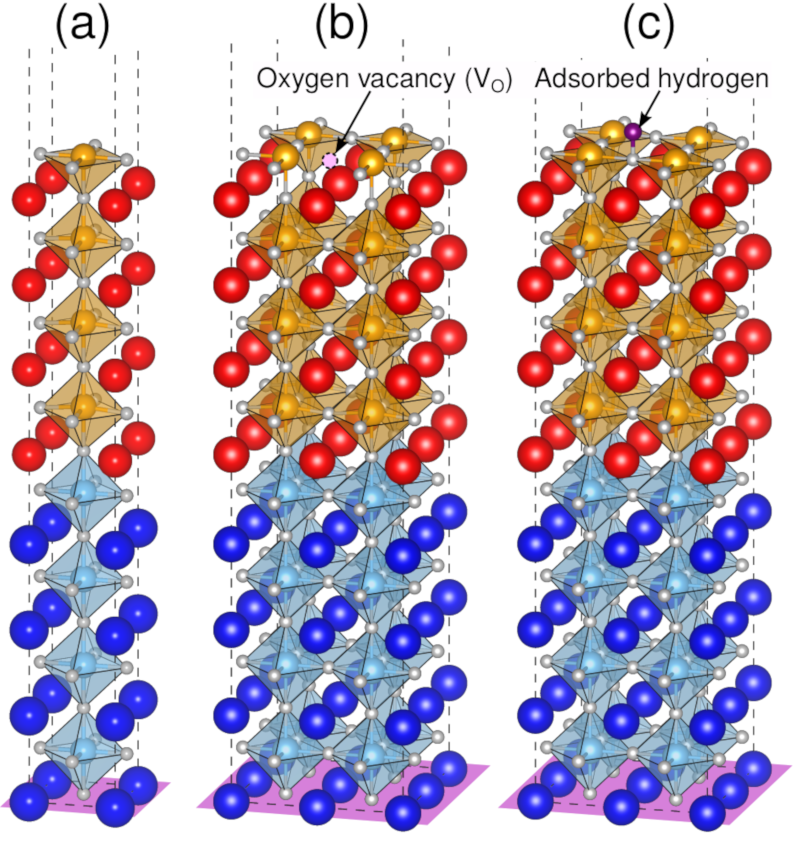
Before going further, we specify the technical details of our first-principles calculations. We use the CRYSTAL code (Dovesi et al., 2014a) to compute from DFT the atomic and electronic structure of bulk and systems, as well as heterostructures based on these compounds. Examples of simulation cell in slab geometry used in this study are shown in Fig. 1.
A Gaussian basis set was used to represent the electrons. All the electrons have been included for Ti Bredow et al. (2004), O Piskunov et al. (2004) and Al Towler , while we use a Hartree-Fock pseudopotential Piskunov et al. (2004) for Sr and the Stuttgart energy-consistent pseudopotential Cao and Dolg (2004) for La. The basis sets of Sr and O have been optimized for STO. In the basis set of La, the Gaussian exponents smaller than were disregarded and the remaining outermost polarization exponents for the , shells (0.5672, 0.2488), , shells (0.5279, 0.1967), and , , shells (2.0107, 0.9641, 0.3223), together with Al (0.1752) exponent from the 8-31G Al basis set, were optimized for LAO.
The exchange-correlation energy is modelled with the B1-WC hybrid functional Bilc et al. (2008), which have been used in several previous studies about STO, LAO and their interfaces Cancellieri et al. (2011); Delugas et al. (2011); Reinle-Schmitt et al. (2012); Cancellieri et al. (2014); Bilc et al. (2016); Li et al. (2018); Caputo et al. (2020). A Monkhorst-Pack mesh Monkhorst and Pack (1976) of special -points is used for cubic bulk LAO and STO, ensuring a proper convergence of the total energy below 1 meV per formula unit. The sampling is then refined into a mesh of special -points for the computation of properties such as the electronic density of states (DOS) or the vibrational modes at the point in the irreducible Brillouin Zone (IBZ).
Concerning the heterostructures, different sizes of simulation cells have been used, shown in Fig. 1.(b) and .(c), have been used in the study ( and supercells), with adapted Brillouin zone sampling with respect to supercell size. For the simulation cell (see Fig 1a) and the simulation cell (see Fig 1b) the Brillouin Zone sampling is adapted to a mesh and respectively. It is then refined to (respectively ) to compute the electronic band structure and related DOS. A smearing of the Fermi surface has been set to . The self-consistent DFT cycles are considered to be converged when the energy change between cycles are smaller than . The optimization of the atomic positions are performed with convergence criteria of in the root-mean square values of the energy gradients, and in the root-mean square values of the atomic displacements. The evaluation of the Coulomb and exchange series is determined by five parameters, fixed to their default Dovesi et al. (2014b) values: 7, 7, 7, 7 and 14.
We consider the effect of oxygen vacancies, acting as double donors according to the following surface redox reaction:
| (1) |
The technical details for the calculations of the systems with oxygen vacancies are similar to the ones used for the pristine slabs in term of basis sets, convergence threshold and investigated geometrical configurations for the heterostructures. Oxygen vacancies () have been modelled by removing explicitly an oxygen atom from its site (core and electrons), while leaving “ghost” oxygen basis functions on the site to properly model the electron density within the vacancy.
Formation energies are calculated in the -rich limit from the relation:
| (2) |
where and are the calculated total energy of the systems with and without (and same cell size), the number of in the supercell, and the calculated total energy of the single molecule in the triplet state.
Equation 2 only considers the enthalpic contribution at 0 K to the formation energies. To account for the atmosphere during growth at finite temperature and pressure, considering the environment as a reservoir, one has to consider the chemical potential of oxygen relative to the gaseous phase at finite oxygen partial pressure and temperature , such:
| (3) | |||||
| (4) |
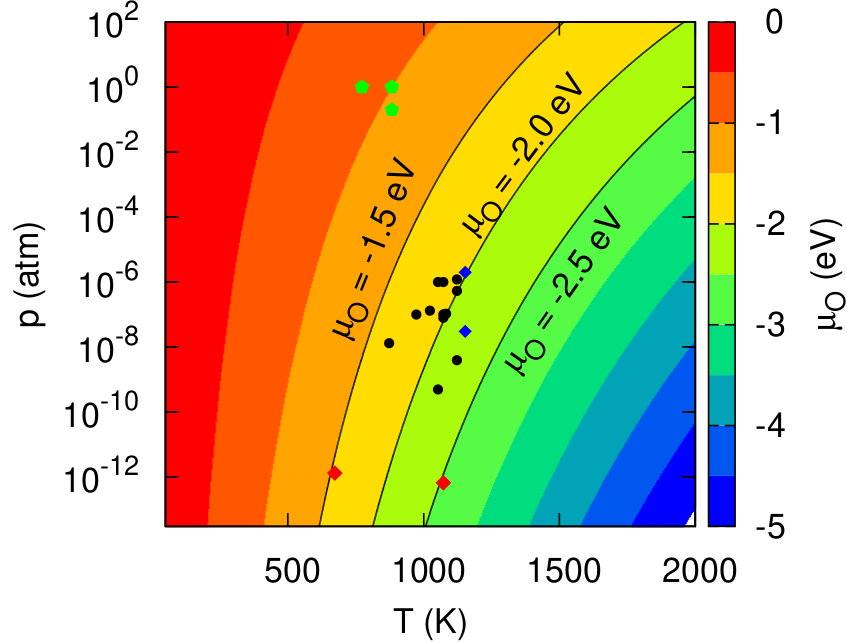
In the relation above, is calculated from the thermodynamic model Reuter and Scheffler (2001); Osorio-Guillén et al. (2006): the details of the calculation can be found in Appendix A. is usually considered as a parameter depending on the environment; for the purpose of this study, we consider according to the growth conditions of standard STO/LAO heterostructures (identical to the value used in Reference Yu and Zunger, 2014) and consider variations due to growth according to the thermodynamical model (Appendix A).
Finally, we also consider the surface redox hydroxylation process, where H atoms are adsorbed at the LAO surface. The chemical reaction of this process is written as:
| (5) |
This process provides 1 donor electron per hydroxyl (in contrast to the non-redox hydroxylation process, , which does not provide any carriers). Hence, the adsorption energy of hydrogen according to the process of Eqn. (5) is calculated from DFT, in the supercell approach, as:
| (6) | |||||
where is the number of adsorbed H atoms in the cell, the total energy of the heterostructure with the adsorbed H atoms, the total energy of a water molecule, and the chemical potential of water in gaseous form, calculated from the thermodynamic model. All the other quantities in Eqn. 6 are the same as defined earlier.
III Results
We will now provide a description of the electric-field driven hypotheses at the origin of the 2DES at the (001) STO/LAO interface, the Zener breakdown and the surface oxygen vacancies. The mechanisms can be explained in the framework of a polar catastrophe, where the diverging electrostatic potential in the LAO film is the driving force behind the instability leading to the appearance of the 2DES. The main argument in favor of these mechanisms is the existence of threshold LAO thicknesses to witness different phenomena, such as signatures of valence at the interface from spectroscopy, or the change in sheet resistance. Indeed, as will be argued in the following discussion, the intricacies of the different mechanisms result in differences in properties.
The parameters of each model are evaluated through hybrid functional DFT, using the B1-WC hybrid functional. This functional predicts good properties for bulk STO and LAO, and has been used extensively to study the STO/LAO interface. As an example, we mention the electronic band gap of cubic STO and rhombohedral LAO as calculated from B1-WC: and , showing good agreement with experiments ( Van Benthem et al. (2001) and Lim et al. (2002) respectively). In addition, the B1-WC hybrid functional predicts with good accuracy the dielectric constant of LAO, which is an important parameter in all explored models: for cubic LAO and for rhombohedral LAO.
III.1 Electric-field driven Zener breakdown
For the STO/LAO interface, it is a priori possible for the electrons to rearrange themselves to avoid a polar catastrophe, as the electrostatic potential diverges with increasing LAO thickness. This is the so-called Zener breakdown scenario, and does not involve any atomic reconstruction, since only the electronic population changes. In this Section, we will focus on the Zener breakdown hypothesis and its description from first-principles calculations based on the hybrid functional formalism, with the B1-WC hybrid functional. This will benchmark our results based from the different hypotheses.
The Zener breakdown stems from the electrostatic behavior of the STO/LAO interface and can be formulated in terms of the conservation of the normal component of the displacement field across the interface Stengel and Vanderbilt (2009). In the (001) direction, the LAO layers can be considered as a serie of capacitors with and , corresponding to surface charge , where is the electron charge and is the in-plane unit cell area (). Hence, considering the polarity of each LAO monolayer, the LAO film has a formal polarization of . As the STO atomic planes are neutral, there is no formal polarization in the STO substrate. The formal polarizations of STO and LAO are therefore:
| (7) | |||||
| (8) |
The transverse component of the displacement field, in each environment (STO, LAO, vacuum) is then:
| (9) | |||||
| (10) | |||||
| (11) |
In the absence of free charges, which is the case for band insulators, the normal component of the displacement field has to be preserved Vanderbilt and King-Smith (1993). Hence, the vacuum fixes across the whole heterostructure, and an electric field appears in the LAO overlayer, such that:
| (12) | |||||
| (13) |
Since is an insulator, the material will polarize under the effect of an electric field, leading to a depolarizing field and surface induced bound charges . The polarization induced in LAO is therefore screened by the depolarizing field by inducing a dielectric contribution opposite the the formal polarization. This screening depends on the dielectric constant ().
The resulting electric field and surface charge are given by:
| (14) | |||||
| (15) | |||||
| (16) |
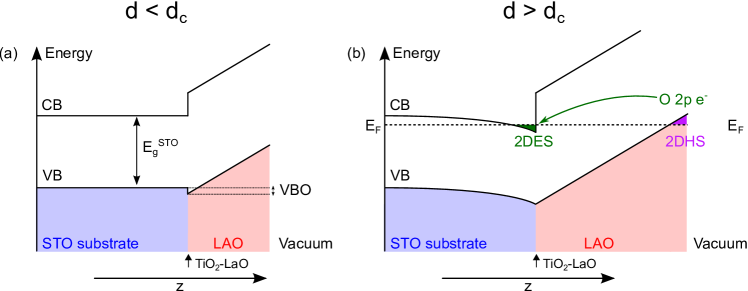
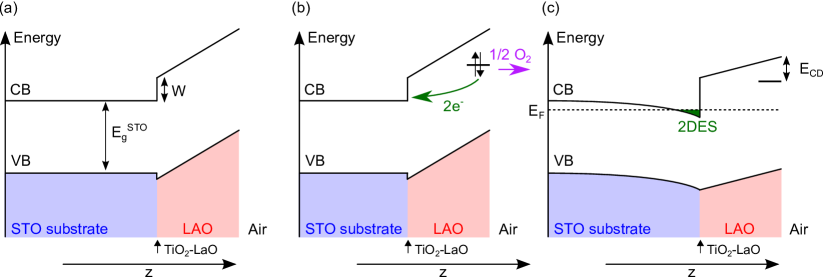
Within this model, the built-in electric field is estimated to be equal to . Consequently, the electrostatic potential increases linearly with LAO thickness, by about per monolayer ( being the out-of-plane lattice parameter of LAO). This effect can also be viewed in a band diagram, where the valence states of LAO are raised to higher energy with the electrostatic potential, as shown in Fig. 2.(a). For a LAO thickness above a threshold value , the valence states at the surface of LAO are raised above the STO conduction band minimum, and a charge transfer occurs from the to the states of STO: a 2DES appears at the interface, as shown in Fig. 2.(b); as a by-product of the charge transfer, a 2-dimensional hole system (2DHS) is expected to exist at the surface of LAO according to the Zener breakdown picture. Further insights on the electronic reconstruction and reformulation of the model can be found in Ref. Bristowe et al., 2014.
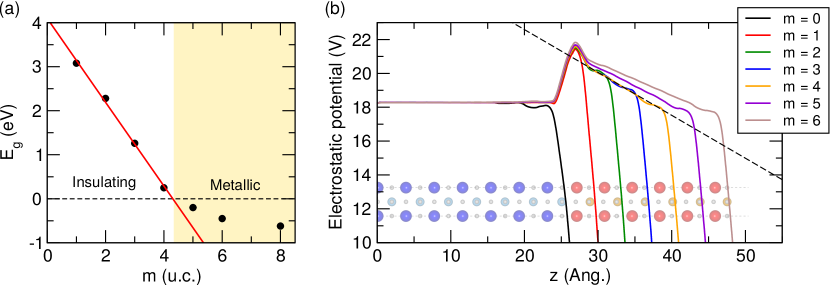
First-principles calculations have been performed on pristine heterostructures. Fig. 3.(a) shows the evolution of the heterostructure electronic band gap with respect to the number of LAO monolayers , and in Fig. 3.(b) the profile of the macroscopic average of the electrostatic potential across the heterostructures. From these results, we make the following observations: i) the electrostatic potential in the STO is flat, as expected from our earlier considerations; ii) the electrostatic potential varies linearly with increasing LAO thickness, the slope is estimated to be for , and this results in the linear decrease of the band gap with increasing LAO thickness, with a slope of . This is in agreement with the value calculated for a LAO cell with a tetragonal constraint (): , in between the value calculated for cubic and rhombohedral LAO (respectively 27 and 21); iii) the field in LAO is expected to raise the valence states in the LAO system, which is shown in the layer-resolved DOS for the different heterostructures (Fig. 4); and iv) for , the system is metallic, and for the metallic phases, the slope of the electrostatic potential decreases with increasing LAO thickness. A metal-insulator transition (MIT) is expected to occur at based on the linear projection of the evolution of the band gap below the onset for charge transfer. This is the critical thickness of LAO at which an electronic reconstruction occurs (also referred to as a Zener breakdown in the literature). It is also the onset above which the LAO valence states overlap with the conduction states of the STO substrate in the DOS:
| (17) |
The Zener breakdown occurs when the drop of electrostatic potential across the LAO film is equal to the sum of the band gap of STO, , and the valence band offset VBO, as shown in Fig. 2.(a). Hence, it is possible to calculate from the Zener breakdown model, by estimating the thickness needed to reach a potential drop equal to if the slope of the potential is a constant field :
| (18) |
which predicts the same value as in Equation 17 by taking the following values, calculated from DFT on the bulk compounds, , and . The critical thickness depends on different physical parameters: the electronic band gap of STO, the valence band offset, the dielectric constant of LAO and the LAO formal charges, which are all intrinsic parameters to the system. Our first-principles calculations predicts between 4 and 5 monolayers of LAO. This is an overestimation if we compare to the experiments, for which the onset for conductivity is between 3 and 4 u.c. Berner et al. (2010, 2013).
This overestimation may be attributed to the overestimation of the band gap: all things being equal, correcting the value of the band gap by the experimental one (3.25 eV Van Benthem et al. (2001)), the critical thickness becomes , in better agreement with the experiments. We must stress that, as the parameters of the model are sensitive to the methodology (specifically the approximation for the exchange-correlation energy), then the critical thickness as determined from DFT is also sensitive: LDA and GGA severely underestimate the STO band gap, hence the predicted critical thickness reported from DFT studies based on these functionals is slightly underestimated compared to the 4 u.c. value (for example, 3 u.c. in Ref. Son et al., 2009). Correction to the band gap error using an on-site Hubbard-like correction Lee and Demkov (2008) eventually fixes this. Another solution to the shortcomings of LDA/GGA consists of using hybrid functional for the exchange-correlation term, such as the one used in this study (B1-WC). Another example, HSE Yu and Zunger (2014) yields band gap of 3 eV and a similar critical thickness as the one determined in this study, 4.3 u.c.
Above the critical thickness, each additional LAO layer have their valence electrons at higher energies than the bottom of the conduction band of STO. These electrons are therefore transferred from the surface to the interface. This transfer pins the valence band edge of the LAO system to the conduction band minimum of STO, which implies that the field in LAO is modified by the charge transfer, according to the following law:
| (19) |
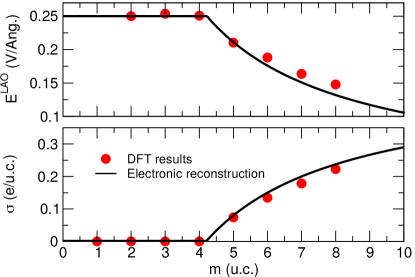
Assuming that is constant, the field in LAO decreases as as the LAO thickness increases. Additionally, the electron transfer leads to the appearance of a 2DES system in the STO subsystem as shown in Fig. 2, with a sheet charge density Son et al. (2009) as calculated from Equations (19), (18) and (15).
| (20) |
The sheet carrier density depends on the dielectric constant of LAO, the thickness of the LAO overlayer and the band gap of STO. In the limit of an infinitely thick LAO overlayer, converges to . The evolution of the built-in field and the sheet carrier density with respect to LAO thickness are given in Fig. 5, as computed from first-principles and with the model based on the parameters , and . The overall agreement between the model and the DFT result is satisfying.
The main features of the Zener breakdown model can be summarized as follows: i) below a LAO critical thickness , the interface is insulating, with the presence of a built-in field in LAO. The electrostatic potential drop across the LAO layer linearly evolves with the thickness of LAO; ii) at a critical thickness , the surface valence states reach the energy of the unoccupied states of the STO substrate, raised by the electrostatic potential: a Zener breakdown occurs, and the charges are transferred from the surface to the interface; iii) above the critical thickness , the valence band edge of LAO is pinned to the bottom of the conduction band of STO by the charge transfer, and the band gap remains closed. This leads to the presence of a 2DES in STO, confined close to the interface, and the presence of holes at the - surface of LAO.
The predictions of the model are in good agreement with first-principles results. Moreover, there is a large array of experimental results supporting the Zener breakdown hypothesis. Notably, the critical thickness has been consistently determined to be by several groups and methods, for films grown either from PLD Thiel et al. (2006) or MBE Segal et al. (2009) at high , with the contribution of to the conductivity removed by annealing.
Additionally, the sheet carrier density ( measured at low LAO thicknesses ) is in good agreement with the densities estimated from HAXPES Sing et al. (2009) and RIXS Berner et al. (2010) experiments at the same thicknesses. However, at higher LAO thicknesses, the measured carrier densities do not increase, in contrast with the predictions of the Zener breakdown model. There are other experimental evidences against this scenario. There has been mention of sizeable density of -like states measured below the critical thickness (as early as 2 u.c. of LAO), with core-level spectroscopic measurements suggesting that the breakdown occurs almost immediately Sing et al. (2009); Berner et al. (2010); Takizawa et al. (2011); however, as these charges remain trapped and do not contribute to interface conductivity, they may not originate from a polar catastrophe, and it is possible that they originate from oxygen vacancies buried in the STO substrate. In addition to the presence of sub-critical carriers, no mobile holes have been found at the LAO surface, and no hole states have been detected near the Fermi level Berner et al. (2013); Plumb et al. (2017). There have however been recent reports of the existence of a hole-sheet if the LAO is capped with STO, even at sub-critical LAO thicknesses Pentcheva et al. (2010); Huijben et al. (2012); Lee et al. (2018). In References Pentcheva et al., 2010 and Huijben et al., 2012 however, the holes are attributed to the states of the surface layer, whereas in Reference Lee et al., 2018, the LAO interlayer thickness is larger than the threshold thickness value and the authors attribute the 2DHS to stem from the states of the layer at the -type interface with the capping layer. Finally, there has been reports of suppressed conductivity at any LAO thickness for samples grown at very high ) Herranz et al. (2007); Kalabukhov et al. (2011).
The Zener breakdown scenario, and its simulation from first-principles is a consequence of considering pristine systems, without any defects which may alter the electric field in the LAO overlayer, its dielectric properties, etc. However, other compensation mechanisms may occur earlier than the Zener breakdown, which might explain some of the discrepancies between this simple, naive picture and the experiments.
III.2 Electric-field driven surface redox mechanism
Until now, we have discussed how the electronic structure of STO/LAO heterostructure behave if no atomic reconstruction/defects occurs during growth, assuming a pristine heterostructure. STO is sensitive to doping, and donor impurities have been suspected to be at the origin of the 2DES at its interface. In fact, it is well known that La impurities Okuda et al. (2001) and oxygen vacancies Muta et al. (2005) act as -type donors. The present Section focuses on the role of oxygen vacancies in such heterostructures.
Even if the STO substrate is insulating before the growth of the LAO epitaxy, it could be expected that the growth process induces oxygen vacancies. In the original paper Ohtomo and Hwang (2004), it was already reported that the 2DES properties are affected by the growth conditions, in terms of mobility, sheet resistance and electron densities. Since then, there have been several studies focusing on the role of oxygen partial pressure () during growth, as well as the effect of annealing on the 2DES properties Basletic et al. (2008); Herranz et al. (2007); Kalabukhov et al. (2007); Siemons et al. (2007). Three regimes have been identified: low (10), high (10) and very high (10). For samples grown at low as in Reference Ohtomo and Hwang, 2004, the sheet carrier densities are in the range , with mobilies around and sheet resistance around . For high , the carrier density is significantly reduced to , in better agreement with the polar catastrophe (at least, for low LAO thicknesses), and with the resistance increasing by a few orders of magnitude. Samples grown at low have carrier densities around if annealed after growth, suggesting that the carriers found in the unannealed low samples originates from vacancies. Finally, samples grown or annealed at high remain insulating.
These results question the validity of the Zener breakdown scenario, which cannot explain by itself the dependence of the transport properties. Moreover, they imply that the growth process triggers the conductivity, by inducing oxygen vacancies within the substrate of the STO. Growth at low induces a 3D-like conductivity in samples Huijben et al. (2006), which indicates that this might be the case. However, annealing processes suppress the 3D-like conductivity. Furthermore, the existence of a systematic critical thickness cannot be easily rationalized within such a scenario. It has been proposed that the origin of the carriers are not the vacancies in the STO substrate, but the vacancies that exists at the surface of the LAO films Li et al. (2011); Bristowe et al. (2011, 2014); Yu and Zunger (2014).
Theoretical studies based on DFT Li et al. (2011); Bristowe et al. (2011); Yu and Zunger (2014) have considered the possibility of intrinsic doping from polarity induced oxygen vacancies at the LAO surface. They highlight the possibility of an electric-field driven stabilization of vacancies at the LAO surface, which reconcile the existence of a threshold thickness as well as the sensitivity to conditions of growth. This process is different than as-grown creation of oxygen vacancies at the STO surface or in the LAO overlayer. In a sense, this scenario can still be considered as a polar catastrophe, even though the mechanisms behind the charge transfer differ from the Zener breakdown model. The first DFT studies Li et al. (2011); Bristowe et al. (2011) exploring this hypothesis were performed in the GGA, which is known to underestimate band gaps and to predict spuriously the properties of defects Freysoldt et al. (2014). The last study Yu and Zunger (2014) are based on a partial implementation of Hartree-Fock exchange (at fixed geometry, after relaxation using semi-local functionals), and goes beyond oxygen vacancies, considering other intrinsic defects. However, the study is limited to a single defects planar density, which can be expected to be far from the thermodynamical equilibrium, as argued in Refs. Bristowe et al., 2011, 2014. The present study reconsiders these theoretical developments: on one hand, in the calculations performed for this study, we fully relax the structures within the hybrid functional formalism, and we consider different densities of defects, at the limit of our computational capacity.
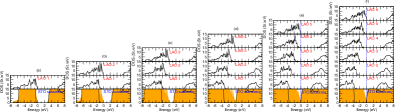
We first investigated the effect of oxygen vacancies considering a uniform distribution of oxygen vacancies at different positions in an otherwise pristine STO/LAOm/vacuum heterostructure with a -type interface, modelled through a symmetric slab as shown in Fig. 1. For a supercell containing one , the area density is equal to . We first analyze the electronic structure of the defective system /vacuum with oxygen vacancies (). Without any vacancies, this heterostructure is still predicted insulating within our formalism, just below the onset for Zener breakdown. It is therefore the ideal system to study different cases, based on the position of the vacancies. The layer-resolved DOS of such defective systems are given in Figs. 6.(a-d), for vacancies located (a) in the layer at the interface; (b) in the middle of the LAO overlayer; (c) in the layer at the surface; (d) in the layer at the interface and in the layer at the surface.
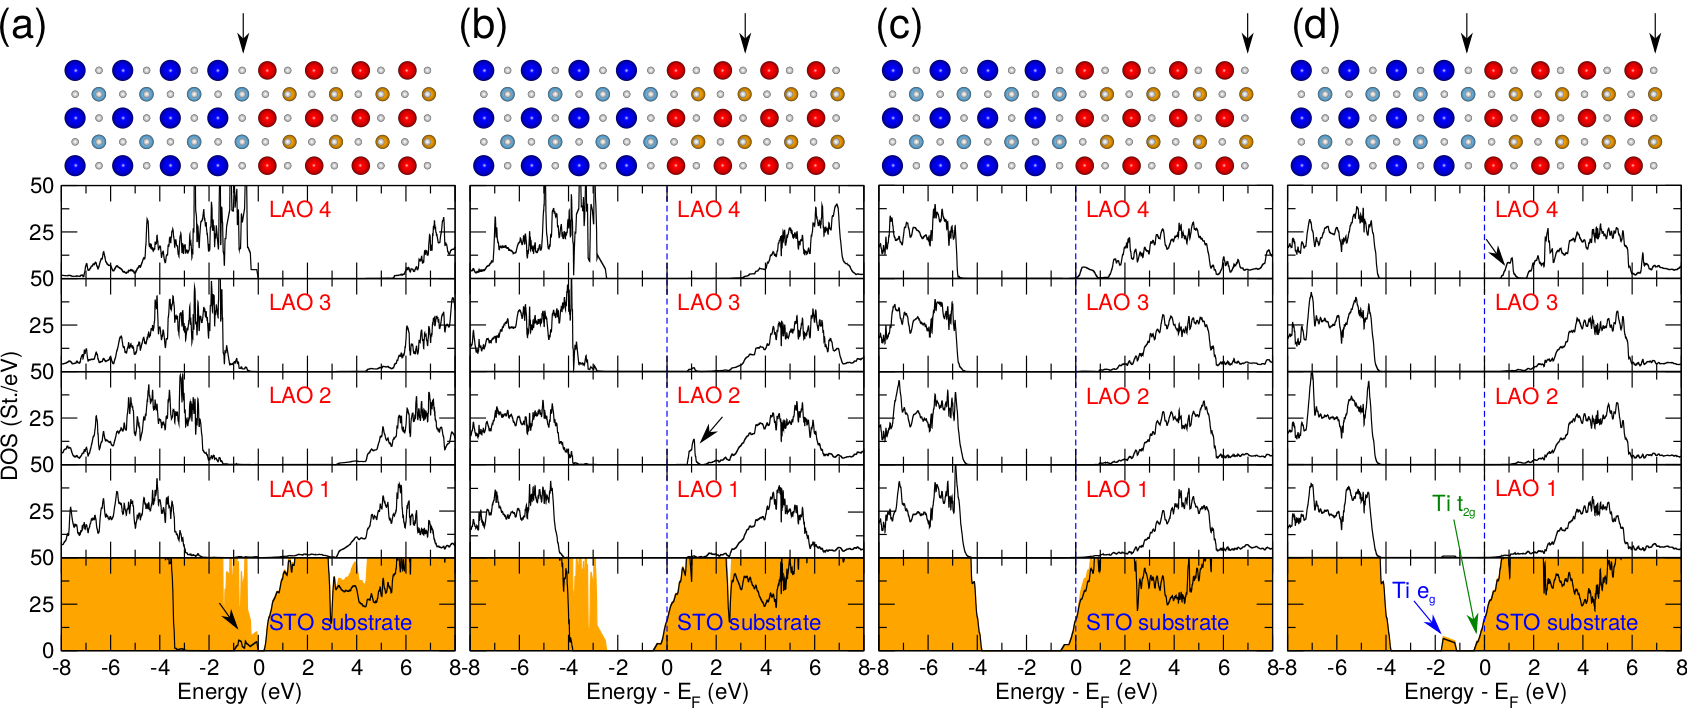
It follows, based on these results: (i) oxygen vacancies in the layer at the interface are characterized by in-gap states slightly below the conduction band (up to 1 ), with a main character, which does not compensate the field in LAO as the donor electrons remain within the STO system; (ii) if the oxygen vacancies are within the LAO layer, the defect in-gap states (shown with black arrows in Fig. 6) are always empty: they are always above the STO conduction band (1 eV), hence the electrons will always be transferred to the interface for any ; (iii) if the vacancies are at the LAO surface, the field is compensated over the whole LAO film. For vacancies buried within the LAO, the field will only be compensated between the interface the the LAO plane containing the vacancy; (iv) as the defect states are empty if the vacancies are in the LAO layer, the act as double donor. For , the carriers released by vacancies at the LAO surface completely compensate the field in LAO, the electrostatic potential is completely flat.
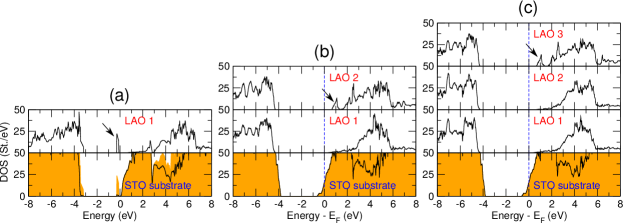
The case where the vacancies are at the LAO surface is the most interesting case, since the carriers are transferred to the interface and they contribute the most to the screening of the built-in field. Figs. 7.(a-c) show the layer-resolved DOS for heterostructures with oxygen vacancies at the surface. For , the donor state is occupied, and below the conduction band of STO (hence, no charge transfer occur), for , the donor states are always above the conduction band, and charge transfer occurs. Hence, even in the absence of built-in field, it is always more favourable for the donor electrons to transfer to the interface rather than staying at the surface. More importantly, in contrast to the Zener breakdown scenario, oxygen vacancies at the LAO surface leave no mobile holes.
If we consider that each at the LAO surface provide 2 electrons to the -type interface, it is then interesting to know if the formation of these defects can be stabilized by the built-in electric field, and for which LAO thickness this stabilization occurs (it could occurs either before or after the threshold thickness for the Zener breakdown). The question has been addressed by Zhong et al. Zhong et al. (2010) and Bristowe et al. Bristowe et al. (2011, 2014), who build a generic model to understand the role of donor defects and how they may explain the experimental data where the Zener breakdown hypothesis fails. The model of Zhong et al. Zhong et al. (2010) is adapted for the superlattice geometry, whereas the one of Bristowe et al. Bristowe et al. (2011, 2014) account for heterostructures with a bare LAO surface, as in real samples. We therefore aim to exploit this model, where the parameters are set by our predictions from first-principles, and to compare the results with the polar catastrophe expectations. The model is shown as a schematic representation in Fig. 8, and is valid as long as the defect state is above the conduction band of STO (for ).
The model consider the following: the formation energy of a single at the surface of the film, , in the presence of an area density of surface , can be expressed as:
| (21) |
where is the energy cost of creating 1 at the surface of LAO (in the absence of electric field), is the energy associated with the electric field in the polar layer, and the last term is a mean-field - interaction (beyond electrostatics).
From Equation (21), we consider the surface excess energy , accounting for the built-in electric field and the presence of an area density of oxygen vacancies at the surface:
| (22) |
where the term accounts for the gain of electrostatic energy subsequent to the charge transfer. The term is a chemistry related term and depends on the energy cost of breaking bonds and on the overall chemical process. We also include within that term the electronic energy gain of the electron transfer from the defect state to the states of STO, which depends on the defect state binding energy and the conduction band offset :
| (23) |
where is the formation energy of one single at the surface of LAO, and are defined in Fig. 8, and is the number of carrier released by a single defect. The term takes the following analytical form:
| (24) |
This term is basically the energy gain of discharging a capacitor, and depends explicitly on the amount of transferred donor electrons per . The electron charge is . corresponds to the charge density at the interface required to cancel the built-in field: . The equilibrium density of is the one minimizing :
| (25) |
The stabilization of () occurs at a critical thickness :
| (26) |
Above this critical thickness , and for large values of , converges toward , toward a complete screening of the LAO electric field. In contrast to the Zener breakdown scenario, the critical thickness does not depend explicitly on the value of the band gap (Equation (17)), the band gap however can affect . The model can be compared to first-principles results by comparing the DFT formation energies and the model :
| (27) | |||||
which is the energy difference between the system with a given density of surface and the pristine system (), per surface , and is basically the quantity calculated from Equation (2). The parameters of the model are set in the following way: the chemical potential is set to (see Appendix A for details), similar to the value used in Refs. Bristowe et al., 2011; Yu and Zunger, 2014; for the - mean-field interaction, we do not find a significant difference in formation energy between oxygen vacancies at the surface of heterostructures at different densities , hence we set . Given that the donor state is always above the conduction band minimum (for ), we have . These parameters set, and are calculated through a fitting procedure of the model on DFT formation energies, yielding (slightly larger than the value of in Ref. Bristowe et al., 2011) and (slightly inferior to the value estimated from the Zener breakdown model). The comparison between the model and the DFT formation energies estimated from Equation 3 are given in Fig. 9.(a), showing that the model is in satisfying agreement with our calculations, despite the high density of in the simulation cell, as the heterostructures are modelled through and supercells ( and ).
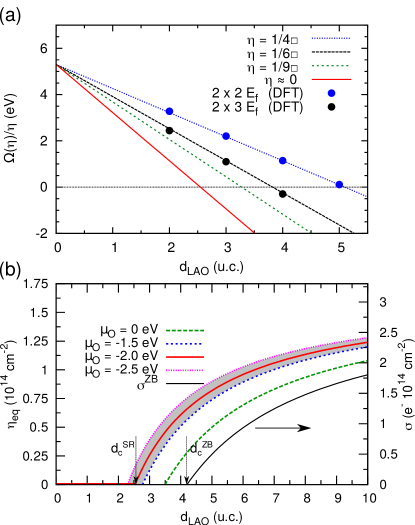
In the limit of low density, we predict that becomes negative as early as , which corresponds to the onset for stabilization of surface as shown in Fig. 9.(b). Accounting for the band gap error contribution to the term, . The equilibrium density of surface , , with respect to LAO thickness is given in Fig. 9.(b): we also consider a range of across to account for variations between the different growth conditions available in the literature, however this does not significantly alter the predicted threshold thickness. The effect of post-growth annealing is to shift toward 0 eV, hence we also consider this case in Fig. 9.(b): the threshold thickness is shifted to . In all cases, the model predicts the stabilization of surface below the critical thickness for Zener breakdown:
| (28) |
This means that the redox process is energetically more favourable than the creation of an electron-hole pair across the LAO film: this occurs when . Similarly to the Zener breakdown model, and for , the surface redox model predicts a thickness dependence for the carrier density at the interface above the threshold thickness, if all the charges released by surface contribute to transport.
These results also highlight an important point about computing defect formation energies in these heterostructures: the calculated values from DFT, using Eqn. (2), shows a large dependence on defect density and LAO thickness (Fig. 9.(a)). This apparent dependence is not an artefact: it results directly from the second term in Equation 22 (and possibly the third), which is implicitely accounted for in the DFT calculations due to the systematic charge transfer (Fig. 7). This has a significant implication: the defect densities simulated in previous studies Zhong et al. (2010); Li et al. (2011); Yu and Zunger (2014) (and this one as well), are actually far from equilibrium, as shown in Fig. 9, and one should remain cautious when analyzing the DFT results.
III.3 Electric-field driven surface protonation
Surface protonation is another process from which the interface may be doped: hydrogen atoms adsorbed at the LAO surface are known to modulate the charge density at the STO/LAO interfaces, as argued from experimental Kim et al. (2014); Scheiderer et al. (2015); Brown et al. (2016); Zhang et al. (2018) and theoretical work Adhikari et al. (2016); Piyanzina et al. (2019). To adapt the surface redox model to the specific case of hydrogen adsorbates resulting from water splitting (Eqn (5)), using the same Equations as in the previous section. Specifically, the term will be different () as it depends on the chemical process; the term is now equal to 1, as hydrogen adsorbates acts as single donors. Finally, the term must also be reconsidered to account for the interaction between adsorbates.
In this Section, we are mainly interested in surface protonation with ambient humidity as the source of the donor defects. We consider the water splitting process as given in Eqn. 5, where both gaseous dioxygen and water partial pressures ( and , respectively) are parameters accounted through their respective chemical potentials.
DFT calculations performed on supercells including 1 or 2 H adsorbates have been used to perform a fit of the model to the adsorption energies as calculated from DFT using Eqn. (6), in the same fashion as done in the previous Section for oxygen vacancies.
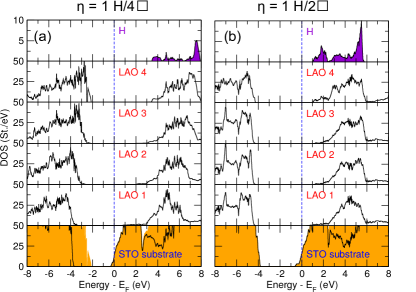
The layer-resolved DOS for STO/LAO4 with and are shown in Figs. 10. The DOS are similar overall to the ones with oxygen vacancies as surface defects (Figs. 6 and 7), with the absence of a well defined donor state near the Fermi level. Electrons are directly transfered to the interface, and leaves no mobile hole at the surface. For the case, there remains a non-zero electric field in the LAO overlayer.
The results are shown in Fig. 11, for and . The fit results in , and . Accounting for finite temperature and pressure, the term is modified as follows:
| (29) |
It is however difficult to determine the values of chemical potential for standard growth conditions of STO/LAO heterostructures, as is not usually provided in the literature. Nevertheless, using and as free parameters, it remains possible to predict the critical thickness for exothermic surface protonation from:
| (30) |
where . The critical thickness determined from Eqn. (30) is shown in Fig. 12 with respect to and .

Using the upper bound of chemical potentials, the lower bound of LAO critical thickness is determined to be . This is in agreement with the experiments of Scheiderer et al. Scheiderer et al. (2015), who managed to induce a metallic sheet conductance for an otherwise insulating STO/LAO3 heterostructure through exposition to water vapor. For typical growth conditions of STO/LAO heterostructures, the critical thickness is expected to be closer to 4 u.c. In a first approximation, given the similarities M. W. (1998) of standard entalphies and entropy of dioxygen and water in gaseous form, then we can approximate if the partial pressures of both gases are the same order of magnitude. Then . Hence, in the surface protonation picture, the effect of annealing is to shift to lower LAO thicknesses. This contrasts with the case of oxygen vacancies, where it shifts to larger LAO thicknesses.
III.4 Discussion
In the thick layer limit (), the Zener breakdown and the surface redox model predict the same charge density at the -type interface. In the surface redox model, the potential drop is given by:
| (31) |
As we have , and substituting to above the threshold thickness, the potential drop across the LAO film is roughly equal to , essentially independent of LAO thickness, as in the Zener breakdown scenario. The potential drop is pinned as the are stabilized at the surface.
The reduction in rumpling (cation-anion displacements) as measured by surface x-ray diffraction Pauli et al. (2011) and the sudden drop of the -axis expansion above the threshold thickness Cancellieri et al. (2011) (reaching the elastic limit as early as ), is achieved quicker than predicted by the Zener breakdown alone, suggesting an earlier onset for charge transfer, in agreement with the surface redox scenario. Additionally, no holes have ever been found at the LAO surface. The surface redox model is in better agreement with this observation, given that the donor states are 1 eV away from the Fermi level (pinned near the bottom of the STO conduction band) in absence of field, as in the fully compensated regime shown in Figs. 7(b-c). The dependence of the sheet resistance also finds an explanation.
There remain open questions about the 2DES at the interface: if the origin of the carriers are , which arise for LAO thickness below , why are the samples with smaller LAO thicknesses insulating ? It has been suggested that charge localization occurs through the Anderson mechanism Anderson (1958). In-gap states with a character have also been observed, at higher binding energies Berner et al. (2013); Drera et al. (2011); Koitzsch et al. (2011); Ristic et al. (2012), around below the Fermi level. This description also fits the binding energy of the electron stuck in a inside the STO substrate. Another possibility is that the growth process induces acceptor defects, such as cation intermixing, already observed in experiments Nakagawa et al. (2006); Pauli et al. (2011); Chambers et al. (2010); Qiao et al. (2010); Willmott et al. (2007); Gunkel et al. (2010); Kalabukhov et al. (2009); Vonk et al. (2012). It has also been suggested Bristowe et al. (2011) that such trapping states may be induced by the same donor at the LAO surface: for low LAO thickness, surface generate trapping potentials with a deep character, which become more shallow and numerous with increasing LAO thickness, releasing the carriers which may contribute to transport. In all cases, these hypotheses imply that the onset for conductivity is different than the onset for surface stabilization. It is worth mentioning that our calculations involving are still very close to pristine heterostructures, with a perfect interface, and no defects within the STO and LAO subsystems. Accounting for possible intrinsic defects change the results expected from a pristine interface, as studied in the present manuscript. The interfacial defects may be characterized as either deviations respecting the stoichiometry (inter-diffusion of atoms across the interface, such as or ), and off-stoichiometric defects. The former is known to alter slightly quantitatively the expectations of the electric-field driven mechanisms, by inducing a potential shift at the interface Bristowe et al. (2014), yet does not dope the interface Fontaine (2014), nor change the overall dielectric properties of the subsystems. The laters however may impact significantly the properties of the interface. A more detailed discussion can be found in Reference Bristowe et al., 2014. Finally, for heterostructures grown with a metallic capping layer characterized by a high work function , x-ray photo-emission spectroscopy spectra Vaz et al. (2017) display signatures of metal oxidation, implying a chemical reaction between the LAO layer and the metallic capping layer. The degree of oxidation is also found to be correlated to the sheet carrier density. These results cannot be explained by the Zener breakdown alone, and are consistent with a redox process of the LAO surface: in this case, the oxygen atoms originating from the LAO remain trapped by the metallic layer, and the chemistry process and energetics will be different than that of the bare LAO surface process. Finally, from our analysis of the surface protonation process, it is likely that the shift of does not simply change the critical thickness observed in experiments. Rather, a shift in determines the dominant redox mechanism and bounds the values of the LAO critical thickness between 3 and 4 u.c.; this might explain the consistency of the values obtained in experiments, even if no Zener breakdown is occuring.
III.5 Tuning the polar discontinuity at oxide interfaces
It has been shown that the threshold thickness can be tuned by replacing the LAO overlayer by an alloy made of STO and LAO, , referred to as LASTO: in Reference Reinle-Schmitt et al., 2012 where is the compositional ratio. This observation can be rationalized within the electric field driven mechanisms. The rationale is that the formal polarization of the LASTO: overlayer can be changed continuously as:
| (32) |
if we assume a random alloying of both the (Sr and La) and the (Ti and Al) cations through the film so that () is the probability of occupation the La/Al (Sr/Ti) cations at a given / site, in a virtual crystal approximation approach. Hence, for a composition , then the formal polarization of the alloy is half the formal polarization of the pristine LAO overlayer.
If the band gap of the alloy remains larger than the band gap of STO, the band alignment remains similar to that of the STO/LAO interface, and the dielectric properties of the polar layer close to that of LAO, the predicted threshold thickness for a Zener breakdown model becomes:
| (33) |
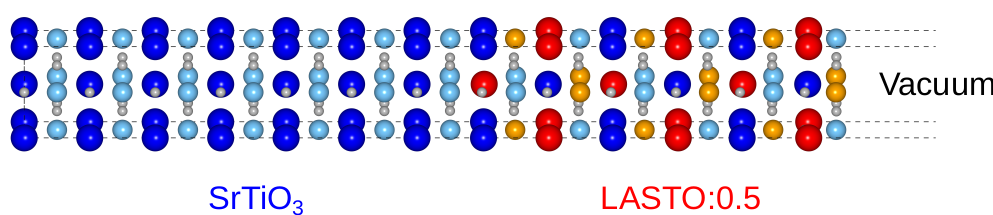
Therefore, for a composition , the threshold thickness is expected to be twice the threshold thickness expected for the STO/LAO heterostructure. To investigate the specific case of LASTO:, we performed calculations on heterostructures where the LAO overlayer is replaced by LASTO:0.5, with thicknesses to 7 u.c.; the alloy is modelled as a homogeneous solid solution in a “checkerboard” configuration, as shown in Fig. 13.
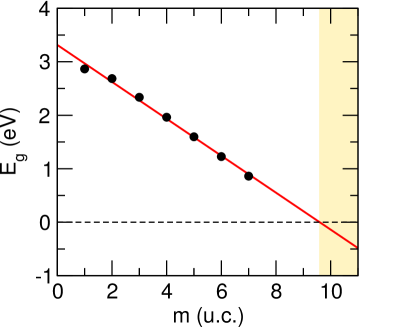
The layer-resolved DOS for overlayer thicknesses up to 7 u.c. is given in Fig. 14.(a-g): in all cases, the interface remains insulating, and we observe a linear decrease of the band gap, in agreement within the Zener breakdown scenario.
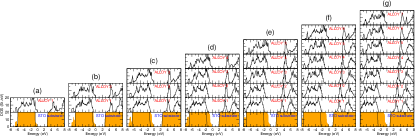
Without performing an in-depth analysis as we did for the LAO case, by extrapolating the linear decrease of (Fig. 15), we estimate a critical thickness
| (34) |
which is in agreement with the Zener breakdown model for (this value is confirmed by our hybrid functional ab initio calculation of the bulk solid solution dielectric constant in the same atomic configuration). This corresponds to a built-in field of before the breakdown.
The tunability of the critical thickness rationalized with the Zener breakdown scenario is in good agreement with the DFT calculations. Nevertheless, looking at the actual experimental Reinle-Schmitt et al. (2012); Cancellieri et al. (2013) threshold thickness for , the MIT occurs between , thus the Zener breakdown model overestimates the critical thickness (in our DFT calculations, the structure with = 7 u.c. is insulating, with a band gap of ), even when adjusting the potential drop to correct the overestimation of the STO band gap within the hybrid functional approach () as we did for the case. It is therefore warranted to see to which extent the surface redox model predicts a threshold thickness in better agreement with the experimental value, given that both models predict a composition dependence of the threshold thickness Bristowe et al. (2014).
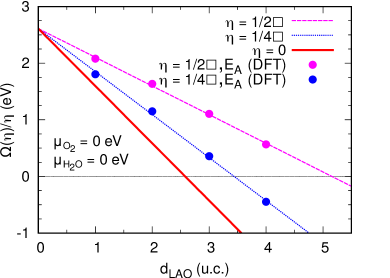
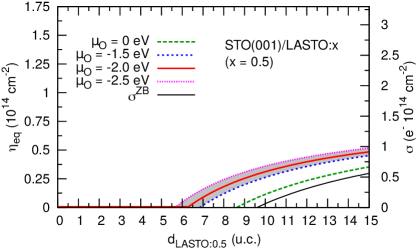
For the case of stabilized at the surface, let us first consider the composition case. If we assume that the chemical term remains close to the value calculated for the LAO surface, the equilibrium density of surface can be estimated for the alloy case by setting and . For simplicity, we keep as for the composition. The results are displayed in Fig. 16: we predict a threshold thickness between 6 and 7 u.c. of LASTO:0.5, closer to the experimental result. In addition, we can see that the predicted surface density of is lower than for the bare LAO case: only a transfer of is required to completely screen the built-in field in the polar layer in this case. This value is however only reached in the infinitely thick limit.
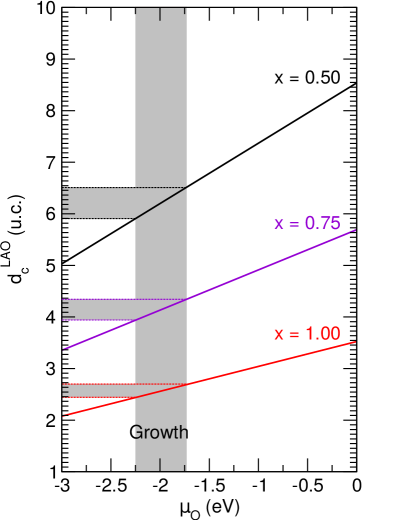
For , we predict a threshold thickness between 4 and 5 u.c., also in better agreement with the experimental value compared to the Zener breakdown scenario (6.1 u.c.). The threshold thicknesses for each composition are shown in Fig. 17, with respect to . Of course, all of these predictions are based on the hypothesis that is the same in all cases, which remains to be proven; as the term is related to the chemistry of the surface, it is reasonable to expect some change.
IV Conclusions
In this manuscript, we have re-examined the two most popular hypotheses for the origin of the carriers at the interface, namely the Zener breakdown and the polarity-induced surface redox mechanisms. The key physical parameters of these two models are notably well described with the B1-WC hybrid functional, which motivates the review of these models from first-principles with this novel approach. We show and discuss how the predictions of these models and ab initio calculations compare with the experimental results. Our results indicate that oxygen vacancies and surface protonation at the LAO surface are typically stabilized at a lower LAO film thickness than the onset for Zener breakdown; this is related to the lower energy cost to form oxygen vacancies or Hydrogen adatoms at the LAO surface compared to the creation of an electron-hole pairs across the LAO film. Hence, for typical growth conditions of STO/LAO heterostructures, the Zener breakdown is unlikely to occur first. This justifies how some properties expected from the electron reconstruction, such as a metallic LAO surface, are not witnessed in experiments. Of course, the models and the first-principles calculations only involve pristine interfaces and surfaces. This may explain the failed predictions of the models with respect to some features of the 2DES witnessed in experiments, such as the sheet carrier density, typically overestimated within the models (for large LAO film thickness). The introduction of acceptor trapping states in these models is therefore worth investigating.
Furthermore, we also discuss how the electric-field driven mechanisms may explain the experimental results obtained from STO/LASTO: heterostructures Reinle-Schmitt et al. (2012), and highlight how the surface redox model may be more appropriate to explain the measured threshold thicknesses with respect to the composition of the polar layer.
Acknowledgements.
We thank D. Fontaine, J.-M. Triscone, A. Filippetti, D. Li, S. Gariglio, M. Gabay and F. Ricci for fruitful discussions. S.L. and Ph.G. were supported by the European Funds for Regional Developments (FEDER) and the Walloon Region in the framework of the operational program “Wallonie-2020.EU” (project Multifunctional thin films/LoCoTED). S.L. and Ph.G. were supported by the ARC project AIMED 15/19-09 785. The present research benefited from computational resources made available on the Tier-1 supercomputer of the Fédération Wallonie-Bruxelles, infrastructure funded by the Walloon Region under the grant agreement .Appendix A Chemical potential of oxygen
We calculate the chemical potential of oxygen at finite temperature and pressure from the thermodynamic model, inspired by the developments of References Reuter and Scheffler, 2001; Osorio-Guillén et al., 2006. Considering the environment as a gas reservoir of particles at pressure and temperature , the chemical potential is given by the derivative of the Gibbs free energy:
| (35) |
As is a potential function depending on and , we can write, using the Maxwell relations:
| (36) | |||||
From the ideal gas equation of state (), the partial derivative of with respect to is:
| (37) |
In turn, a finite change of pressure from to results in:
| (38) | |||||
Combining the first Equation and the last one, we have:
| (39) |
Hence we have:
| (40) | |||||
From the knowledge of temperature-dependant at fixed pressure and Equation 40, one can calculate the chemical potential at given and using tabulated values for the standard enthalpy and entropy (at and ) through:
| (41) | |||||
where and . For typical growth conditions for the heterostructures, we use (oxygen partial pressure ) and temperature Huijben et al. (2006). As for the standard values , and heat capacity , we use values from the NIST-JANAF thermochemical Tables M. W. (1998):
With these data, we find:
This leads to . Finally, at pressure :
In the manuscript, we mainly use a rounded value of , which is the same value used in Reference Yu and Zunger, 2014 and close to the value used by Bristowe et. al. Bristowe et al. (2011) (). The chemical potential of oxygen with respect to and is given in Fig. 18, along with growth conditions (,) extracted from the literature, allowing us to determine the variation of across the average value for the different experiments, determined to lie between eV and eV. The effect of post-growth annealing is to shift the chemical potential toward zero; depending on the annealing conditions, we expect the upper bound of chemical potential to be roughly eV.
References
- Gariglio et al. (2009) S. Gariglio, N. Reyren, A. D. Caviglia, and J.-M. Triscone, Journal of Physics: Condensed Matter 21, 164213 (2009).
- Zubko et al. (2011) P. Zubko, S. Gariglio, M. Gabay, P. Ghosez, and J.-M. Triscone, Annu. Rev. Condens. Matter Phys. 2, 141 (2011).
- Hwang et al. (2012) H. Y. Hwang, Y. Iwasa, M. Kawasaki, B. Keimer, N. Nagaosa, and Y. Tokura, Nature materials 11, 103 (2012).
- Banerjee et al. (2013) S. Banerjee, O. Erten, and M. Randeria, Nature physics 9, 626 (2013).
- Salluzzo et al. (2013) M. Salluzzo, S. Gariglio, D. Stornaiuolo, V. Sessi, S. Rusponi, C. Piamonteze, G. M. De Luca, M. Minola, D. Marré, A. Gadaleta, et al., Physical Review Lett. 111, 087204 (2013).
- Chakhalian et al. (2014) J. Chakhalian, J. W. Freeland, A. J. Millis, C. Panagopoulos, and J. M. Rondinelli, Reviews of Modern Physics 86, 1189 (2014).
- Khomskii (2014) D. Khomskii, Transition metal compounds (Cambridge University Press, 2014).
- Gariglio et al. (2016) S. Gariglio, M. Gabay, and J.-M. Triscone, APL Materials 4, 060701 (2016).
- Ohtomo and Hwang (2004) A. Ohtomo and H. Hwang, Nature 427, 423 (2004).
- Savoia et al. (2009) A. Savoia, D. Paparo, P. Perna, Z. Ristic, M. Salluzzo, F. Miletto Granozio, U. Scotti di Uccio, C. Richter, S. Thiel, J. Mannhart, et al., Physical Review B 80, 075110 (2009).
- Li et al. (2011) Y. Li, S. N. Phattalung, S. Limpijumnong, J. Kim, and J. Yu, Physical Review B 84, 245307 (2011).
- Bristowe et al. (2011) N. C. Bristowe, P. B. Littlewood, and E. Artacho, Physical Review B 83, 205405 (2011).
- Yu and Zunger (2014) L. Yu and A. Zunger, Nature communications 5, 5118 (2014).
- Cancellieri et al. (2011) C. Cancellieri, D. Fontaine, S. Gariglio, N. Reyren, A. D. Caviglia, A. Fête, S. J. Leake, S. A. Pauli, P. R. Willmott, M. Stengel, et al., Physical Review Lett. 107, 056102 (2011).
- Reinle-Schmitt et al. (2012) M. Reinle-Schmitt, C. Cancellieri, D. L. D. Fontaine, M. Medarde, E. Pomjakushina, C. Schneider, S. Gariglio, P. Ghosez, J.-M. Triscone, and P. Willmott, Nature Communications 3, 932 (2012).
- Li et al. (2018) D. Li, S. Lemal, S. Gariglio, Z. Wu, A. Fête, M. Boselli, P. Ghosez, and J.-M. Triscone, Advanced Science 5, 1800242 (2018).
- Kim et al. (2014) H. Kim, S. Y. Moon, S.-I. Kim, S.-H. Baek, H. W. Jang, and D.-W. Kim, ACS applied materials & interfaces 6, 14037 (2014).
- Scheiderer et al. (2015) P. Scheiderer, F. Pfaff, J. Gabel, M. Kamp, M. Sing, and R. Claessen, Phys. Rev. B 92, 195422 (2015).
- Brown et al. (2016) K. A. Brown, S. He, D. J. Eichelsdoerfer, M. Huang, I. Levy, H. Lee, S. Ryu, P. Irvin, J. Mendez-Arroyo, C.-B. Eom, et al., Nature communications 7, 10681 (2016).
- Zhang et al. (2018) M. Zhang, Z. Chen, B. Mao, Q. Li, H. Bo, T. Ren, P. He, Z. Liu, and Y. Xie, Phys. Rev. Materials 2, 065002 (2018).
- Dovesi et al. (2014a) R. Dovesi, R. Orlando, A. Erba, C. M. Zicovich-Wilson, B. Civalleri, S. Casassa, L. Maschio, M. Ferrabone, M. D. L. Pierre, P. D’Arco, et al., International Journal of Quantum Chemistry 114, 1284 (2014a).
- Bredow et al. (2004) T. Bredow, P. Heitjans, and M. Wilkening, Physical Review B 70, 115111 (2004).
- Piskunov et al. (2004) S. Piskunov, E. Heifets, R. I. Eglitis, and G. Borstel, Computational Materials Science 29, 165 (2004).
- (24) M. Towler, CRYSTAL Resources Page, http://www.tcm.phy.cam.ac.uk/~mdt26/, accessed: 04-05-2015.
- Cao and Dolg (2004) X. Cao and M. Dolg, Journal of Molecular Structure: THEOCHEM 673, 203 (2004).
- Bilc et al. (2008) D. I. Bilc, R. Orlando, R. Shaltaf, G. M. Rignanese, J. Iniguez, and P. Ghosez, Physical Review B 77, 165107 (2008).
- Delugas et al. (2011) P. Delugas, A. Filippetti, V. Fiorentini, D. I. Bilc, D. Fontaine, and P. Ghosez, Physical Review Lett. 106, 166807 (2011).
- Cancellieri et al. (2014) C. Cancellieri, M. L. Reinle-Schmitt, M. Kobayashi, V. N. Strocov, P. R. Willmott, D. Fontaine, P. Ghosez, A. Filippetti, P. Delugas, and V. Fiorentini, Physical Review B 89, 121412(R) (2014).
- Bilc et al. (2016) D. I. Bilc, C. G. Floare, L. P. Zarbo, S. Garabagiu, S. Lemal, and P. Ghosez, The Journal of Physical Chemistry C 120, 25678 (2016).
- Caputo et al. (2020) M. Caputo, M. Boselli, A. Filippetti, S. Lemal, D. Li, A. Chikina, C. Cancellieri, T. Schmitt, J.-M. Triscone, P. Ghosez, et al., Phys. Rev. Materials 4, 035001 (2020).
- Monkhorst and Pack (1976) H. J. Monkhorst and J. D. Pack, Physical Review B 13, 5188 (1976).
- Dovesi et al. (2014b) R. Dovesi, V. R. Saunders, C. Roetti, R. Orlando, C. M. Zicovich-Wilson, F. Pascale, B. Civalleri, K. Doll, N. M. Harrison, I. J. Bush, et al., CRYSTAL14 user’s manual (2014b).
- Reuter and Scheffler (2001) K. Reuter and M. Scheffler, Physical Review B 65, 035406 (2001).
- Osorio-Guillén et al. (2006) J. Osorio-Guillén, S. Lany, S. V. Barabash, and A. Zunger, Physical Review Lett. 96, 107203 (2006).
- Van Benthem et al. (2001) K. Van Benthem, C. Elsässer, and R. French, Journal of applied physics 90, 6156 (2001).
- Lim et al. (2002) S.-G. Lim, S. Kriventsov, T. N. Jackson, J. Haeni, D. Schlom, A. Balbashov, P. Uecker, R .and Reiche, J. Freeouf, and G. Lucovsky, Journal of Applied Physics 91, 4500 (2002).
- Stengel and Vanderbilt (2009) M. Stengel and D. Vanderbilt, Physical Review B 80, 241103(R) (2009).
- Vanderbilt and King-Smith (1993) D. Vanderbilt and R. D. King-Smith, Physical Review B 48, 4442 (1993).
- Bristowe et al. (2014) N. C. Bristowe, P. Ghosez, P. B. Littlewood, and E. Artacho, Journal of Physics: Condensed Matter 26, 143201 (2014).
- Berner et al. (2010) G. Berner, S. Glawion, J. Walde, F. Pfaff, H. Hollmark, L.-C. Duda, S. Paetel, C. Richter, J. Mannhart, M. Sing, et al., Physical Review B 82, 241405(R) (2010).
- Berner et al. (2013) G. Berner, M. Sing, H. Fujiwara, A. Yasui, Y. Saitoh, A. Yamasaki, Y. Nishitani, A. Sekiyama, N. Pavlenko, T. Kopp, et al., Physical Review Lett. 110, 247601 (2013).
- Son et al. (2009) W.-j. Son, E. Cho, B. Lee, J. Lee, and S. Han, Physical Review B 79, 245411 (2009).
- Lee and Demkov (2008) J. Lee and A. A. Demkov, Physical Review B 78, 193104 (2008).
- Thiel et al. (2006) S. Thiel, G. Hammerl, A. Schmehl, C. Schneider, and J. Mannhart, Science 313, 1942 (2006).
- Segal et al. (2009) Y. Segal, J. H. Ngai, J. W. Reiner, F. J. Walker, and C. H. Ahn, Physical Review B 80, 241107(R) (2009).
- Sing et al. (2009) M. Sing, G. Berner, K. Goß, A. Müller, A. Ruff, A. Wetscherek, S. Thiel, J. Mannhart, S. A. Pauli, C. W. Schneider, et al., Physical Review Lett. 102, 176805 (2009).
- Takizawa et al. (2011) M. Takizawa, S. Tsuda, T. Susaki, H. Y. Hwang, and A. Fujimori, Physical Review B 84, 245124 (2011).
- Plumb et al. (2017) N. Plumb, M. Kobayashi, M. Salluzzo, E. Razzoli, C. Matt, V. Strocov, K. Zhou, M. Shi, J. Mesot, T. Schmitt, et al., Applied Surface Science 412, 271 (2017), ISSN 0169-4332.
- Pentcheva et al. (2010) R. Pentcheva, M. Huijben, K. Otte, W. E. Pickett, J. E. Kleibeuker, J. Huijben, H. Boschker, D. Kockmann, W. Siemons, G. Koster, et al., Physical Review Lett. 104, 166804 (2010).
- Huijben et al. (2012) M. Huijben, D. Kockmann, J. Huijben, J. E. Kleibeuker, A. van Houselt, G. Koster, D. H. A. Blank, H. Hilgenkamp, G. Rijnders, A. Brinkman, et al., Physical Review B 86, 035140 (2012).
- Lee et al. (2018) H. Lee, N. Campbell, J. Lee, T. Asel, T. Paudel, H. Zhou, J. Lee, B. Noesges, J. Seo, B. Park, et al., Nature materials 17, 231 (2018).
- Herranz et al. (2007) G. Herranz, M. Basletić, M. Bibes, C. Carrétéro, E. Tafra, E. Jacquet, K. Bouzehouane, C. Deranlot, A. Hamzić, J.-M. Broto, et al., Physical Review Lett. 98, 216803 (2007).
- Kalabukhov et al. (2011) A. Kalabukhov, Y. A. Boikov, I. Serenkov, V. Sakharov, J. Börjesson, N. Ljustina, E. Olsson, D. Winkler, and T. Claeson, EPL (Europhysics Letters) 93, 37001 (2011).
- Okuda et al. (2001) T. Okuda, K. Nakanishi, S. Miyasaka, and Y. Tokura, Physical Review B 63, 113104 (2001).
- Muta et al. (2005) H. Muta, K. Kurosaki, and S. Yamanaka, Journal of Alloys and Compounds 392, 306 (2005), ISSN 0925-8388.
- Basletic et al. (2008) M. Basletic, J.-L. Maurice, C. Carrétéro, G. Herranz, O. Copie, M. Bibes, É. Jacquet, K. Bouzehouane, S. Fusil, and A. Barthélémy, Nature materials 7, 621 (2008).
- Kalabukhov et al. (2007) A. Kalabukhov, R. Gunnarsson, J. Börjesson, E. Olsson, T. Claeson, and D. Winkler, Physical Review B 75, 121404(R) (2007).
- Siemons et al. (2007) W. Siemons, G. Koster, H. Yamamoto, W. A. Harrison, G. Lucovsky, T. H. Geballe, D. H. A. Blank, and M. R. Beasley, Physical Review Lett. 98, 196802 (2007).
- Huijben et al. (2006) M. Huijben, G. Rijnders, D. H. A. Blank, S. Bals, S. V. Aert, J. Verbeeck, G. V. Tendeloo, A. Brinkman, and H. Hilgenkamp, Nature Materials 5, 556 (2006).
- Freysoldt et al. (2014) C. Freysoldt, B. Grabowski, T. Hickel, J. Neugebauer, G. Kresse, A. Janotti, and C. G. Van de Walle, Rev. Mod. Phys. 86, 253 (2014).
- Zhong et al. (2010) Z. Zhong, P. X. Xu, and P. J. Kelly, Phys. Rev. B 82, 165127 (2010).
- Adhikari et al. (2016) S. Adhikari, A. C. Garcia-Castro, A. H. Romero, H. Lee, J.-W. Lee, S. Ryu, C.-B. Eom, and C. Cen, Advanced Functional Materials 26, 5453 (2016).
- Piyanzina et al. (2019) I. Piyanzina, V. Eyert, Y. V. Lysogorskiy, D. Tayurskii, and T. Kopp, Journal of Physics: Condensed Matter 31, 295601 (2019).
- M. W. (1998) J. M. W., Chase, J. Phys. Chem. Ref. Data, Monograph 9 (1998).
- Pauli et al. (2011) S. A. Pauli, S. J. Leake, B. Delley, M. Björck, C. W. Schneider, C. M. Schlepütz, D. Martoccia, S. Paetel, J. Mannhart, and P. R. Willmott, Physical Review Lett. 106, 036101 (2011).
- Anderson (1958) P. W. Anderson, Physical Review 109, 1492 (1958).
- Drera et al. (2011) G. Drera, F. Banfi, F. F. Canova, P. Borghetti, L. Sangaletti, F. Bondino, E. Magnano, J. Huijben, M. Huijben, G. Rijnders, et al., Applied Physics Letters 98, 052907 (2011).
- Koitzsch et al. (2011) A. Koitzsch, J. Ocker, M. Knupfer, M. C. Dekker, K. Dörr, B. Büchner, and P. Hoffmann, Physical Review B 84, 245121 (2011).
- Ristic et al. (2012) Z. Ristic, R. Di Capua, F. Chiarella, G. M. De Luca, I. Maggio-Aprile, M. Radovic, and M. Salluzzo, Physical Review B 86, 045127 (2012).
- Nakagawa et al. (2006) N. Nakagawa, H. Y. Hwang, and D. A. Muller, Nature materials 5, 204 (2006).
- Chambers et al. (2010) S. A. Chambers, M. H. Engelhard, V. Shutthanandan, Z. Zhu, T. C. Droubay, L. Qiao, P. Sushko, T. Feng, H. D. Lee, T. Gustafsson, et al., Surface Science Reports 65, 317 (2010).
- Qiao et al. (2010) L. Qiao, T. C. Droubay, V. Shutthanandan, Z. Zhu, P. Sushko, and S. A. Chambers, Journal of Physics: Condensed Matter 22, 312201 (2010).
- Willmott et al. (2007) P. R. Willmott, S. A. Pauli, R. Herger, C. M. Schlepütz, D. Martoccia, B. D. Patterson, B. Delley, R. Clarke, D. Kumah, C. Cionca, et al., Physical Review Lett. 99, 155502 (2007).
- Gunkel et al. (2010) F. Gunkel, S. Hoffmann-Eifert, R. Dittmann, S. Mi, C. Jia, P. Meuffels, and R. Waser, Applied Physics Letters 97, 012103 (2010).
- Kalabukhov et al. (2009) A. S. Kalabukhov, Y. A. Boikov, I. T. Serenkov, V. I. Sakharov, V. N. Popok, R. Gunnarsson, J. Börjesson, N. Ljustina, E. Olsson, D. Winkler, et al., Physical Review Lett. 103, 146101 (2009).
- Vonk et al. (2012) V. Vonk, J. Huijben, D. Kukuruznyak, A. Stierle, H. Hilgenkamp, A. Brinkman, and S. Harkema, Physical Review B 85, 045401 (2012).
- Fontaine (2014) D. Fontaine, Ph.D. thesis, Université de Liège (2014).
- Vaz et al. (2017) D. C. Vaz, E. Lesne, A. Sander, H. Naganuma, E. Jacquet, J. Santamaria, A. Barthélémy, and M. Bibes, Advanced Materials 29, 1700486 (2017).
- Cancellieri et al. (2013) C. Cancellieri, M. L. Reinle-Schmitt, M. Kobayashi, V. N. Strocov, T. Schmitt, P. R. Willmott, S. Gariglio, and J.-M. Triscone, Physical Review Lett. 110, 137601 (2013).
- Zaid et al. (2018) H. Zaid, M. H. Berger, D. Jalabert, M. Walls, R. Akrobetu, N. J. Goble, X. P. A. Gao, P. Berger, I. Fongkaew, W. Lambrecht, et al., Journal of Applied Physics 123, 155304 (2018).
- Pfaff et al. (2018) F. Pfaff, H. Fujiwara, G. Berner, A. Yamasaki, H. Niwa, H. Kiuchi, A. Gloskovskii, W. Drube, J. Gabel, O. Kirilmaz, et al., Physical Review B 97, 035110 (2018).
- Xue et al. (2017) H. Xue, C. Li, Y. Hong, X. Wang, Y. Li, K. Liu, W. Jiang, M. Liu, L. He, R. Dou, et al., Physical Review B 96, 235310 (2017).
- Pallecchi et al. (2010) I. Pallecchi, M. Codda, E. Galleani d’Agliano, D. Marré, A. D. Caviglia, N. Reyren, S. Gariglio, and J.-M. Triscone, Physical Review B 81, 085414 (2010).
- Singh et al. (2018) A. K. Singh, T.-C. Wu, M.-C. Chen, M.-Y. Song, W.-L. Lee, C.-P. Su, and M.-W. Chu, Physical Review Materials 2, 114009 (2018).
- Dudy et al. (2016) L. Dudy, M. Sing, P. Scheiderer, J. D. Denlinger, P. Schütz, J. Gabel, M. Buchwald, C. Schlueter, T.-L. Lee, and R. Claessen, Advanced Materials 28, 7443 (2016).
- Cook et al. (2019) S. Cook, M. T. Dylla, R. A. Rosenberg, Z. R. Mansley, G. J. Snyder, L. D. Marks, and D. D. Fong, Advanced Electronic Materials 5, 1800460 (2019).