CMS RPC Background - Studies and Measurements
Abstract
The expected radiation background in the CMS RPC system has been studied using the MC prediction with the CMS FLUKA simulation of the detector and the cavern. The MC geometry used in the analysis describes very accurately the present RPC system but still does not include the complete description of the RPC upgrade region with pseudorapidity . Present results will be updated with the final geometry description, once it is available. The radiation background has been studied in terms of expected particle rates, absorbed dose and fluence. Two High Luminosity LHC (HL-LHC) scenarios have been investigated - after collecting and fb-1. Estimations with safety factor of 3 have been considered, as well.
1 Introduction
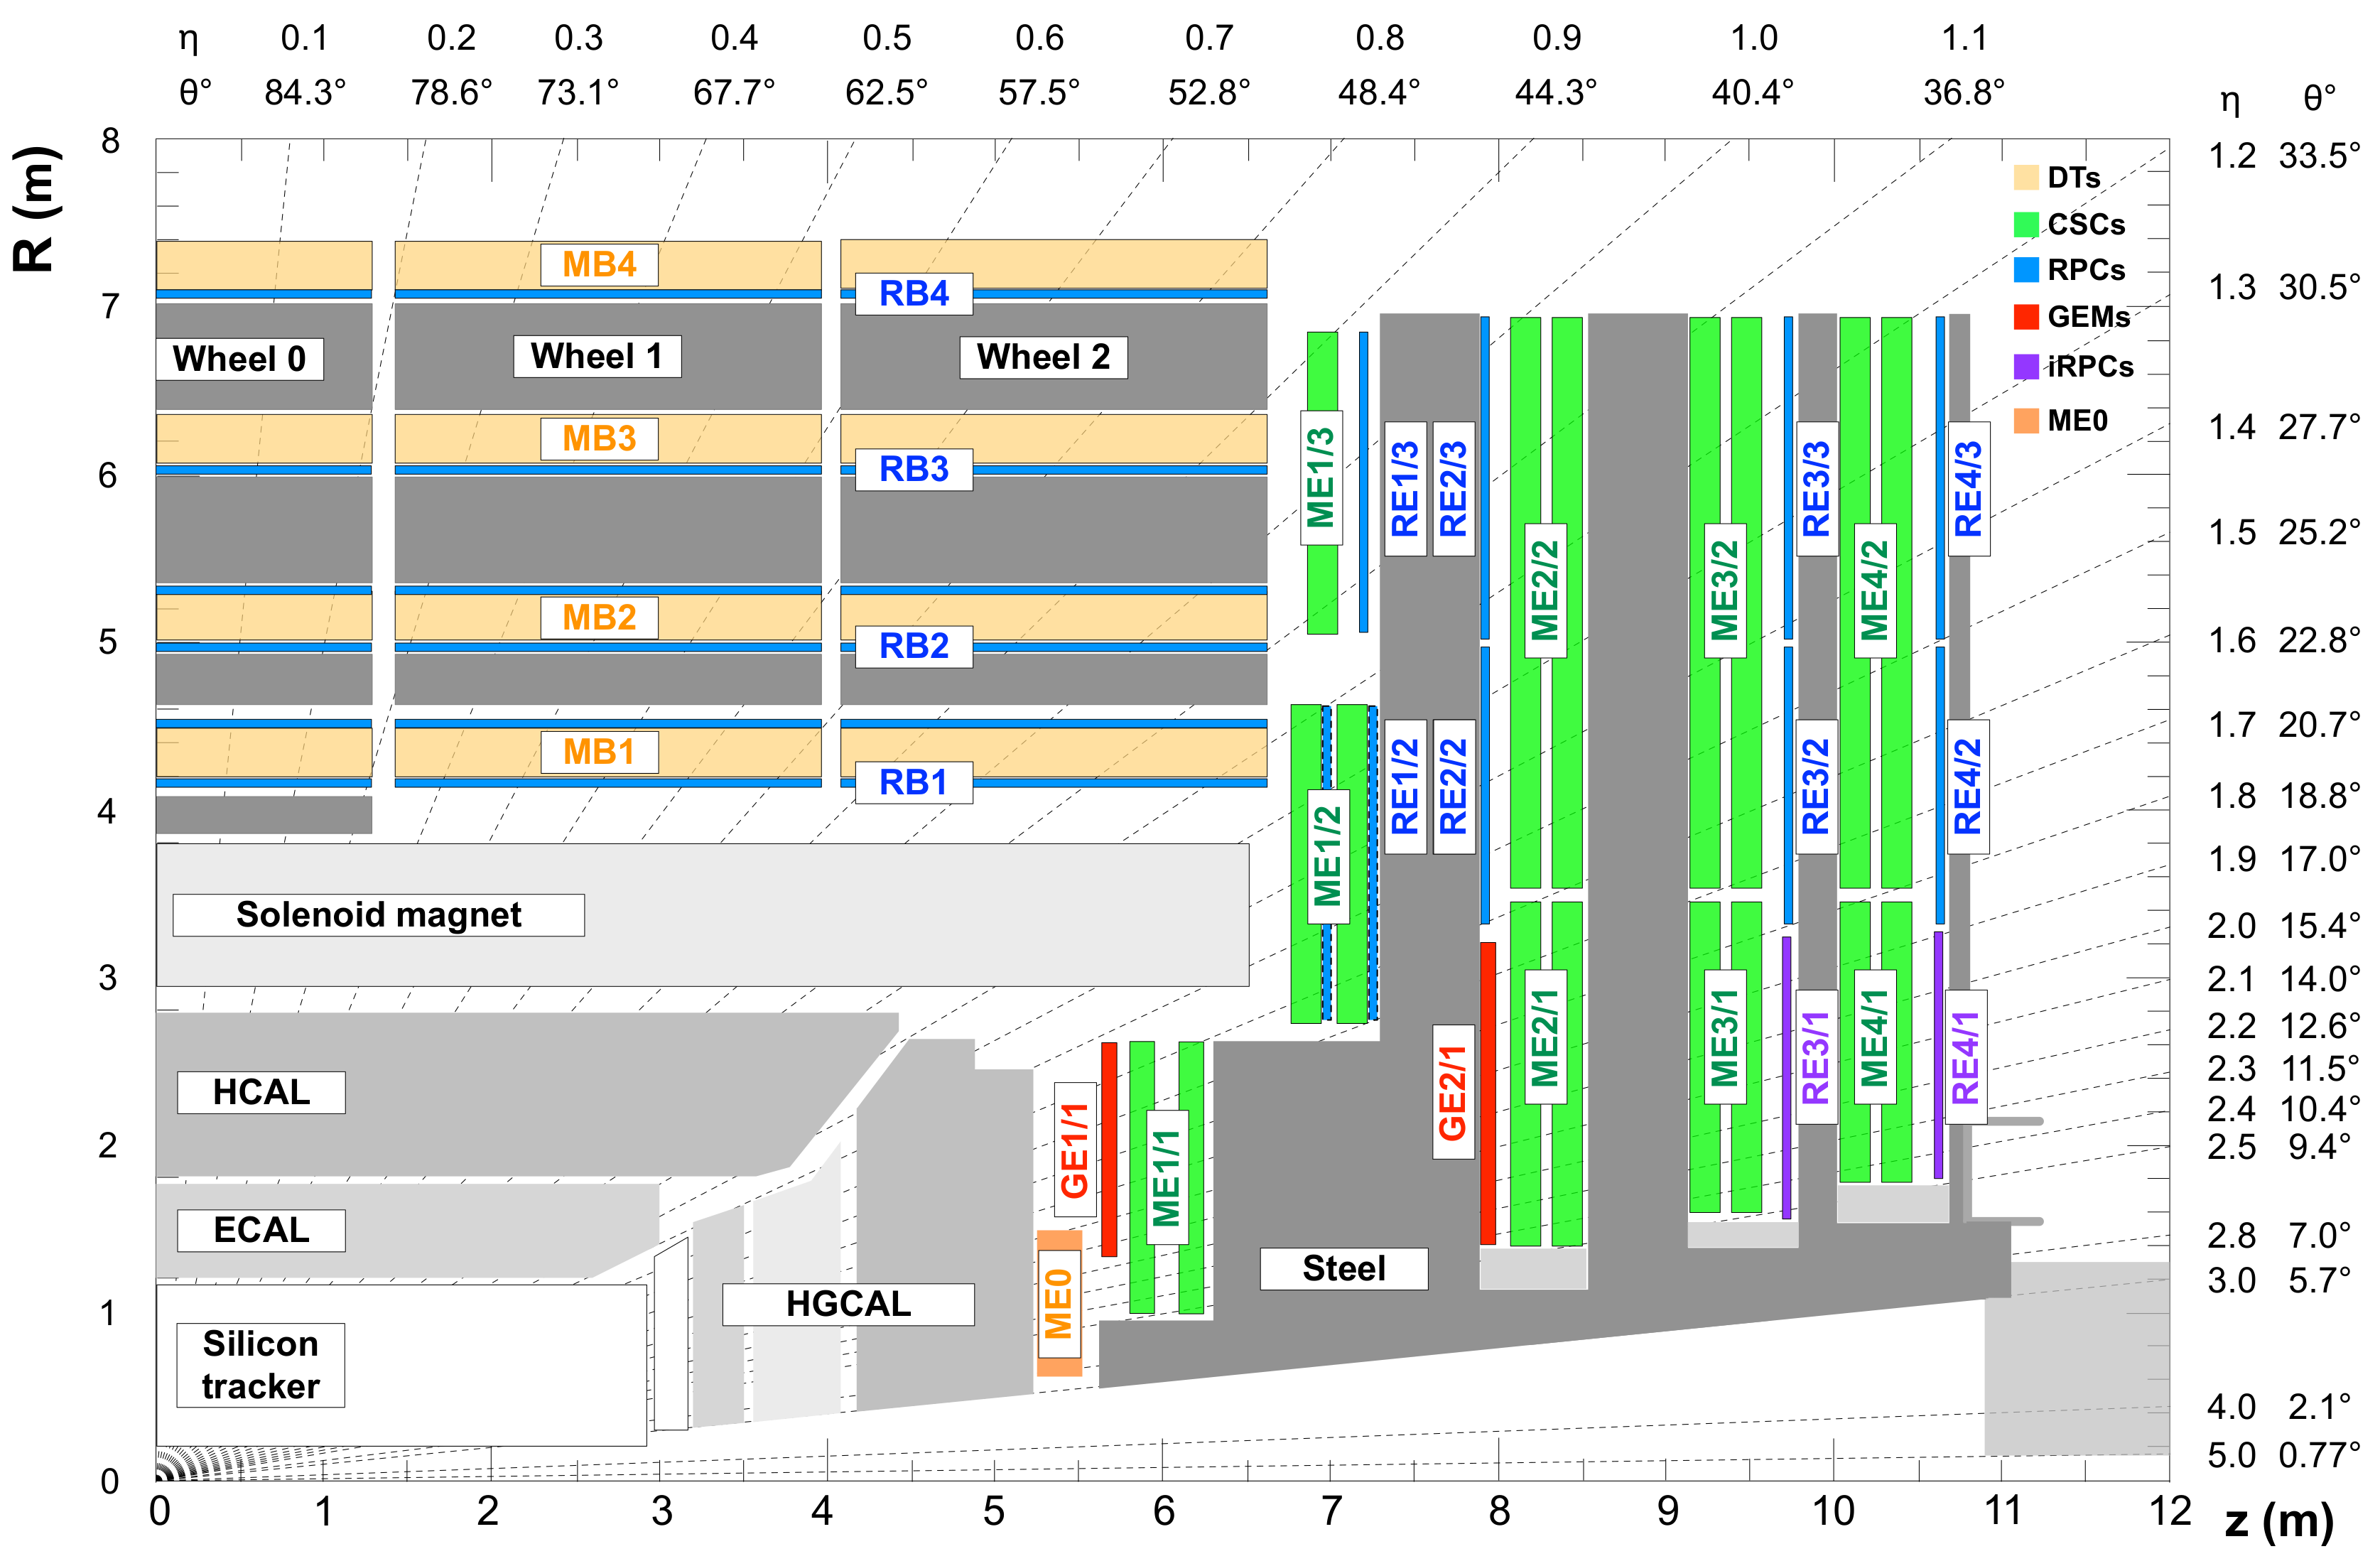
A quadrant plot of the CMS (Compact Muon Solenoid) detector is shown in Fig. 1. CMS is composed of a barrel and two endcap regions. A detailed description of the CMS detector can be found in Ref. [1]. The CMS muon system consists of five separate wheels in the barrel and four disks for each of the two endcaps. Each wheel has four different stations (concentric layers) and each endcap disk is organized in three rings. Three different gaseous detector technologies are used in the present muon system - DT (Drift Tubes) in the barrel, CSC (Cathode Strip Chambers) in the endcap and RPC (Resistive Plate Chambers) both in barrel and endcap. One of the Phase-2 Muon Upgrade subjects is the installation of additional detector layers in the high pseudorapidity region: GEMs (Gas Electron Multipliers) on the inner ring of the first and second disk, ME0 station which will be composed of six layers of GEM detectors, and so-called iRPCs (improved RPC) on the inner ring of the third and fourth disk [2]. The study of the existing and new potential radiation background sources is important for the choice of detector technologies and electronics components. The CMS RPC system is subject to two main radiation sources: the first one from collisions and radiation leaks through HCAL (Hadron Calorimeter), affecting mainly the first stations of the external barrel wheels, and the second one due to the neutron-induced background from the cavern, which affects mainly the outermost endcap disks and the fourth barrel stations. The expected radiation background in the CMS RPC system has been studied using the MC prediction with the CMS FLUKA [3, 4] simulation of the detector and cavern. The radiation background has been studied in terms of expected particle rates, absorbed dose and fluence. Two High Luminosity LHC (HL-LHC) scenarios have been investigated - after collecting and fb-1.
This work is focused on the radiation background on the RPCs and iRPCs of the third and fourth endcap disks. The present RPC system has chambers installed on the second and third rings of each disk. During the Phase-2 upgrade the iRPC chambers will be installed on the inner rings of the third and forth disks. In Fig. 1 the third and fourth RPC endcap disks are indicated as RE3/Y and RE4/Y, where Y depicts the ring enumeration (). RE3/1 iRPCs will be mounted directly on the endcap yoke. The FEBs (Frond-End Boards) will be mounted behind the RE3/1 chambers. RE4/1 iRPCs will be installed in a high pseudorapidity region over the existing CSC chambers (ME4/1 in the same figure). More details about the integration and installation of the iRPC can be found in Ref. [5].
2 Validation with experimental data
During the LHC Run-2 , the experimental RPC rates have been studied as a function of the instantaneous luminosity. The rates are obtained from the Link-board counts [6] (data transfer boards from FEB to trigger system) of the present chambers. Extrapolation to a higher luminosity scenario can be done based on the already observed linear dependence between the RPC hit rates and the LHC instantaneous luminosity (see Ref. [7]). The maximum rate is for the top RE4/2 chambers (installed at , where is the azimuthal angle) and it is expected to be Hz/cm2. To evaluate the performances and radiation hardness required to the detector we assume a safety factor of 3 (SF(3)) so that we get a maximum rate of about 600 Hz/cm2.
Experimentally derived data have been used also to validate MC simulation with FLUKA. Experimental rates measured at an instantaneous luminosity of cm-2s-1 have been compared to the MC results with a dedicated CMS Run-2 FLUKA simulation. As it is reported in Ref. [8], a good agreement between the experimental and MC results is observed for the barrel part (up to ), where is the pseudo-rapidity. Some discrepancy is observed in the endcap (), mainly in the overlap region between barrel and endcap (), where MC predicts higher rates. It is caused by some differences in the geometry model with respect to the real detector. On average the discrepancy in the entire endcap region is , but the choice of safety factor overcomes possible problems.
3 Expected hit rates
The base-line HL-LHC (High Luminosity LHC) scenario foresees an instantaneous luminosity of cm-2s-1. Particle fluxes predicted by FLUKA simulation have been convoluted with the RPC sensitivities for a given particle type to obtain the expected hit rate. Two sets of detector sensitivities [9, 10] have been applied – for the upgrade iRPC chambers and the ones from the present RPC system. All values are averaged over azimuthal angle . A similar approach was followed considering ultimate HL-LHC scenario, where the expected instantaneous luminosity is cm-2s-1.
3.1 RPC upgrade region
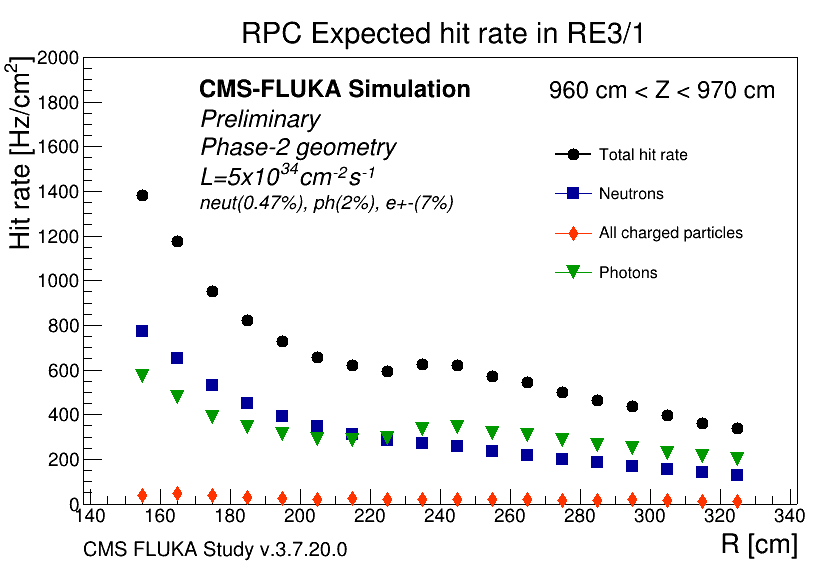
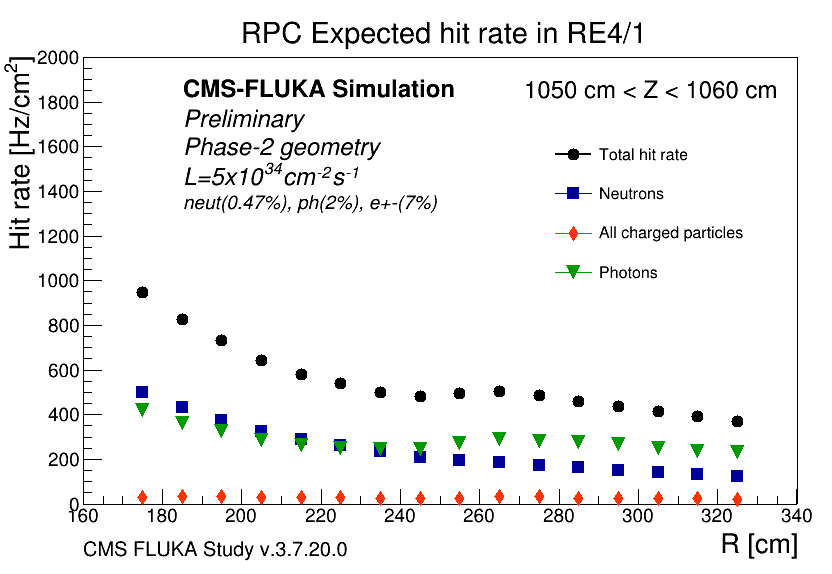
As can be seen in Fig. 2 on the left, the highest hit rate is expected at the lower radius of the iRPC chambers of RE3/1 and it is Hz/cm2. Averaging over the entire radius range the expected rate is Hz/cm2 for RE3/1 and Hz/cm2 for RE4/1. shown on the right of the same figure. Including a SF (safety factor) of the values approach Hz/cm2 and Hz/cm2, respectively. The reported rates are normalized to the chamber area. However, for the choice of detector electronics, the rate per strip is more important. Assuming RE3/1 strips in the range cm R cm, where R is the distance to the beam pipe, and an average strip pitch of cm (see Ref.[11]), the expected rate per strip is kHz, applying an SF of it becomes kHz or hits/bx, where bx ns and corresponds to the detector electronics readout time window. For RE4/1, the expected rate per strip is hits/bx per strip. More details are given in Table 1.
3.2 Present RPC system
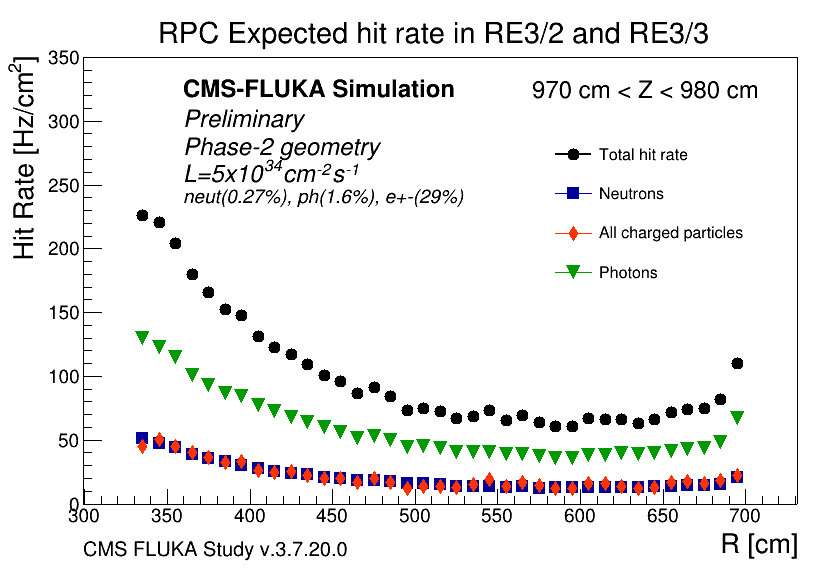
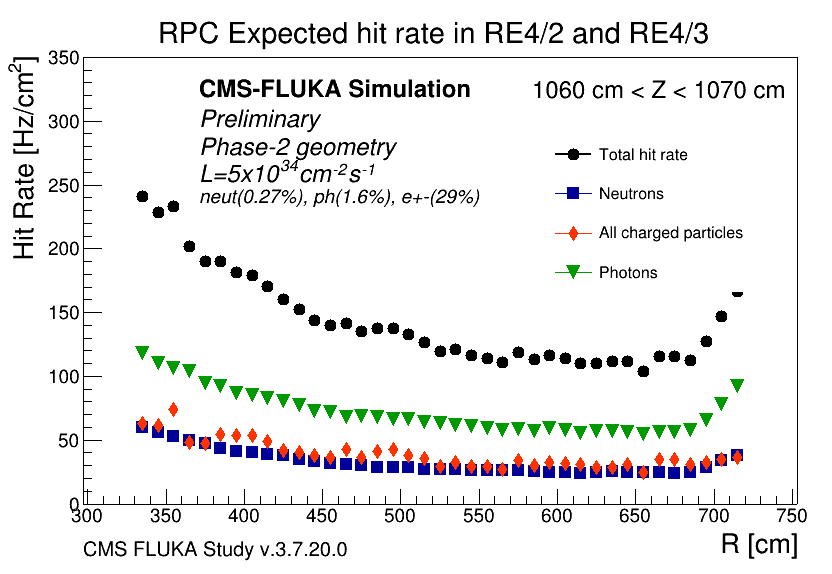
MC predictions at baseline HL-LHC scenario for the third and fourth endcap stations of the present RPC system are shown in Fig. 3. While the hit rate increase at the larger radius is caused mainly by the cavern background, the increase at the lower radius is contributed both by the cavern background and the rate of particles from collisions. The highest rate is expected for the outermost stations, which are mainly affected by the neutron background of the cavern. The maximum expected rate is for RE4/2. Averaging along the strip length, and without a safety factor it is Hz/cm2. This value is comparable with the experimentally derived maximum one ( Hz/cm2) for the RE4/2 top chambers, please see 2. Details for the expected rates and the ultimate HL-LHC scenario are given in Table 1.
| Average rate SF(3) | cm-2s-1 | cm-2s-1 |
|---|---|---|
| RE3/1: in Hz/cm2 | ||
| RE3/1: per strip in Hz | ||
| RE3/1: per strip in hits/bx | ||
| RE4/1: in Hz/cm2 | ||
| RE4/1: per strip in Hz | ||
| RE4/1: per strip in hits/bx | ||
| RE3/2: in Hz/cm2 | ||
| RE4/2: in Hz/cm2 | ||
| RE3/3: in Hz/cm2 | ||
| RE4/3: in Hz/cm2 |
4 Expected Fluence and Absorbed Dose
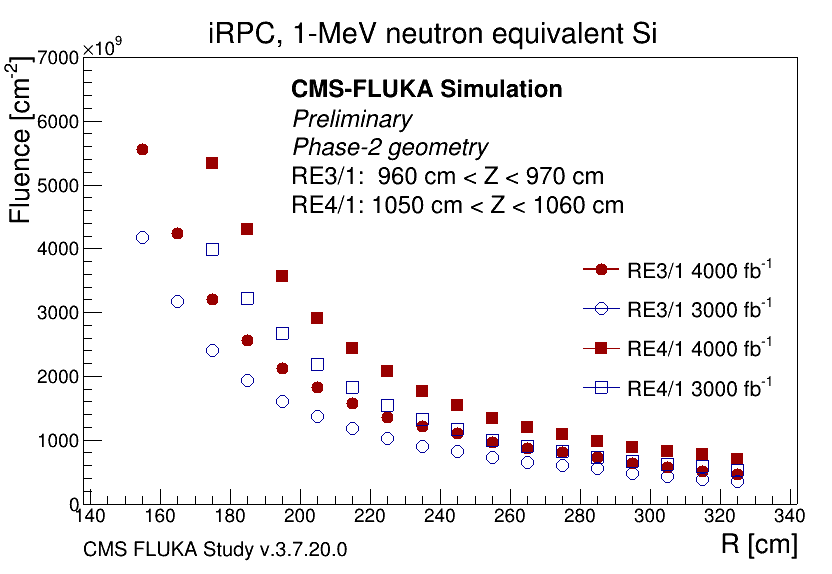
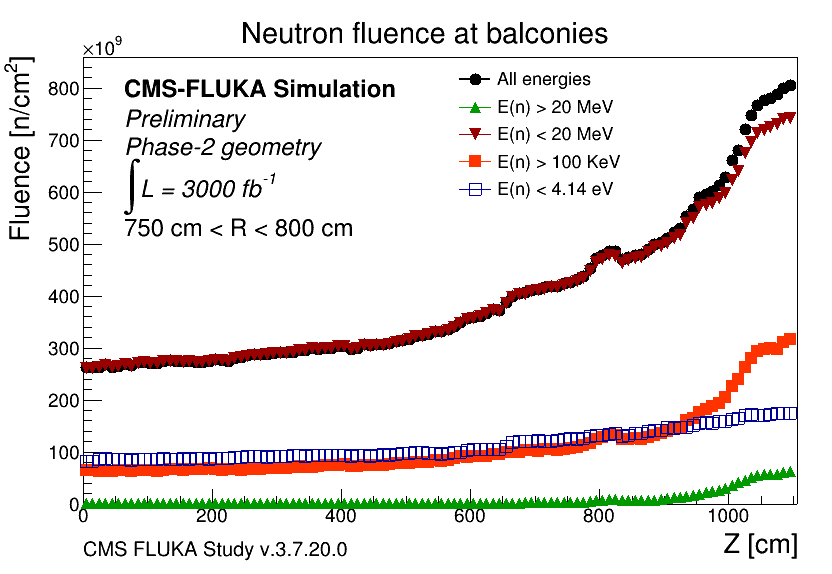
Expected fluence in terms of 1–MeV neutron equivalent in Si for the iRPC chambers is shown in Fig. 4 on the left. The average ratio between the values obtained with ultimate and base HL-LHC scenarios is . Expected fluence at cm for RE3/1 after collecting fb-1 is cm-2, and at cm for RE4/1 is cm-2, where cm are the expected FEB positions. Part of the RPC electronics is installed far from the apparatus but still inside the cavern - on the balconies of the cavern. Though these places are not reached by particles coming from collisions, the neutron-induced background can affect the electronics and lead to potential damages. The usual place where the RPC racks are installed is between cm and cm distance from the beam pipe. The plot in the middle of Fig. 4 represents the expected neutron fluence at balconies after collecting fb-1, where the results are provided in ranges of neutron energy. As can be seen, the relative highest contribution comes from neutrons with energy KeV MeV. Maximum expected fluence in the barrel part ( cm) is below n/cm2, while for the endcap ( cm), the highest expectations are n/cm2, where Z is along the beam pipe and depicts the distance from the interaction point.
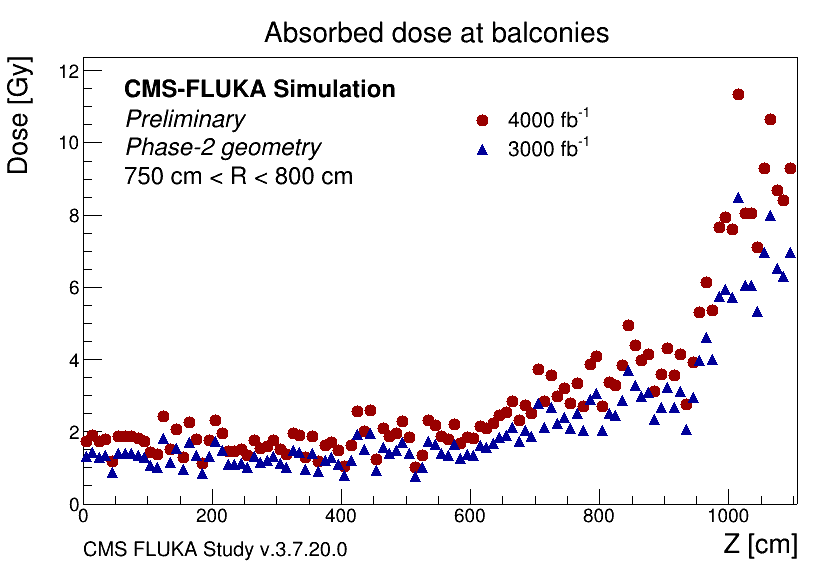
Absorbed dose estimations are biased by the missing details in the geometry description and systematic uncertainties are yet to be assessed. Thus absorbed dose results presented here give only indications about the dose expected values needed for the detector electronic studies. The new results will be reported once the new layers are added to the geometry configuration. The expected absorbed dose after collecting fb-1 at the FEB positions is estimated to be Gy for RE3/1 and Gy for RE4/1. Absorbed dose at balcony regions is shown in Fig. 4 on the right. The maximum expected absorbed dose in the barrel is less than Gy, and in the endcap the highest values are below Gy.
5 Summary
The expected radiation background in the CMS RPC system has been studied in terms of expected particle rates, absorbed dose and fluence. Two HL-LHC scenarios have been investigated - after collecting and fb-1.
Acknowledgments
We would like to congratulate and thank our colleagues from the CMS BRIL group, who manage the CMS FLUKA simulation. We would like to thank also all CMS RPC members for their dedicated work, common efforts and shared experience.
References
- [1] The CMS Collaboration, The CMS experiment at the CERN LHC, JINST 3 (2008).
- [2] CMS Collaboration, The Phase-2 Upgrade of the CMS Muon Detectors. Technical Design Report, CERN-LHCC (2017-012).
- [3] T.T. Böhlen, F. Cerutti, M.P.W. Chin, A. Fassò, A. Ferrari, P.G. Ortega, A. Mairani, P.R. Sala, G. Smirnov and V. Vlachoudis, The FLUKA Code: Developments and Challenges for High Energy and Medical Applications, Nuclear Data Sheets 120 (2014), 211-214.
- [4] A. Ferrari, P.R. Sala, A. Fassò, and J. Ranft, FLUKA: a multi-particle transport code, CERN-2005-10 (2005), INFN/TC_05/11, SLAC-R-773.
- [5] E. Voevodina et al., RE3/1 & RE4/1 RPC chambers integration in the inner region of the forward muon spectrometer in the CMS experiment, JINST 14 (2019), C10027.
- [6] S. Costantini et al., Radiation background with the CMS RPCs at the LHC, JINST 10 (2015), C05031. arxiv:1406.2859.
- [7] R.I. Rabadan-Trejo et al., Long-term performance and longevity studies of the CMS Resistive Plate Chambers, JINST 13 (2018), P08024.
- [8] S. Costantini on behalf of the CMS Collaboration, Background in the CMS muon detectors: simulation and measurements with pp collision data, JINST 15 (2020).
- [9] C. Uribe Estrada et al., RPC radiation background simulations for the high luminosity phase in the CMS experiment, JINST 14 (2019).
- [10] A. Gelmi, E.Voevodina on behalf of the CMS Collaboration, Background rate study for the CMS improved-RPC at HL-LHC using GEANT4, NIMA 936 (2019) 430-432.
- [11] K.Shchablo, I.Laktineh, M.Gouzevitch, C.Combaret, L.Mirabito on behalf of the CMS Muon group, Performance of the CMS RPC upgrade using 2D fast timing readout system, NIMA 958 (2020).