Circumnuclear regions of different BPT types in star-forming MaNGA galaxies: AGN detectability
We consider the circumnuclear regions of star-forming MaNGA galaxies. The spaxels spectra are classified as active-galactic-nucleus-like (AGN-like), H ii-region-like (or SF-like), and intermediate (INT) spectra according to their positions on the Baldwin-Phillips-Terlevich (BPT) diagram. There are the following four configurations of the radiation distributions in the circumnuclear regions in (massive) galaxies: 1) AGN+INT, the innermost region of the AGN-like radiation is surrounded by a ring of radiation of the intermediate type; 2) INT, the central area of radiation of the intermediate type; 3) SF+INT, the inner region of the H ii-region-like radiation is surrounded by a ring of radiation of the intermediate type; and 4) SF, the central area of the H ii-region-like radiation only. The low ionization nuclear emission line regions (LINERs) of configurations 1 and 2 are examined. The spaxel spectra of the LINERs form a sequences on the BPT diagram, that is, they lie along the known AGN-SF mixing line trajectories. The diagnostic line ratios of the spaxels spectra change smoothly with radius, from AGN-like (or INT) line ratios at the galactic center to H ii-region-like at larger galactocentric distances. This is in agreement with the paradigm that the LINERs are excited by AGN activity. We found that the AGN and INT radiation in the circumnuclear region is accompanied by an enhanced gas velocity dispersion . The radius of the area of the AGN and INT radiation is similar to the radius of the area with enhanced , and the central correlates with the luminosity of the AGN+INT area. We assume that the gas velocity dispersion can serve as an indicator of the AGN activity. An appreciable enhancement of was also measured in the SF-type centers of massive galaxies. The values of for the SF-type centers partly overlap with those of the AGN-type centers. This suggests that the manifestation of the circumnuclear region as AGN or as SF on the BPT diagram depends not only on the value of (the level of the AGN activity) but it is also governed by an additional parameter(s). We find that there is a demarcation line between the positions of the AGN-type and SF-type objects on the central gas velocity dispersion – central H surface brightness diagram, in the sense that an object with a given value of is an AGN-type only if the central H surface brightness is lower than some value.
Key Words.:
galaxies: ISM – galaxies: active – galaxies: nuclei1 Introduction
It has been known for a long time that active galactic nuclei (AGNs) are powered by accretion onto supermassive black holes (Zel’dovich 1964; Salpeter 1964; Lynden-Bell 1969). It is believed (e.g., Heckman & Best 2014) that the nuclei of most, quite possibly all, massive galaxies host a central supermassive black hole. Heckman (1980) suggested dividing the AGNs into two classes: Low Ionization Nuclear Emission line Regions (LINERs), and Seyfert galaxies (types I and II), which are high ionization AGNs. The demarcation line between LINERs and Seyferts in different diagrams are discussed in many works (e.g., Kewley et al. 2006; Cid Fernandes et al. 2010).
It is believed at present that Seyfert and LINER phenomena are not fundamentally different in the sense that photoionization is responsible for the emission of both classes of AGNs. It is commonly accepted that the source of the ionizing photons in the Seyferts is the radiation of the accretion disk (Shakura & Sunyaev 1973; Antonucci 1993). On the contrary, the following different sources of the ionizing photons in the LINERs are discussed: the radiation of low-luminosity accretion disk (Ferland & Netzer 1983), the hot, low-mass evolved (postasymptotic giant branch) stars (HOLMES) (Stasińska et al. 2006, 2008; Sarzi et al. 2010; Yan & Blanton 2012; Singh et al. 2013), and shocks caused by different phenomena (jets, galactic winds, galaxy-galaxy interactions) (Heckman 1980; Dopita & Sutherland 1995; Ho et al. 2014; Molina et al. 2018).
The intensities of strong, easily measured lines can be used to separate different types of emission-line objects according to their main excitation mechanism (i.e., starburst or AGN). The most widely used system of spectral classification of emission-line objects is the [O iii]5007/H versus [N ii]6584/H diagnostic diagram suggested by Baldwin, Phillips, and Terlevich (1981) (BPT classification diagram). The excitation properties of objects with the emission line specta are studied by plotting the low-excitation [N ii]6584/H line ratio against the high-excitation [O iii]5007/H line ratio. It was noted (Stasińska et al. 2006, 2008) that the galaxies from the Sloan Digital Sky Survey (York et al. 2000) occupy a well-defined region, evoking the wings of a flying seagull. The left wing consists of star-forming galaxies while the right wing is attributed to galaxies with active nucleus. The exact location of the dividing line between starbursts (H ii regions) and AGNs is still controversial (see, e.g., Kewley et al. 2001; Kauffmann et al. 2003; Stasińska et al. 2006, 2008; Herpich et al. 2016).
The AGNs are revealed in many galaxies using the BPT classification diagram (e.g., Ho et al. 1997; Kauffmann et al. 2003). At the same time, some AGNs are not detected by means of the BPT classification diagram in a number of massive galaxies. Indeed, some galaxies identified as AGNs by their hard X-ray luminosity are not classified as AGN by their optical emission line properties (Elvis et al. 1981; Moran et al. 2002; Pons & Watson 2014, 2016; Agostino & Salim 2019). This suggests that the presence of the AGN in the galaxy does not necessarily result in the appearance of the LINER (or Seyfert) on the BPT diagram.
The Integral Field Unit (IFU) spectroscopy reveals that many galaxies involve low-ionization emission-line regions (LIER) located far from the centers of galaxies (e.g., Belfiore et al. 2016; Hviding et al. 2018; Parkash et al. 2019). This evidences that LIERs are not produced by AGNs, instead, the source of the ionizing photons in the LIERs can be attributed to hot low-mass evolved stars (HOLMES).
Since i) the presence of the AGN is not necessarily accompanied by the LINER (or Seyfert) on the BPT diagram and ii) the LIERs are excited by the HOLMES but not the AGNs then one can suggest that the LINERs (at least some of them) be also attributed to the HOLMES rather than to the AGNs, this is, LINERs differ from LIERs by their locations in galaxies only. Or they differ also by the sources of the ionizing photons. Here we examine the properties of the circumnuclear regions in the MaNGA galaxies with and without detected AGNs aiming to clarify the sources of the ionizing photons in the LINERs and why the AGNs are not detected in some massive galaxies through the BPT classification diagram.
This paper is organized in the following way. The data are described in Section 2. In Section 3 the properties of the circumnuclear regions in the MaNGA galaxies are examined. The discussion is given in Section 4. Section 5 contains a brief summary.
2 Data


The spectroscopic measurements from the SDSS-IV MaNGA survey (Bundy et al. 2015; Albareti et al 2017) provide the possibility to measure the surface brightness distribution and to determine photometric characteristics (such as the optical radius and luminosity), to measure the line-of-sight velocity field and to derive kinematic characteristics (kinematic angles and rotation cuerve), and to measure emission line fluxes and obtain abundance maps. The spectrum of each spaxel is reduced as indicated in Zinchenko et al. (2016). The stellar background is fitted using the public version of the STARLIGHT code (Cid Fernandes et al. 2005; Mateus et al. 2006; Asari et al. 2007) adapted for execution in the NorduGrid ARC111http://www.nordugrid.org/ environment of the Ukrainian National Grid. The library of 150 synthetic simple stellar population (SSP) spectra from the evolutionary synthesis models by Bruzual & Charlot (2003) with ages from 1 Myr up to 13 Gyr and metallicities of , 0.004, 0.008, 0.02, and 0.05 are used. The reddening law of Cardelli et al. (1989) with is adopted. The obtained stellar radiation contribution was subtracted from the observed spectrum.
The emission lines in each spaxel spectrum were estimated using a Gaussian fit to the line profiles. The emission line parameters include the central wavelength , the sigma , and the flux . For each spectrum, we measure the [O ii]3727,3729, H, [O iii]5007, H, and [N ii]6584 emission lines. The measured fluxes in those lines are used for the interstellar reddening correction, the determination of the BPT type of the spectrum (separation of the emission-line objects according to their main excitation mechanism), and for the abundance determination. The central wavelength of the H line is converted into the line-of-sight velocity. The sigma of the best-fit Gaussin specifies the width of the H line (the full width at half maximum FWHM and is linked by the relation FWHM 2.355 ) and is converted into the observed gas velocity dispersion as = (/), where is the speed of light. The observed gas velocity dispersion in the spaxels within the circumnuclear region is corrected for the instrumental profile in the following way = – , where is the median value of the for all the spaxels with the H ii-region-like spectra in the galaxy (see discussion below).
It should be noted that only those spaxel spectra where all the used lines were measured with a signal-to-noise ratio S/N were considered. The measured emission line fluxes were corrected for interstellar reddening using the theoretical H/H ratio and the reddening function from Cardelli et al. (1989) for = 3.1. We assume (Lee et al. 2005).
The oxygen abundances were obtained through the three-dimensional calibration (Pilyugin & Grebel 2016; Pilyugin et al. 2018). The [O ii]3727,3729, H, [O iii]4959,5007, and [N ii]6548,6584 emission lines are used for oxygen abundance determinations. The flux in the [O iii]4959,5007 lines is estimated as [O iii]4959,5007 = 1.3[O iii]5007 and the flux in the [N ii]6548,6584 lines is estimated as [N ii]6548,6584 = 1.3[N ii]6584 (Storey & Zeippen 2000). The -calibration produces abundances compartible to the -based abundance scale and is workable over the whole metallicity scale of H ii regions.
To determine the galactocentric distances of the spaxels, the geometrical parameters of the galaxy are needed. The parameters of the galaxy are determined from the observed velocity field in the standard way assuming that a galaxy is a symmetrically rotating disc (e.g., Warner et al. 1973; Begeman 1989; de Blok et al. 2008; Oh et al. 2018). The position of the kinematic center of the galaxy, the position angle of the major kinematic axis and the kinematic inclination angle are determined from the measured line-of-sight velocities of the H line in the same way as in our previous papers (Pilyugin et al. 2019, 2020; Zinchenko et al. 2019). In brief, the observed line-of-sight velocities recorded on a set of pixel coordinates (1 pixel = 0.5 arcsec for MaNGA galaxies) are related to the kinematical parameters of the galaxy and its rotation curve. The deprojected galaxy plane is divided into rings with a width of one pixel. The rotation velocity is assumed to be the same for all the points within the ring. The position angle of the major axis and the galaxy inclination angle are assumed to be the same for all the rings. The coordinates of the rotation center of the galaxy, the position angle of the major axis, the galaxy inclination angle, and the rotation curve are derived through the best fit to the observed velocity field. All the spaxels with measured line-of-sight velocities are ased.
The distances to the galaxies were adopted from ned. The ned distances use flow corrections for Virgo, the Great Attractor, and Shapley Supercluster infall (adopting a cosmological model with km/s/Mpc, , and ).
The SDSS data base provides values of the stellar masses of its target galaxies determined in different ways. We have chosen the spectroscopic masses of the SDSS and BOSS galaxies (BOSS stands for the Baryon Oscillation Spectroscopic Survey in SDSS-III, see Dawson et al. 2013). The spectroscopic masses, , are the median (50th percentile of the probability distribution function, PDF) of the logarithmic stellar masses from table stellarMassPCAWiscBC03 determined by the Wisconsin method (Chen et al. 2012) with the stellar population synthesis models from Bruzual & Charlot (2003).
We selected a sample of MaNGA galaxies to be analyzed by considering
the surface brightness maps, the line-of-sight gas velocity fields,
the distribution of the spaxels of the AGN-like, H ii-region-like,
and intermediate spectra on the image of the MaNGA galaxies, and finally, the
type of spectra at the center of the galaxies.
First, we search for galaxies with intermediate and AGN-like spectra at the
centers. The circumnuclear region in such galaxy is defined as the central region
involving the spaxels with AGN-like and intermediate spectra.
The map of the distributions of the spaxels with the AGN-like, H ii-region-like,
and intermediate spectra on the images for around three thouthands MaNGA galaxies of
the DR15 release were constructed. We search for galaxies with intermediate and AGN-like
spectra at the centers by visual inspection of those maps.
Then we selected galaxies using the following criteria.
Only the star-forming galaxies (where emission lines are measured in
spectra of more than hundred spaxels) were considered, since the characteristics
to be analyzed (emission line ratios, gas velocity dispersion, luminosities
and surface brightnesses in the emission lines) are based on emission lines.
Galaxies measured with a small number of fibers (19 and 37) were excluded.
In order to exclude a peculiar and strongly interacting or merging galaxies,
we required that the surface brightness distribution is centrally symmetric and smooth
and the line-of-sight gas velocity field are rather regular, this is, the isovelocity
curves of the measured velocity field are more or less close to a set of parabolic
curves (the hourglass-like picture for a rotating disc).
We required that the spaxels with measured emission lines cover an area larger
than the circumnuclear region,
this is, the circumnuclear region is measured entirely and does not extend
beyond the measured area.
We also required that the emission lines measurements were available for all (or at least for the
majority of) the spaxels within the circumnuclear area.
Under those conditions, the circumnuclear area (the central region with the AGN-like and intermediate spectra)
can be outlined and its characteristics (e.g., luminosity) can be obtained.
We selected 85 MaNGA galaxies with those criteria.
The emission line profiles of the spectra at the centers of the majority of galaxies
with AGN-like and intermediate spectra selected with the above criteria
are rather simple (panels a and b of Fig. 1)
and can be fitted by single Gaussians.
A broad component can be seen in the emission line profiles in the spaxel spectra
at the centers of some selected galaxies
(panels c and d of Fig. 1).
Galaxies with a broad component in the emission line spectra at the center were excluded
from the current consideration. The single Gaussian is not adequate approximation
for the profile of the emission line with a broad component, such lines should be fitted
by two Gaussians. The investigation of the properties of the AGNs with the broad
components in the emission lines should be the subject of the separate study. For the same reason,
the galaxies classified as Seyfert galaxies according to the BPT diagram were also excluded
from the current consideration.
Our final list includes 46 galaxies with the circumnuclear region with AGN-like radiation, and 17 galaxies with the circumnuclear region of the intermediate type. The selected galaxies are listed in Tables 1 and 2 .
For comparison purposes, we also consider 98 galaxies with the circumnuclear region with the H ii region-like radiation. Those galaxies are selected using the same criteria as the galaxies with LINERs, except with the requirement for H ii region-like spectra at the center.
| Name | d | Msp | RAGN | RINT | R | logLAGN,Ha | logLINT,Ha | log | log | log | |
|---|---|---|---|---|---|---|---|---|---|---|---|
| (Mpc) | (M☉) | () | (kpc) | (kpc) | (kpc) | (erg/s) | (erg/s) | (L) | km/s | km/s | |
| 7495 12704 | 127.5 | 10.87 | 57.5 | 1.35 | 3.07 | 2.32 | 39.39 | 40.07 | -0.902 | 2.019 | 1.852 |
| 7960 12701 | 136.8 | 10.97 | 30.4 | 0.94 | 2.12 | 2.16 | 39.21 | 39.83 | -0.884 | 1.729 | 1.859 |
| 7968 06101 | 209.4 | 10.81 | 29.9 | 0.87 | 2.90 | 2.80 | 38.98 | 40.13 | -0.929 | 1.852 | 1.864 |
| 8078 06103 | 113.2 | 10.95 | 53.3 | 0.98 | 2.02 | 2.33 | 39.87 | 40.40 | -0.302 | 1.885 | 1.902 |
| 8083 12704 | 91.4 | 10.86 | 31.7 | 1.18 | 2.15 | 1.89 | 39.29 | 39.73 | -0.763 | 1.874 | 1.839 |
| 8140 12703 | 133.3 | 11.22 | 52.5 | 2.12 | 3.92 | 3.07 | 40.28 | 40.52 | 0.014 | 2.141 | 1.855 |
| 8144 12703 | 160.0 | 11.37 | 24.4 | 0.79 | 1.64 | 1.75 | 39.40 | 40.04 | -0.453 | 1.943 | 1.844 |
| 8146 12702 | 257.6 | 11.24 | 53.6 | 0.91 | 3.39 | 4.07 | 39.58 | 40.63 | -0.425 | 2.086 | 1.867 |
| 8158 12702 | 307.1 | 11.31 | 36.9 | 1.69 | 3.48 | 3.36 | 39.84 | 40.44 | -0.666 | 2.163 | 1.855 |
| 8243 12701 | 186.4 | 11.64 | 69.4 | 2.78 | 4.82 | 4.75 | 40.25 | 40.63 | -0.482 | 2.038 | 1.876 |
| 8249 12704 | 114.1 | 11.13 | 34.4 | 1.71 | 3.03 | 2.91 | 39.45 | 39.95 | -1.154 | 1.971 | 1.859 |
| 8257 06101 | 124.8 | 10.54 | 43.7 | 0.57 | 1.62 | 1.67 | 38.95 | 39.87 | -0.623 | 1.964 | 1.872 |
| 8257 12705 | 153.6 | 10.93 | 70.2 | 1.25 | 3.25 | 3.91 | 39.79 | 40.43 | -0.469 | 1.913 | 1.860 |
| 8313 09101 | 164.7 | 10.98 | 44.3 | 0.80 | 2.58 | 2.60 | 39.72 | 40.52 | -0.225 | 2.106 | 1.868 |
| 8313 09102 | 143.2 | 10.92 | 43.4 | 2.11 | 3.68 | 2.61 | 39.66 | 40.19 | -0.968 | 2.019 | 1.861 |
| 8318 12703 | 167.3 | 11.36 | 50.5 | 1.81 | 3.06 | 4.26 | 39.36 | 39.95 | -1.227 | 2.027 | 1.854 |
| 8320 09102 | 222.9 | 11.31 | 48.0 | 2.44 | 4.35 | 3.52 | 39.77 | 40.30 | -0.996 | 2.146 | 1.856 |
| 8326 09102 | 300.3 | 11.26 | 28.8 | 2.19 | 3.77 | 4.01 | 39.50 | 40.02 | -1.288 | 2.101 | 1.827 |
| 8332 12705 | 143.2 | 11.13 | 41.4 | 1.57 | 2.68 | 2.26 | 39.79 | 40.27 | -0.515 | 2.067 | 1.856 |
| 8444 06102 | 112.7 | 10.68 | 68.0 | 0.56 | 2.35 | 2.60 | 38.91 | 40.03 | -0.667 | 1.850 | 1.885 |
| 8448 12703 | 308.4 | 11.18 | 64.7 | 2.33 | 4.91 | 4.12 | 39.67 | 40.26 | -1.307 | 2.092 | 1.861 |
| 8484 12702 | 238.7 | 11.09 | 55.4 | 2.03 | 4.90 | 3.77 | 39.56 | 40.23 | -1.098 | 2.046 | 1.851 |
| 8550 06103 | 108.6 | 10.67 | 40.8 | 1.05 | 1.65 | 1.45 | 39.73 | 40.09 | -0.356 | 2.040 | 1.896 |
| 8550 12702 | 131.9 | 11.15 | 66.1 | 1.94 | 2.79 | 3.04 | 40.22 | 40.38 | -0.202 | 2.004 | 1.910 |
| 8550 12705 | 130.1 | 11.34 | 54.8 | 1.86 | 2.76 | 2.68 | 39.80 | 40.20 | -0.857 | 2.110 | 1.866 |
| 8591 06104 | 180.5 | 11.04 | 38.0 | 0.88 | 2.31 | 2.85 | 39.11 | 40.16 | -0.871 | 1.933 | 1.861 |
| 8601 12705 | 129.1 | 10.80 | 66.7 | 1.56 | 3.68 | 3.91 | 39.45 | 40.10 | -0.874 | 1.888 | 1.859 |
| 8612 12702 | 264.5 | 11.30 | 37.2 | 2.95 | 4.50 | 4.17 | 40.27 | 40.61 | -0.636 | 2.040 | 1.842 |
| 8713 06102 | 295.4 | 11.24 | 38.5 | 2.54 | 5.09 | 3.95 | 39.83 | 40.51 | -0.968 | 2.073 | 1.850 |
| 8714 06102 | 215.9 | 11.52 | 34.8 | 1.42 | 2.42 | 2.36 | 40.22 | 40.63 | -0.205 | 2.034 | 1.860 |
| 8719 06103 | 247.3 | 11.46 | 33.6 | 1.57 | 3.40 | 2.70 | 40.02 | 40.77 | -0.455 | 2.099 | 1.884 |
| 8977 06103 | 253.5 | 11.25 | 31.8 | 1.36 | 3.28 | 4.00 | 39.48 | 40.41 | -0.860 | 1.818 | 1.874 |
| 8979 12701 | 325.2 | 11.36 | 50.6 | 3.49 | 6.56 | 5.92 | 39.74 | 40.48 | -1.547 | 2.076 | 1.836 |
| 8984 12705 | 158.3 | 11.29 | 36.5 | 1.85 | 3.27 | 3.27 | 40.04 | 40.57 | -0.543 | 2.173 | 1.860 |
| 8996 12705 | 199.8 | 11.14 | 59.5 | 2.57 | 4.85 | 4.12 | 39.54 | 40.35 | -1.380 | 2.016 | 1.855 |
| 8997 12701 | 199.8 | 11.14 | 56.8 | 1.85 | 4.81 | 3.15 | 39.37 | 40.37 | -1.248 | 2.009 | 1.858 |
| 8999 06103 | 278.9 | 11.55 | 68.6 | 2.89 | 5.58 | 6.43 | 40.47 | 40.93 | -0.586 | 2.007 | 1.928 |
| 9028 12701 | 204.9 | 10.63 | 35.6 | 0.93 | 2.62 | 2.74 | 39.09 | 39.95 | -0.916 | 1.972 | 1.851 |
| 9041 12703 | 237.8 | 10.87 | 60.8 | 2.13 | 4.16 | 3.75 | 39.94 | 40.50 | -0.805 | 1.909 | 1.846 |
| 9042 09102 | 136.2 | 10.81 | 58.3 | 1.09 | 2.41 | 3.14 | 39.13 | 39.98 | -0.992 | 1.891 | 1.866 |
| 9049 12702 | 378.0 | 11.33 | 49.7 | 2.87 | 5.82 | 6.88 | 40.44 | 40.89 | -0.609 | 2.098 | 1.835 |
| 9183 12702 | 137.4 | 10.85 | 54.1 | 0.74 | 2.11 | 2.83 | 39.37 | 40.22 | -0.401 | 1.871 | 1.892 |
| 9500 06103 | 270.2 | 11.42 | 17.3 | 0.76 | 2.42 | 3.61 | 39.61 | 40.57 | -0.224 | 1.808 | 1.852 |
| 9505 12701 | 191.2 | 11.29 | 68.4 | 1.88 | 4.33 | 4.87 | 39.31 | 40.26 | -1.230 | 2.008 | 1.888 |
| 9870 09101 | 157.3 | 11.08 | 35.2 | 2.21 | 3.18 | 2.10 | 40.20 | 40.42 | 0.001 | 2.146 | 1.863 |
| 9881 06102 | 119.2 | 11.00 | 20.5 | 0.81 | 1.36 | 1.30 | 39.82 | 40.29 | -0.056 | 2.025 | 1.868 |
| Name | d | Msp | RINT | R | logLINT,Ha | log | log | log | |
|---|---|---|---|---|---|---|---|---|---|
| (Mpc) | (M☉) | () | (kpc) | (kpc) | (erg/s) | (L) | km/s | km/s | |
| 8077 12704 | 97.2 | 10.38 | 31.0 | 1.77 | 2.24 | 39.41 | -1.200 | 1.744 | 1.844 |
| 8080 06104 | 147.4 | 11.09 | 29.6 | 1.22 | 1.61 | 40.06 | -0.344 | 1.959 | 1.862 |
| 8085 12704 | 123.5 | 10.66 | 60.6 | 1.84 | 2.25 | 39.98 | -0.498 | 1.915 | 1.859 |
| 8135 12703 | 210.1 | 10.69 | 55.9 | 2.43 | 3.32 | 39.72 | -1.326 | 1.849 | 1.837 |
| 8137 12703 | 158.7 | 10.89 | 45.1 | 2.25 | 2.89 | 40.12 | -0.618 | 1.927 | 1.853 |
| 8138 12704 | 128.3 | 11.36 | 54.3 | 1.13 | 2.34 | 40.06 | -0.096 | 2.140 | 1.872 |
| 8141 12704 | 199.1 | 10.63 | 41.4 | 1.41 | 3.62 | 39.58 | -0.830 | 1.734 | 1.852 |
| 8329 06103 | 135.3 | 10.57 | 54.8 | 1.48 | 2.13 | 39.95 | -0.530 | 1.883 | 1.895 |
| 8623 06104 | 398.5 | 11.28 | 34.1 | 2.32 | 4.36 | 41.05 | 0.265 | 2.094 | 1.871 |
| 8990 09102 | 139.8 | 10.69 | 49.0 | 0.85 | 2.21 | 39.69 | -0.272 | 1.897 | 1.870 |
| 9027 12701 | 136.3 | 11.00 | 43.7 | 1.16 | 1.82 | 40.09 | -0.139 | 1.896 | 1.867 |
| 9039 06102 | 261.3 | 11.34 | 41.2 | 2.64 | 3.49 | 40.63 | -0.242 | 2.159 | 1.903 |
| 9041 12702 | 137.6 | 10.88 | 59.7 | 0.84 | 2.84 | 39.52 | -0.421 | 1.819 | 1.882 |
| 9042 12702 | 309.3 | 11.02 | 53.4 | 2.51 | 4.88 | 40.79 | 0.042 | 2.031 | 1.867 |
| 9500 09102 | 180.1 | 10.21 | 40.8 | 1.20 | 3.28 | 39.71 | -0.590 | 1.630 | 1.872 |
| 9506 09102 | 113.5 | 10.29 | 67.2 | 1.00 | 3.99 | 39.41 | -0.662 | 1.483 | 1.871 |
| 9868 12705 | 306.1 | 11.13 | 48.1 | 1.98 | 4.83 | 40.61 | -0.069 | 2.040 | 1.884 |
3 Circumnuclear regions of different BPT types
3.1 BPT types
The intensity of strong, easily measured lines can be used to separate different types of emission-line objects according to their main excitation mechanism (i.e. starburst or AGN). Baldwin, Phillips, and Terlevich (1981) proposed a diagram (BPT classification diagram) where the excitation properties of H ii regions are studied by plotting the low-excitation [N ii]6584/H (= XBPT) line ratio against the high-excitation [O iii]5007/H (= YBPT) line ratio.
Kauffmann et al. (2003) found an empirical demarcation line between the star forming and the AGN spectra in the BPT diagram (solid line in panel c of Fig. 2). This demarcation line can be interpreted as the upper limit of pure star forming spectra (Davies et al. 2014a, b, 2016). The spectra located left (below) the demarcation line of Kauffmann et al. (2003) will be referred to as the SF-like or H ii region-like spectra (blue points in panel c of Fig. 2). Kewley et al. (2001) found a theoretical demarcation line between the star forming and the AGN spectra in the BPT diagram (short-dashed line in panel c of Fig. 2). This demarcation line can be interpreted as the lower limit of pure AGN spectra. The spectra located right (above) the demarcation line of Kewley et al. (2001) will be referred to as the AGN-like spectra (black points in panel c of Fig. 2). The spectra located between the demarcation lines of Kauffmann et al. (2003) and Kewley et al. (2001) will be referred to as the intermediate (INT) spectra (red points in panel c of Fig. 2). In the literature, those spectra are also referred to as composite or transition spectra (Davies et al. 2014a; Pons & Watson 2014, 2016). The long-dashed line in panel c of Fig. 2 is the dividing line between Seyfert galaxies and LINERs defined by Cid Fernandes et al. (2010).
Here we examine the circumnuclear regions in MaNGA galaxies. Using the BPT classification diagram, the circumnuclear regions are divided into three BPT types: the AGN type, the SF (or H ii) type, and the intermediate (INT) type.
3.2 Circumnuclear regions of the AGN type
3.2.1 Characteristics of the circumnuclear region
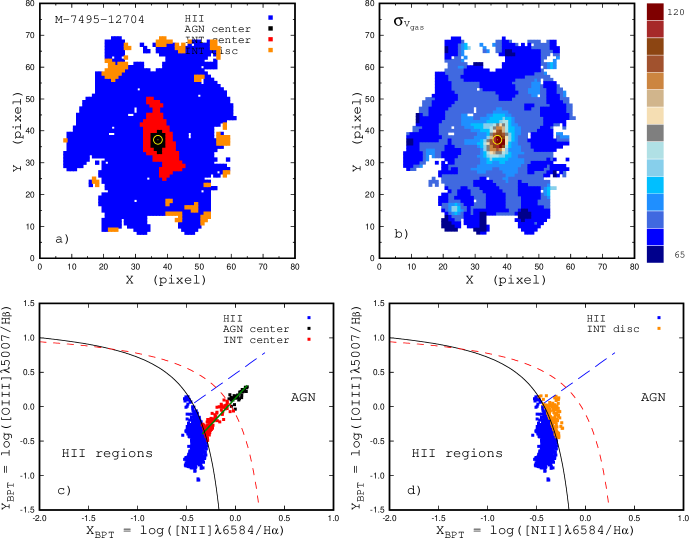
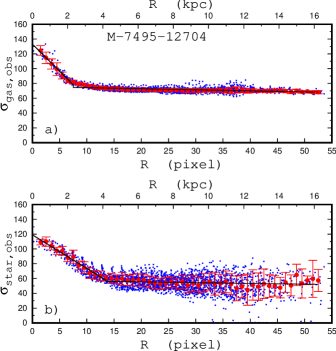
Panel a of Fig. 2 shows the location of the spaxels with the AGN-like, H ii-region-like, and intermediate spectra on the image of the galaxy M-7495-12704, where the circumnuclear region is of the AGN type. The BPT classification of each spectra is color-coded. The spaxels with the AGN-like (intermediate) spectra in the circumnuclear region (center) and in the disc are shown by different colors. The circle marks the kinematic center of the galaxy. Panel b of Fig. 2 shows a map of the observed (non corrected for instrumental profile) gas velocity dispersion. The value of gas velocity dispersion is color-coded. Fig. 3 shows the radial variation of several measured properties of this galaxy.
The circumnuclear region with an AGN-induced radiation can be specified by a number of parameters as indicated below. The luminosity of the circumnuclear region with an AGN-induced radiation will be specified by the following parameters. The luminosity is defined as the sum of the H luminosities of the spaxels with AGN-like spectra in the circumnuclear region. The luminosity is defined as the sum of the H luminosity of the spaxels with AGN-like and intermediate spectra in the circumnuclear region. The and luminosities in the [O iii]4959,5007 lines are determined in a similar way using the [O iii]5007 line measurement and adopting = 1.3 (Storey & Zeippen 2000). It is believed that the H emission within the circumnuclear region is likely to be strongly contaminated by star formation, whereas the [O iii] emission is less contaminated and is therefore a better indicator of the AGN luminosity.
The size of the circumnuclear region with an AGN-induced radiation will be specified by two radii. Since the shape of the circumnuclear region with an AGN-induced radiation can deviate significantly from the ring on the deprojected plane (ellipses in the observed plane) then we define the radius as the radius of the ring with an area equal to the area covered by the spaxels with the AGN-like spectra. The radius specifies the size of the zone where the AGN-induced radiation makes a dominant contribution to the emission spectra. Similarly, we define the radius as the radius of the ring with the area equal to the area covered by the spaxels with the AGN-like and intermediate spectra. The radius specifies the size of the zone where the AGN-induced radiation makes a contribution to the emission spectra large enough such that the spectra are classified as INT type. In other words, the radius is the radius of influence of AGN.
The determination of the radius can meet the following difficulty. It was noted above that the discs of many galaxies involve low-ionization emission-line regions (LIER) excited by the HOLMES. If the LIER adjoins to the LINER then the central area covered by the spaxels with the AGN-like and the intermediate spectra (and, consequently, the radius ) will be overestimated. This seems take place in the galaxy M-7495-12704, the north part of the circumnuclear region may be an adjoining LIER (panel a of Fig. 2).
Panel c of Fig. 3 shows that the observed (non corrected for the instrumental profile) gas velocity dispersion decreases with galactocentric distance up to some radius and remains approximately constant beyond this radius. The radius of the region with enhanced gas velocity dispersion is estimated for each galaxy. The radial distribution of the is fitted with a broken line, and the radius where the break occurs is adopted as the . To minimize the influence of errors in the H line width measurements in the spectra of individual spaxels on the determination of the , the median values of the within rings with width of 1 spaxel are determined (panel a of Fig. 4), and the broken line fit to those median values is obtained.
The gas velocity dispersion within the circumnuclear region can be also specified by the maximum value of the gas velocity dispersions. Again, to minimize the influence of errors in the H line width measurements in the spectra of individual spaxels on this parameter, we specify the gas velocity dispersion within the circumnuclear region by the mean value of the gas velocity dispersions in five spaxels in the circumnuclear region with higher and will refer to this parameter as the central gas velocity dispersion . The median value of the observed (non corrected for the instrumental profile) gas velocity dispersion for all the spaxels of the H ii-region-like spectra, , is also obtained for each galaxy.
The radial distribution of the observed stellar velocity dispersion is also fitted by the broken line, and the break radius is adopted as the (panel b of Fig. 4). The uncertainty in is much larger than that in (panels a and b of Fig. 4). There are no a plateaus in the – R diagrams, and t he observed stellar velocity dispersions are below the MaNGA instrumental dispersion in many cases (Westfall et al. 2019). A reliable estimation of the value was not obtained for a several galaxies in our sample.
The measured flux in the H line per spaxel in units 10-17 erg/s/cm2/spaxel is converted into surface brightness in the H line . The value of the surface brightness is corrected for the galaxy inclination. The central surface brightness is specified by the mean values of for the same five spaxels used for estimation of the . The central surface brightness in the [O iii]4959,5007 lines is also determined adopting again = 1.3.
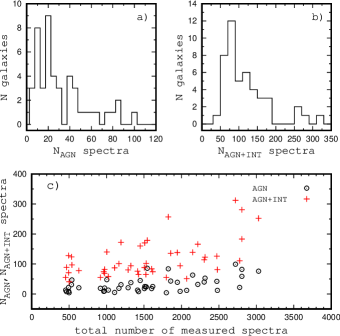
Thus, the luminosities and in the H and [O iii]4959,5007 emission lines, the radii , , , and , the central gas velocity dispersion , the central surface brightnesses in the H line and in the [O iii]4959,5007 lines , and the median value of the observed (non corrected for the instrumental profile) gas velocity dispersions in all the spaxels for the H ii-region-like spectra were determined for the circumnuclear regions of the AGN type for our sample of MaNGA galaxies. The numbers of the AGN-like and intermediate spectra within the circumnuclear regions and the total numbers of measured spectra in the galaxies with the circumnuclear regions of the AGN type are presented in Fig. 5.
| correlation | scatter | ||||
| coefficient | in | ||||
| Relations in Fig. 7 | |||||
| log | 0.00950.0021 | 38.680.23 | 0.555 | 0.332 | |
| log | 0.00500.0016 | 39.790.17 | 0.424 | 0.249 | |
| log | 0.01000.0023 | 38.460.25 | 0.539 | 0.364 | |
| log | 0.00600.0018 | 39.300.19 | 0.454 | 0.276 | |
| Relations in Fig. 8 | |||||
| log | log | 0.3240.060 | -12.682.40 | 0.629 | 0.160 |
| log | log | 0.3340.051 | -13.032.01 | 0.703 | 0.146 |
| log | log | 0.3020.074 | -11.663.00 | 0.522 | 0.136 |
| log | log | 0.2880.064 | -11.012.55 | 0.562 | 0.131 |
| log | log | 1.1020.247 | -2.0330.496 | 0.558 | 0.171 |
| log | log | 0.6280.210 | -0.7580.421 | 0.412 | 0.145 |
3.2.2 AGN-SF mixing
The positions of the AGN-like and intermediate spectra of the spaxels in the circumnuclear region occupy a rather narrow band in the BPT diagram, see panel c in Fig. 2. This sequence on the BPT diagram can be fitted by the linear relation
| (1) |
Such relation (coefficients and in Eq. 1) was obtained for all galaxies with the circumnuclear regions of the AGN type. It should be emphasized that the spaxels with the intermediate spectra in the disc (beyond the circumnuclear region) do not follow this relation, see panel d in Fig. 2.
Kauffmann & Heckman (2009) created a set of empirical mixing line trajectories in the BPT diagram by averaging the emission-line fluxes of star-forming galaxies and AGNs in different proportions. The decrease of the fraction of the luminosity attributed to SF results in a shift from the locus of pure star-forming galaxies in the BPT diagram. The greater the fraction of the line emission excited by AGN activity, the further along the mixing trajectory a spectrum will lie.
Davies et al. (2014a, b, 2016) found that spectra of individual spaxels of some AGN host galaxies form a tight sequence on the BPT diagram, which is similar to the mixing line trajectories constructed by Kauffmann & Heckman (2009) for “global” spectra. The diagnostic line ratios in the spaxel spectra change smoothly with radius, from AGN-like ratios in the spaxel spectra at the galactic center, to H ii-like ratios in the spaxel spectra at larger galactocentric distances. Davies et al. (2014a, b, 2016) concluded that this provides strong evidence in favor of variations of diagnostic line ratios with radius being primarily driven by variations in the fraction of the line emission excited by AGN activity.
Panels c and d in Fig. 3 show the variations in the diagnostic line ratios [N ii]6584/H and [O iii]5007/H in the spectra of spaxels from the circumnuclear region of the galaxy M-7495-12704 as a function of galactocentric distance, respectively. Inspection of panel b in Fig. 2 together with panels c and d in Fig. 3, show clearly that the diagnostic line ratios of the spaxel spectra change smoothly with radius, this is, the spaxel spectra of the circumnuclear region lie along the mixing line trajectories of the BPT diagram, where the fraction of the line emission excited by AGN activity decreases with radius. It should be emphasized that the same radial behavior in the diagnostic lines was obtained for every one of the galaxies in our sample where the circumnuclear region is of the AGN-type.
The diagnostic line ratios in the spaxel spectra change smoothly with the radius within the circumnuclear region, and the gas velocity dispersion decreases with galactocentric distance within the circumnuclear region, that is, the diagnostic line ratios correlate with gas velocity dispersion. It is worth noting that such a correlation is not only related to AGN excited regions. A correlation between gas velocity dispersion and emission-line ratio is revealed in the ultraluminous and luminous infrared galaxies in the absence of any contribution from an AGN. This correlation is interpreted as a signature of shock excitation where shocks are driven by galaxy mergers or interactions (Monreal-Ibero et al. 2006, 2010; Rich et al. 2014, 2015).
The relations that were obtained above between and , Eq. (1), describe the mixing line trajectories on the BPT diagram for galaxies with the circumnuclear region of the AGN-type, see panel c in Fig. 2. Next, we examine the dependences between the slope of the mixing line trajectory on the BPT diagram with other properties of the galaxy (the slope of the relation = + as a function of the stellar mass of the galaxy, H luminosity of the AGN zone, central gas velocity dispersion, and central surface brightness in the H line). We find that there is not a significant corrrelation between the slope of the mixing line trajectory on the BPT diagram with other parameters of the galaxy.
3.2.3 Gas velocity dispersion as an indicator of AGN activity
The characteristics of a galaxy with an AGN can be divided into two groups. The parameters of the first group (e.g., stellar mass, ) specify the host galaxy. The parameters of the second group (e.g., luminosity, , or radius of the influence of the AGN, ) specify the level of the AGN activity.
Faber-Jackson relations link the luminosity (mass) and the stellar velocity dispersion in elliptical galaxies and in the bulges of disc galaxies (Faber & Jackson 1976; Kormendy 1985). It is also established that the mass of supermassive black holes correlates tightly with the stellar velocity dispersion of the host galaxy (e.g., Ferrarese & Merritt 2000; Tremaine et al. 2002; King & Pounds 2015; Sahu et al. 2019). Therefore, the stellar velocity dispersion specifies the host galaxy and belongs to the first group of parameters.
It was suggested (Nelson & Whittle 1996) to use the width of the [O iii]5007 emission line as a surrogate for for Seyfert galaxies. Bennert et al. (2018) carried out a direct comparison between and and found that there is no correlation between and . On the other hand, Ilha et al. (2019) have found that the fractional difference between gas and star velocity dispersions = ( – )/ can be used as an indicator of AGN activity. Here we examine the relationships between the gas velocity dispersion and other parameters for our sample of MaNGA galaxies. Among other things, this can tell us if the gas velocity dispersion in the LINERs is an indicator of the (gaseous) bulge (belongs to the first group of parameters) or the AGN activity (belongs to the second group of parameters).
The energy generation by an AGN (and consequently its influence on the circumnuclear region) depends on mass of the black hole and acretion rate. A significant correlations exist between the mass of the black hole and some properties of the host galaxy, such as stellar mass or stellar velocity dispersion. Therefore, examination of correlations between and those properties cannot provide the choice whether the is a tracer of AGN activity (related to the black hole mass) or is a tracer of gaseous bulge (related to the host galaxy properties). At the same time, the existence of correlations between and direct characteristics of the AGN activity, such as AGN luminosity and radius of AGN influence, can be considered as a significant evidence in favor of that the is a tracer of AGN activity.
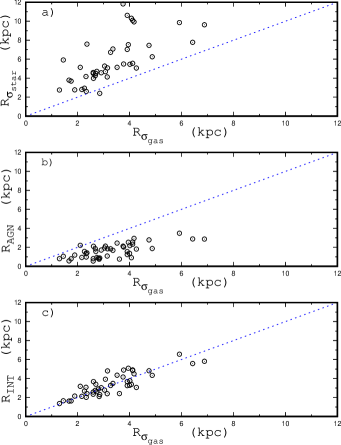
Fig. 6 shows the comparison between the radius of the zone with enhanced gas velocity dispersion and the radii of other zones in the galaxies. Inspection of panel a in Fig. 6 shows that the radius of the zone with enhanced gas velocity dispersion is smaller than the radius of the zone with enhanced stellar velocity dispersion . Examination of panel b in Fig. 6 shows that the exceeds the size of the zone with dominant contribution of AGN to the radiation . Panel c of Fig. 6 shows that is very similar to the radius of the zone of the influenc of the AGN on the radiation .
Thus, the radius of the zone with enhanced gas velocity dispersion is related to the radius of the zone of the influence of the AGN on the radiation .
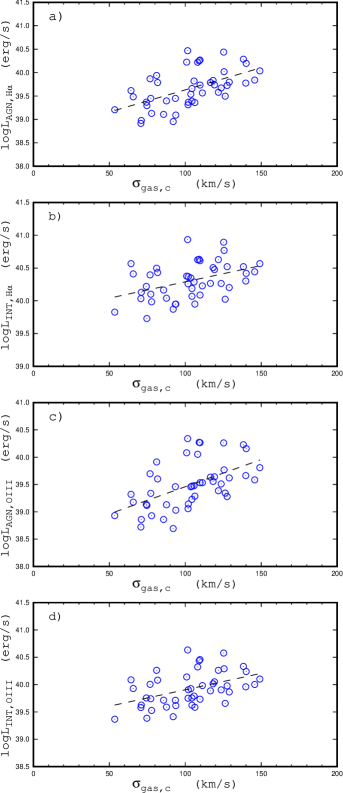
Fig. 7 shows the luminosity of the H and the [O iii]4959,5007 emission lines for the zone with the dominant AGN contribution to the radiation, , and of the zone of the influence of AGN, , as a function of the central gas velocity dispersion . In each panel, the circles correspond to individual galaxies, and the line is the best fit to those data. Coefficients for the linear correlations of the type log = , the correlation coefficient, and the mean value of the scatter in log for each diagram are listed in Table 3. Every one of those luminosities (, , , ) is an indicator of AGN activity. Examination of Fig. 7 shows that there is a correlation between and luminosity of each kind. This provides evidence in favor of that the central gas velocity dispersion can serve as an indicator of AGN activity.
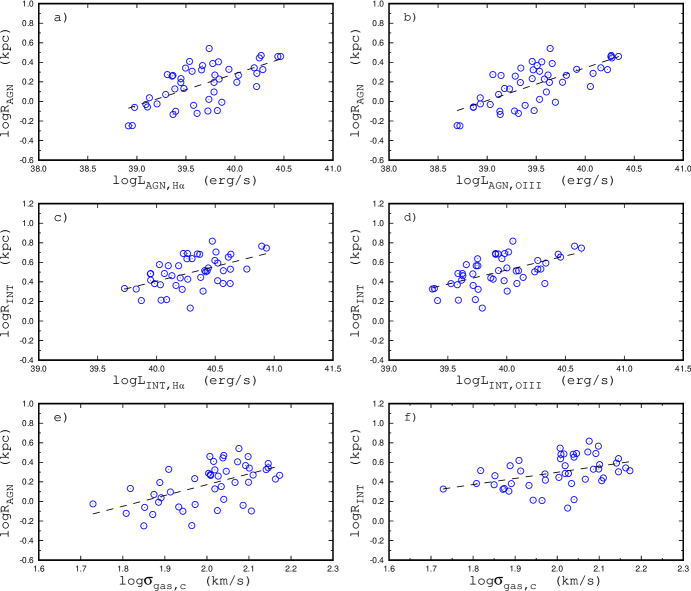
It is known that the radius of the zone ionized by the AGN correlates with its luminosity in the [O iii]5007 emission line for the Seyfert galaxies (Schmitt et al. 2003; Chen et al. 2019; do Nascimento et al. 2019, among many others). In Fig. 8 we show the radius of the zone where an AGN makes the dominant contribution to the radiation, , as a function of the H luminosity for the same zone, , (panel a), and as a function of the [O iii]4959,5007 luminosity (panel b) for our sample of LINERs. The radius of the zone of the influence of the AGN on the radiation, , is plotted as a function of the H luminosity, for the same zone, in panel c of Fig. 8, and as a function of the [O iii]4959,5007 luminosity in panel d of Fig. 8. One can see the correlation between and in each diagram. The coefficients in the linear correlations , the correlation coefficient, and the mean value of the scatter in for each diagram are listed in Table 3.
Panel e in Fig. 8 shows the radius as a function of the central gas velocity dispersion, while panel f shows the – diagram. Both, the and the correlate with .
Thus, the consideration of our sample of galaxies with the circumnuclear regions
of the AGN type (LINERs) results in the following conclusions.
The spectra of individual spaxels in the circumnuclear region occupy
a narrow band on the BPT diagram, this is, they lie along the AGN-SF mixing line
trajectory. The diagnostic line ratios in the spaxels spectra within the radius
change smoothly with radius, from AGN-like line ratios in the spaxels spectra at
the galactic center, to H ii-region-like line ratios in the spaxels spectra at
galactocentric distances larger than .
This is in agreement with the widely used paradigm that the LINERs are excited by the AGNs.
The radius of the AGN influence can be specified by the radius
, and the strength of the AGN activity can be specified by the luminosity
of this region in the H (or [O iii]4959,5007)
emission lines.
Alternatively, the radius of the AGN influence can be specified by the radius of the zone of enhanced
gas velocity dispersion which coincides with (or at least is close to) the
radius , and the strength of the AGN activity can be specified by the value of the
central gas velocity dispersion .
3.3 Circumnuclear regions of the INT type
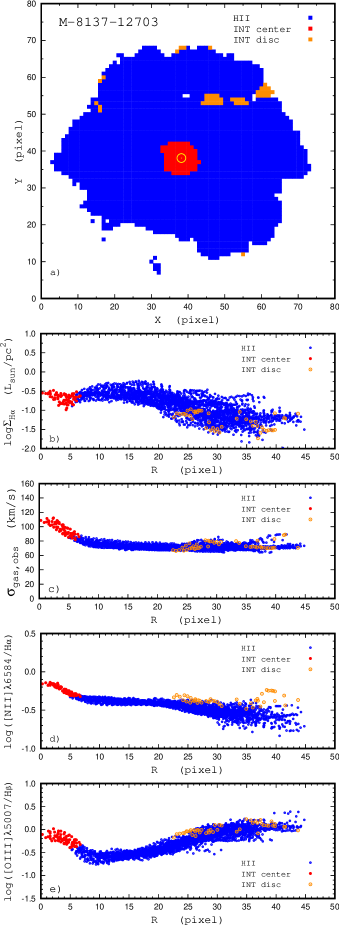
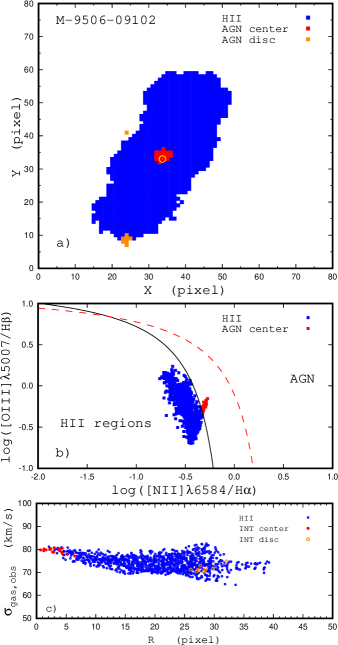
The circumnuclear regions in a number of MaNGA galaxies are classified as INT type. As an example, the upper panel of Fig. 9 shows the locations of the spaxels with the H ii-region-like and and intermediate spectra on the image of the galaxy M-8137-12703. The spaxels of the intermediate type spectra in the circumnuclear region and in the disc are shown by different colors. The circle marks the kinematic center of the galaxy. The other panels of Fig. 9 show the radial distributions of different characteristics (such as the H surface brightness, the gas velocity dispersion, and the BPT emission line ratios).
The radius of the area of the influence of the AGN on the radiation , the radius of the zone of the enhanced gas velocity dispersion , the values of the and luminosities within the , the central gas velocity dispersion , the values of the central H surface brightness, , and in the [O iii]4959,5007 emission lines , are determined for the circumnuclear regions of the INT type in the same way as for the circumnuclear regions of the AGN type.
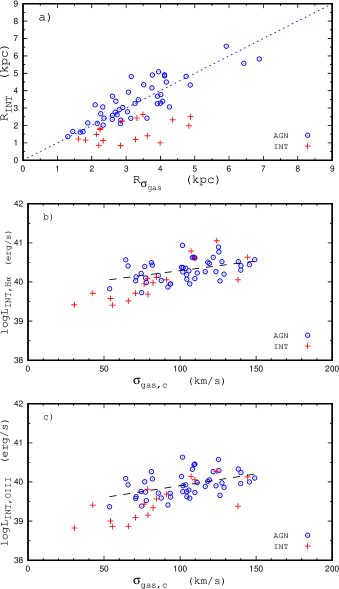
Here we compare the properties of the circumnuclear regions of the INT and the AGN types. Panel a of Fig. 10 shows the – diagram. The circles denote the circumnuclear regions of the AGN type, and the plus symbols are the circumnuclear regions of the INT type. The line is the perfect agreement. Inspection of panel a of Fig. 10 shows that there is no agreement between the and the for the circumnuclear regions of the INT type, in the sense that the radius of the AGN influence on the radiation , is usually less than the radius of the zone of the enhanced gas velocity dispersion . This can be evidence in favor of that the contribution of the SF radiation is higher in those circumnuclear regions. Indeed, the position of each spaxel on the BPT diagram moves along the mixing line trajectories toward lower and values due to an increase of the contribution of the SF radiation. As a result, the positions of the central spaxels move from the AGN locus to the INT locus on the BPT diagram, and the position of the outermost spaxels (with radii close to, slightly less than, the ) move from the INT locus to the H ii region locus. Thus, the differences between the circumnuclear regions of the AGN and INT types can be explained if the contribution of the SF to the radiation is higher in circumnuclear regions of the INT type, in comparison to the circumnuclear regions of the AGN type.
It should be noted that the enhancement of the gas velocity dispersion in some galaxies of the INT type (with weak circumnuclear regions) can be low, Fig. 11. Therefore the uncertainty in the determinations of the value of the for weak circumnuclear regions of the INT type can be large.
The BPT diagram for the circumnuclear region of the INT type resembles that of the circumnuclear region of the AGN type, with the exception that the positions of the spaxels of the INT type do not reach the AGN locus in the BPT diagram. This indicates again that the contribution of the SF to the radiation is higher in the circumnuclear regions of the INT type in comparison to the circumnuclear regions of the AGN type. Since the extension of the band in the BPT diagram occupied by the spaxels of the INT type is not large enough, then that prevents the accurate determination of the slope of the – relation. Moreover, even the existence of the AGN-SF mixing trajectory is not indisputable if the extension of the band in the BPT diagram is small.
Panel b of Fig. 10 shows the – diagram. The circles denote the circumnuclear regions of the AGN-type, and the plus symbols denote the circumnuclear regions of the INT-type. The line is the – relation obtained for the AGN-type. Inspection of panel b of Fig. 10 shows that the location of the circumnuclear regions of the INT-type in the – diagram, follow the trend outlined by the location of the AGN-type for high values of the central gas velocity dispersion, and are slightly shifted toward lower luminosities for lower values of the central gas velocity dispersion.
Panel c of Fig. 10 shows the – diagram. Examination of this panel indicates that the luminosities of the INT-type are slightly lower, on average, than those of the AGN-type for similar values of the central gas velocity dispersion.
3.4 Circumnuclear regions of the SF type
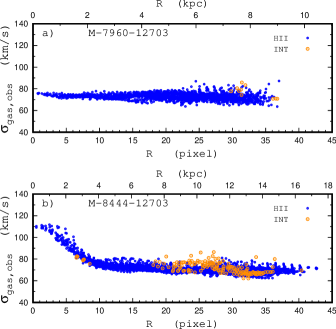
The H ii-region-like spectra are observed at the center of many MaNGA galaxies, this is, they are galaxies with the circumnuclear region of the SF-type. Fig. 12 shows the observed (non corrected for the instrumental profile) gas velocity dispersion as a function of radius for two galaxies with the circumnuclear regions of the SF-type. The spaxels with the SF-like spectra are denoted by blue symbols, and the spaxels with the intermediate spectra in the disc by orange symbols. From one side, the gas velocity dispersion can be nearly constant over the whole galaxy, this is, the gas velocity dispersion at the center of the circumnuclear region of the SF-type can be close to that of the disc, see panel a of Fig. 12. On the other hand, the gas velocity dispersion at the center of the circumnuclear region of the SF-type can be significantly higher than that in the disc, see panel b of Fig. 12.
The central gas velocity dispersion , the values of the central surface brightness in the H emission line () and [O iii]4959,5007 emission lines () in the circumnuclear regions of the SF-type are determined using the same approach as for the AGN and INT-types. The mean value of the gas velocity dispersion in five spaxels with higher within the radius of 3 pixel is adopted as the central gas velocity dispersion . The central surface brightness in the H and in the [O iii]4959,5007 emission lines are determined as the mean values for the same five spaxels.
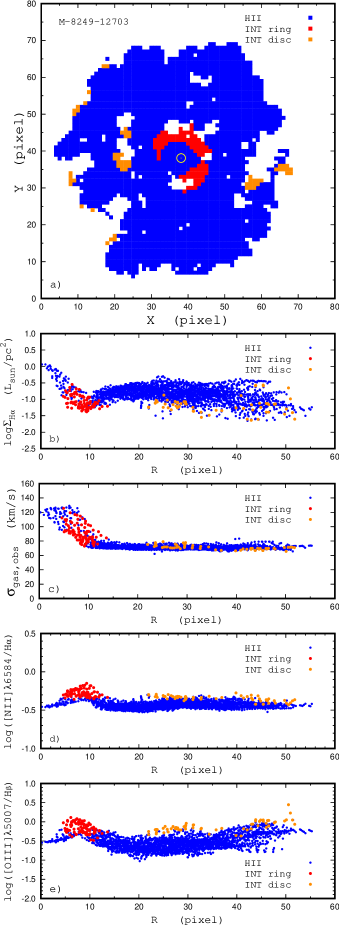
In a several MaNGA galaxies (M-8137-09102, M-8249-12703, M-9500-12702), the circumnuclear region of the SF type is surrounded by a ring of spaxels of intermediate type spectra. For instance, panel of Fig. 13 shows the distribution of the H ii-region-like spaxels (blue symbols), the spaxels with the intermediate spectra in the circumnuclear ring (red symbols), and the spaxels with the intermediate spectra in the disc (orange symbols). The circle marks the kinematical center of the galaxy. Panels b, c, d, and e of Fig. 13 show the radial distributions of different characteristics (surface brightness in the H emission line, gas velocity dispersion, and BPT line ratios) for this galaxy.
Two possible explanations of the appearance of the ring of the spaxels with the spectra of the intermediate type around the innermost region of the SF radiation can be suggested. First. The spaxels with the spectra of the intermediate type lie at a dip in the H surface brightness and do not form a clear mixing line trajectory on the BPT diagram. This can indicate that diffuse ionized gas might make a significant contribution to the line emission like that in the spaxels with spectra of the INT type in the disc far from the center.
Second. Such circumnuclear region looks as if the innermost AGN zone is replaced by a SF-zone in the circumnuclear region of an AGN type. One can speculate that this configuration of the radiation distribution in the circumnuclear region in those galaxies can be explained in the following way. A star formation burst occurs at the center of a galaxy with the circumnuclear region of the AGN type. Then the contribution of the SF to the radiation becomes dominant at the center, moving its location on the BPT diagram from an AGN to an H ii-region locus. The contribution of the SF to the radiation decreases with radius, as seen in panel of Fig. 13, and becomes low in comparison to the contribution of the AGN (shock) at some radius, such that the spectra are of the INT type in the ring. However, a detailed model should be constructed in order to confirm or reject this picture.
Thus, the central gas velocity dispersion can be either low or high in the circumnuclear region of the SF-type. In several galaxies, the circumnuclear region of the SF-type is surrounded by a ring of spaxels with the intermediate spectra.
3.5 Detectability of the circumnuclear regions of the AGN type from the optical spectra
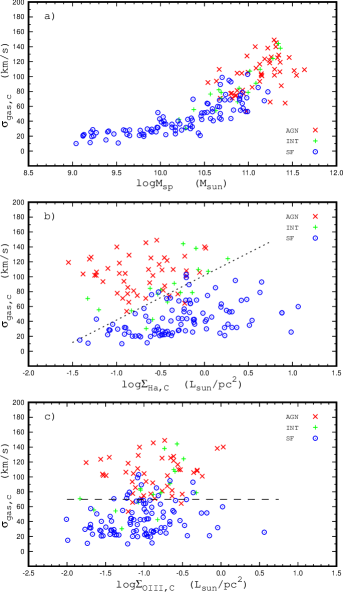
We argued above that the value of the central gas velocity dispersion can serve as an indicator of the AGN activity. Panel of Fig. 14 shows the central gas velocity dispersion as a function of the stellar mass for galaxies with the circumnuclear regions of the AGN-type (red crosses), INT-type (green plus symbols), and SF-type (blue circles). Inspection of panel of Fig. 14 shows that the central gas velocity dispersion increases significantly for galaxies with stellar masses larger than 10. Then one can expect an appreciable AGN activity for those galaxies.
The values of the central gas velocity dispersion in galaxies with the circumnuclear regions of the AGN-type are higher than those for galaxies with the circumnuclear regions of the SF-type. However, the diapason of values of the central gas velocity dispersion in galaxies of the AGN-type circumnuclear regions overlaps partially with the values of the central gas velocity dispersion in the galaxies with the circumnuclear regions of the SF-type. On one side, this overlapping can be attributed to the errors in the determination of the central gas velocity dispersion (and/or mass of the galaxy). On the other side, the lack of a sharp demarcation value in the central gas velocity dispersions for galaxies with the circumnuclear regions of AGN and SF-types can be considered as evidence of additional parameters playing a role. If this is the case, then the presence of AGN activity at a given level in the galaxy does not necessary result in the appearance of the circumnuclear region of the AGN type in the BPT diagram.
Panel b of Fig. 14 shows the central gas velocity dispersion as a function of the central surface brightness in the H emission line for galaxies with the circumnuclear region of the AGN-type (red crosses) and for galaxies with the circumnuclear region of the SF-type (blue circles). A comparison between panels a and b of Fig. 14 shows that the demarcation line between the location of the AGN and SF-types in the – diagram is more clear than that in the – Msp diagram. The demarcation value between the central gas velocity dispersions in the circumnuclear regions of the AGN and the SF-types depends on the value of the central H surface brightness, in the sense that the circumnuclear region at a given value of the central gas velocity dispersion is detected as an AGN-type object in the BPT diagram only if the central surface brightness in H is lower than some value, or the circumnuclear region with a given value of will be detected in the BPT diagram as an AGN-type object only if the central gas velocity dispersion is higher than some value.
Panel c of Fig. 14 shows the central gas velocity dispersion as a function of the central surface brightness in the [O iii]4959,5007 emission lines for the galaxies with the circumnuclear regions of the AGN-type (red crosses) and for galaxies with the circumnuclear regions of the SF-type (blue circles). Comparison between panels c and b of Fig. 14 shows that the demarcation line between the locations of the AGN and SF-types in the – diagram is less distinctive than that of the – diagram.
Thus, the AGN activity takes place at the center of each massive galaxy as it is indicated by the central gas velocity dispersion. The circumnuclear region is detected as an AGN-type object in the BPT diagram if the central gas velocity dispersion is higher than some value. The demarcation value between the central gas velocity dispersion in the circumnuclear regions of the AGN and the SF types can also depend on the value of the central H surface brightness.
4 Discussion
The median value of the gas velocity dispersions in the spaxels with the H ii-region-like spectra in the galaxy was used in the current study in the correction of the observed gas velocity dispersions for the instrumental profile. Now we discuss this approach. The mean values of the gas velocity dispersion for spaxels with H ii-region-like spectra in the galaxy can be slightly higher than the median values because of the gas velocity dispersions in some spaxels (close to the center of the galaxy) can be higher than the average value for the disc. Then the median value of the gas velocity dispersion better specifies the gas velocity dispersion in the disc.
We have examined the median value of the gas velocity dispersions in the disc as a function of the galaxy inclination , the distance to the galaxy , the stellar mass , and the central oxygen abundance in the galaxy 12+log(O/H). The median value for the 161 galaxies which is equal to 72.5 km/s, and the mean value of the scatter around the median value is 2.8 km/s. The relative low scatter in the median values of the observed gas velocity dispersion in the discs of different galaxies is a strong evidence in favor that the conditions of the observations, as well as the physical conditions of the galaxies do not significantly influence on the median observed gas velocity dispersion. Indeed, the lack of correlation between the median observed gas velocity dispersion and galaxy inclination implies that the rotational velocity does not make an appreciable contribution to the observed gas velocity dispersion. The value of the observed gas velocity dispersion does not depend on the physical size of the area in the galaxy within the spaxel (which depends on the distance to the galaxy ). The electron temperature in the H ii region correlates with its oxygen abundance in the sense that the electron temperatures are higher in the low-metallicity H ii regions. Then, the lack of the correlation between the observed gas velocity dispersion and oxygen abundance implies that the electron temperature does not significantly influence the observed gas velocity dispersion. At last, the observed gas velocity dispersion is similar in galaxies of different masses.
The median value of the observed gas velocity dispersion in galaxies (72.5 2.8 km/s) is within the expected interval of the instrumental dispersion for the MaNGA survey, 50 – 80 km/s (Bundy et al. 2015), and is close to the estimated instrumental dispersion 70 km/s (Westfall et al. 2019).
Thus, the use of the median value of the gas velocity dispersions in the spaxels with the H ii-region-like spectra in the galaxy as the instrumental profile is quite justified (at least as a first-order approximation).
We have considered the circumnuclear regions of different BPT types.
There are four configurations of the radiation distributions in the circumnuclear regions in
(massive) galaxies:
1) AGN+INT, the innermost region of the AGN-like radiation is surrounded by a ring of radiation
of intermediate type,
2) INT, the spectra of the spaxels in the central region are of the intermediate type,
3) SF+INT, the inner region of the H ii-like radiation is surrounded by a ring of
radiation of the intermediate type,
4) SF, the central area involves the spaxels with the H ii-like radiation only.
Figs. 2, 3, 9, and 13 illustrate those configurations of the radiation distributions in the circumnuclear regions. Fig. 2 and Fig. 3 show the galaxy M-7495-12704 which is an example of galaxies with circumnuclear regions of the AGN+INT configuration. Fig. 9 shows the galaxy M-8137-12703, an example of galaxies with the circumnuclear regions of the INT configuration. Fig. 13 shows the galaxy M-8249-12703, an example of galaxies with the circumnuclear regions of the SF+INT configuration. The sequence of those configurations (from the AGN+INT through the INT (or SF+INT) to the SF) can be explained by an increase of the contribution of the SF to the radiation in the circumnuclear region.
Thus, we suggest that the gas velocity dispersion can serve as an indicator of AGN activity. Fig. 14 shows that the value of central gas velocity dispersion depends on stellar mass. This correlation can be explained if gas velocity dispersion is a tracer of gaseous bulge (related to the host galaxy mass). However, this correlation can be explained equally well if gas velocity dispersion is a tracer of AGN activity (related to the black hole mass) since a correlation exists between the mass of the black hole and stellar mass of the host galaxy. Our suggestion that the gas velocity dispersion can serve as an indicator of AGN activity is based on the fact that the characteristics of the gas velocity dispersion correlate with direct characteristics of the AGN activity. The radius of the zone with enhanced gas velocity dispersion is related to the radius of the zone of the influence of AGN. The values of the central gas velocity dispersion correlates with AGN luminosity in [O iii]4959,5007 and H emission lines. We did not find facts which are in conflict with our suggestion.
5 Conclusions
We have considered the circumnuclear regions in star-forming MaNGA galaxies.
The spaxels spectra are classified as AGN-like, H ii-region-like (or SF-like), and
intermediate (INT) spectra according to their positions in the Baldwin-Phillips-Terlevich (BPT) diagram.
We found that there are four configurations of the radiation distributions in the circumnuclear regions in
galaxies:
1) AGN+INT, the innermost region of the AGN-like radiation is surrounded by a ring of radiation
of the intermediate type,
2) INT, the radiation at the center of galaxy is the intermediate type,
3) SF+INT, the inner region of the H ii-region-like radiation is surrounded by a ring of
radiation of the intermediate type,
4) SF, the central area involves the spaxels with the H ii-region-like radiation only.
The sequence of those configurations (from the AGN+INT through the INT (or SF+INT) to the SF) can be explained
by an increase in the contribution of the SF to the radiation of the circumnuclear region.
The low ionization nuclear emission line regions (LINERs) of configurations 1 and 2 are examined. The spaxel spectra in the LINERs form a sequences on the BPT diagram, that is, they lie along the known AGN-SF mixing line trajectories. The diagnostic line ratios in the spaxels spectra change smoothly with radius, from AGN-like (or INT) in the spaxels spectra in the galactic center, to H ii-region-like in the spaxels spectra at larger galactocentric distances. This evidences that the change of the diagnostic line ratio along radius is primary caused by variations in the fraction of the line emission excited by AGN activity. Our results are in agreement with the widely accepted paradigm that the LINERs are excited by AGN activity and also agree with the results from Davies et al. (2014a, b, 2016).
The AGN and INT radiation in the circumnuclear region is accompanied by an enhancement in the gas velocity dispersion . The radius of the area of the AGN and INT radiation (radius of influence of the AGN on the radiation) is similar to the radius of the area with enhanced gas velocity dispersion , and the central gas velocity dispersion correlates with the luminosity of the AGN+INT area. This allows us to assume that the central gas velocity dispersion can serve as indicator of AGN activity.
An appreciable were also measured in the SF-type centers of massive galaxies. With our assumption that the central gas velocity dispersion can serve as indicator of AGN activity, this implies the AGN activity in those galaxies. The interval of the values of the central gas velocity dispersion in the galaxies with the circumnuclear regions of the AGN type overlaps partly with the interval of those in the galaxies with the circumnuclear regions of the SF type. The lack of the sharp demarcation between the values of the central gas velocity dispersions in the circumnuclear regions of the AGN and the SF types can be considered as an evidence in favor of that the manifestation of the circumnuclear region as AGN or as SF depends not only on the value of the central gas velocity dispersion (the level of the AGN activity) but it is also governed by an additional parametr(s). We found that there is a demarcation line between the positions of the AGN-type and SF-type galaxies on the central surface brightness in the H line – central gas velocity dispersion diagram in the sense that the galaxies with a given value of the central gas velocity dispersion are detected as the AGN-type object on the BPT diagram if only the central surface brightness in the H line is lower than some value. One can assume that the value of the central gas velocity dispersion may be the more sensitive indicator of the AGN activity than the position on the BPT diagram.
Acknowledgements
We are grateful to the referee for his/her constructive comments.
L.S.P., E.K.G., and I.A.Z. acknowledge support within the framework
of Sonderforschungsbereich (SFB 881) on “The Milky Way System”
(especially subproject A5), which is funded by the German Research
Foundation (DFG).
L.S.P. and I.A.Z. thank for hospitality of the
Astronomisches Rechen-Institut at Heidelberg University, where part of
this investigation was carried out.
L.S.P acknowledges support within the framework of the program of the NAS of
Ukraine “Support for the development of priority fields of scientific
research” (CPCEL 6541230)”
I.A.Z acknowledges support by the grant for young scientist’s research
laboratories of the National Academy of Sciences of Ukraine.
M.A.L.-L. is a DARK-Carlsberg Foundation Fellow (Semper Ardens project CF15-0384)
The work is performed according to the Russian Government Program of Competitive Growth
of Kazan Federal University and Russian Science Foundation, grant no. 20-12-00105
We acknowledge the usage of the HyperLeda database (http://leda.univ-lyon1.fr).
Funding for SDSS-III has been provided by the Alfred P. Sloan Foundation,
the Participating Institutions, the National Science Foundation,
and the U.S. Department of Energy Office of Science.
The SDSS-III web site is http://www.sdss3.org/.
Funding for the Sloan Digital Sky Survey IV has been provided by the
Alfred P. Sloan Foundation, the U.S. Department of Energy Office of Science,
and the Participating Institutions. SDSS-IV acknowledges
support and resources from the Center for High-Performance Computing at
the University of Utah. The SDSS web site is www.sdss.org.
SDSS-IV is managed by the Astrophysical Research Consortium for the
Participating Institutions of the SDSS Collaboration including the
Brazilian Participation Group, the Carnegie Institution for Science,
Carnegie Mellon University, the Chilean Participation Group,
the French Participation Group, Harvard-Smithsonian Center for Astrophysics,
Instituto de Astrofísica de Canarias, The Johns Hopkins University,
Kavli Institute for the Physics and Mathematics of the Universe (IPMU) /
University of Tokyo, Lawrence Berkeley National Laboratory,
Leibniz Institut für Astrophysik Potsdam (AIP),
Max-Planck-Institut für Astronomie (MPIA Heidelberg),
Max-Planck-Institut für Astrophysik (MPA Garching),
Max-Planck-Institut für Extraterrestrische Physik (MPE),
National Astronomical Observatories of China, New Mexico State University,
New York University, University of Notre Dame,
Observatário Nacional / MCTI, The Ohio State University,
Pennsylvania State University, Shanghai Astronomical Observatory,
United Kingdom Participation Group,
Universidad Nacional Autónoma de México, University of Arizona,
University of Colorado Boulder, University of Oxford, University of Portsmouth,
University of Utah, University of Virginia, University of Washington, University of Wisconsin,
Vanderbilt University, and Yale University.
References
- Agostino & Salim (2019) Agostino C.J., Salim S., 2019, ApJ, 876, 12
- Albareti et al (2017) Albareti F.D., Allende Prieto C., Almeida A., et al., 2017, ApJS, 233, 25
- Antonucci (1993) Antonucci R., 1993, ARA&A, 31, 473
- Asari et al. (2007) Asari N.V., Cid Fernandes R., Stasińska G., Torres-Papaqui J.P., Mateus A., Sodré L., Schoenell W., Gomes J.M., 2007, MNRAS, 381, 263
- Baldwin, Phillips, and Terlevich (1981) Baldwin J.A., Phillips M.M., Terlevich R., 1981, PASP, 93, 5
- Begeman (1989) Begeman K.G., 1989, A&A, 223, 47
- Belfiore et al. (2016) Belfiore F., Maiolino R.,Maraston C., et al., 2016, MNRAS, 461, 3111
- Bennert et al. (2018) Bennert V.N., Loveland D., Donohue E., et al., 2018, MNRAS, 481, 138
- Bruzual & Charlot (2003) Bruzual G., Charlot S., 2003, MNRAS, 344, 1000
- Bundy et al. (2015) Bundy K., Bershady M.A., Law D.R., et al., 2015, ApJ, 798, 7
- Cardelli et al. (1989) Cardelli J.A., Clayton G.C., Mathis J.S., 1989, ApJ, 345, 245
- Chen et al. (2012) Chen Y-M., Kauffmann G., Tremonti C.A., et al., 2012, MNRAS, 421, 314
- Chen et al. (2019) Chen J., Shi Y., Dempsey R., et al., 2019, MNRAS, 489, 855
- Cid Fernandes et al. (2005) Cid Fernandes R., Mateus A., Sodré L., Stasińska G., Gomes J.M., 2005, MNRAS, 358, 363
- Cid Fernandes et al. (2010) Cid Fernandes R., Stasińska G., Schlickmann M.S., Mateus A., Vale Asari N., Schoenell W., Sodré L., 2010, MNRAS, 403, 1036
- Davies et al. (2014a) Davies R.L., Rich J.A., Kewley L.J., Dopita M.A., 2014a, MNRAS, 439, 3835
- Davies et al. (2014b) Davies R.L., Kewley L.J., Ho I.-T., Dopita M.A., 2014b, MNRAS, 444, 3961
- Davies et al. (2016) Davies R.L., Groves B., Kewley L.J., et al., 2016, MNRAS, 462, 1616
- Dawson et al. (2013) Dawson K. S., Schlegel D. J., Ahn C. P., et al., 2013, AJ, 145, 10
- de Blok et al. (2008) de Blok W.J.G., Walter F., Brinks E., Trachternach C., Oh S.-H., Kennicutt R.C., 2008, AJ, 136, 2648
- do Nascimento et al. (2019) do Nascimento J.C., Storchi-Bergmann T., Mallmann N.D., et al., 2019, MNRAS, 486, 5075
- Dopita & Sutherland (1995) Dopita M.A., Sutherland R.S., 1995, ApJ, 455, 468
- Elvis et al. (1981) Elvis M., Schreier E.J., Tonry J., Davis M., Huchra J.P., 1981, ApJ, 246, 20
- Faber & Jackson (1976) Faber S.M., Jackson R.E., 1976, ApJ, 204, 668
- Ferland & Netzer (1983) Ferland G.J., Netzer H., 1983, ApJ, 264, 105
- Ferrarese & Merritt (2000) Ferrarese L., Merritt D., 2000, ApJ, 539, L9
- Heckman (1980) Heckman T.M., 1980, A&A, 87, 152
- Heckman & Best (2014) Heckman T.M., Best P.N., 2014, ARA&A, 52, 589
- Herpich et al. (2016) Herpich F., Mateus A., Stasińska G., Cid Fernandes R., Vale Asari N., 2016, MNRAS, 462, 1826
- Ho et al. (1997) Ho L.C., Filippenko A.V., Sargent W.L.W., 1997, ApJS, 112, 315
- Ho et al. (2014) Ho I.-T., Kewley L.J., Dopita M.A., et al., 2014, MNRAS, 444, 3894
- Hviding et al. (2018) Hviding R.E., Brammer G.B., Momcheva I.G., et al., 2018, ApJ, 868, 16
- Ilha et al. (2019) Ilha C.S., Riffel R.A., Schimoia J.S., et al., 2019, MNRAS, 484, 252
- Kauffmann et al. (2003) Kauffmann G., Heckman T.M., Tremonti C., et al. 2003, MNRAS, 346, 1055
- Kauffmann & Heckman (2009) Kauffmann G., Heckman T.M., 2009, MNRAS, 397, 135
- Kewley et al. (2001) Kewley L.J., Dopita M.A., Sutherland R.S., Heisler C.A., Trevena J. 2001 ApJ, 556, 121
- Kewley et al. (2006) Kewley L.J., Groves B., Kauffmann G., Heckman T., 2006, MNRAS, 372, 961
- King & Pounds (2015) King A., Pounds K., 2015, ARA&A, 53, 115
- Kormendy (1985) Kormendy J., 1985, ApJ, 295, 73
- Lee et al. (2005) Lee H., Skillman E.D., Venn K.A., 2005, ApJ, 620, 223
- Lynden-Bell (1969) Lynden-Bell D., 1969, Nature, 223, 690
- Mateus et al. (2006) Mateus A., Sodré L., Cid Fernandes R., Stasińska G., Schoenell W., Gomes J.M., 2006, MNRAS, 370, 721
- Molina et al. (2018) Molina M., Eracleous M., Barth A.J., Maoz D., Runnoe J.C., Ho L.C., Shields J.C., Walsh J.L., 2018, ApJ, 864, 90
- Monreal-Ibero et al. (2006) Monreal-Ibero A., Arribas S., Colina L., 2006, ApJ, 637, 138
- Monreal-Ibero et al. (2010) Monreal-Ibero A., Arribas S., Colina L., Rodríguez-Zaurín J., Alonso-Herrero A., García-Marín M., 2010, A&A, 517,A28
- Moran et al. (2002) Moran E.C., Filippenko A.V., Chornock R., 2002, ApJ, 579, L71
- Nelson & Whittle (1996) Nelson C.H., Whittle M., 1996, ApJ, 465, 96
- Oh et al. (2018) Oh S.-H., Staveley-Smith L., Spekkens K., Kamphuis P., Koribalski B.S., 2018, MNRAS, 473, 3256
- Parkash et al. (2019) Parkash V., Brown M.J.I., Jarrett T.H., Fraser-McKelvie A., Cluver M.E., 2019, MNRAS, 485, 3169
- Pilyugin & Grebel (2016) Pilyugin L.S., Grebel E.K., 2016, MNRAS, 457, 3678
- Pilyugin et al. (2018) Pilyugin L.S., Grebel E.K., Zinchenko I.A., Nefedyev Y.A., Shulga V.M., Wei H., Berczik P.P., 2018, A&A, 613, A1
- Pilyugin et al. (2019) Pilyugin L.S., Grebel E.K., Zinchenko I.A., Nefedyev Y.A., Vílchez J.M., 2019, A&A, 623, A122
- Pilyugin et al. (2020) Pilyugin L.S., Grebel E.K., Zinchenko I.A., Vílchez J.M., Sakhibov F., Nefedyev Y.A., Berczik P.P., 2020, A&A, 634, A26
- Pons & Watson (2014) Pons E., Watson M.G., 2014, A&A, 568, A108
- Pons & Watson (2016) Pons E., Watson M.G., 2016, A&A, 594, A72
- Rich et al. (2014) Rich J.A., Kewley L.J., Dopita M.A., 2014, ApJ, 781, L12
- Rich et al. (2015) Rich J.A., Kewley L.J., Dopita M.A., 2015, ApJS, 221, 28
- Sahu et al. (2019) Sahu N., Graham A.W., Davis B.L., 2019, ApJ, 887, 10
- Salpeter (1964) Salpeter E.E., 1964, ApJ, 140, 796
- Sarzi et al. (2010) Sarzi M., Shields J.C., Schawinski K., et al., 2010, MNRAS, 402, 2187
- Schmitt et al. (2003) Schmitt H.R., Donley J.L., Antonucci R.R.J., Hutchings J.B., Kinney A.L., Pringle J.E., 2003, ApJ, 597, 768
- Shakura & Sunyaev (1973) Shakura N.I., Sunyaev R.A., 1973, A&A, 24, 337
- Singh et al. (2013) Singh R., van de Ven G., Jahnke K., et al. 2013, A&A, 558, A43
- Stasińska et al. (2006) Stasińska G., Cid Fernandes, R, Mateus A., Sodré L., Asari N.V. 2006, MNRAS, 371, 972
- Stasińska et al. (2008) Stasińska G., Vale Asari N., Cid Fernandes R., Gomes J.M., Schlickmann M., Mateus A., Schoenell W., Sodré L., 2008, MNRAS, 391, L29
- Storey & Zeippen (2000) Storey P.J., Zeippen C.J., 2000, MNRAS, 312, 813
- Tremaine et al. (2002) Tremaine S., Gebhardt K., Bender R., et al., 2002, ApJ, 574, 740
- Warner et al. (1973) Warner P.J., Wright M.C.H., Baldwin J.E., 1973, MNRAS, 163, 163
- Westfall et al. (2019) Westfall K.B., Cappellari M., Bershady M.A., et al., 2019, AJ, 158, 231
- Yan & Blanton (2012) Yan R., Blanton M.R., 2012, ApJ, 747, 61
- York et al. (2000) York D.G., Adelman J., Anderson J.E., et al., 2000, AJ, 120, 1579
- Zel’dovich (1964) Zel’dovich Y.B., 1964, Sov. Phys. Dokl., 9, 195
- Zinchenko et al. (2016) Zinchenko I.A., Pilyugin L.S., Grebel E.K., Sánchez S.F., Vílchez J.M., 2016, MNRAS, 462, 2715
- Zinchenko et al. (2019) Zinchenko I.A., Pilyugin L.S., Sakhibov F., Grebel E.K., Just A., Berczik P., Nefedyev Y.A., Vílchez J.M., Shulga V.M., 2019, A&A, 628, A55