Multi-wavelength observations of 2HWC J1928+177: dark accelerator or new TeV gamma-ray binary?
Abstract
2HWC J1928177 is a Galactic TeV gamma-ray source detected by the High Altitude Water Cherenkov (HAWC) Observatory up to TeV. The HAWC source, later confirmed by H.E.S.S., still remains unidentified as a dark accelerator since there is no apparent supernova remnant or pulsar wind nebula detected in the lower energy bands. The radio pulsar PSR J19281746, coinciding with the HAWC source position, has no X-ray counterpart. Our SED modeling shows that inverse Compton scattering in the putative pulsar wind nebula can account for the TeV emission only if the unseen nebula is extended beyond ′. Alternatively, TeV gamma rays may be produced by hadronic interactions between relativistic protons from an undetected supernova remnant associated with the radio pulsar and a nearby molecular cloud G52.90.1. NuSTAR and Chandra observations detected a variable X-ray point source within the HAWC error circle, potentially associated with a bright IR source. The X-ray spectra can be fitted with an absorbed power-law model with cm-2 and and exhibit long-term X-ray flux variability over the last decade. If the X-ray source, possibly associated with the IR source (likely an O star), is the counterpart of the HAWC source, it may be a new TeV gamma-ray binary powered by collisions between the pulsar wind and stellar wind. Follow-up X-ray observations are warranted to search for diffuse X-ray emission and determine the nature of the HAWC source.
Subject headings:
gamma rays: ISM, — X-rays: general — pulsars: individual (PSR J19281746) — radiation mechanisms: non-thermal1. Introduction
Over the last two decades, the advent of ground-based imaging air Cherenkov telescopes (IACTs) such as H.E.S.S., VERITAS and MAGIC uncovered a large number of TeV gamma-ray sources, most of which are associated with either pulsar wind nebulae (PWNe) or supernova remnants (SNRs). Identifying the nature of Galactic TeV gamma-ray sources is crucial for understanding the cosmic-ray acceleration mechanisms up to the TeV or PeV energy bands. Several TeV observations suggested the existence of the most extreme cosmic particle accelerator, the so-called Pevatron, in the Galactic Center (H.E.S.S. Collaboration et al., 2016) or elsewhere in our Galaxy (Xin et al., 2019). More recently, the High Altitude Water Cherenkov (HAWC) Observatory opened a new window for probing gamma-ray sources at even higher energies than the IACTs, 100 TeV (Abeysekara et al., 2017b, 2019). HAWC is a TeV gamma-ray telescope equipped with 300 water Cherenkov detectors (WCDs) which directly detects air shower particles produced by TeV gamma rays in the upper atmosphere and can collect data for sources continuously under all weather conditions. Therefore, the HAWC Observatory is more sensitive than IACTs at energies above TeV and uniquely explores astrophysical sources in the highest energy gamma-ray band up to a few hundred TeV. About a half of the 39 Galactic HAWC sources have not been associated with previously known TeV sources detected by IACTs (Abeysekara et al., 2017a).
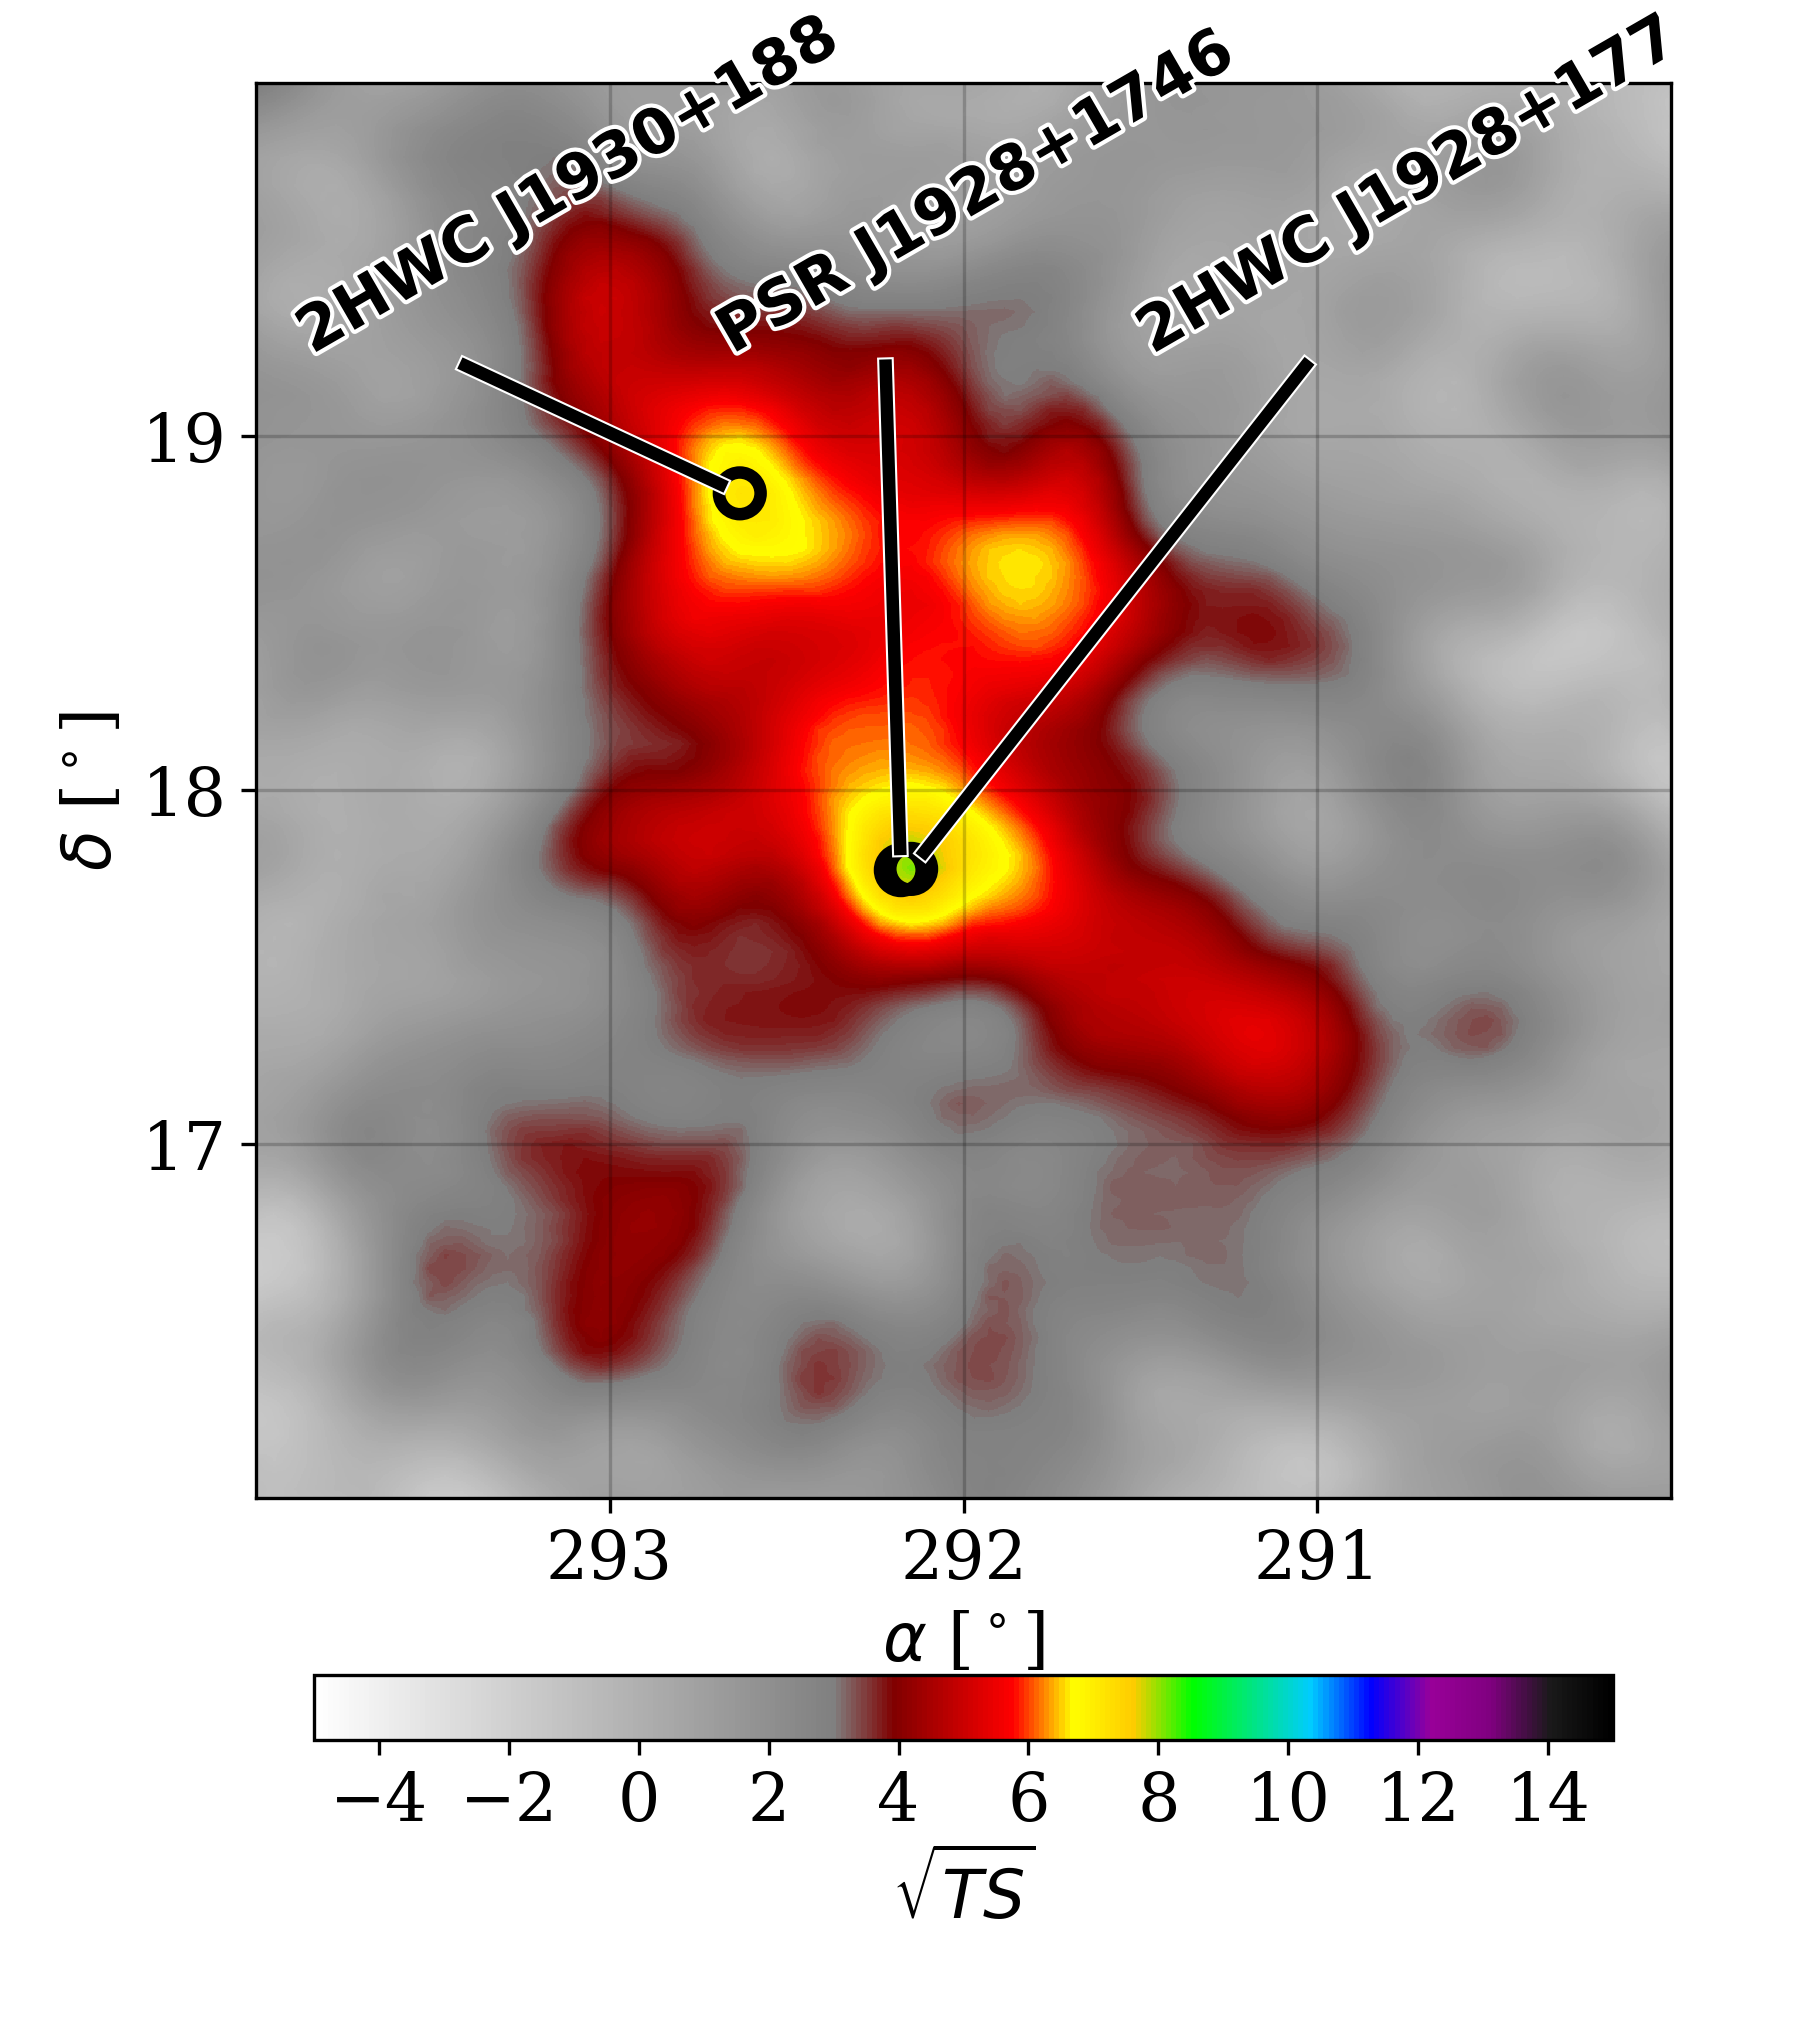
2HWC J1928177 is one of the Galactic TeV sources detected by the HAWC standard point source search (Abeysekara et al., 2017a, Figure 1). Assuming a single power-law spectrum () in the TeV band, the best-fit photon index is inferred to be . The centroid of the source is 0.03∘ away from the radio pulsar PSR J19281746 and 1.18∘ away from another HAWC source, 2HWC J1930188, which is associated with the SNR G54.10.3. The measured TeV flux in the whole region (Figure 1) for an extended source hypothesis is significantly larger than the sum of the point source fluxes for 2HWC J1928177 and 2HWC J1930188, which may imply that one or both of the sources are actually extended. H.E.S.S. later confirmed the detection of 2HWC J1928177 in the TeV band after applying a different background subtraction method such that the H.E.S.S. maps are more comparable with the HAWC skymaps (Jardin-Blicq et al., 2019).
Taking into account the luminosity and spectral index of this source in the TeV band, the emission seems to match what is expected for a TeV PWN (H.E.S.S. Collaboration et al., 2018). The 83-kyr-old radio pulsar PSR J19281746 (Cordes et al., 2006) is a good counterpart candidate, as its position coincides well with the HAWC source position (Figure 1). However, the pulsar shows no PWN in the radio and X-ray bands despite its relatively high spin-down power ( erg s-1). There are two nearby Fermi sources in the 4FGL catalog (The Fermi-LAT collaboration, 2019), but their positions do not overlap with the HAWC source; therefore, their association with the TeV emission is unlikely. For a SNR explanation to work, more than 10 of the SN energy would need to go towards the acceleration of 1 TeV protons, which is unlikely (Lopez-Coto et al., 2017). Given the lack of apparent environments for TeV photon production, 2HWC J1928177 is possibly a unique TeV gamma-ray source whose origin is currently uncertain.
In this paper, we present multi-wavelength observations of 2HWC J1928177 and our investigation of the nature of the TeV emission. We first review recent gamma-ray observations of the HAWC source by VERITAS and H.E.S.S. (§2) and by Fermi-LAT (§3). We then describe the X-ray observations of the field made with NuSTAR and Chandra and present the analysis results (§4). Then, in §5, we discuss the nature of 2HWC J1928177 using multi-wavelength spectral energy distribution (SED) data and models representing three possible scenarios: a pure leptonic case (PWN), a hadronic accelerator model (dark accelerator), and a TeV gamma-ray binary scenario. Finally, we summarize our results and future prospects in §6.
2. TeV gamma-ray observations of 2HWC J1928177 with VERITAS and H.E.S.S
VERITAS had previously observed the pulsar PSR J19281746 but only detected a 1.2- excess at the pulsar location (Acciari et al., 2010). The non-detection by VERITAS seems to imply that there may be extended emission that is larger than VERITAS’s point spread function (PSF). VERITAS recently published a study of 14 HAWC sources in the 2HWC catalog that are not associated with previously known TeV sources (Abeysekara et al., 2018). One of the regions discussed in detail was the part of the sky containing 2HWC J1930188 and 2HWC J1928177. 2HWC J1930188 is associated with the TeV source previously identified by VERITAS, VER J1930188 (Acciari et al., 2010), a known TeV PWN G54.10.3. Further analysis with VERITAS data found no emission from 2HWC J1928177 in either a point source (angular extension radius ) or an extended source (angular extension radius ) search. The flux upper limits (99% confidence level) derived by VERITAS for 2HWC J1928177 are erg cm-2 s-1and erg cm-2 s-1, for the point and an extended source search, respectively. The total exposure time for this analysis is 44 hours (archival data analyzed for VERITAS ranges from 2007 to 2015) and the upper limits are calculated above an energy threshold of 460 GeV, assuming the photon index measured by HAWC ().
2HWC J1928177 was not previously detected in the original analysis of the region observed as part of the H.E.S.S. Galactic Plane Survey (H.E.S.S. Collaboration et al., 2018) using nearly 2700 hours of quality-selected data. H.E.S.S. detected SNR G54.10.3 (HESS J1930188) but did not report any very high energy gamma-ray emission coincident with the direction of 2HWC J1928177. A H.E.S.S. study was recently carried out for comparing the Galactic plane as seen by HAWC and H.E.S.S. (Jardin-Blicq et al., 2019). Using a different background estimation for the H.E.S.S. analysis than employed previously, Jardin-Blicq et al. (2019) reported a detection of 2HWC J1928177 as well as two other point sources having detection significances above , each of which is less than half a degree away from the corresponding HAWC counterpart. It is interesting to note that this new technique seems promising for comparing IACT data with HAWC detections. These VERITAS and H.E.S.S observations imply that the HAWC source may be extended up to . Alternatively, the source may be variable as another TeV gamma-ray binary HESS J0632057 was not initially detected by VERITAS (Acciari et al., 2009).
3. Fermi-LAT observations and data analysis
In the fourth Fermi LAT catalog (Abdollahi et al., 2020), there are two GeV sources (4FGL J1928.41801 and 4FGL J1929.01729) within about 0.3∘ from the source position of 2HWC J1928177. However, the flux extrapolated from their GeV spectra lies far below the HAWC source flux in the TeV band. It is thus unlikely that the two 4FGL sources are associated with the HAWC source. We searched for a point source at the position of 2HWC J1928177 in Fermi-LAT data from the start of the mission to 2020 February. To avoid source confusion, we select photons between 1 GeV and 2 TeV, as the PSF of LAT improves with energy and the 68% containment radius is below 1∘ above 1 GeV. A power-law model leaving photon index and normalization free at the position of 2HWC J1928177, and all other sources in the 4FGL catalog were included in a likelihood analysis. No significant detection of 2HWC J1928177 was found, with a test statistic value of 4.1 ( 2 ), and a 95% upper limit on the energy flux above 1 GeV of . Assuming an extended source with did not change the GeV flux limits significantly (%). The Fermi-LAT flux upper limits are used for multi-wavelength SED fitting in §5.
4. X-ray observations and data analysis
We used a 90-ks NuSTAR observation (ObsID 30362002002) taken in 2017 June as a part of the NuSTAR-VERITAS-HAWC Legacy program which includes observations of PWN DA 495 (Coerver et al., 2019) and the TeV gamma-ray binary HESS J0632057 (Archer et al., 2020), and two archival Chandra observations (ObsIDs 9081 and 22145) which were taken with 10 ks exposures in 2008 and 2019, respectively. We also considered a handful of Swift/XRT observations of the field, but their short exposures yielded only a few counts in each observation, and so the Swift data are not very useful even after combining all the data.
4.1. Data reduction
The NuSTAR data were processed and analyzed using the NUSTARDAS v1.7.1 integrated in the HEASOFT 6.25 software package along with the NuSTAR Calibration Database (CALDB) files v20190513. The Chandra data were reprocessed with the chandra_repro tool of CIAO 4.11 to use the most recent calibration database.
4.2. Image analysis
We first obtained the NuSTAR background of the field for an image analysis. We used the nuskybgd software (Wik et al., 2014) to model the spatial and energy-dependent cosmic X-rays and a detector background. The background model components were determined by fitting the observed spectra in several source-free regions. The background spectra showed no significant Fe line at keV, indicating that the contamination from the Galactic ridge X-ray emission is negligible (Mori et al., 2015).
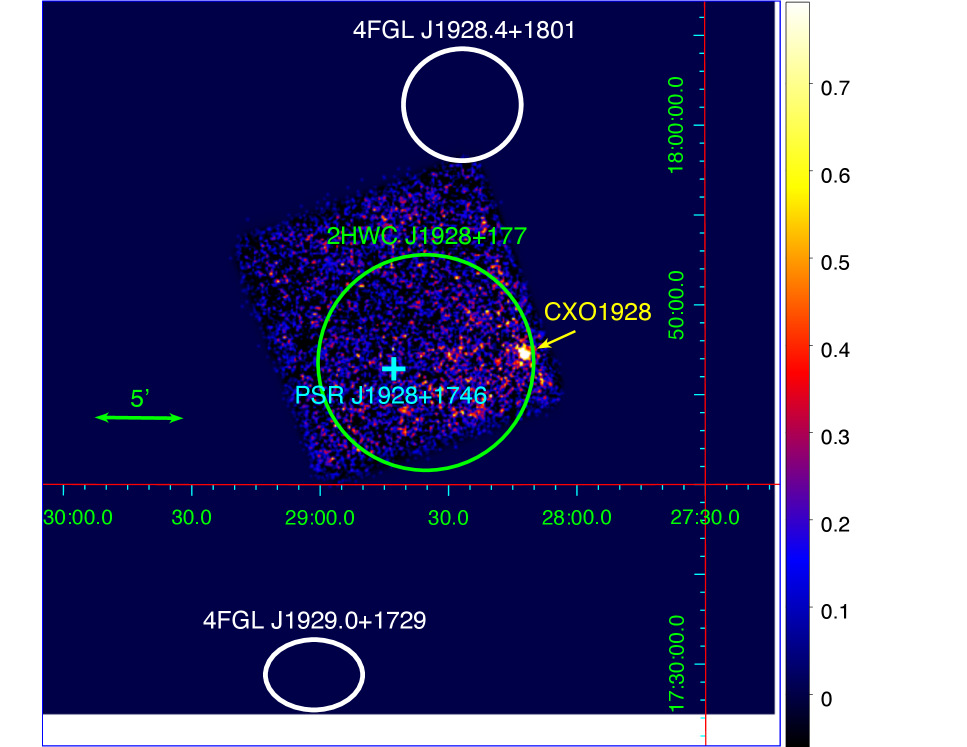
Figure 2 shows the background-subtracted NuSTAR image, after combining the two detector modules, in the 3–20 keV energy band. In the FOV, NuSTAR detected one hard X-ray source which coincides with a point source, CXO J192812.0174712 (CXO1928 hereafter), originally detected by Chandra. CXO1928 is the brightest X-ray source detected in the hard X-ray band up to keV within the HAWC source position error circle. Using the CIAO tool wavdetect and the 2019 Chandra observation data, where CXO1928 was observed near the on-axis position, we determined the Chandra position to be RA = 19:28:12′′.05 and DEC = 17:47:13′′.35 (J2000) with the 1- statistical error of 0.9′′.
We detected no X-ray source at the position of the radio pulsar, confirming the non-detection by Chandra. Using the 20 ksec Chandra ACIS data, we determined the 2–8 keV flux upper limits (90%) of several circular regions around the radio pulsar position. For each source region, we computed the Poisson probability of detecting source counts over background counts (which were obtained from a region elsewhere on the ACIS FOV and corrected for different aperture sizes) and assumed a power-law spectrum with for calculating X-ray fluxes. We found that a 90% upper limit flux (unabsorbed) in the 2–8 keV band is and erg cm-2 s-1 for ′′, 1′ and 4′, respectively. These Chandra flux limits are useful for constraining diffuse X-ray emission in both the leptonic and hadronic scenarios discussed in §5.1 and §5.2, respectively.
4.3. Spectral and timing analysis
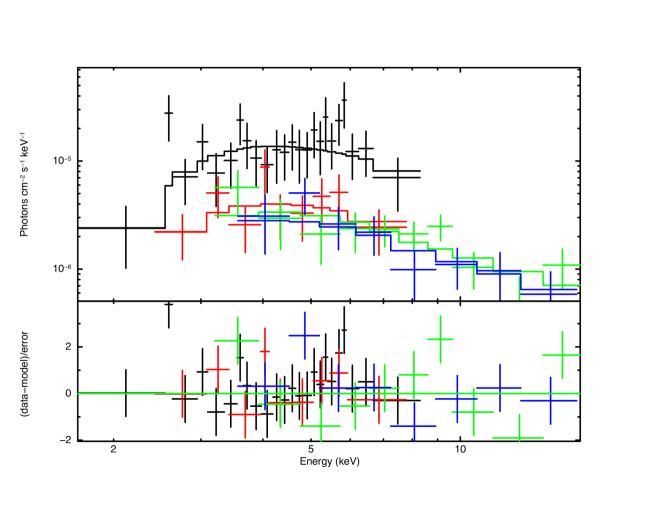
We extracted NuSTAR spectra of CXO1928 from a region and generated the NuSTAR response matrix and ancillary response files using nuproducts. Background spectra were extracted from a source-free region on the same detector chip. The net count rate in the 3–20 keV, after combining FPMA and FPMB spectra, is 0.003 cts s-1. The 2008 Chandra spectra (ObsID 9081) are extracted from a elliptical and a circular region for the source (which is located at a large off-axis position) and background, respectively with the net source count rate of 0.012 cts s-1. The 2019 (ObsID 22145) Chandra spectra are extracted from a circular region and annular region for the source and background, respectively, yielding the 2–8 keV net count rate of 0.005 cts s-1. The response files are generated with the specextract tool of CIAO 4.11. We grouped the spectra to ensure at least 30 cts/bin for NuSTAR and 5 cts/bin for Chandra, and jointly fit the spectra with an absorbed power-law model, employing the lstat statistic in XSPEC v12.10.1. Employing other statistics such as cstat or with gehrels weight does not alter the results significantly. We find that the absorbed power-law model with and cm-2 describes the data well; the spectra are shown in Figure 3. However, we find that the source flux as measured by Chandra varies by a factor of 4–5 over 9 years. The large implies a large distance to the source, and the 2–8 keV luminosity is estimated to be erg s-1 in the low-flux state for an assumed distance of 5–10 kpc. Note that both NuSTAR and Chandra 2017–2019 observations yield X-ray (2-8 keV, absorbed) fluxes that are lower than the 2008 Chandra flux by a factor of 4–5 (Figure 4) at the significance level. We also searched for an Fe line emission but did not find any significant emission.
For NuSTAR timing analysis, we extracted source photon events within a ′′ circle around the X-ray source. We then constructed 3–20 keV NuSTAR light curves and subtracted background light curves after the proper normalization. We found no significant modulation in the NuSTAR lightcurves. Furthermore, we found no evidence of aperiodic variability (i.e. red noise) in the power density spectra produced from the NuSTAR data. The 3–20 keV power density spectra are consistent with a flat white noise component, unlike accreting X-ray pulsars which often shows strong red noise components (Lazzati & Stella, 1997).

4.4. A potential IR counterpart of CXO1928
We searched IR-to-optical catalogs for a counterpart of the X-ray source CXO1928. There is a bright IR source (2MASS J192812041747111) with magnitudes of , and , offset by ′′ from the Chandra position of CXO1928. Although the offset is large compared to the statistical error of the Chandra position of 0.9′′ (1-), the systematic errors can be as large as ′′ (99% CL)111https://cxc.harvard.edu/cal/ASPECT/celmon/. Unfortunately, there is no X-ray source in the Chandra FOV that can be registered to its known IR or radio position for a boresight correction. Therefore, the association cannot be firmly established with the source positions. Alternatively, based on the surface density of nearby IR sources (which are brighter than ) in the 2MASS catalog, we estimated that the probability of chance coincidence between the Chandra and IR sources is 3%; their association is only suggestive. Assuming an optical extinction , as indicated by the large measured from X-ray spectral fitting and using the relation in Güver & Özel (2009), we fit a stellar SED model to the existing IR flux data from Spitzer, UKIRT, and 2MASS which suggests the IR source is a massive star (likely O-type).
5. Discussion
In this section, we consider three scenarios for the TeV emission from 2HWC J1928177: (1) a putative PWN of the radio pulsar PSR J19281746, (2) hadronic interactions in the unseen SNR shock and (3) a TeV gamma-ray binary (TGB). Our investigation is largely based on the multi-wavelength SED including Chandra, NuSTAR, Fermi and HAWC data. In the first two cases, we assume that the variable X-ray source CXO1928 is not associated with the HAWC source, and therefore the X-ray SED is unconstrained. In the TGB case, we assume that both the X-ray source and bright IR counterpart candidate are associated with the HAWC source. We do not consider an extra-galactic origin, such as hard-TeV blazars (MAGIC Collaboration et al., 2019) because the scenario seems implausible due to the lack of a radio galaxy counterpart (van Velzen et al., 2012) as well as no short-term ( hours) variability from the X-ray source (Pandey et al., 2017).
5.1. A putative PWN of the radio pulsar PSR J19281746
PSR J19281746 is one of the leading counterpart candidates for the HAWC source due to its positional coincidence. However, no nebula has been detected around the pulsar in the radio band (Cordes et al., 2006). Chandra observations yielded no X-ray detection of the pulsar, setting an upper limit of the unabsorbed flux in the 2–8 keV band erg cm-2 s-1 and erg cm-2 s-1, assuming that the putative PWN is extended over ′′ and ′, respectively.
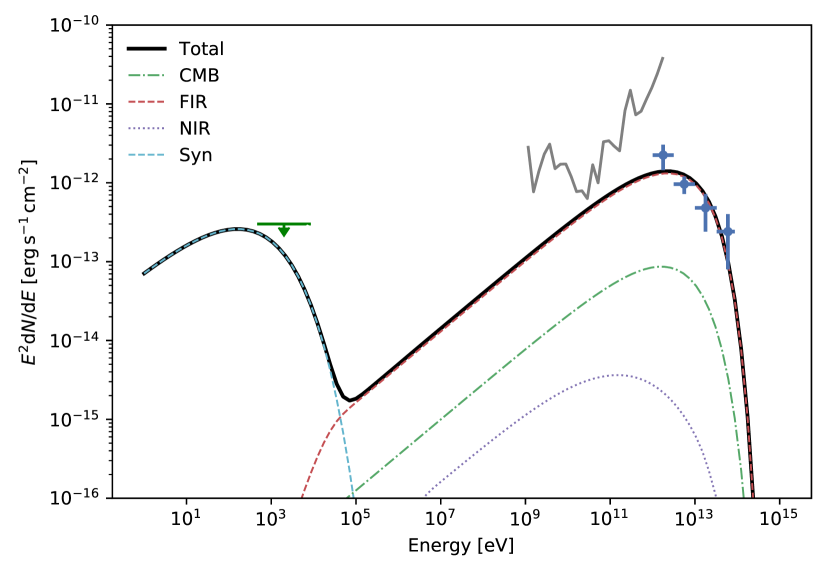
In PWN models, it is believed that synchrotron radiation produces radio to X-ray photons, and inverse Compton upscattering of the synchrotron (self-Compton; SSC) and/or the external IR/CMB radiation fields produces the TeV emission. In order to bound some of the PWN parameters, we applied the leptonic model, InverseCompton+Synchrotron, in the naima software package (Zabalza, 2015) to the multi-wavelength SED data. If we assume a compact PWN (′), the very-high TeV-to-X-ray flux ratio of 2HWC J1928177 () requires the PWN B-field far below the typical ISM value (G whereas G; Crutcher, 2012) and/or extremely high NIR and FIR densities at eV cm-3 for the typical PWN B-field range (G; Martin et al., 2014). The latter case is implausible since such a high radiation density in the IR/optical band is only observed in the Galactic Center (Davidson et al., 1992). Alternatively, the PWN radius can be reduced to pc, as a result of SNR reverse shocks crushing the nebula (Reynolds & Chevalier, 1984), in order to amplify the SSC component to fit the TeV spectra. However, the shock compression amplifies the magnetic field strength, and thus the synchrotron emission should be detectable in the radio and X-ray bands (Gelfand et al., 2007).
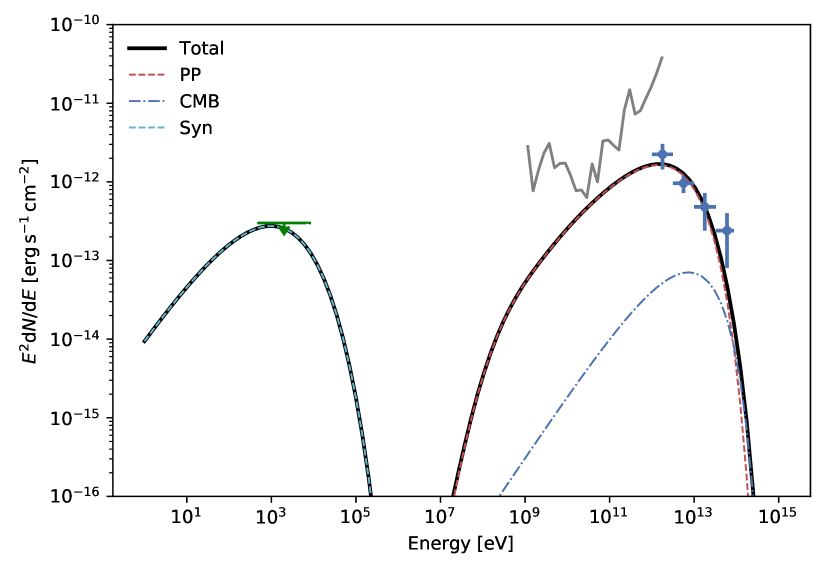
We found that the pure leptonic case is marginally plausible only when we assume a large PWN size of ′ or pc at the pulsar distance of 5.8 kpc (Nice et al., 2013), thus relaxing the X-ray flux upper limit to erg cm-2 s-1. According to Bamba et al. (2010) who studied the X-ray PWN size variation with the spin-down age, the 83-kyr old pulsar may well be extended beyond pc. For example, as shown in Figure 5, the SED data from X-ray to TeV bands can be fit with G and elevated IR radiation densities ( eV cm-3 and eV cm-3). Bamba et al. (2010) argued that such a extended, faint PWN can have its magnetic field strength decayed to below the typical ISM -field. Also, more recent observations of the region using WISE and Gaia data found five star clusters (Cmg 495, Cmg 497, Cmg 498, Cmg 499, and Liu & Pang catalog ID 1262) within ′ from the pulsar position, some of which could be embedded in molecular clouds (Camargo et al., 2015; Liu & Pang, 2019). These star clusters can contribute to enhancing ICS emission to the TeV flux level observed by HAWC. Therefore, we conclude that a diluted, unseen PWN associated with the radio pulsar can account for the TeV emission. A deeper X-ray survey around the pulsar may uncover diffuse X-ray emission like other faint X-ray PWNe detected by Bamba et al. (2010).
5.2. Hadronic interactions
Alternatively, the TeV emission could originate primarily from hadronic interactions as a result of collisions between relativistic protons and the ISM or nearby molecular clouds. Pion decays from proton-proton collisions are efficient TeV emitters, whereas the ICS component from -TeV electrons is suppressed at TeV due to the Klein-Nishina effect (Rieger et al., 2013). The molecular cloud G52.980.18 in the HAWC source region can serve as a target for hadronic interactions (Rice et al., 2016). From the molecular cloud’s measured mass, angular size, and distance of 4.49 M☉, 0.22∘, and 9.56 kpc, respectively, we estimated that the average hydrogen density is 130 cm-3. There is no radio or X-ray SNR within ′ from the HAWC source; however, soft X-ray emission from the putative SNR may be strongly absorbed. We assumed a putative SNR with the shell radius derived from the Sedov solution of where erg (the total SN energy released), kyrs (the spin-down age of the radio pulsar) and (the mean number density of the molecular cloud). We estimated that the SNR shell radius should be pc or ′ assuming that the source is located at the distance of the molecular cloud at 10 kpc (Rice et al., 2016). Alternatively, if we adopt the distance to the pulsar (5.8 kpc; Nice et al., 2013), the angular radius of the SNR should be ′.
To explore the hadronic scenario, we applied a combination of the leptonic and hadronic models in the naima package to the multi-wavelength SED data. We assumed that the particle energy spectrum follows a power-law with an exponential cutoff () because a single power-law model does not fit the SED. First, we fit the PionDecay model only in the gamma-ray band. A hard proton spectral index () and an exponential cutoff at TeV are required to give a SED model consistent with the Fermi GeV upper limit and HAWC TeV spectra. The total energy of relativistic protons (0.01–100 TeV) is erg. This corresponds to a small fraction (%) of the typical supernova energy ( erg).
Since the naima package does not track the by-product leptons from the PionDecay model, we added a separate leptonic model to constrain the secondary electron population so that their synchrotron emission does not over-predict the radio and X-ray flux upper limits. Note that the ICS component from the electron population needs to have a small contribution so as to not overshoot the TeV fluxes. Assuming the same energy spectrum for electrons and protons (i.e., with and TeV) and a typical ISM magnetic field strength ( G; Crutcher, 2012), we found that the total energy of relativistic electrons () should be less than erg (0.01–100 TeV) so as not to exceed the X-ray flux upper limit from a ′region around the radio pulsar (Figure 6). If the putative SNR is located at the molecular cloud distance ( kpc), its angular size is estimated to ′, which is larger than the FOV of the Chandra ACIS observations. Assuming that diffuse X-ray emission associated with the putative SNR is spatially uniform, the X-ray flux upper limit is higher by a factor of thus enhances the electron energy to erg. However, the small ratio of –0.03 is still difficult to reconcile with the p-p collision case since the total kinetic energy of secondary electrons (i.e. byproducts of charged pion decays) should be of the total radiation energy of gamma rays (Coerver et al., 2019). In order to yield the ratio comparable to , it requires a lower ambient -field, which seems implausible within a molecular cloud where the B-field should be amplified. Only if the extent of relativistic proton population is larger than ′ (e.g., the SNR may be older than the spin-down age), the resultant synchrotron emission may be consistent with the X-ray flux limits while G.
It is therefore possible that relativistic protons in a diluted, undetected SNR, extending over a ′ region, produce TeV gamma rays via collisions with the molecular clouds. Thus, diffuse X-ray or radio emission associated with the HAWC source could be too faint to be detected (Butt et al., 2008). Prior to observations by the Cherenkov Telescope Array (CTA) which may resolve the TeV emission (Cherenkov Telescope Array Consortium et al., 2019), it is essential to survey a larger region around the HAWC source with X-ray telescopes. Some TeV sources are associated with extended diffuse X-ray sources, and even non-detection of an X-ray counterpart can be useful for inferring the source type. XMM-Newton, with its large FOV, is best suited to search for other X-ray counterpart candidates in a larger region around the HAWC source.
5.3. A new TeV gamma-ray binary?
If the variable X-ray source CXO1928 is associated with the HAWC source, it may belong to a rare class of TeV gamma-ray binaries (Dubus, 2013). These systems are likely composed of a neutron star (NS) orbiting around a massive O/B star. The exact mechanism responsible for the non-thermal emission is still unknown. However, a possible scenario is that pairs from the pulsar wind are accelerated at the shock produced by the interaction between the pulsar and the stellar wind. The resultant high-energy electron population emits synchrotron and ICS radiation which accounts for the observed X-ray and gamma-ray emission, respectively (Tavani & Arons, 1997).

The X-ray spectral and timing signatures of CXO1928 – a single power-law spectrum with , long-term time variability and X-ray luminosity – are consistent with those of other TGBs with massive (O or B) companion stars (Dubus, 2013); such variability can be explained as due to varying or bulk Doppler boost as the system geometry changes with orbital phases (e.g., An & Romani, 2017). Unlike accreting X-ray binaries, the lack of X-ray aperiodic variability shorter than a day is consistent with the TGB scenario (Mori et al., 2017). In addition, both the TeV gamma-ray photon index () and the TeV to X-ray flux ratio () are in the typical parameter range for other TeV gamma-ray binaries (Dubus, 2013).
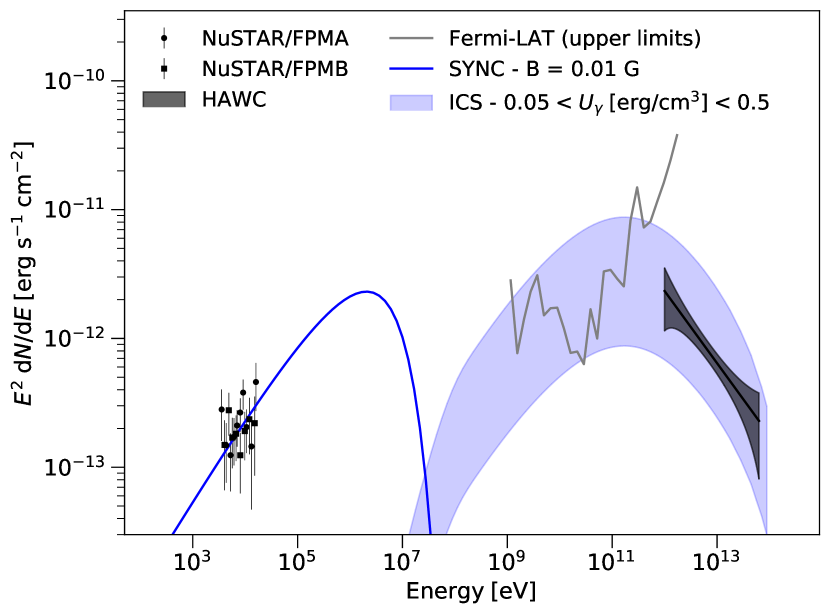
In order to further probe the TGB hypothesis, we compared the NuSTAR and HAWC SED data to a generic, analytical model based on the NS assumption (see more details in Archer et al., 2020). In this model the energy spectrum of the high-energy electron population is described by a power law with an exponential cutoff. While the normalization and the slope of the power law were obtained by fitting the NuSTAR data, the cutoff energy () was set to 100 TeV, which is assumed to be a minimum value to describe the HAWC observations. The typical -field strength within this scenario is 0.01–1 G (Archer et al., 2020). In Figure 7, we show the SED comparison in two cases in which G (top) and G (bottom). For values higher than that, it was found that the expected flux in the GeV band is too large and could not accommodate the lack of detection by Fermi-LAT.
From the high-energy electron spectrum obtained by fitting the NuSTAR data, we calculated the expected flux of gamma rays produced by ICS. The ICS photon field in this scenario is given by thermal UV photons from the O/B companion star, which we assumed to be at the typical temperature of K. The photon density () varies substantially with the distance of the shock from the companion star and therefore is strongly dependent on the geometry of the system which is unknown. Besides that, absorption within the system, which is also geometry dependent, may also affect the observed gamma-ray flux. Due to these limitations, it is only possible to loosely constrain the SED in the gamma-ray band. In Figure 7, we show filled bands for the ICS spectra for a given range of which can be reasonably expected for TGBs and would also be consistent with the HAWC data. Although the NuSTAR and the HAWC data were taken at different epochs and TGBs are very variable sources, the SED comparison shows that the data are consistent with the expectation from a TGB scenario. However, further broadband studies are required to confirm the TGB scenario, and particularly, detection of TeV variability would be a smoking gun. The non-detection of the HAWC source by VERITAS may indicate source variability similar to the TeV gamma-ray binary HESS J0632057 which was initially not detected by VERITAS (Acciari et al., 2009). If confirmed, 2HWC J1928177 may be a unique binary system emitting gamma rays up to TeV since no other known TGBs have been detected by HAWC above TeV (Rho, 2017).
6. Summary
-
•
2HWC J1928177 is one of the Galactic TeV sources detected by HAWC up to TeV and later confirmed by H.E.S.S. assuming an extended source. The non-detecion by VERITAS also suggests that the TeV emission may be extended or variable. There is no SNR, PWN or Fermi source coinciding with the HAWC source position.
-
•
The 83-kyr-old radio pulsar PSR J19281746 can account for the TeV emission in the pure leptonic scenario, only if its putative PWN is extended beyond ′. An alternative scenario could involve an unseen SNR whose shock produces the TeV emission via relativistic protons colliding with a nearby molecular cloud. The estimated proton energy ( erg) is reasonable as only a small fraction (%) of the supernova energy is required to power the TeV emission. In the hadronic scenario, diffuse X-ray emission from secondary electron synchrotron radiation over ′ should be present in the region.
-
•
NuSTAR and Chandra detected a bright X-ray source CXO1928 which overlaps with the HAWC source position. The non-thermal X-ray spectra, long-term X-ray flux variation, the lack of aperiodic variability on a time scale shorter than a day and a potential association with a bright IR source suggests the HAWC source may be a new TGB. However, it needs to be confirmed by detecting variability in the TeV band. Even if the HAWC source is extended, as suggested by the H.E.S.S and VERITAS observations, a TGB may be still present in the region. For example, in follow-up observations of the extended TeV source TeV J20324130 (Aliu et al., 2014), VERITAS recently detected PSR J20324127/MT91 213, a TeV gamma-ray binary system with a 50 year orbital period (Abeysekara et al., 2018), spatially coincident with the extended source.
-
•
The HAWC source, given its location in a complex region with star clusters and molecular clouds, may be composed of several TeV sources such as a faint (undetected) nebula of the radio pulsar and diffuse TeV emission from hadronic interactions and may be spatially resolved by the near-future CTA observatory. Until then, a large/deep X-ray survey around the HAWC source may provide clues of the source type. XMM-Newton, given its large FOV, is best suited to search for other X-ray counterpart candidates in a larger region around the HAWC source.
References
- Abdollahi et al. (2020) Abdollahi, S., Acero, F., Ackermann, M., et al. 2020, ApJS, 247, 33
- Abeysekara et al. (2017a) Abeysekara, A. U., Albert, A., Alfaro, R., et al. 2017a, ApJ, 843, 40
- Abeysekara et al. (2017b) —. 2017b, ApJ, 843, 39
- Abeysekara et al. (2018) Abeysekara, A. U., Benbow, W., Bird, R., et al. 2018, ApJ, 867, L19
- Abeysekara et al. (2018) Abeysekara, A. U., Archer, A., Benbow, W., et al. 2018, ApJ, 866, 24
- Abeysekara et al. (2019) Abeysekara, A. U., Albert, A., Alfaro, R., et al. 2019, ApJ, 881, 134
- Acciari et al. (2010) Acciari, V. A., Aliu, E., Arlen, T., et al. 2010, ApJ, 719, L69
- Acciari et al. (2009) —. 2009, ApJ, 698, L94
- Aliu et al. (2014) Aliu, E., Aune, T., Behera, B., et al. 2014, ApJ, 783, 16
- An & Romani (2017) An, H., & Romani, R. W. 2017, ApJ, 838, 145
- Archer et al. (2020) Archer, A., Benbow, W., Bird, R., et al. 2020, ApJ, 888, 115
- Bamba et al. (2010) Bamba, A., Anada, T., Dotani, T., et al. 2010, ApJ, 719, L116
- Butt et al. (2008) Butt, Y. M., Combi, J. A., Drake, J., et al. 2008, MNRAS, 385, 1764
- Camargo et al. (2015) Camargo, D., Bica, E., & Bonatto, C. 2015, Monthly Notices of the Royal Astronomical Society, 455, 3126
- Cherenkov Telescope Array Consortium et al. (2019) Cherenkov Telescope Array Consortium, Acharya, B. S., Agudo, I., et al. 2019, Science with the Cherenkov Telescope Array, doi:10.1142/10986
- Coerver et al. (2019) Coerver, A., Wilcox, P., Zhang, H., et al. 2019, ApJ, 878, 126
- Cordes et al. (2006) Cordes, J. M., Freire, P. C. C., Lorimer, D. R., et al. 2006, ApJ, 637, 446
- Crutcher (2012) Crutcher, R. M. 2012, ARA&A, 50, 29
- Davidson et al. (1992) Davidson, J. A., Werner, M. W., Wu, X., et al. 1992, ApJ, 387, 189
- Dubus (2013) Dubus, G. 2013, A&A Rev., 21, 64
- Gelfand et al. (2007) Gelfand, J. D., Gaensler, B. M., Slane, P. O., et al. 2007, ApJ, 663, 468
- Güver & Özel (2009) Güver, T., & Özel, F. 2009, MNRAS, 400, 2050
- HEASARC (2014) HEASARC. 2014, HEAsoft: Unified Release of FTOOLS and XANADU, ascl:1408.004
- H.E.S.S. Collaboration et al. (2016) H.E.S.S. Collaboration, Abramowski, A., Aharonian, F., et al. 2016, Nature, 531, 476
- H.E.S.S. Collaboration et al. (2018) H.E.S.S. Collaboration, Abdalla, H., Abramowski, A., et al. 2018, A&A, 612, A2
- Jardin-Blicq et al. (2019) Jardin-Blicq, A., Marandon, V., & Brun, F. 2019, in International Cosmic Ray Conference, Vol. 36, 36th International Cosmic Ray Conference (ICRC2019), 706
- Lazzati & Stella (1997) Lazzati, D., & Stella, L. 1997, ApJ, 476, 267
- Liu & Pang (2019) Liu, L., & Pang, X. 2019, The Astrophysical Journal Supplement Series, 245, 32
- Lopez-Coto et al. (2017) Lopez-Coto, R., Marandon, V., Brun, F., & HESS collaborations. 2017, ArXiv e-prints, arXiv:1708.03137
- MAGIC Collaboration et al. (2019) MAGIC Collaboration, Acciari, V. A., Ansoldi, S., et al. 2019, arXiv e-prints, arXiv:1911.06680
- Martin et al. (2014) Martin, J., Torres, D. F., Cillis, A., & de Oña Wilhelmi, E. 2014, MNRAS, 443, 138
- Mori et al. (2017) Mori, K., Gotthelf, E. V., Hailey, C. J., & Hord, B. J. 2017, ApJ, 848, 80
- Mori et al. (2015) Mori, K., Hailey, C. J., Krivonos, R., et al. 2015, ApJ, 814, 94
- Nice et al. (2013) Nice, D. J., Altiere, E., Bogdanov, S., et al. 2013, ApJ, 772, 50
- Pandey et al. (2017) Pandey, A., Gupta, A. C., & Wiita, P. J. 2017, The Astrophysical Journal, 841, 123
- Reynolds & Chevalier (1984) Reynolds, S. P., & Chevalier, R. A. 1984, ApJ, 278, 630
- Rho (2017) Rho, C. D. 2017, ArXiv e-prints, arXiv:1708.03726
- Rice et al. (2016) Rice, T. S., Goodman, A. A., Bergin, E. A., Beaumont, C., & Dame, T. M. 2016, ApJ, 822, 52
- Rieger et al. (2013) Rieger, F. M., de Oña-Wilhelmi, E., & Aharonian, F. A. 2013, Frontiers of Physics, 8, 714
- Tavani & Arons (1997) Tavani, M., & Arons, J. 1997, ApJ, 477, 439
- The Fermi-LAT collaboration (2019) The Fermi-LAT collaboration. 2019, arXiv e-prints, arXiv:1902.10045
- van Velzen et al. (2012) van Velzen, S., Falcke, H., Schellart, P., Nierstenhöfer, N., & Kampert, K.-H. 2012, A&A, 544, A18
- Wik et al. (2014) Wik, D. R., Hornstrup, A., Molendi, S., et al. 2014, ApJ, 792, 48
- Xin et al. (2019) Xin, Y., Zeng, H., Liu, S., Fan, Y., & Wei, D. 2019, ApJ, 885, 162
- Zabalza (2015) Zabalza, V. 2015, Proc. of International Cosmic Ray Conference 2015, 922