Artefacts of circumpolar cartography in radio pulsar polarization
Abstract
Single pulse data on radio pulsar polarization are traditionally presented in the form of two-dimentional greyscale patterns with the pulse longitude and polarization angle (PA) on the horizontal and vertical axis, respectively. Such diagrams reveal several enigmatic polarization effects: 1) bifurcations and loops of PA curve under central pulse components, 2) vertical spread of flux at all PA values, 3) exchange of power content between PA tracks of two orthogonal polarization modes (OPMs), and 4) peripherically-flat PA swings that span more than 180 degrees. It is shown that all these phenomena result from passage of observed polarization state near the pure-V pole of Poincaré sphere. Much of their complexity results from cartographic transformation from Poincaré sphere to the longitude-PA plane. An odd number of near-pole passage produces apparent replacement of OPMs power in the profile wings, although the same amount of flux keeps staying in each modal patch on the Poincaré sphere. The fitting of pulsar PA curves should therefore allow for transitions between the primary (strong) and secondary (weak) PA track. The Stokes-space (or Poincaré-sphere) representation of pulsar polarization data contains crucial polarization information and needs to accompany the traditional viewing if the published figures are to be fully useful for interpretation.
keywords:
pulsars: general – pulsars: individual: PSR B123725 – pulsars: individual: PSR B193316 – pulsars: individual: PSR B145168 (J14566843) – pulsars: individual: PSR J19002600 – radiation mechanisms: non-thermal.1 Introduction
Radio pulsar polarization has been studied both observationally (van Straten & Tiburzi 2017; Dai et al. 2015; Noutsos et al. 2015; McKinnon & Stinebring 1998; Karastergiou 2009) and theoretically (Hakobyan et al. 2017, Wang et al. 2010; Petrova & Lyubarskii 2000) for about half a century. Direct interpretation of polarization angle (PA) in terms of the sky-projected magnetic field direction justifies the usual way of data representation, which is the two-dimentional histogram (greyscale plot) of single-pulse samples on the plane of pulse longitude and PA (hereafter longitude-PA plane) (Rankin & Rathnasree 1997; Mitra et al. 2015; Stinebring et al. 1984; Hankins & Rankin 2010). Another presentation of pulsar polarization, namely the projection on the Poincaré sphere, has also been used though less frequently (Edwards & Stappers 2004; Osłowski et al. 2014).
The traditional presentation method (on the longitude-PA plane) resulted in identification of several enigmatic polarization effects. 1) The PA curve has been found to undergo bifurcations and complex distortions, usually observed under the central pulse component (‘core’) (eg. B123725, Smith et al. 2013). 2) At some pulse longitudes, especially near transitions between orthogonal polarization modes (OPMs) the observed flux is spread across all PA values. According to Ilie (2019, p. 129)111The PhD thesis of Cristina Ilie is freely available at the University of Manchester: https:www.research.manchester.ac.uk portalfiles104260195FULL-TEXT.PDF the radiation at OPM transitions in PSR B145168 (J14566843) is almost entirely circularly polarized, despite the average polarization degree is because of the integration over two OPMs. Average profiles of other pulsars show even much higher levels of circular polarization degree: exceeds in B191316 (Weisberg & Taylor 2002; see Fig. 1 in Dyks 2017), in the loop-like PA distortion observed in B193316 (Mitra et al. 2016). In the abnormal pulsation mode of PSR B123725 the average reaches almost (Srostlik & Rankin 2005). These values are large despite the averaging over the usual intrinsic spread of polarization states in different rotation periods, and despite the likely cancelling from summation over two orthogonal polarization modes. Such high polarization degree cannot result from noncoherent superposition of near-equal OPMs which is the most likely cause in the case of a weakly polarized signal (Melrose et al. 2006). 3) in some objects (eg. PSR B185726, Mitra & Rankin 2008) the power of OPMs seems to become exchanged, in the sense that the primary (stronger) polarization mode starts to follow the PA track of the secondary (weaker) mode. The distribution of polarized power observed in the outer wings of such profiles looks therefore asymmetric, with most power in the leading wing following one PA track, while most of the trailing wing radiation follows the other (orthogonal) track. 4) In contrast to prediction of the rotating vector model (RVM) the range of PA variation within some profiles (eg. PSR B185726, Mitra & Rankin 2008) exceeds , despite the horizontal orientation of the PA curve in the profile wings suggests equatorward viewing geometry.
2 Quasi-meridional circularization or near-vertical motion through Poincaré sphere
High circular polarization fraction has been observed in several pulsars, eg. in the PA loop of B193316 (Mitra et al. 2016). Empirical models of this PA distortion (eg. Fig. 13 in Dyks 2017, Fig. 23 in Dyks 2019) assume coherent summation of orthogonally-polarized waves with near equal amplitude and with longitude-dependent phase lag between the waves. The increasing phase lag corresponds to the near-meridional rotation of polarization state on the Poincaré sphere (the usual action of a linear retarder). This involves the passage of the polarization state near the pure-V pole (hereafter V pole) of the Poincaré sphere.
Moreover, new single-pulse data (Ilie 2019) clearly show that polarization state of pulsars sometimes changes with pulse longitude in a rather special way: the mode-specific patch of flux on the Poincaré sphere moves vertically, or quasi-vertically upward or downwards. In the course of its motion, the modal patch is passing very close to the V pole of the Poincaré sphere. An example of such phenomenon is PSR B145168, in which both orthogonal modal patches undergo such circularization and pass across both V poles (Fig. 3.45 in Ilie 2019). There are in total four near-pole passages in this object, therefore, the eccentricty angle of polarization ellipse follows two curves that form a bow-tie shape (Fig. 3.44 in Ilie 2019).
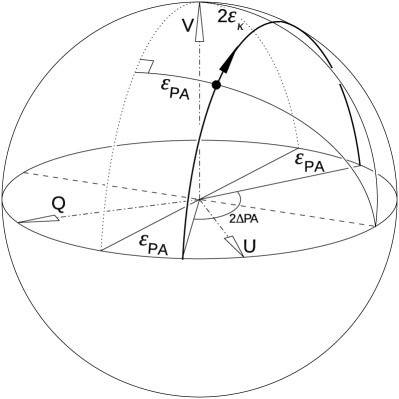
The physical reason for the circularization is unknown, however, it is not needed to understand the enigmatic look of the above-mentioned effects, at least on geometrical level. The meridional rotation of the polarization state may result from intrinsic properties of the emission mechanism or from propagation effects. To facilitate the discussion, however, it is assumed in the following that the circularization results from coherent superposition of two orthogonally polarized natural waves (Dyks 2017; 2019; Edwards & Stappers 2004). If the phase delay between the combined waves is changing with pulse longitude, the observed flux patch moves on the Poincaré sphere: it is rotated around an axis defined by the natural modes. The patch observed on the sphere can stay local (when it is identified as the ‘observed polarization mode’) or can extend into an arc in the case of spread in the phase delay values (which also has been observed, eg. near the V poles in B145168). If the natural waves are linearly polarized the axis of patch rotation is equatorial, ie. it is contained in the equatorial plane (dashed lin e in Fig. 1). The ratio of the waves’ amplitudes (or the mixing angle ) then determines whether the observed patch follows a meridian or a small circle on the sphere.
Let us assume that only one polarization mode is observed, ie. the supposed natural waves’ superposition produces only one modal patch on the Poincaré sphere. In the case of identical amplitudes of the superposed waves, the patch moves meridionally, passing centrally through the pole (this would correspond to the motion along the dotted meridian in Fig. 1). If the amplitudes are similar but not identical, the patch moves nearly meridionally, and the observed PA stays almost constant until the patch is passing near the V pole of the sphere. In Fig. 1 such type of motion is shown with the bullet which is following the solid non-meridional circle. During the near-pole passage, the closest approach angle of is reached, and the PA quickly changes to an almost orthogonal value. The discrepancy from the orthogonality of the initial and final PA can be denoted as . If the traverse of the patch starts and ends near the equator, then is equal to the minimum angular distance from the vertical (Stokes V) axis :
| (1) |
where is the maximal (or minimal) ellipticity angle, i.e. , where is the linearly polarized flux. Eq. (1) is valid if other effects (eg. of the RVM origin) do not contribute to the change of PA. In flat parts of an observed PA curve, which often occur in millisecond pulsars, and sometimes in normal pulsars, this equation can be used to test if the superposed natural waves are linearly polarized (i.e. if the patch rotates around an equatorial axis). In general it is necessary to take into account the RVM changes of PA, and the off-equatorial orientation of the patch-rotation axis.
3 Cartographic effects
3.1 Apparent OPM jumps from passage through the V pole
Opposite azimuths mean orthogonal PAs, therefore, the passage of the patch (ie. passage of the observed polarization state) through the V pole of the Poincaré sphere results in an apparent OPM transition: the radiative power moves to the other (orthogonal) PA track, although there is no real OPM change, because only one patch of flux may actually exist on the whole Poincaré sphere.
If the secondary (weaker) orthogonal mode is also observed, another weaker patch is present at the antipodal point of the Poincaré sphere. This secondary patch follows a ‘mirrored’ motion on the sphere, ie. the patch is passing through the other V pole and makes simultaneous transition to the other (originally primary) PA track.
The observed replacement of power between the primary and secondary PA tracks is therefore only an apparent effect: the OPM transition between the PA tracks is observed, however, it has nothing to do with one mode becoming stronger than the other. The modes keep maintaining their typical power, it is their location with respect to the V pole, not their power, that has changed.
Such apparent OPM transition (effect of the near-pole passage) can possibly occur either odd or even number of times in a pulse profile, hence it is possible to observe the asymmetrically polarized profiles with the primary (large) radiative flux on the leading side, and the secondary (low) flux on the trailing side of the same (single) RVM track. It must be emphasized, however, that the asymmetry can also be caused by a single usual (standard) OPM change.
In the case of a slightly non-meridional patch motion, the pole passage may result in a quasi-orthogonal OPM jump. If the patch is rotated around an equatorial axis (linearly polarized natural waves, Fig. 1), then the PA will change by the amount given by eq. 1. This may be responsible for at least some quasi-orthogonal OPM jumps observed in several objects. In other cases the ‘real’ modes (local patches on Poincaré sphere) are indeed quasi-orthogonal (eg. Ilie et al. 2020).
3.2 Complex polarization in the core components
Because of the cartographic transformation between the Poincaré sphere and the longitude-PA plane, the innocuous near-pole passage of polarization state causes extremely strong effects to appear in the longitude-PA diagrams. In particular, the complex polarization observed in pulsar cores (especially the distorted PA tracks on the longitude-PA diagrams) can be understood as the result of the V pole passage (more generally as the off-equatorial motion of polarization state on the Poincaré sphere).
First, while the patch is passing near the pole, the pole becomes immersed within the patch, hence all azimuths and all PAs appear in the samples recorded at that pulse longitude. Therefore, vertical bands of power stretch across the full vertical range in the longitude-PA diagrams. The PA loop of PSR B193316 is an example of such phenomenon (Mitra et al. 2016). Other examples can be found in Ilie (2019), eg. PSR J19002600, see Fig. 3.64 on p. 151 therein, the near-pole passage occurs at pulse longitude .
Moreover, at a fixed pulse longitude, all data samples in direct vicinity of the V pole are likely to have similar polarization characteristics (such as, for example, the degree of circular polarization). Therefore, the vertical band of spread flux (in the longitude-PA diagram) should contain a component of radiative power which has the same polarization at any PA. This is expected because the local point, ie. the V pole on the Poincaré sphere is multiazimuthal and contributes everywhere within the whole vertical band.
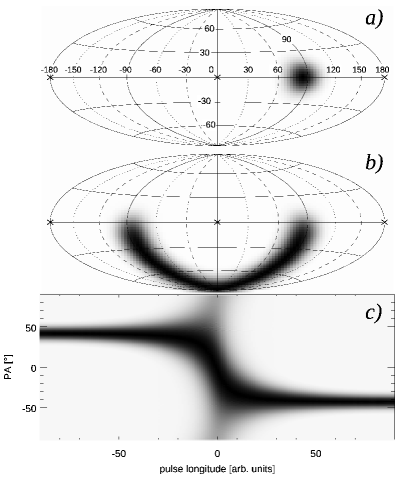
Depending on its initial position in the equatorial plane, the moving patch (that is being rotated around some equatorial axis) follows an arc that can pass on either side of the V pole. Let us assume that the center of some patch is passing on the ‘western’ (say ‘American’) side. For an extended patch, however, some part of the flux (in a peripheric region of the same patch) will simultaneously pass on the other (‘eastern’ or ‘Australian’) side. Passing on the other side implies that azimuth (hence PA) will change in the opposite way (the azimuth increases on one side, while it decreases on the other side of pole). This is why a minor part of flux follows the upward distortion of PA in the PA loop of B193316, whereas most of the observed flux follows the downward path (Mitra et al. 2016). Fig. 2 shows this effect for a Gaussian patch that missed the V pole by . Panel c shows the longitude-PA diagram which results from the continuous patch motion shown in panel b.222In agreement with observations (PSR B145168, J19002600, B193316), the modelled OPM-transition feature is weak because of the vertical stretch of flux on the longitude-PA diagrams. In Figs. 2c and 3c, however, the flux is normalized separately for each longitude, to make the feature clearly visible. The same V-pole-graze is responsible for the PA bifurcations in the model result of Fig. 13 in Dyks (2017).
3.3 Bifurcations of PA track
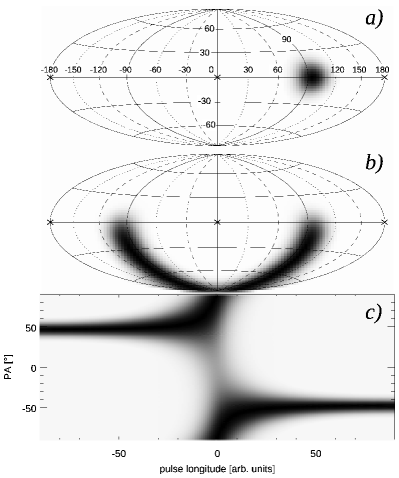
In PSR B123725 the PA track bifurcates into two branches of comparable magnitude. Smith et al. (2013) have shown that the PA follows different branch (turning either upward or downward) in different pulsation modes. The upper branch is followed in the normal mode, whereas the lower one – in the core-bright abnormal mode. As shown in Figs. 2 and 3, this is exactly what happens if the patch passes on either side of the V pole of the Poincaré sphere. The difference is thus caused by the fact that the azimuth (and PA) is sampled in the opposite direction while passing on either side of the V pole.
The side on which the pole is passed by changes abruptly with a small and continuous displacement of the arc that is followed on the Poincaré sphere. In terms of the model based on the coherent superposition of two waves of different amplitude, a minor change of the amplitude ratio can switch the side on which the pole is passed. This is why the bifurcation looks as so ‘drastic’ phenomenon on the longitude-PA diagram. Actually, the ratio of the superposed waves’ amplitudes (consequently, the initial position of patch on the Poincaré sphere) may change very little to produce the opposite turn of the PA track (cf. Figs. 2 and 3).
The approach of a polarization state to the V axis of the Stokes parameter space tends to simultaneously increase and decrease , hence the minima of the latter coincide with maxima of in the observations.
This interpretation of core polarization supercedes that of Dyks (2017), where opposite changes of phase delay were considered in different pulsation modes (section 4.7.1 therein). That model implied opposite sign of in both pulsation modes.
Here the PA track bifurcation is caused by the different side of the V pole passage, albeit confined to the same hemisphere of the Poincaré sphere. Therefore, this interpretation is consistent with the same sign of observed in both pulsation modes, ie. both in the upper and lower branch of the PA bifurcation. In terms of the coherent wave superposition, this implies a slightly different wave amplitude ratio in both pulsation modes. In the case of B123725, however, the question of whether the side of pole passage is changed continuously or in a discrete way remains unsolved.
The pole-passage-driven change of PA may be caused by intrinsic emission mechanism or propagation effects. In addition to these, the value of PA can simultaneously change because of the RVM effect (the star-spin-induced change of the sky-projected magnetic field direction). These two effects can easily combine to produce the range of PA variation exceeding , even in the case when the PA curve is equatorward (or flat in the profile wings, see Mitra & Rankin 2008).
The pole passage effect transports the observed flux between the orthogonal PA tracks, thus making the impression of two modes, even if there is only one. This implies that separation of modes into OPMs needs to be done by following the modal patches on the Poincaré sphere, rather than following the RVM PA tracks, which has been normal practice so far (eg. Smith et al. 2013). To isolate the modes, each modal patch must be watched separately, regardless of which PA track it belongs to.
4 Conclusions
Pulsar data contain two different types of OPM jumps - the traditional one associated with exchange of the brighter mode, and another one - resulting from the V pole passage. The latter is ‘not real’ since it does not involve exchange of the dominant mode nor even requires the presence of the second mode. A single polarization mode (single patch on the Poincaré sphere) can be detected as two OPMs, as soon as the mode passes through the V pole somewhere in the profile. Since the pole’s coordinates transform to a plane in the well known specific way, the longitude-PA representation of polarization suffers from ‘spurious’ effects which disappear or look much less enigmatic on the Poincaré sphere.
Whatever is the physical origin of the near-meridional circularization, several observed complexities have its origin in just the coordinate transformation: the misleading impression of OPM jumps, vertical spread of flux across all PAs, bifurcations of PA track, ‘horns and tongue’ shape of the PA distortion in B193316, the ‘too-large’ range of the equatorward PA, and the apparent replacement of power between the observed PA tracks.
The Poincaré sphere representation of pulsar polarization is therefore indispensable for clear data interpretation and it is much desired to supplement the traditional viewing methods. Separation of polarization modes should be best done on the Poincaré sphere whereas the traditional modelling of observed PA must allow for transitions of a single RVM curve between the primary (strong) and secondary (weak) regions of PA on the longitude-PA diagram.
This paper has focused on effects of near-pole passage of polarization state, typical of near-meridional circularization. This must be just a special case of more general off-equatorial motion through the Poincaré sphere. Polarization data such as those of PSR B191316 (Fig. 1 in Dyks 2017) show maxima of coincident with OPMs, albeit is very high there. Such cases with suggest modal patch motion at a further distance from the V pole, ie. a motion that is oblique with respect to the equatorial plane of the Poincaré sphere (similar to following the ecliptic instead of the equator in the Solar System). This corresponds to the coherent superposition of orthogonal natural waves that are polarized elliptically, although other interpretations are allowed. The phenomenon is worth further study from both theoretical and observational side.
Aside from its unsettled physical origin, the off-equatorial motion of polarization state, including the near-meridional circulation of patch on the Poincaré sphere, is the key effect that complicates the look of observed PA curves, especially within core components.
acknowledgements
This work was supported by the grant 2017/25/B/ST9/00385 of the National Science Centre, Poland.
References
- Dai et al. (2015) Dai S., Hobbs G., Manchester R. N., Kerr M., Shannon R. M., van Straten W., Mata A., Bailes M., Bhat N. D. R., et al., 2015, MNRAS, 449, 3223
- Dyks (2017) Dyks J., 2017, MNRAS, 472, 4617
- Dyks (2019) Dyks J., 2019, MNRAS, 488, 2018
- Edwards & Stappers (2004) Edwards R. T., Stappers B. W., 2004, A&A, 421, 681
- Hakobyan et al. (2017) Hakobyan H. L., Beskin V. S., Philippov A. A., 2017, MNRAS, 469, 2704
- Hankins & Rankin (2010) Hankins T. H., Rankin J. M., 2010, AJ, 139, 168
- Ilie (2019) Ilie C. D., 2019, PhD Thesis, The University of Manchester
- Ilie et al. (2020) Ilie C. D., Weltevrede P., Johnston S., Chen T., 2020, MNRAS, 491, 3385
- Karastergiou (2009) Karastergiou A., 2009, MNRAS, 392, L60
- McKinnon & Stinebring (1998) McKinnon M. M., Stinebring D. R., 1998, ApJ, 502, 883
- Melrose et al. (2006) Melrose D., Miller A., Karastergiou A., Luo Q., 2006, MNRAS, 365, 638
- Mitra et al. (2015) Mitra D., Arjunwadkar M., Rankin J. M., 2015, ApJ, 806, 236
- Mitra et al. (2016) Mitra D., Rankin J., Arjunwadkar M., 2016, MNRAS, 460, 3063
- Mitra & Rankin (2008) Mitra D., Rankin J. M., 2008, MNRAS, 385, 606
- Noutsos et al. (2015) Noutsos A., Sobey C., Kondratiev V. I., Weltevrede P., Verbiest J. P. W., Karastergiou A., Kramer M., et al. 2015, A&A, 576, A62
- Osłowski et al. (2014) Osłowski S., van Straten W., Bailes M., Jameson A., Hobbs G., 2014, MNRAS, 441, 3148
- Petrova & Lyubarskii (2000) Petrova S. A., Lyubarskii Y. E., 2000, A&A, 355, 1168
- Rankin & Rathnasree (1997) Rankin J. M., Rathnasree N., 1997, Journal of Astrophysics and Astronomy, 18, 91
- Smith et al. (2013) Smith E., Rankin J., Mitra D., 2013, MNRAS, 435, 2002
- Srostlik & Rankin (2005) Srostlik Z., Rankin J. M., 2005, MNRAS, 362, 1121
- Stinebring et al. (1984) Stinebring D. R., Cordes J. M., Rankin J. M., Weisberg J. M., Boriakoff V., 1984, ApJS, 55, 247
- van Straten & Tiburzi (2017) van Straten W., Tiburzi C., 2017, ApJ, 835, 293
- Wang et al. (2010) Wang C., Lai D., Han J., 2010, MNRAS, 403, 569
- Weisberg & Taylor (2002) Weisberg J. M., Taylor J. H., 2002, ApJ, 576, 942