History-dependent percolation in two dimensions
Abstract
We study the history-dependent percolation in two dimensions, which evolves in generations from standard bond-percolation configurations through iteratively removing occupied bonds. Extensive simulations are performed for various generations on periodic square lattices up to side length . From finite-size scaling, we find that the model undergoes a continuous phase transition, which, for any finite number of generations, falls into the universality of standard 2D percolation. At the limit of infinite generation, we determine the correlation-length exponent and the fractal dimension , which are not equal to and for 2D percolation. Hence, the transition in the infinite-generation limit falls outside the standard percolation universality and differs from the discontinuous transition of history-dependent percolation on random networks. Further, a crossover phenomenon is observed between the two universalities in infinite and finite generations.
I Introduction
Percolation, originally proposed for modeling transport behavior in a random medium Broadbent and Hammersley (1957), has numerous applications in various areas of science and technology Grimmett (1999). In the standard bond percolation on a given lattice, each bond is independently occupied with probability , and a cluster corresponds to a set of sites connected together by occupied bonds. As increases, the bond percolation undergoes a continuous transition at percolation threshold from a state of locally connected sites to the percolating phase with an infinitely spanning cluster Stauffer and Aharony (2018). In two dimensions, the critical exponents (for correlation length) and (for order parameter) are predicted by conformal field theory Cardy (1987), Coulomb gas theory Nienhuis (1987) and stochastic Loewner evolution Lawler et al. (2000), and confirmed exactly in the triangular-lattice site percolation Smirnov and Werner (2001). In the renormalization-group treatment, these exponents are related to the thermal and magnetic renormalization exponents as and . The magnetic exponent is also referred to as the fractal dimension for critical percolation clusters.
Phase transitions in unconventional percolation models has been a compelling topic Araújo et al. (2014). Explosive percolation transitions on random graphs da Costa et al. (2010); Friedman and Landsberg (2009); Riordan and Warnke (2011) and square lattices Radicchi and Fortunato (2010); Ziff (2010) were confirmed to be continuous. Rare examples of discontinuous percolation transition come from the bootstrap percolation Chalupa et al. (1979); Adler (1991); Choi and Yu and cascading failure Buldyrev et al. (2010); S.-W. Son (2012) models. Persistent attention has been paid to critical phenomena of the percolation models that involve manipulations of cluster structures Schrenk et al. (2016); Hilário and Sidoravicius (2019); Jovanović et al. (1994); Liu et al. (2015); Li et al. (2020).
In real-world networks, there may simultaneously exist different types of connections between pairs of sites (nodes), and these different connections can interact with each other. For instance, information can spread on social networks with multiple communication channels. It is common that various diseases coexist in society and the spread of a disease depends on the spread of other diseases and immunization information. The history-dependent percolation (HDP) model was proposed as a primitive model to mimic some basic features of such multiplex networks Li et al. (2020). It has been demonstrated Li et al. (2020) that the history-dependent process can extract crucial characteristics of networks from the empirical data of brain scans and social networks.
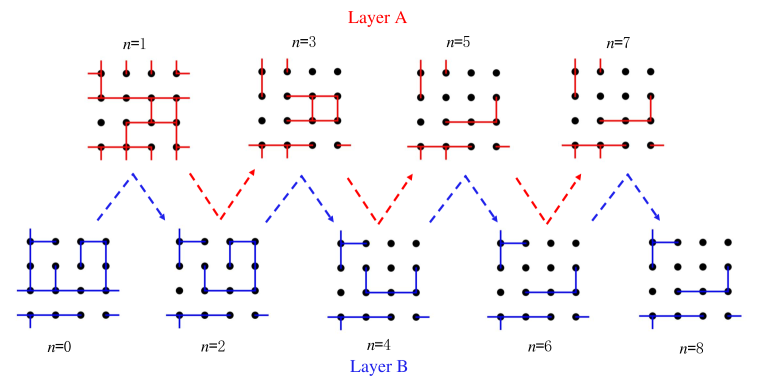
The HDP model has the bond-occupation probability as a free parameter (as in the standard bond percolation), while it introduces the coupling between different types of connections in a dynamic process. An example is illustrated in Fig. 1. First, one generates two random and uncorrelated bond configurations with probability , labeled as generation and . Then, one sequentially visits each occupied bond in the configuration, and deletes the occupied bond iff its two ending sites belong to different clusters in the configuration. Applying this operation to the generation deterministically leads to a new configuration, which is specified by . Analogously, the configuration is obtained from according to its coupling to the configuration. Repeat the procedure until no more bonds can be removed–i.e., the configurations become saturated. For and , the model is simply the standard bond percolation, and for , it is called HDP.
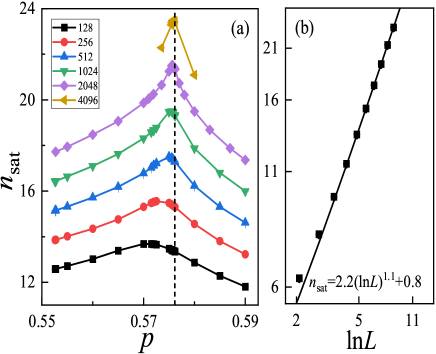
The generation number 111In actual simulations, we halt the iterations once two consecutive evolutions do not make any change to configurations, and the generation number of ending configuration is taken as . of saturated generation is a random number depending on the initial and 1 configurations. On the square lattice, Fig. 2(a) plots the Monte Carlo data for the statistical average as a function of the initial bond-occupation probability . For a given system size , has a maximum at . As increases, the peak location quickly converges to , which corresponds to the percolation threshold in the limit (as shown later). Besides, there is an important feature that, irrespective of the bond-occupation probability , the value diverges approximately as , as illustrated in Fig. 2(b). This means that, given any finite value of , the configuration at the th generation is not saturated as long as is sufficiently large. Thus, to explore the HDP model in the limit, one has to repeat the aforementioned evolution till the saturated generation, and sample quantities of interest from the corresponding saturated configurations.
In Ref. Li et al. (2020), the phase transition of HDP was studied as a function of on randomly networked structures including Erdős–Rényi network and scale-free network. For any given finite generation , a percolation transition was found to be in the mean-field percolation universality class. Directly in the limit, for which the configurations in actual simulations are taken from those at , it was shown that the percolation transition is discontinuous.
Given that lattices and random networks are complementary testbeds for the insights into percolation transitions, we study the HDP on the square lattice. The remainder of the paper is organized as follows. Section II summarizes main findings. Section III introduces numerical methodology with an emphasis on sampled quantities. Section IV presents numerical results: subsection IV.1 and IV.2 present the determination of percolation thresholds and critical exponents, respectively; subsection IV.3 demonstrates the geometric properties of critical clusters for infinite generation; subsection IV.4 focuses on the crossover behavior of critical phenomenon from infinite to finite generation. Discussions are finally given in Sec. V.
II Summary of main findings
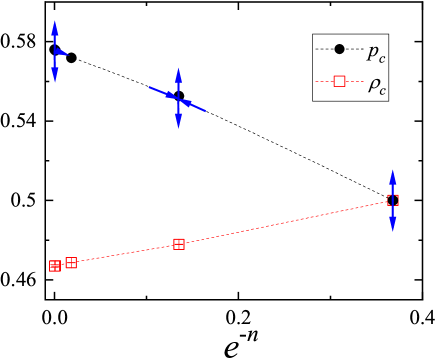
We perform Monte Carlo simulations for the HDP on periodic square lattices with ranging from to . For each generation , the connectivity of the corresponding graph is investigated as a function of the bond-occupation probability , which is used to generate the and configurations, and the percolation threshold is determined. As shown in Fig. 3, increases with .
For the finite generations , and , we find that the model exhibits a continuous transition whose critical exponents are consistent with and for the standard uncorrelation percolation model in two dimensions. In the infinite-generation limit, a continuous phase transition is observed at . However, the estimated thermal and magnetic renormalization exponents, and , are significantly different from those for the two-dimensional (2D) percolation model, indicating the emergence of a new universality class in the limit.
The continuous transition in infinite generation is further confirmed from the critical distribution function of the largest-cluster size , which follows a single-variable function with [, ]. In addition, at , the cluster-number density of size obeys the standard scaling formula of a continuous transition, with the hyper-scaling relation .
To further explore the distinct universality classes for the infinite and the finite generation, we demonstrate the crossover phenomenon from the size-dependent behavior of various quantities and self-defined effective critical exponents.
III Methodology, quantities of interest, and scaling ansartz
For each generation of the percolation configurations, we identify clusters of connected sites using the breadth-first search, and sample observables that are analogous to those in high-precision Monte Carlo studies of standard percolation models Ziff and Newman (2002); Wang et al. (2013); Xu et al. (2014) and relevant models Lv et al. (2012); Xu et al. (2019); Lv et al. (2020).
In principle, the infinite generation stems from standard bond percolation () through an infinite number of generations. In practice, for , the configurations on each layer (Fig. 1) no longer change with increasing and are already in the infinite-generation limit. We further confirm the equivalence of sampling infinite generations on the two layers; in what follows, we analyze the results of infinite generation with Layer B.
More specifically speaking, for each generation , the following observables are defined:
-
•
The number of occupied bonds remaining at the generation.
-
•
The size of the largest cluster.
-
•
The second moment of cluster-size distribution , where the summation runs over all clusters.
-
•
The observables and , which equal if a cluster wraps around the periodic lattice in and direction, respectively, and equal otherwise.
For each generation, we sample the following quantities using aforementioned observables:
-
•
The density of occupied bonds . For and 1, one has .
-
•
The mean size of the largest cluster .
-
•
A susceptibility-like quantity .
-
•
The wrapping probability
(1) which gives the probability that a wrapping exists in the direction. In particular, for the 2D standard percolation, the critical value is exact in the limit Newman and Ziff (2001).
-
•
Let be the total number of occupied bonds in generation and . We define the covariance of and as
(2) which relates to the derivative of with respect to by .
For analyzing continuous phase transitions, we employ the tool of finite-size scaling (FSS) theory, which predicts that a quantity near criticality scales as
| (3) |
where is a scaling function. The scaling exponent is quantity-dependent. Quantities and can be related to order parameter and susceptibility, and hence have scaling exponents and , respectively Stauffer and Aharony (2018). Quantity is dimensionless () Newman and Ziff (2001), while the scaling exponent for is Wang et al. (2013); Xu et al. (2014).
IV Numerical results
IV.1 Percolation thresholds
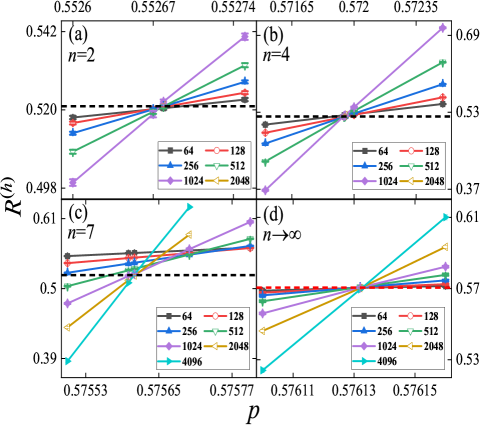
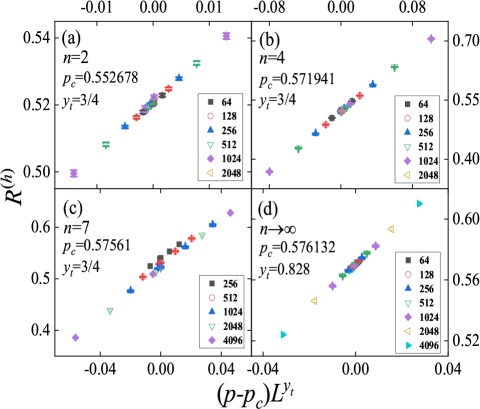
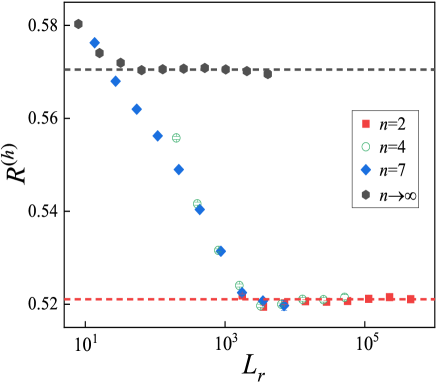
Finite generations. The finite-size Monte Carlo data of the wrapping probability are plotted in Figs. 4(a), (b) and (c) for , and , respectively. For each , the intersections of the versus curves for are around a finite bond-occupation probability . Meanwhile, the vertical coordinates for the intersections converge to a finite value around , which seems universal among these finite generations and agrees with the exact value of the continuous transition in 2D standard percolation.
By the least-squares criterion, we fit the Monte Carlo data of to the formula
| (4) | |||||
which is an explicit form of (3) for with additional finite-size correction terms and . The critical wrapping probability is expected to be universal among the transitions in the same universality and on the same lattice geometry. The parameters and (; ) are non-universal. The leading correction exponent is denoted as , while the subleading correction exponent is fixed to be .
In the fits, we try to include subleading terms such as , and terms or their combinations. This would be useful for a systematical justification on the evidence level of the fits. Besides, preferred fits should feature stability against varying that denotes the minimum size incorporated, and ensure that the Chi squared per degree of freedom (DF) is not larger than .
For the finite generation , we first include the correction terms with and , and obtain , and . These estimates for and further imply a transition in the standard percolation universality. As is fixed to be , we have , and . As and are both fixed, we obtain and . On this basis, we let , and all fixed for reducing uncertainties, and obtain .
| /DF/ | |||||
| 2 | 0.552 679(6) | 0.522(7) | 0.74(4) | 0(2) | 3.7/15/16 |
| 0.552 678(1) | 0.521 058 29 | 0.75(4) | 3.8/19/8 | ||
| 0.552 678(2) | 0.521 1(4) | 3/4 | 1 | 3.7/17/16 | |
| 0.552 677 6(9) | 0.521 058 29 | 3/4 | 1 | 3.7/18/16 | |
| 4 | 0.571 940(3) | 0.520(2) | 0.743(6) | 2(4) | 7.4/15/64 |
| 0.571 941(1) | 0.521 058 29 | 3/4 | 1.0(5) | 8.8/17/64 | |
| 0.571 941(2) | 0.521 0(8) | 3/4 | 1 | 8.8/17/64 | |
| 0.571 941(1) | 0.521 058 29 | 3/4 | 1 | 8.6/14/128 | |
| 7 | 0.575 613(1) | 0.521 058 29 | 0.77(1) | 1.2(1) | 12.3/12/128 |
| 0.575 607(4) | 0.518(3) | 0.72(5) | - | 0.3/2/2048 | |
| 0.575 608(3) | 0.519(3) | 3/4 | - | 0.7/3/2048 | |
| 0.576 132 3(5) | 0.570 7(2) | 0.85(2) | - | 8.1/11/256 | |
| 0.576 132 2(6) | 0.570 7(3) | 0.85(2) | - | 7.9/8/512 | |
| 0.576 131 7(8) | 0.570 2(6) | 0.86(3) | - | 6.7/5/1024 |
Similar analyses are performed for , for which the results of fits can be found in Table 1.
As indicated by Fig. 4(c), the finite-size corrections become severe for . Hence, simulation results for large lattices are a must to achieve an extensive set of preferred fits. As is fixed, we find , and . As we incorporate merely large enough sizes with and preclude correction terms, the results are , and . As is further fixed, we obtain and .
Finally, by comparing preferred fits, we estimate percolation thresholds as (), () and (), where each error bar consists of one statistical error and a subjective estimate of systematic error. The estimates of critical wrapping probabilities are (), () and (), which agree well with the exact value of 2D standard percolation. Moreover, the correction term with () emerges in FSS, differing from the leading correction term with of critical wrapping probabilities in standard percolation Newman and Ziff (2001). It is noteworthy that the correction exponent was also found for 2D percolation Ziff (2011).
Infinite generation. For the infinite generation , the versus curves are plotted in Fig. 4(d), which demonstrates that the intersections are located around , where is close to . The intersections are nearly coincident at (0.576 13, 0.570), indicating a continuous transition and minor finite-size corrections. Hence, we perform fits to (4) by dropping correction terms. As shown in Table 1, the results obtained from the fits with , and are consistent. The final estimates of percolation threshold and critical wrapping probability are and , respectively. The value of differs from that of standard percolation and indicates a new universality class.
IV.2 Critical exponents and
We now focus on the Monte Carlo data at the above-estimated percolation thresholds, where the FSS formula (3) is simplified as
| (5) |
with finite-size correction terms and , and the constant . In some cases, a constant term from analytic background should be included in addition to (5).
The critical exponent . We estimate the critical exponent from the covariance which relates to the derivative . Fits are performed according to (5) with . For , we obtain with and , as the constant term and the correction terms and are not included. Similarly, for , we obtain with and . For , stable fits are achieved if term is present. Accordingly, we have with and . The final estimate of for each of the finite generations is achieved by comparing preferred fits. As summarized in Table 2, the results of consist with the exact value of standard 2D percolation. For the infinite generation , as listed in Table 3, we obtain , and , with , and , respectively. As given in Table 4, our final estimate of for is ; the error bar is enlarged, since some finite-size corrections might be ignored in the fitting formula.
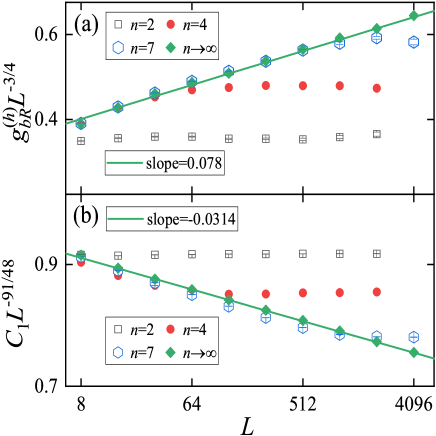
For illustrating , we plot in Fig. 5(a) the scaled covariance for various generations. For the finite generations , and , the scaled data eventually become constants as increases. For the infinite generation , deviation from the behavior of standard percolation is demonstrated by the non-zero slope , which measures the distance from to .
Another verification for the estimated is provided by Fig. 6, where we plot versus for various . These plots serve as simultaneous illustrations for the estimated ( for , , and 0.828 for ), the estimated , and the scaling formula (3). For each , the scaled data of various collapse compactly on top of each other as .
The critical exponent . The critical exponent can be estimated from and according to (5) with and , respectively. For , we obtain by , and by . For , we have by , and by . For , we obtain by , and by . The final estimates of for finite generations are given as (), () and (), which are consistent with the exact value of standard percolation. The results for the infinite generation are exemplified in Table 3, and our final estimate of is .
In Fig. 5(b), the scaled data for finite generations converge to constants as increases, confirming . Meanwhile, the scaled data for clearly deviate from the behavior in standard percolation universality and confirm .
| 2 | 4 | 7 | exact | |
|---|---|---|---|---|
| 0.552 678(2) | 0.571 941(4) | 0.575 61(1) | - | |
| 0.751(5) | 0.74(1) | 0.75(2) | 3/4 | |
| 1.896 0(3) | 1.896 5(8) | 1.895(2) | 91/48 | |
| 0.521 2(6) | 0.521(2) | 0.519(4) | 0.521 058 290 |
| 0.827(1) | 11.0/5/64 | |
| 0.829(1) | 3.9/4/128 | |
| 0.827(2) | 2.5/3/256 | |
| 1.864 7(1) | 14.2/5/32 | |
| 1.864 3(2) | 4.6/4/64 | |
| 1.864 0(3) | 2.1/3/128 | |
| 1.729 1(1) | 7.4/5/64 | |
| 1.729 3(1) | 5.4/4/128 | |
| 1.729 1(2) | 4.5/3/256 | |
| 0.576 132(2) | 0.828(5) | 1.864 4(7) | 0.570 5(8) |
IV.3 Geometric properties of critical clusters
We have found that the transition in infinite generation is continuous and falls outside the universality of standard percolation. In following, we explore the geometric properties of critical clusters. We investigate the critical probability distribution of largest-cluster size as well as the critical cluster-number density, and examine their compatibility with the FSS theory of continuous geometric transition.
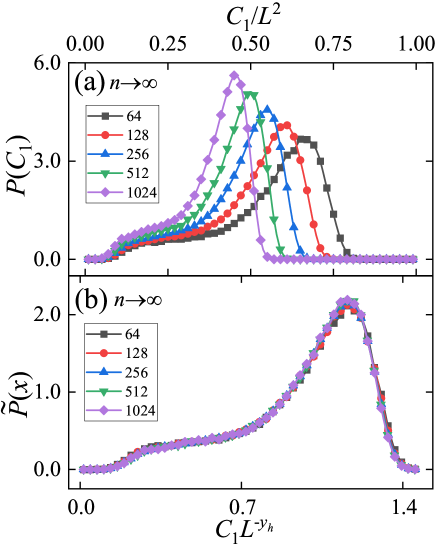
The critical distribution function for the largest-cluster size is shown in Fig. 7(a). At the critical bond-occupation probability (shown in the plot) and its neighborhood, we do not find a stable double-peaked structure, confirming the absence of discontinuous transition. Further, as displayed in Fig. 7(b), the distribution can be rescaled into a single-variable form as with and . The absence of double-peaked structure and the single-variable behavior in distribution function are indicators for a continuous geometric transition.
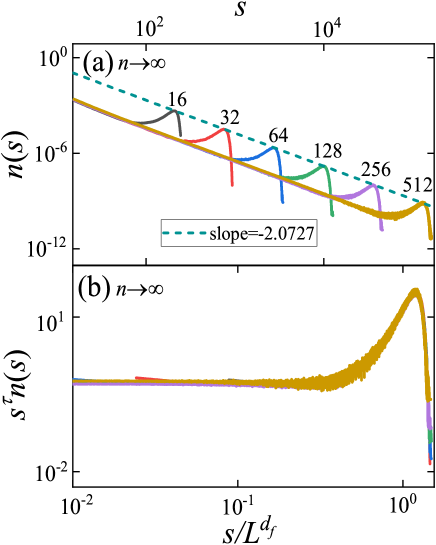
We analyze the cluster-number density of cluster size . At a continuous phase transition, it is expected that
| (6) |
where is a scaling function and . As shown in Fig. 8(a), the large- asymptotics of is consistent with the power law , where the exponent relates to . Figure 8(b) plots versus for various and demonstrates a compact collapse. We hence conclude that the FSS formula (6) is compatible with the percolation transition in infinite generation.
IV.4 Continuous crossover
As displayed in Fig. 5, the quantities and exhibit more severe finite-size corrections as the finite increases. A continuous crossover of critical behavior from infinite to finite generation is indicated, as the and data are close at small sizes but deviate at larger sizes. In following, we further illustrate the crossover phenomenon.
Figure 9 displays a collapse of the critical wrapping probabilities versus an -dependent rescaled size . We define with the rescaled factor chosen such that the versus data of various collapse on top of each other. As a result, the small-size data for are close to those for . By contrast, the data at large tend to collapse with the data for and .
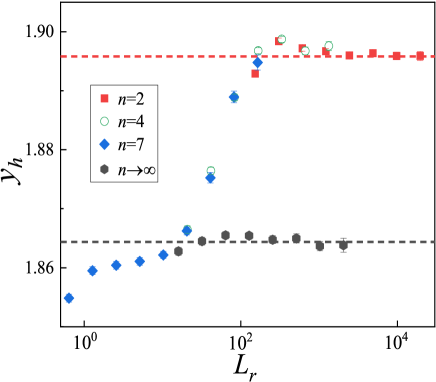
The crossover can also be seen in the size-dependent effective magnetic exponent , which is determined from at sizes and by the formula . The results are shown in Fig. 10, which demonstrates a crossover between the asymptotics of data. At small sizes the data are in the same profile with , whereas at large sizes they collapse with the data of and . Moreover, we observe the crossover phenomenon by the effective thermal exponent extracted from (not shown), although it suffers from huge statistical errors.
V Discussion
By using extensive Monte Carlo simulations, we study the critical behavior of the HDP on the square lattice. At the finite generations , and , we locate percolation transitions at , and , respectively. We find that these transitions belong to the universality class of standard percolation in two dimensions, although finite-size corrections become larger when increases, as demonstrated in Figs. 4, 5 and 6. At the infinite generation , we observe a continuous transition at with the critical exponents and and the critical wrapping probability , which fall outside the standard percolation universality. The critical distribution function and the critical cluster-number density follow the standard scaling behavior of a continuous geometric transition.
As shown in Fig. 2, reaches the maximum at . As we have known, the bond-occupation probability is the percolation threshold of the infinite generation. Hence, at , initial percolation configurations typically have the largest number of iterative bond deletions before reaching the infinite-generation configurations, which are critical.
We obtain complementary evidence confirming a continuous crossover of critical behavior from infinite to finite generation. The evidence comes from various quantities such as (Fig. 5(a)), (Fig. 5(b)) and (Fig. 9) and from effective critical exponents (Fig. 10). Here, we give more-detailed descriptions. Notice that diverges with in the parameter regime of interest (Fig. 2). Hence, for a finite generation, the value of at small may be smaller than or comparable with , and the system behaves like infinite generation due to finite-size effects. By contrast, as increases, ultimately exceeds the finite , and the intrinsic finite-generation behavior is recovered.
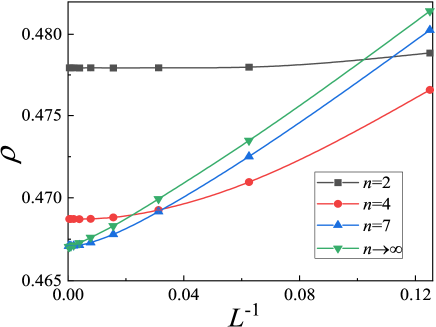
Recall that is the density of occupied bonds remaining at a given generation. Figure 11 shows the dependence of at the percolation thresholds of various generations. For each generation, let the asymptotic critical value be . We obtain the critical occupied-bond densities as (), (), () and (). In contrast to the dependence, the critical density decreases with increasing .
There are a number of open questions motivated by this work. Some of them are as follows. What are the exact values of the critical exponents and for the infinite generation? Can they be obtained within the framework of conformal field theories or Coulomb gas theory? It is noted that the HDP can be extended such that it has an arbitrary number of layers. In the present model shown in Fig. 1, the inter-layer coupling looks like A-B-A’-B’-…, and thus has an effective period of 2. For , the configuration coupling looks like A-B-C…-A’-B’-C’…, and the coupling period is longer. Specific treatment can be that a bond gets deleted if the sites are in different clusters in all the intermediate layers or in any of the intermediate layers. As is sufficiently large, percolation clusters in the infinite-generation limit are either very dense or very small to resist the bond-deletion action. A first-order percolation transition may arise for some large and finite generation . An intriguing scenario then can happen: for a given large , there exists a “tricritical” value of , separating a line of continuous and first-order percolation transitions. The randomly networked structure would be a key factor for the origin of first-order percolation transition. More understanding can arise from exploring the HDP in higher spatial dimensions and on the complete graph. We leave these questions for further studies.
Acknowledgements.
Acknowledgements. YD is indebted to Ming Li and Linyuan Lü for valuable discussions. This work has been supported by the National Natural Science Foundation of China under Grant Nos. 11774002, 11625522 and 11975024, and the Department of Education in Anhui Province.References
- Broadbent and Hammersley (1957) S. R. Broadbent and J. M. Hammersley, Percolation processes: I. Crystals and mazes, in Mathematical Proceedings of the Cambridge Philosophical Society, Vol. 53 (1957) pp. 629–641.
- Grimmett (1999) G. Grimmett, Percolation (Springer, 1999).
- Stauffer and Aharony (2018) D. Stauffer and A. Aharony, Introduction to percolation theory (CRC press, 2018).
- Cardy (1987) J. L. Cardy, Conformal invariance, in Phase Transitions and Critical Phenomena, Eds. C. Domb, M. Green and J. L. Lebowitz (Academic Press, London, 1987).
- Nienhuis (1987) B Nienhuis, Two-dimensional critical phenomena and the Coulomb Gas, in Phase Transitions and Critical Phenomena, Eds. C. Domb, M. Green and J. L. Lebowitz (Academic Press, London, 1987).
- Lawler et al. (2000) G. F. Lawler, O. Schramm, and W. Werner, “The dimension of the planar brownian frontier is 4/3,” Math. Res. Lett. 8, 401–411 (2000).
- Smirnov and Werner (2001) S. Smirnov and W. Werner, “Critical exponents for two-dimensional percolation,” Math. Res. Lett. 8, 729–744 (2001).
- Araújo et al. (2014) N. Araújo, P. Grassberger, B. Kahng, K. J. Schrenk, and R. M. Ziff, “Recent advances and open challenges in percolation,” Eur. Phys. J. Spec. Top. 223, 2307–2321 (2014).
- da Costa et al. (2010) R. A. da Costa, S. N. Dorogovtsev, A. V. Goltsev, and J. F. F. Mendes, “Explosive percolation transition is actually continuous,” Phys. Rev. Lett. 105, 255701 (2010).
- Friedman and Landsberg (2009) E. J. Friedman and A. S. Landsberg, “Construction and analysis of random networks with explosive percolation,” Phys. Rev. Lett. 103, 255701 (2009).
- Riordan and Warnke (2011) O. Riordan and L. Warnke, “Explosive percolation is continuous,” Science 333, 322–324 (2011).
- Radicchi and Fortunato (2010) F. Radicchi and S. Fortunato, “Explosive percolation: A numerical analysis,” Phys. Rev. E 81, 036110 (2010).
- Ziff (2010) R. M. Ziff, “Scaling behavior of explosive percolation on the square lattice,” Phys. Rev. E 82, 051105 (2010).
- Chalupa et al. (1979) J. Chalupa, P. L. Leath, and G. R. Reich, “Bootstrap percolation on a bethe lattice,” J. Phys. C: Solid State Physics 12, L31 (1979).
- Adler (1991) J. Adler, “Bootstrap percolation,” Physica A 171, 453–470 (1991).
- (16) J.-O. Choi and U. Yu, “Bootstrap and diffusion percolation transitions in three-dimensional lattices,” J. Stat. Mech. 2020, 063218.
- Buldyrev et al. (2010) S. V. Buldyrev, R. Parshani, G. Paul, H. E. Stanley, and S. Havlin, “Catastrophic cascade of failures in interdependent networks,” Nature 464, 1025–1028 (2010).
- S.-W. Son (2012) C. Christensen P. Grassberger M. Paczuski S.-W. Son, G. Bizhani, “Percolation theory on interdependent networks based on epidemic spreading,” EPL (Europhysics Letters) 97, 16006 (2012).
- Schrenk et al. (2016) K. J. Schrenk, M. R. Hilário, V. Sidoravicius, N. A. M. Araújo, H. J. Herrmann, M. Thielmann, and A. Teixeira, “Critical fragmentation properties of random drilling: How many holes need to be drilled to collapse a wooden cube?” Phys. Rev. Lett. 116, 055701 (2016).
- Hilário and Sidoravicius (2019) M. R. Hilário and V. Sidoravicius, “Bernoulli line percolation,” Stoch. Proc. Appl. 129, 5037–5072 (2019).
- Jovanović et al. (1994) B. Jovanović, S. V. Buldyrev, S. Havlin, and H. E. Stanley, “Punctuated equilibrium and “history-dependent” percolation,” Phys. Rev. E 50, R2403–R2406 (1994).
- Liu et al. (2015) X.-W. Liu, Y. Deng, and J. L. Jacobsen, “Recursive percolation,” Phys. Rev. E 92, 010103(R) (2015).
- Li et al. (2020) M. Li, L. Lü, Y. Deng, M.-B. Hu, H. Wang, M. Medo, and H. E. Stanley, “History-dependent percolation on multiplex networks,” National Science Review 7, 1296–1305 (2020).
- Note (1) In actual simulations, we halt the iterations once two consecutive evolutions do not make any change to configurations, and the generation number of ending configuration is taken as .
- Ziff and Newman (2002) R. M. Ziff and M. E. J. Newman, “Convergence of threshold estimates for two-dimensional percolation,” Phys. Rev. E 66, 016129 (2002).
- Wang et al. (2013) J. Wang, Z. Zhou, W. Zhang, T. M. Garoni, and Y. Deng, “Bond and site percolation in three dimensions,” Phys. Rev. E 87, 052107 (2013).
- Xu et al. (2014) X. Xu, J. Wang, J.-P. Lv, and Y. Deng, “Simultaneous analysis of three-dimensional percolation models,” Front. Phys. 9, 113–119 (2014).
- Lv et al. (2012) J.-P. Lv, X. Yang, and Y. Deng, “Scaling of cluster heterogeneity in the two-dimensional potts model,” Phys. Rev. E 86, 022105 (2012).
- Xu et al. (2019) W. Xu, Y. Sun, J.-P. Lv, and Y. Deng, “High-precision monte carlo study of several models in the three-dimensional u(1) universality class,” Phys. Rev. B 100, 064525 (2019).
- Lv et al. (2020) J.-P. Lv, W. Xu, Y. Sun, K. Chen, and Y. Deng, “Finite-size scaling of o(n) systems at the upper critical dimensionality,” National Science Review (2020), 10.1093/nsr/nwaa212.
- Newman and Ziff (2001) M. E. J. Newman and R. M. Ziff, “Fast monte carlo algorithm for site or bond percolation,” Phys. Rev. E 64, 016706 (2001).
- Ziff (2011) R. M. Ziff, “Correction-to-scaling exponent for two-dimensional percolation,” Phys. Rev. E 83, 020107(R) (2011).