Gas and dust dynamics in starlight-heated protoplanetary disks
Abstract
Theoretical models of the ionization state in protoplanetary disks suggest the existence of large areas with low ionization and weak coupling between the gas and magnetic fields. In this regime hydrodynamical instabilities may become important. In this work we investigate the gas and dust structure and dynamics for a typical T Tauri system under the influence of the vertical shear instability (VSI). We use global 3D radiation hydrodynamics simulations covering all of azimuth with embedded particles of 0.1 and 1mm size, evolved for 400 orbits. Stellar irradiation heating is included with opacities for 0.1- to 10-m-sized dust. Saturated VSI turbulence produces a stress-to-pressure ratio of . The value of is lowest within 30 au of the star, where thermal relaxation is slower relative to the orbital period and approaches the rate below which VSI is cut off. The rise in from 20 to 30 au causes a dip in the surface density near 35 au, leading to Rossby wave instability and the generation of a stationary, long-lived vortex spanning about 4 au in radius and 40 au in azimuth. Our results confirm previous findings that mm size grains are strongly vertically mixed by the VSI. The scale height aspect ratio for 1mm grains is determined to be 0.037, much higher than the value obtained from millimeter-wave observations of the HL Tau system. The measured aspect ratio is better fit by non-ideal MHD models. In our VSI turbulence model, the mm grains drift radially inwards and many are trapped and concentrated inside the vortex. The turbulence induces a velocity dispersion of m/s for the mm grains, indicating that grain-grain collisions could lead to fragmentation.
1 Introduction
The dynamical states of protostellar disks during the first million years after their formation are crucial for understanding planet formation processes. As the coupling of the magnetic field to the gas in these dense and cold disks is believed to be weak (Turner et al., 2014; Armitage, 2019), it seems likely that various hydrodynamical instabilities play important roles, such as the GoldreichSchubertFricke (GSF) instability (Goldreich & Schubert, 1967; Fricke, 1968), the convective instability (Cameron & Pine, 1973), the PapaloizouPringle instability (Papaloizou & Pringle, 1984), the baroclinic instability (Klahr & Bodenheimer, 2003; Lesur & Papaloizou, 2010), the convective overstability (Lyra, 2014; Klahr & Hubbard, 2014), the zombie vortex instability (Marcus et al., 2013, 2015; Lesur & Latter, 2016; Umurhan et al., 2016) or the spiral wave instability (Bae et al., 2016). In recent years, it has become clear that hydrodynamical instabilities might play important roles in explaining the structure and evolution of protoplanetary disks (Nelson et al., 2013; Lin & Youdin, 2015; Stoll & Kley, 2016; Flock et al., 2017b; Manger & Klahr, 2018; Hartmann & Bae, 2018), while the more general role played by hydrodynamical instabilities in driving angular momentum transport remains unresolved (Fromang & Lesur, 2019). A special focus has been placed on the GSF instability, later renamed for disks to the vertical shear instability (VSI), which is believed to operate in regions where the magnetic coupling is low and the thermal equilibrium timescale is much shorter than the dynamical timescale (Urpin & Brandenburg, 1998; Nelson et al., 2013; Lin & Youdin, 2015; Richard et al., 2016; Malygin et al., 2017; Latter & Papaloizou, 2018; Pfeil & Klahr, 2019; Lyra & Umurhan, 2019). Recent hydrodynamical simulations have found that the VSI develops in the non-linear regime to produce vortices (Richard et al., 2016; Manger & Klahr, 2018) due to the Rossby-Wave-Instability (Li et al., 2000). Also, works on the VSI have found stress-to-pressure ratios (measuring the component of the Reynolds stress tensor) ranging from to (Nelson et al., 2013; Stoll & Kley, 2014; Richard et al., 2016; Flock et al., 2017b; Manger & Klahr, 2018). Of special interest for planet formation models are the dust dynamics, and the spatial structure of the dust distribution, which are driven by VSI turbulence. Continuum observations by the Atacama Large Millimeter Array (ALMA) which trace the dust thermal emission have revealed astonishingly thin dust structures in the vertical dimension (ALMA Partnership et al., 2015; Pinte et al., 2016; van Boekel et al., 2017; Liu et al., 2017). One way to explain these thin dust components is a low level of disk turbulence. In our recent work we showed that the magneto-rotational instability operating in the upper layers of the disk, providing only mild perturbations to the flow in the midplane, would be able to explain the required degree of vertical mixing (Flock et al., 2015, 2017b). In contrast, we showed that the characteristic vertical motions of the vertical shear instability efficiently lift up mm size grains (Flock et al., 2017b), leading to a vertical dust distribution that is much more spatially extended than inferred from the observations. Previous work also found that the strength of this vertical mixing is much greater than expected from the stress-to-pressure ratio , because of the inherently anisotropic nature of the turbulence generated by the VSI (Nelson et al., 2013; Stoll et al., 2017).
Several previous works have demonstrated the appearance of vortices driven by hydrodynamical instabilities. Examples include the convective overstability (Lyra, 2014; Klahr & Hubbard, 2014) and the non-linear subcritical baroclinic instability (SBI) (Lesur & Papaloizou, 2010). Both of these instabilities require a thermal relaxation time close to the inverse orbital frequency . For shorter thermal relaxation timescales, as present in our model, the SBI does not operate (Lesur & Papaloizou, 2010; Barge et al., 2016), while the growth of the convective overstability is very slow (Klahr & Hubbard, 2014). In the context of the vertical shear instability, Richard et al. (2016) described the appearance of small scale vortices in simulations of the VSI, driven by radially-narrow vorticity perturbations that underwent local Rossby Wave Instability. In models with very short thermal relaxation time scales, Richard et al. (2016) found that the aspect ratios of the vortices was small (typically ) because of the strength of the VSI-induced vorticity perturbations, and they survived for only a few orbits at most. Manger & Klahr (2018) reported also the appearance of several vortices in their 3D isothermal hydrodynamical simulations, however of much larger scales and most likely caused by the Rossby Wave instability.
In this work we want to re-investigate the turbulent properties of the vertical shear instability using high-resolution radiation hydrodynamical simulations covering all of azimuth with stellar irradiation, and the consequences of the turbulence for the evolution and distribution of embedded dust grains. Our radiation hydrodynamic stratified disk simulations treat irradiation by the central star, include realistic dust opacities and achieve a resolution of more than 70 cells per disk scale height. The dynamics and structure of the dust are studied with one million Lagrangian dust particles embedded in the disk. The paper is laid out as follows. In Section 2 we present the numerical method and the disk model, and in Section 3 we present the simulation results for the gas and dust. In Section 4 we present a discussion of the results and in Section 5 we draw our conclusions.
2 Numerical method and disk model
The radiation hydrodynamic equations are solved using the hybrid stellar irradiation and flux-limited diffusion method developed by Flock et al. (2013) as implemented in version 4.2 of the PLUTO code (Mignone et al., 2007). The numerical setup follows (Flock et al., 2017b) in using the piece-wise parabolic method (PPM), the Harten-Lax-Van Leer approximate Riemann solver with the contact discontinuity (HLLC), the FARGO scheme (Masset, 2000; Mignone et al., 2012) and the Runge-Kutta time integrator. The Courant number is set to 0.3. The equations solved are:
| (1) | |||||
| (2) | |||||
| (3) | |||||
| (4) |
with the density , velocity vector , gas pressure
| (5) |
gas temperature , mean molecular weight , Boltzmann constant , atomic mass unit , total energy per unit volume and gas internal energy per unit volsume . The closure relation between gas pressure and internal energy is provided by with the adiabatic index . Other symbols include the radiation energy ER, the stellar irradiation flux , the Rosseland and Planck mean opacities and , the radiation constant , the Stefan-Boltzmann constant , and the speed of light . The flux limiter
| (6) |
is taken from Levermore & Pomraning (1981, Eq. 28 therein) with the inverse optical depth per radiation energy scale length
| (7) |
The gas is a mixture of molecular hydrogen, helium, and heavier elements with solar abundances (Decampli et al., 1978) so that and . In this work we consider the frequency integrated irradiation flux at a radial distance to be
| (8) |
with and being the surface temperature and radius of the star. The radial optical depth to the irradiation flux at meridional angle is given by:
| (9) |
where denotes the inner radius of the computational domain. The quantity is the inner optical depth provided by material located between the position where the stellar magnetic field truncates the disk at and the innermost radial position of our simulation domain . We choose .
As in the previous work we use two opacities, one to the starlight cm2 g-1, and the other to the disk’s thermal re-emission cm2 g-1. These are Planck-weighted averages of the frequency-dependent dust opacity, at respectively the stellar temperature and a typical re-emission color temperature of 300 K. The starlight opacity exceeding the thermal re-emission opacity yields a warm surface layer that is opaque to the starlight but optically-thin to its own emission (Chiang & Goldreich, 1997). To be able to compare the results with our previous work we use the same opacities as in Flock et al. (2017b) and set . The frequency-dependent opacity is calculated using Mie theory for spheres of silicate and graphite with a power-law radius distribution of exponent -3.5 between 0.1 and 10 m (Flock et al., 2017b).
For all models we use a modified outflow boundary condition, preventing inflow at the radial and boundaries. In addition, we extrapolate the density logarithmically into the meridional ghost zones. In the radial direction we apply buffer zones, relaxing the surface density to the initial profile in the region 20-22 au and damping the radial velocity to zero at 20-21 and 97-100 au. Without these buffers, mass loss would lower and reshape the starlight-absorbing layer, altering the temperature distribution. The buffer zones are excluded when we present our kinematic analysis of the results.
2.1 Initial condition and run procedure
The initial condition is derived by constructing 2D axisymmetric profiles of density, temperature and rotation velocity which are in radiation hydrostatic equilibrium. We use star and disk parameters from a model of a typical T Tauri system which has been applied to explain various spatially-resolved multi-band observations of protostellar disks (Wolf et al., 2003, 2008; Schegerer et al., 2008, 2009; Sauter et al., 2009; Madlener et al., 2012; Liu et al., 2012; Gräfe et al., 2013). In Table 1 we summarize the parameters that define the setup. As presented in Flock et al. (2016), we construct the initial condition by iterating between the radiation transfer and solving for hydrostatic equilibrium. The opacity is determined the by the dust-to-gas mass ratio of sub-10-m grains which we take to be , the same as in model M3 of Flock et al. (2017b). This choice yields thermal equilibration timescales short enough for the VSI to operate as detailed below in sec. 4.2. To obtain the model M3, Flock et al. (2017b) extended the 2D axisymmetric initial conditions to 3D with an azimuthal extent of radians. Small velocity perturbations were added and the simulation was run for 400 inner orbits.
To save recomputing the linear growth of the VSI, we here extend and restart the reference model M3 after 400 inner orbits. We first stretch the azimuthal extent by a factor 2 and then repeat it 8 times to fill the new domain’s -radian azimuthal extent. The stretching keeps the number of azimuthal cells low enough that the grid fits in the available memory. We next add small cellwise random velocities with amplitude to the existing velocity field to break the eight-fold symmetry.
The logarithmically-spaced radial and uniformly-spaced meridional and azimuthal grids yield cells with aspect ratio approximately 1:1:2 and a resolution of around 70 cells per scale height. As model M3 produced features that were mostly axisymmetric, reducing the azimuthal resolution a factor two is unlikely to influence the results. The simulation with the new domain is then evolved for a further 400 inner orbits. After 250 inner orbits, when the VSI turbulence has reached a new steady state, we distribute uniformly over the midplane between 25 and 95 au a half-million 0.1-mm and a half-million 1-mm particles. Each particle is given the local Keplerian velocity. The Stokes number at the midplane for the 1mm grains lies between at the inner boundary and at the outer boundary. The radial midplane profile of the Stokes number is shown in Appendix A.
| Surface density | |
|---|---|
| Stellar parameters | , |
| Opacities | |
| Dust-to-gas ratio | |
| Grid | |
| Domain | |
| Resolution |
3 Results
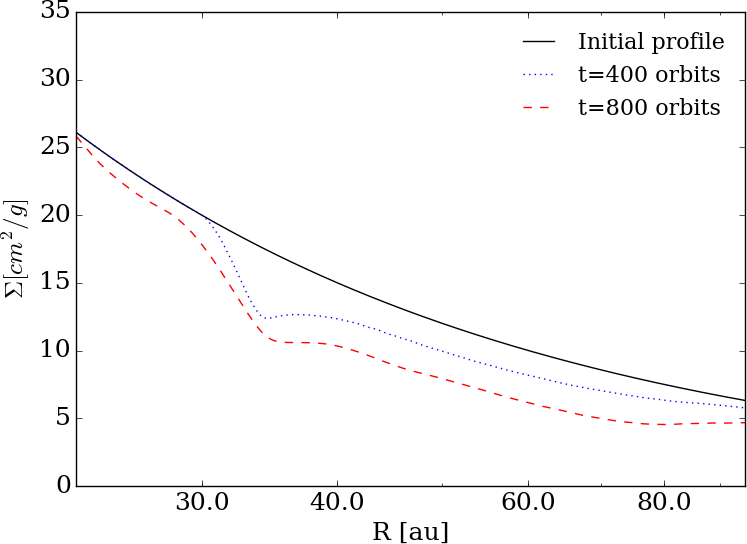
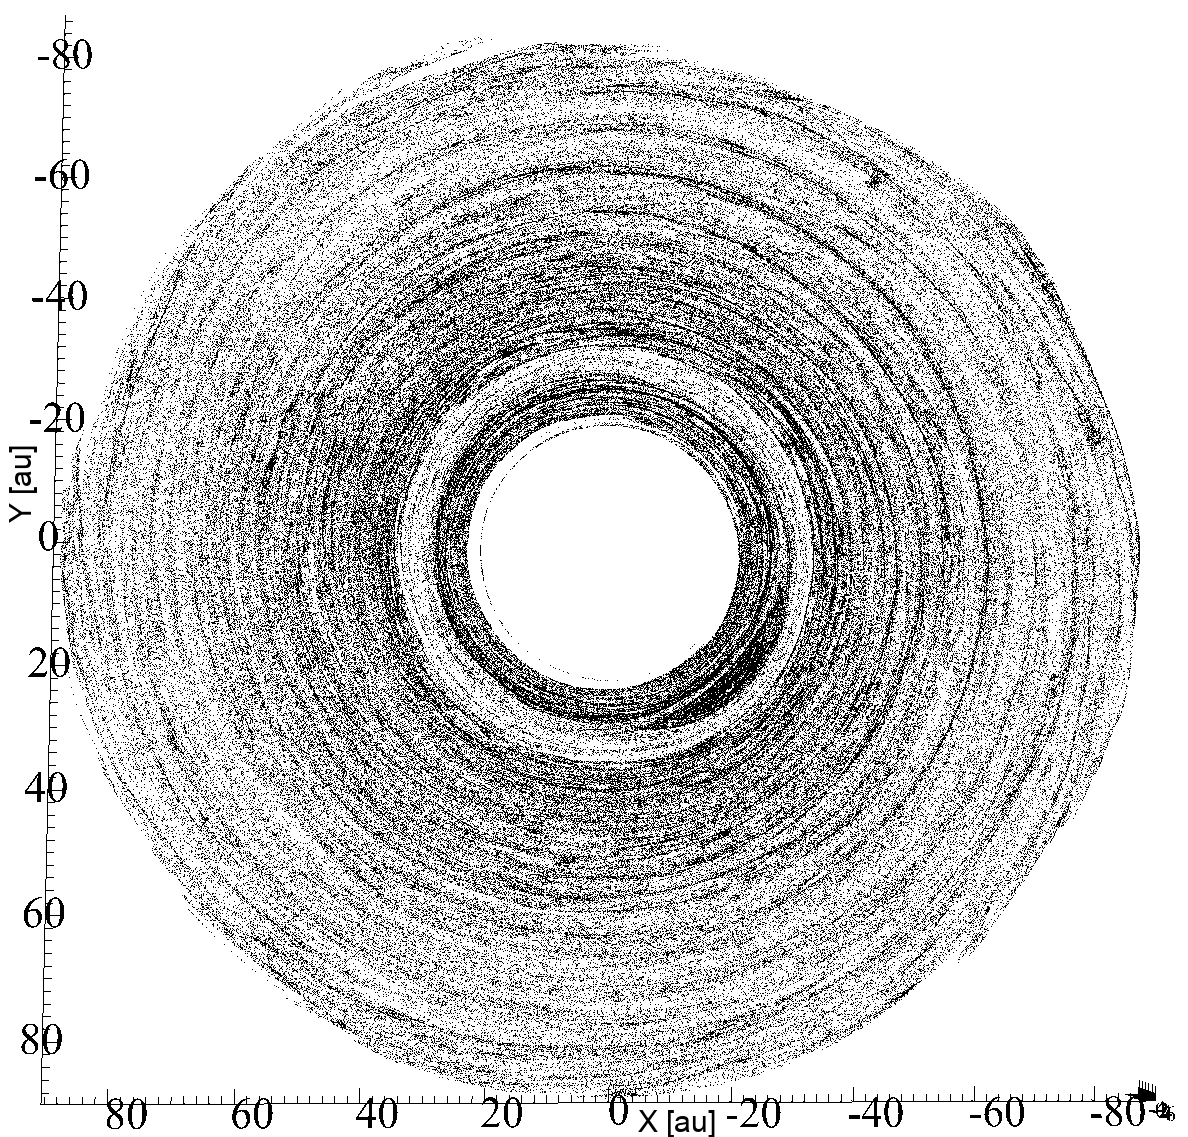
In the following we will first present the results on the gas kinematics, and describe the formation and evolution of a persistent vortex. We will then focus on the dust evolution and the steady state dust vertical structure that develops. The surface density evolution is visible in Fig. 1, which shows the initial condition at time zero and two snapshots corresponding to evolution after 400 and 800 inner orbits. The first 400 orbits were calculated with a reduced azimuthal domain, and the results for this part of the run are presented in our previous work (Flock et al., 2017b). The results between 400 and 800 inner orbits were obtained after extending the azimuthal domain, as described in Section 2.1. From now on when we discuss the results we will let the restart time of 400 orbits correspond to time zero, as we will only discuss the run whose azimuthal domain lies in the interval radians.
3.1 Kinematics and turbulence
After the full 2 radian simulation restarts, the VSI quickly reaches a new steady state. We gauge the turbulence level by the stress-to-pressure ratio . We calculate the pressure-weighted111The difference between the pressure-weighted and mass-weighted value is 0.5%. stress-to-pressure ratio, using
| (10) |
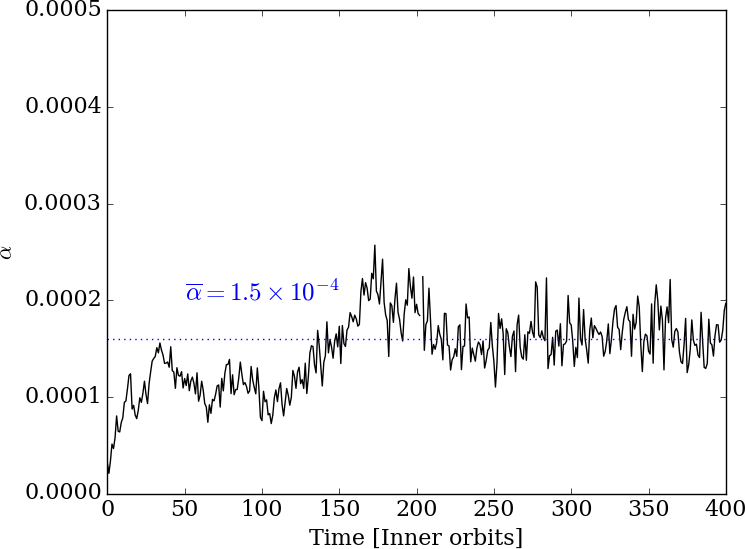
with differential volume . The turbulent components of the velocities indicated by the superscript primes are found by substracting the azimuthally averaged value at each r and . The time evolution of is presented in the top panel of Fig. 2. Over the first 30 inner orbits, the value of quickly increases and saturates to a new steady level near . Because the initial state already reflects VSI turbulence, saturation takes only about one-quarter as long as in model M3 (see Fig. 3 in Flock et al. (2017b)). We follow the evolution for 400 inner orbits. The fluctuations over time in the stress-to-pressure ratio remain small compared to the mean value.
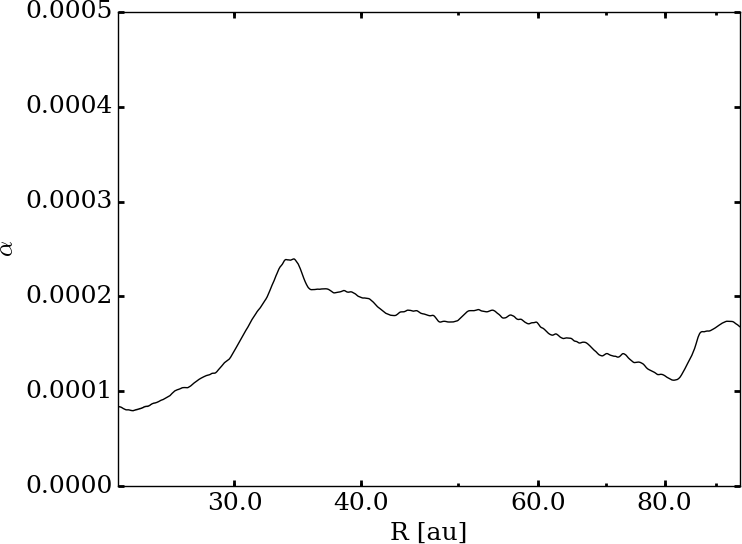
The radial profile of the vertically and azimuthally averaged value is shown in the bottom panel of Fig. 2, where an additional time average between 100 and 400 orbits has been employed. The profile of shows an increase, from at 25 au to at 35 au. Beyond 35 au the value remains above . This increase of from 25 to 35 au is connected to the thermal relaxation timescale relative to the threshold value for the VSI to operate. The small dip at 80 au might be related to the run’s duration. The steady state might not be fully established near the outer radius, since the calculation ends before the outer boundary completes 36 orbits.
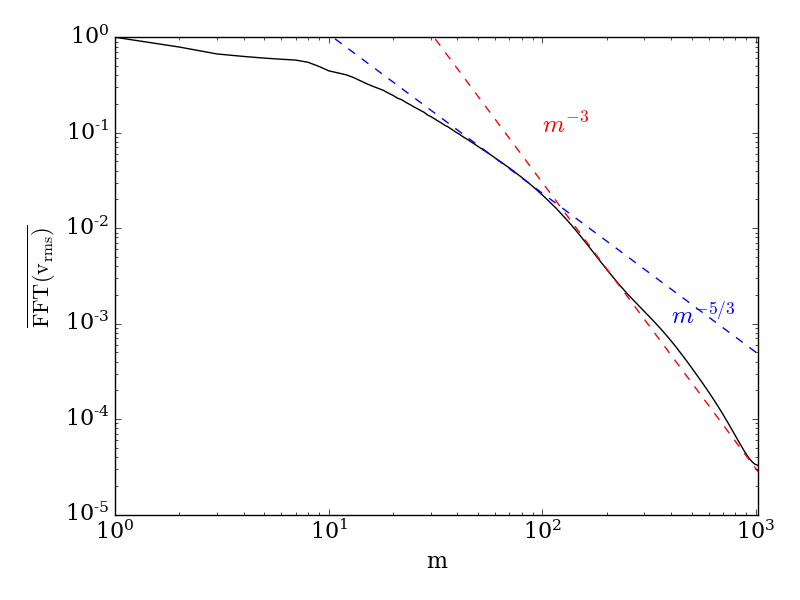
The turbulent flow speed near the midplane well outside the 35 au surface density dip has the azimuthal power spectrum shown in Fig. 3. This spectrum is averaged over the volume between 50 and 60 au in radius and within 0.14 radians of the midplane in . The spectrum is further time-averaged from 100 to 400 inner orbits, and normalized by its maximum value. The high spatial resolution means we cover three decades in azimuthal wavenumber. The turbulent spectral energy peaks at the scale of the circumference, with a shallow decline towards shorter scales. For azimuthal mode numbers of 10 to 100 the slope turns steeper, passing through . Between and the slope turns steeper again, and the turbulent motions at the smallest resolved scales carry four orders of magnitude less spectral power than those at the largest azimuthal scales. Manger & Klahr (2018) found a similar spectral shape in their VSI turbulence models, though the steepening seen here at occurs in their models at , likely due to the lower numerical resolution, steeper radial pressure profile, or differing thermal relaxation timescale. Manger & Klahr (2018) used a uniform value , comparable to our smallest value here on the midplane.
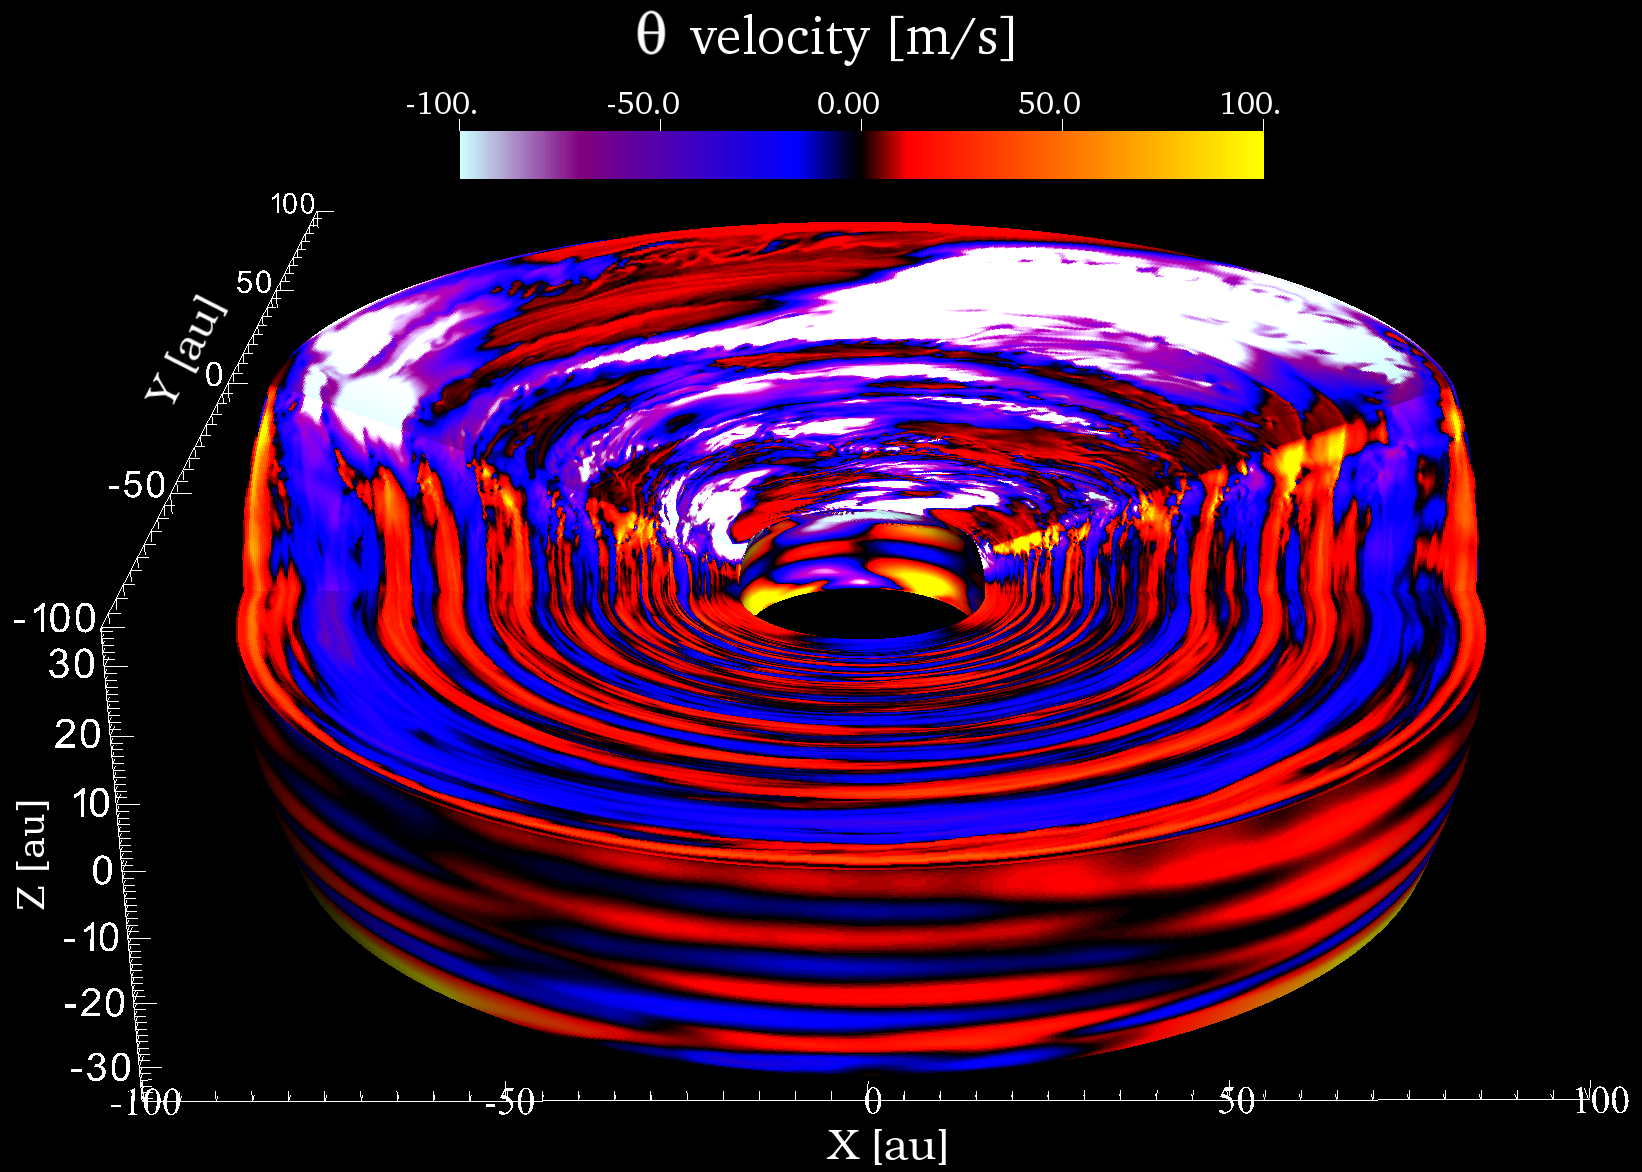
Fig. 4 shows a snapshot of the total -velocity at 290 inner orbits. Cuts along the midplane and a representative meridional plane show the 3D structure. The characteristic pattern of the VSI is visible, with large-scale upward and downward motions crossing the midplane and reaching the disk atmosphere. Speeds are as great as 100 m s-1 in the atmosphere and the midplane motions are almost as fast, with amplitudes up to 50 m s-1. The midplane cut makes clear that the motions are approximately axisymmetric, with small but noticeable deviations especially at low wavenumbers.
3.2 Vortex formation and evolution
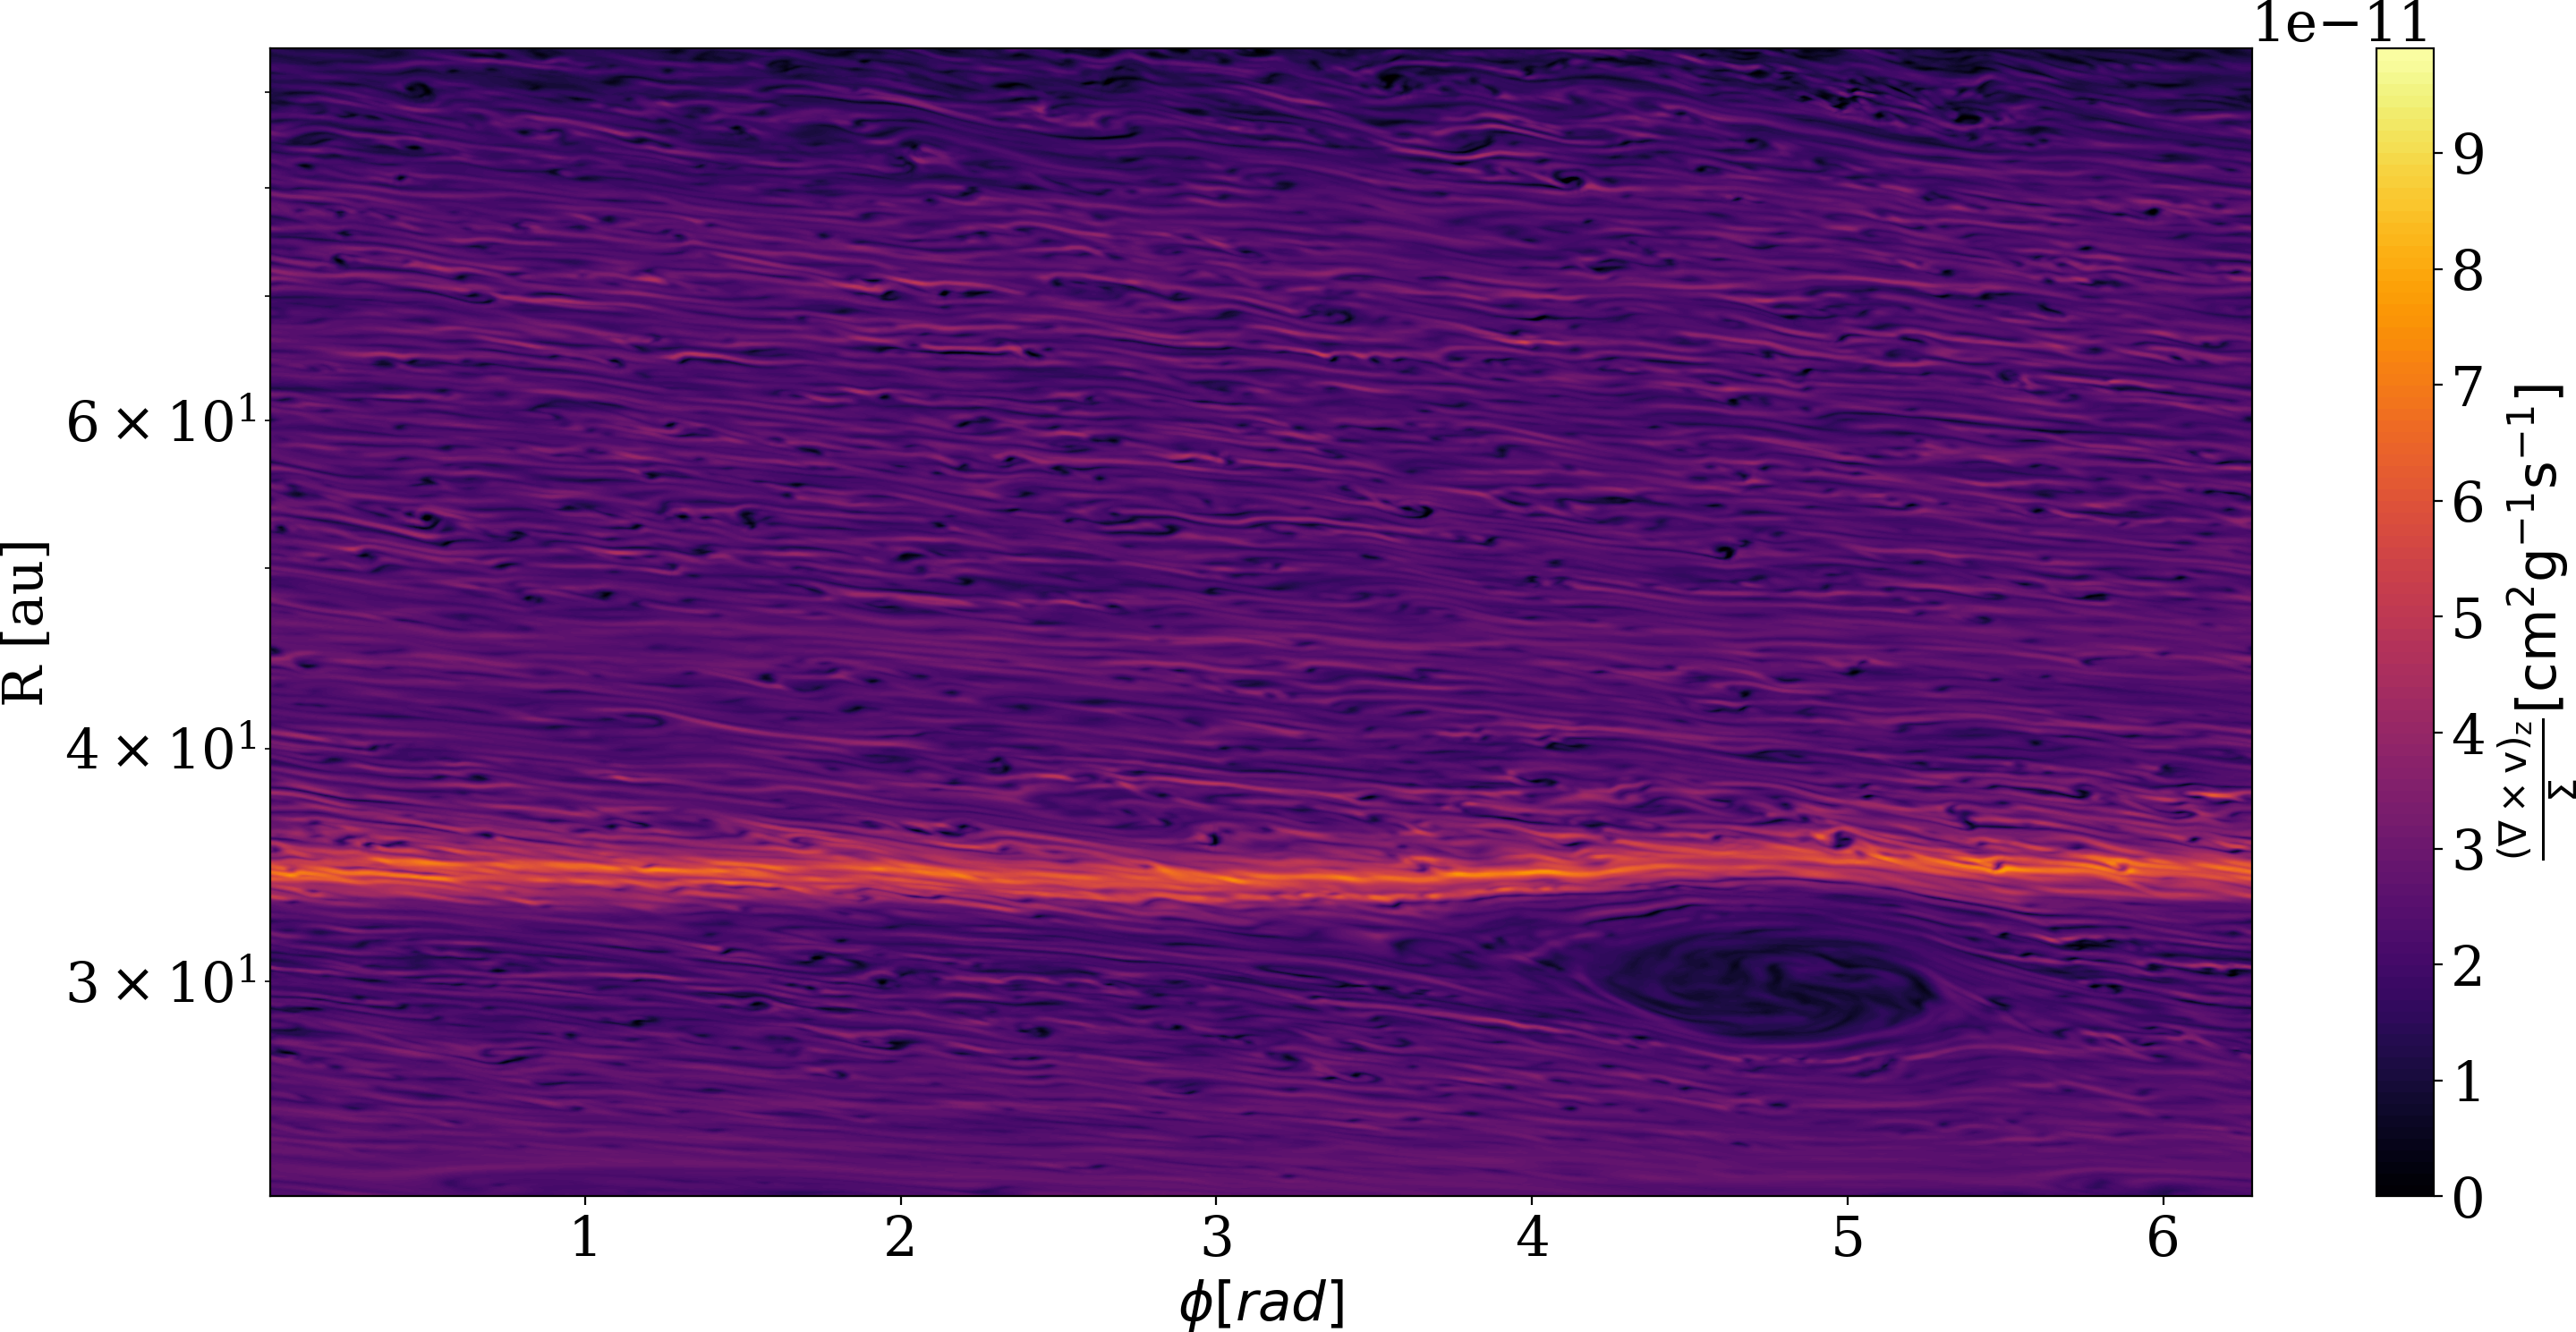
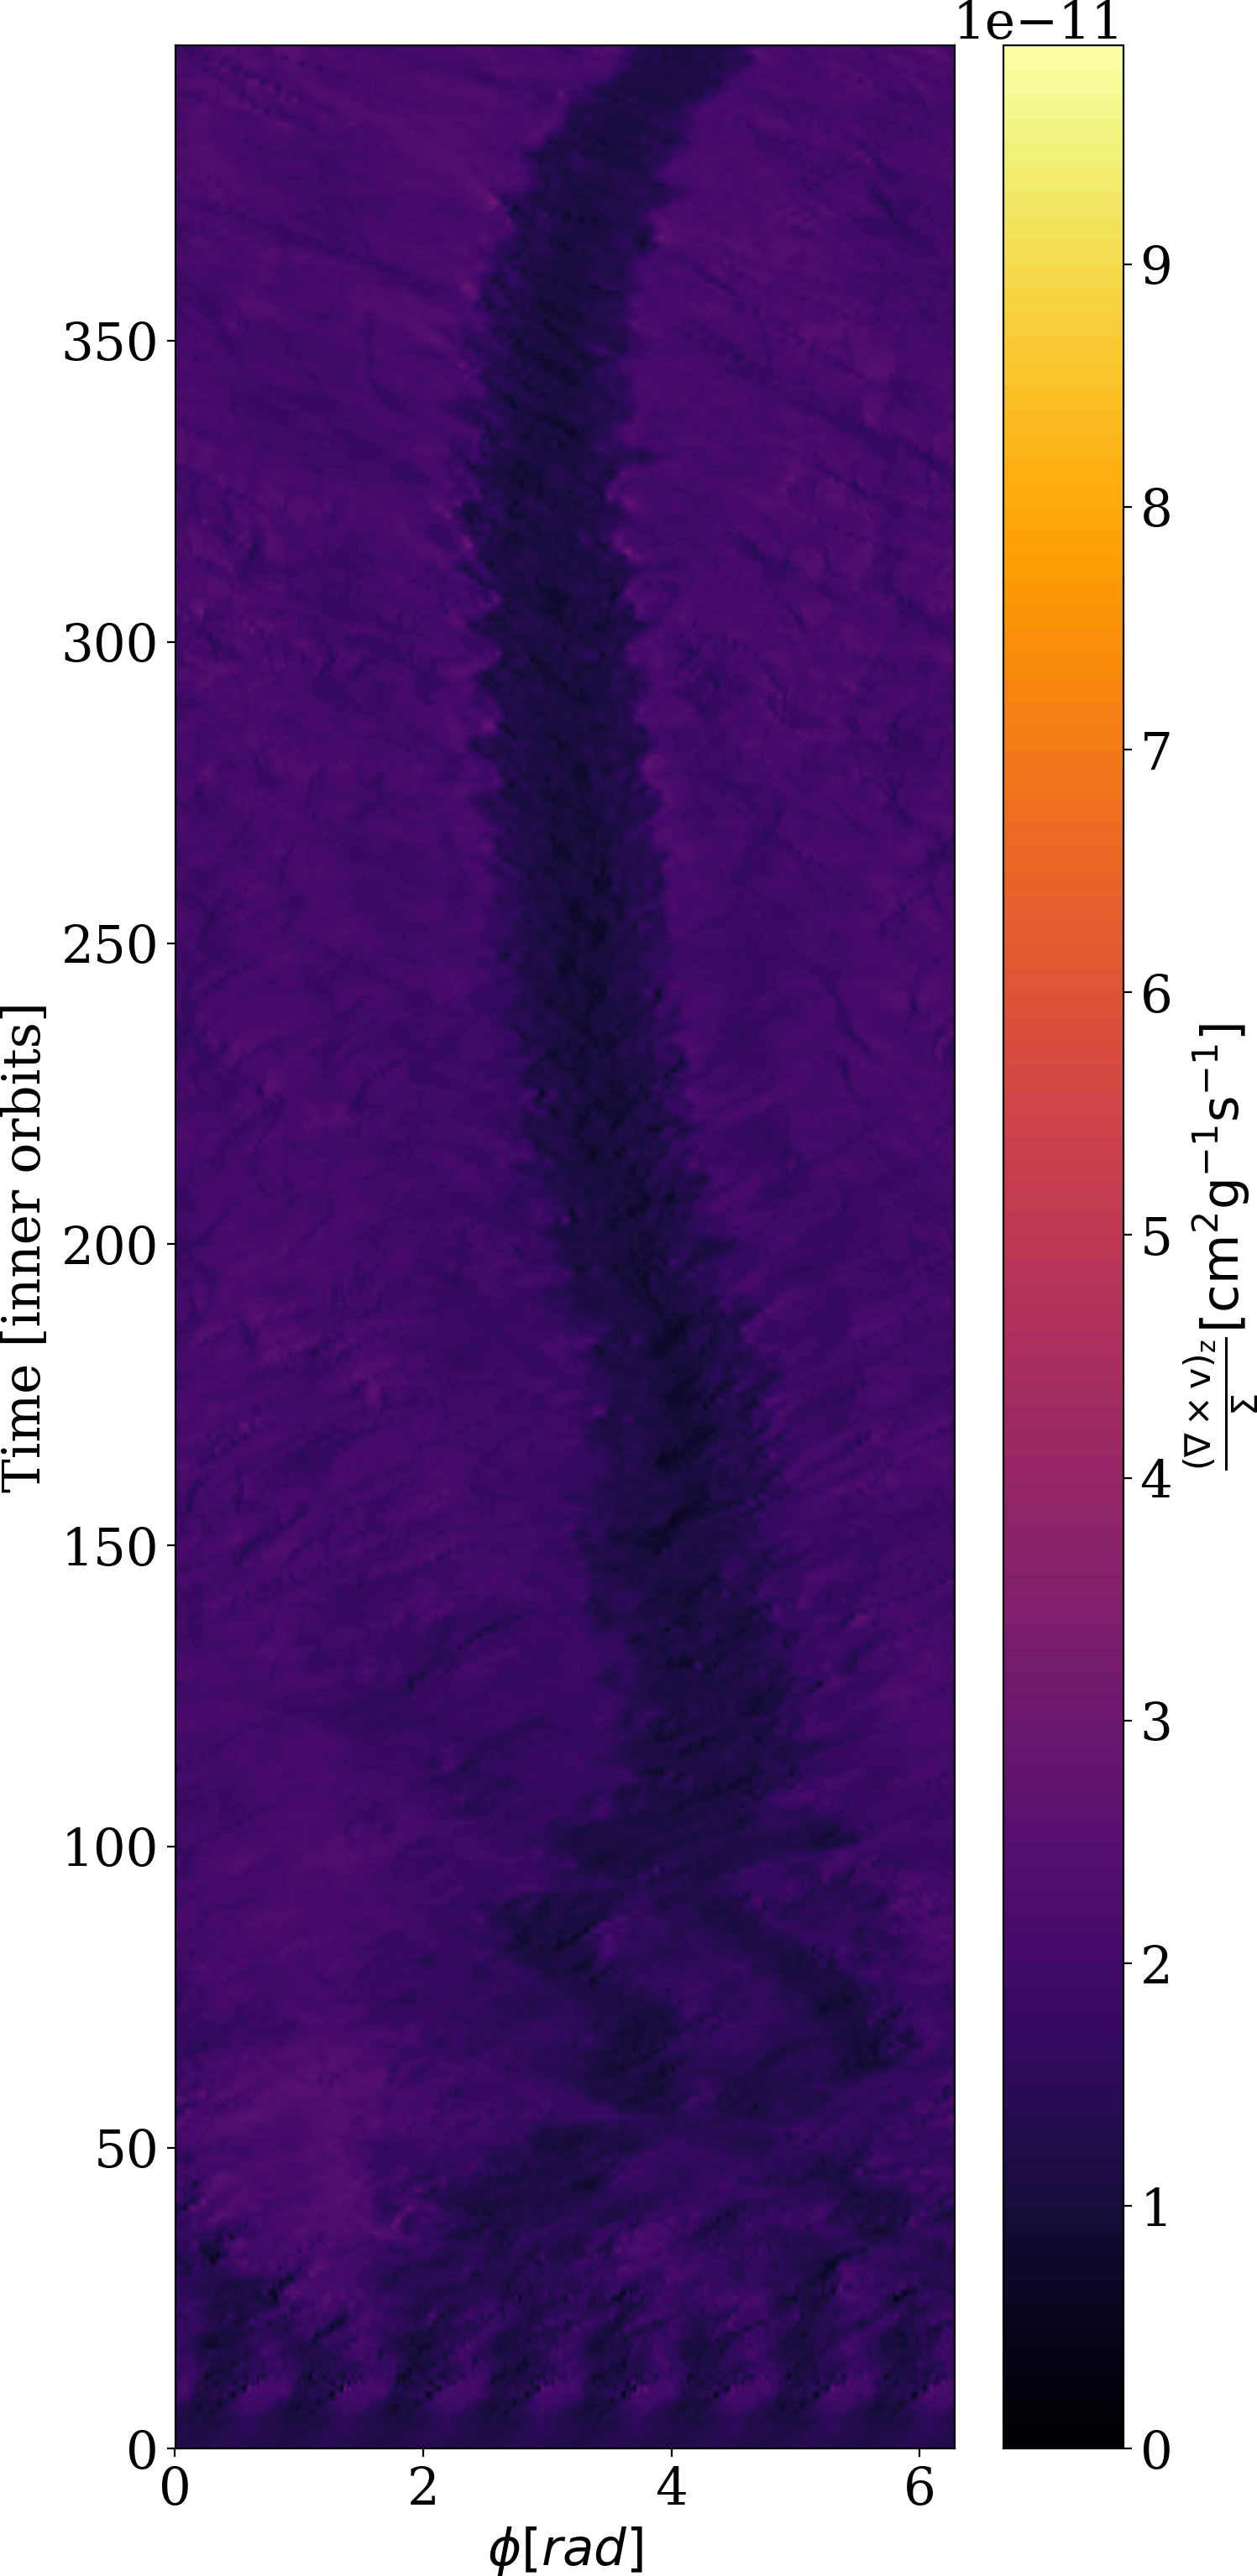
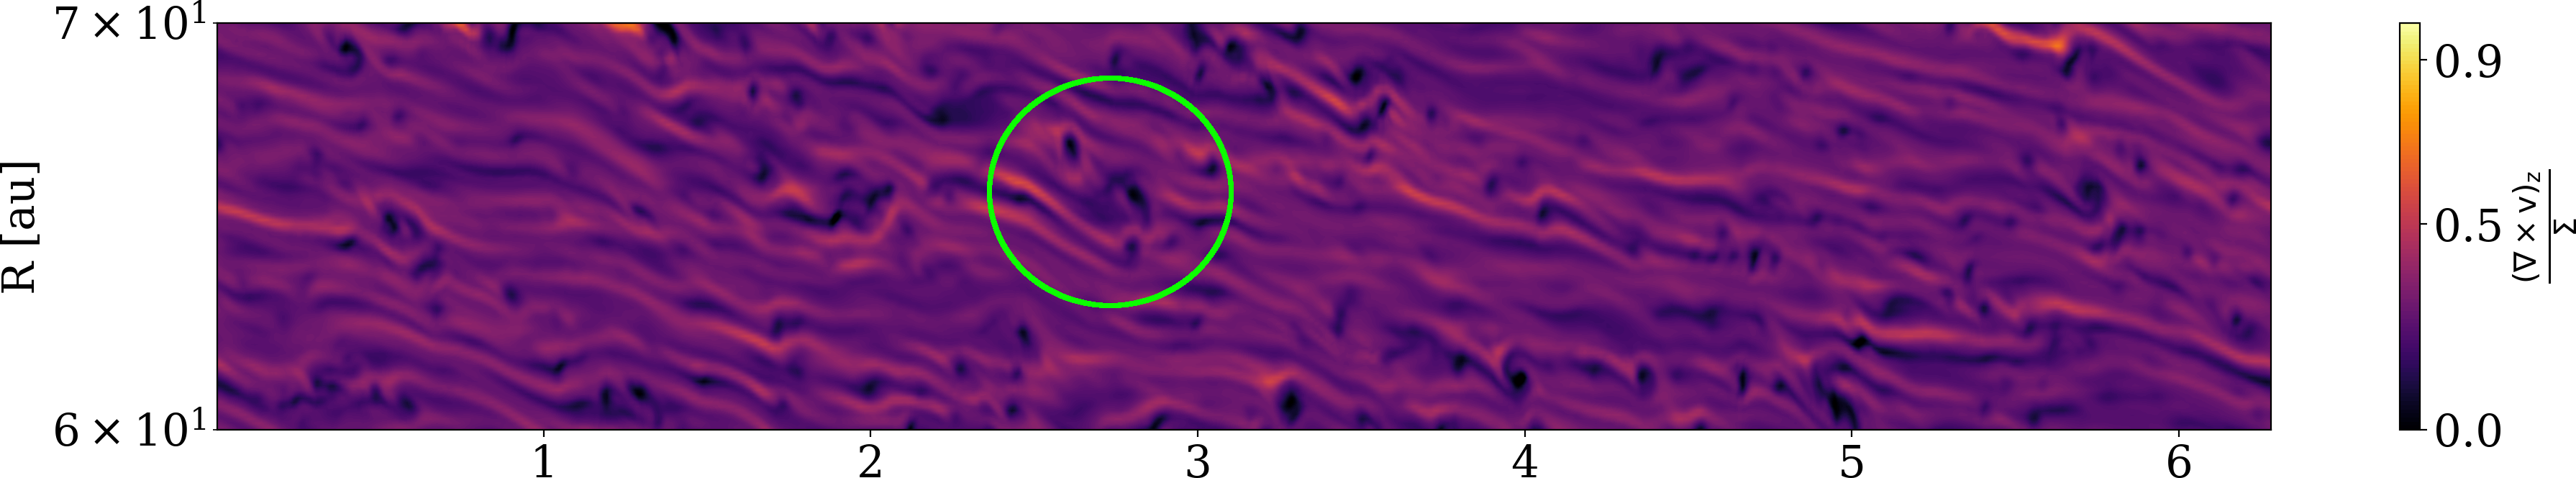
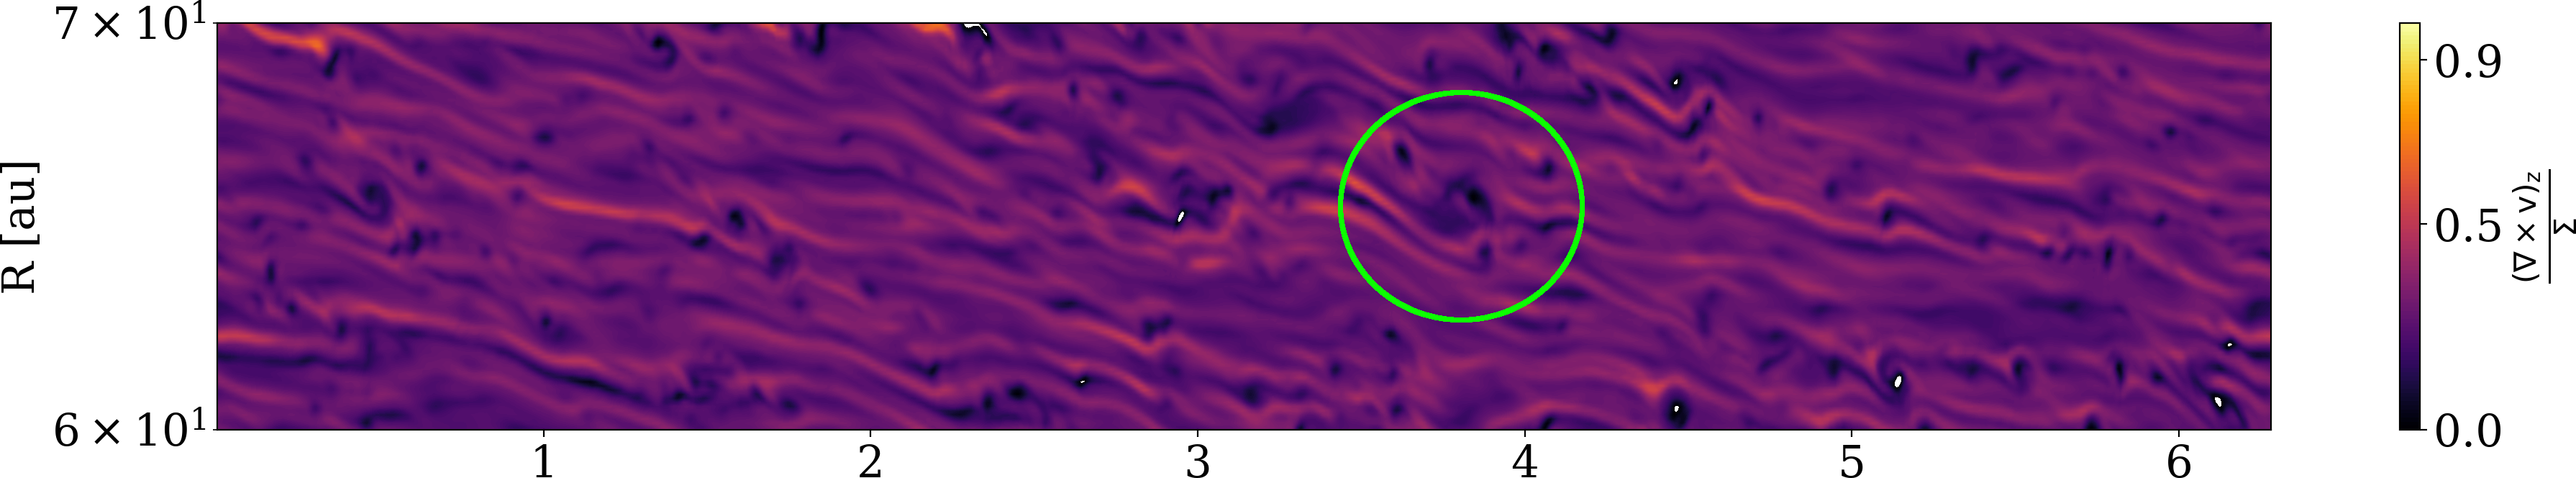
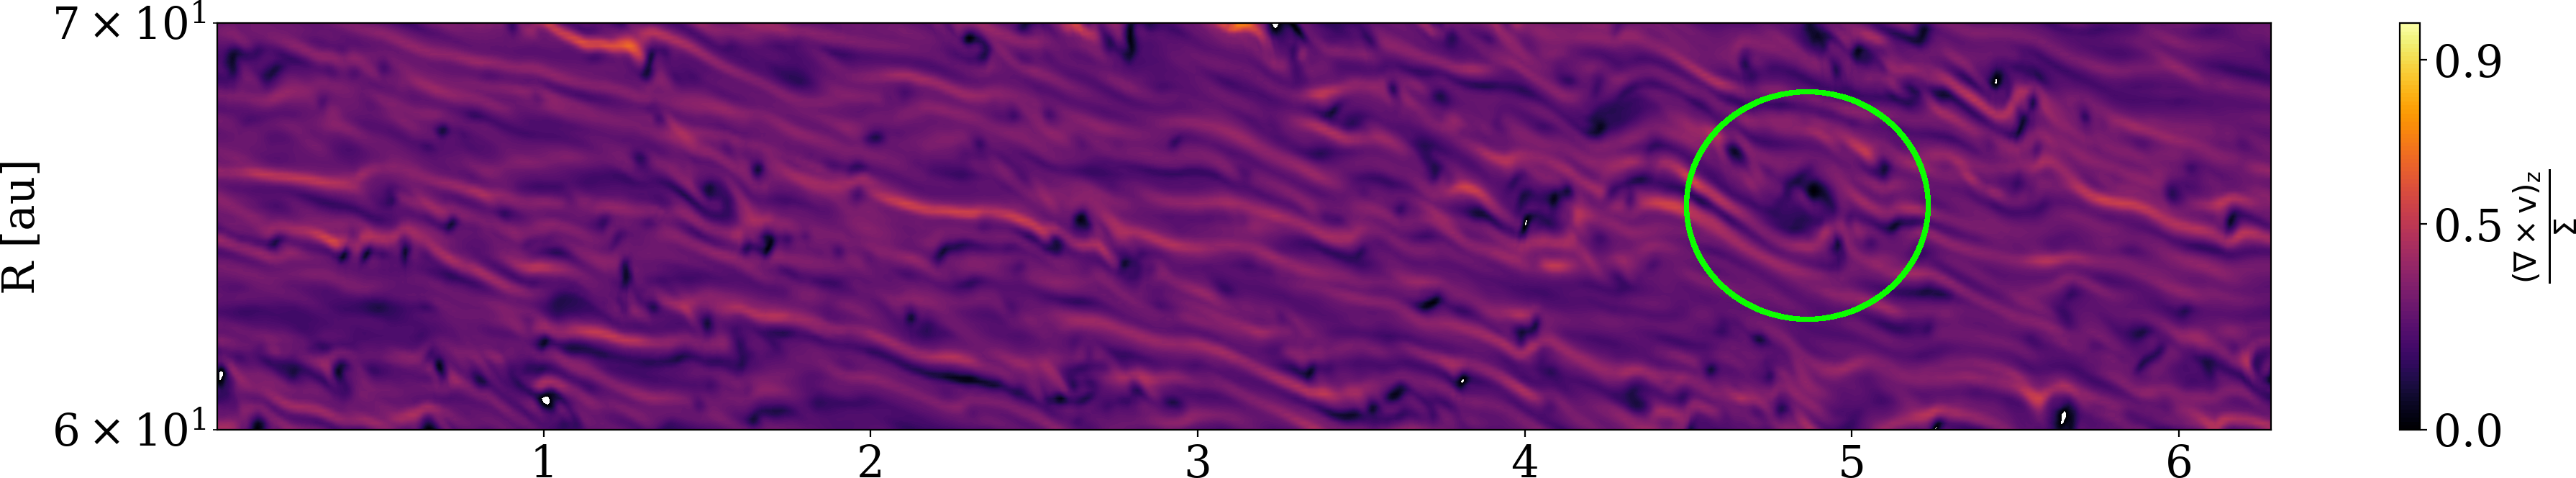
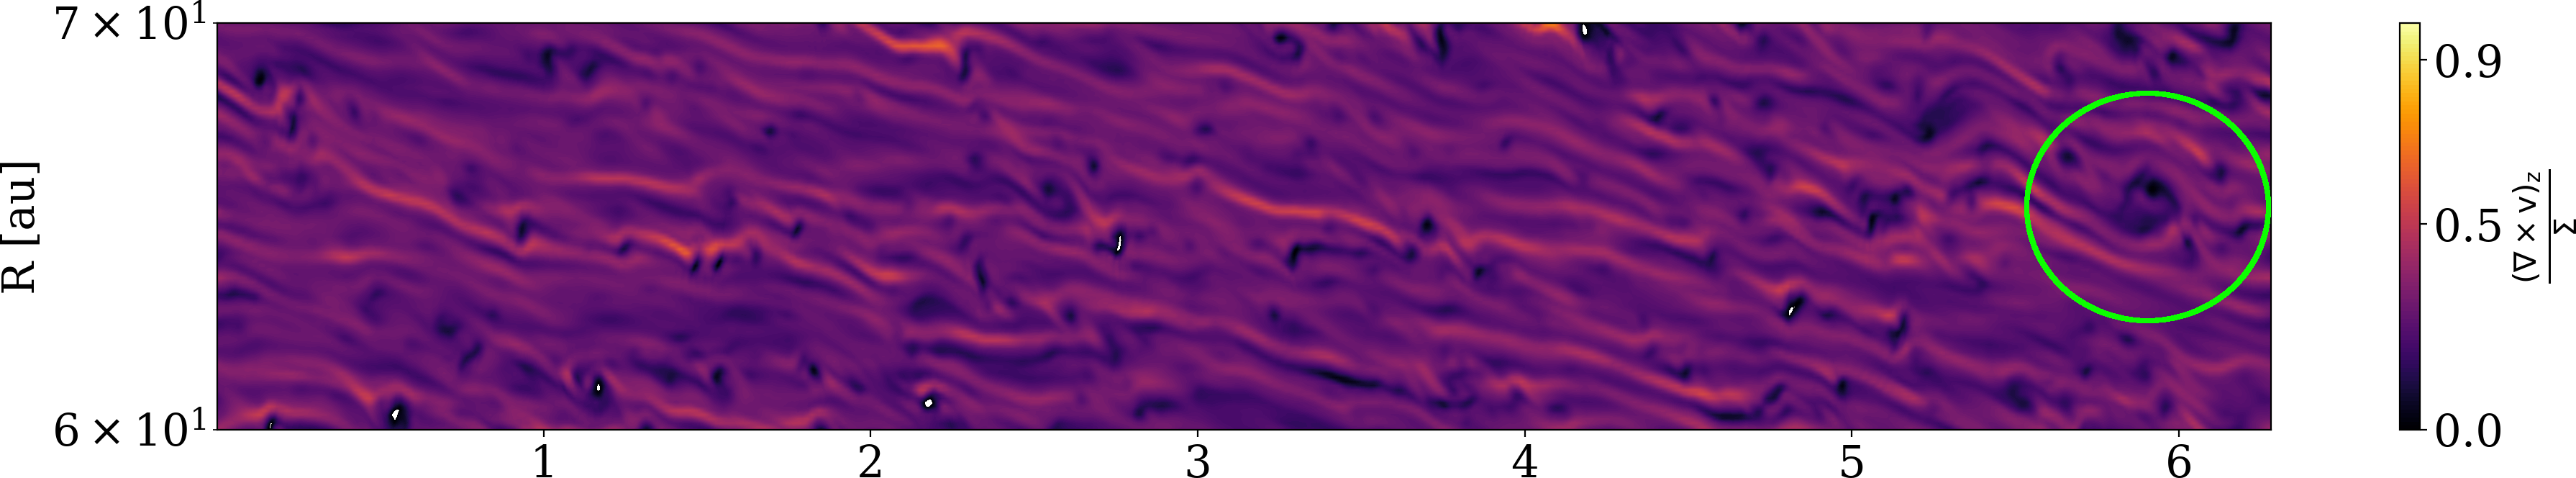
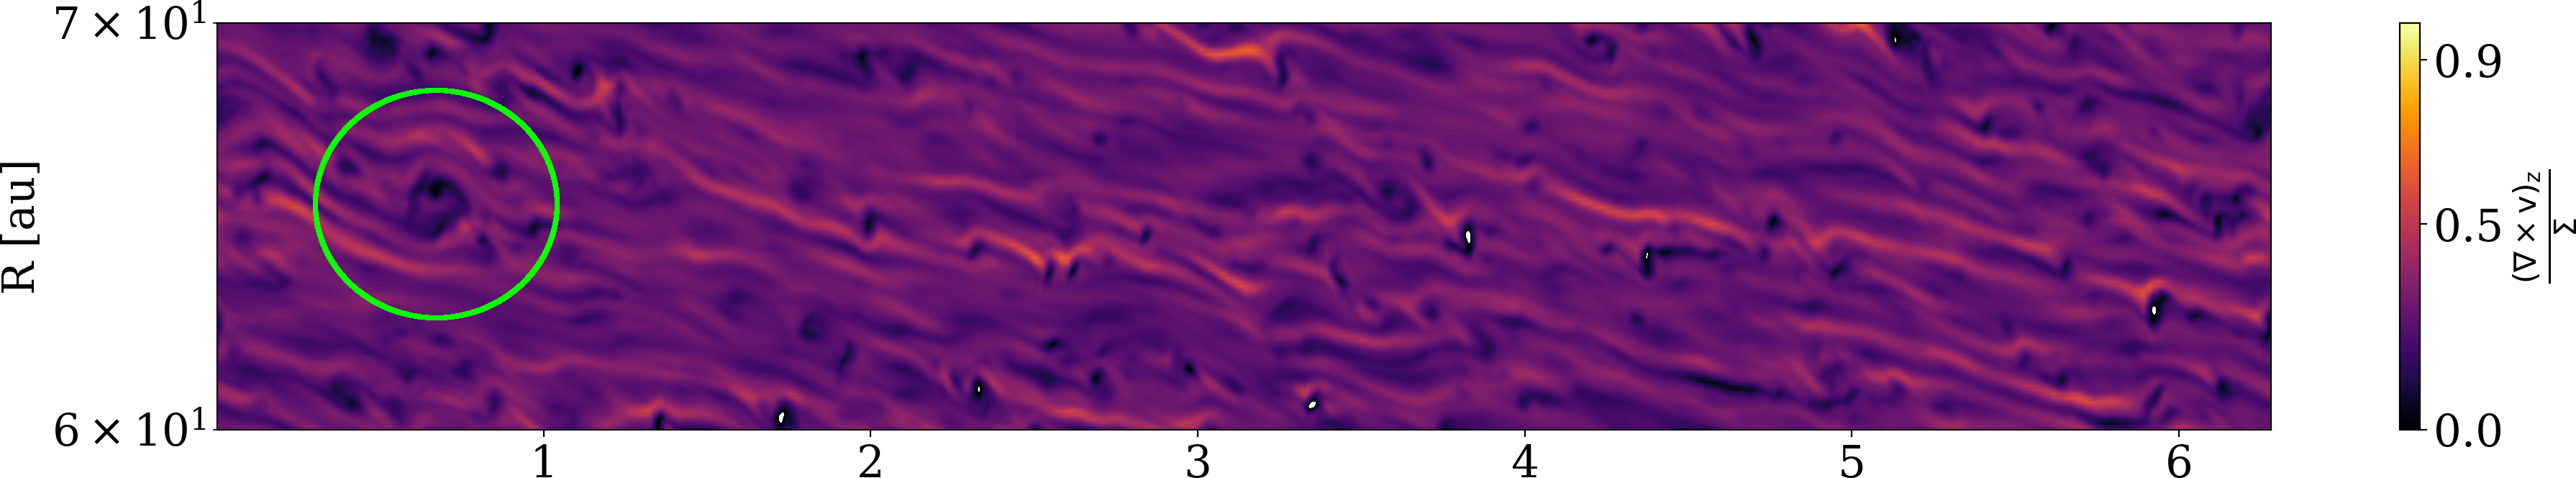
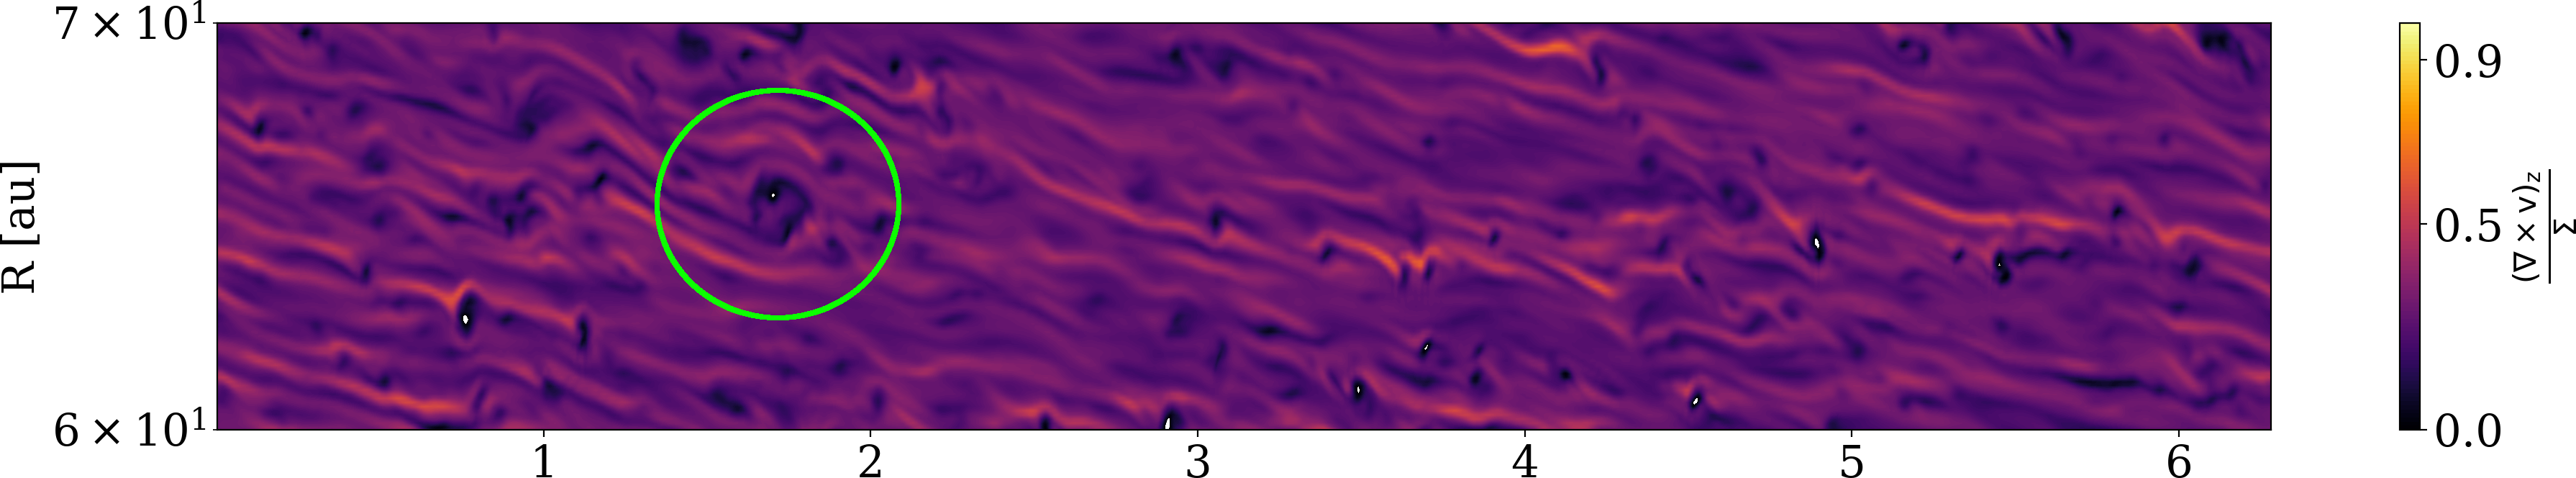
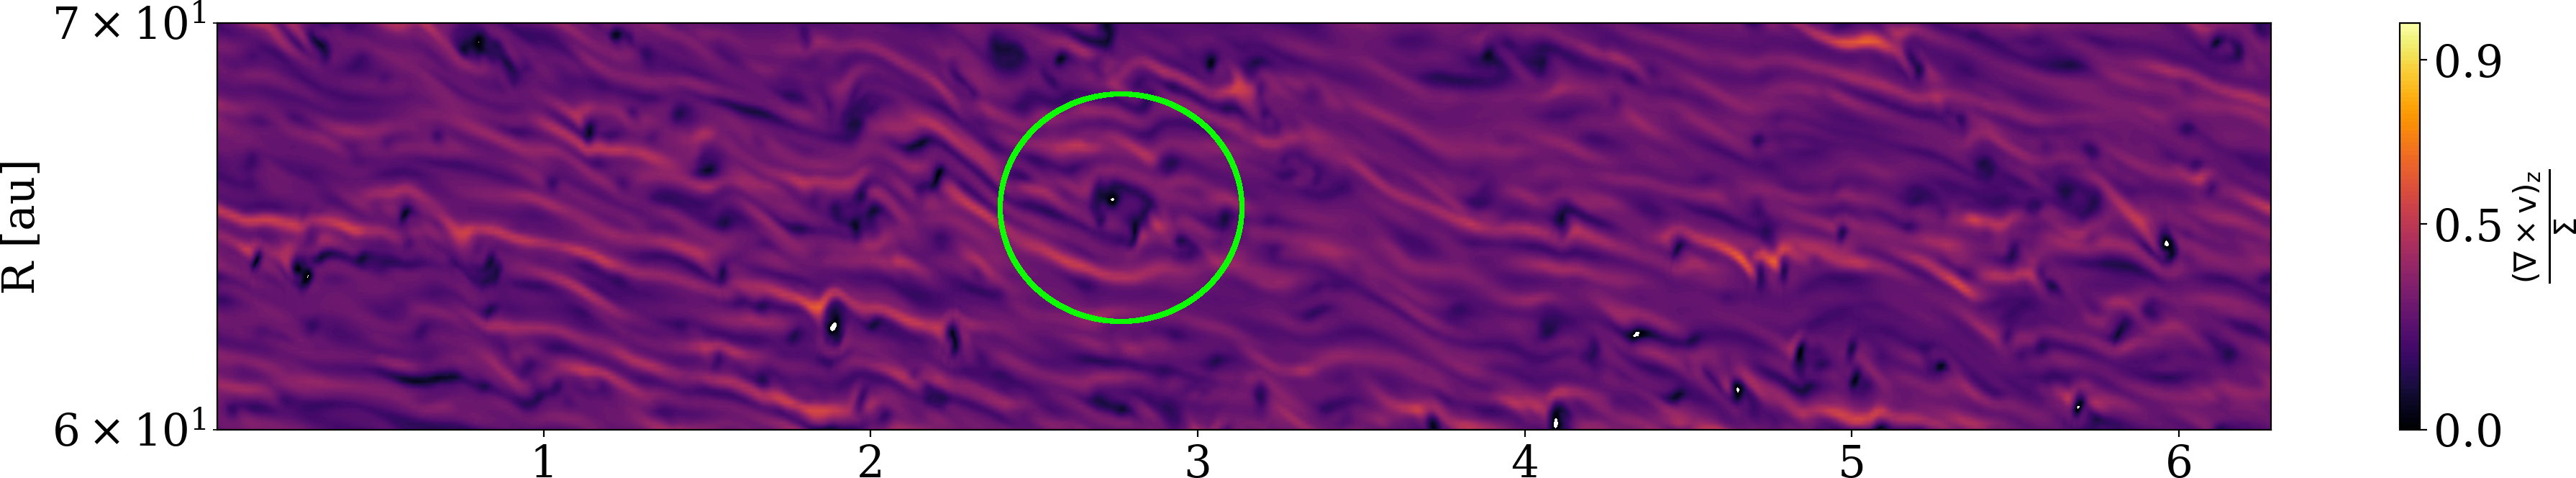
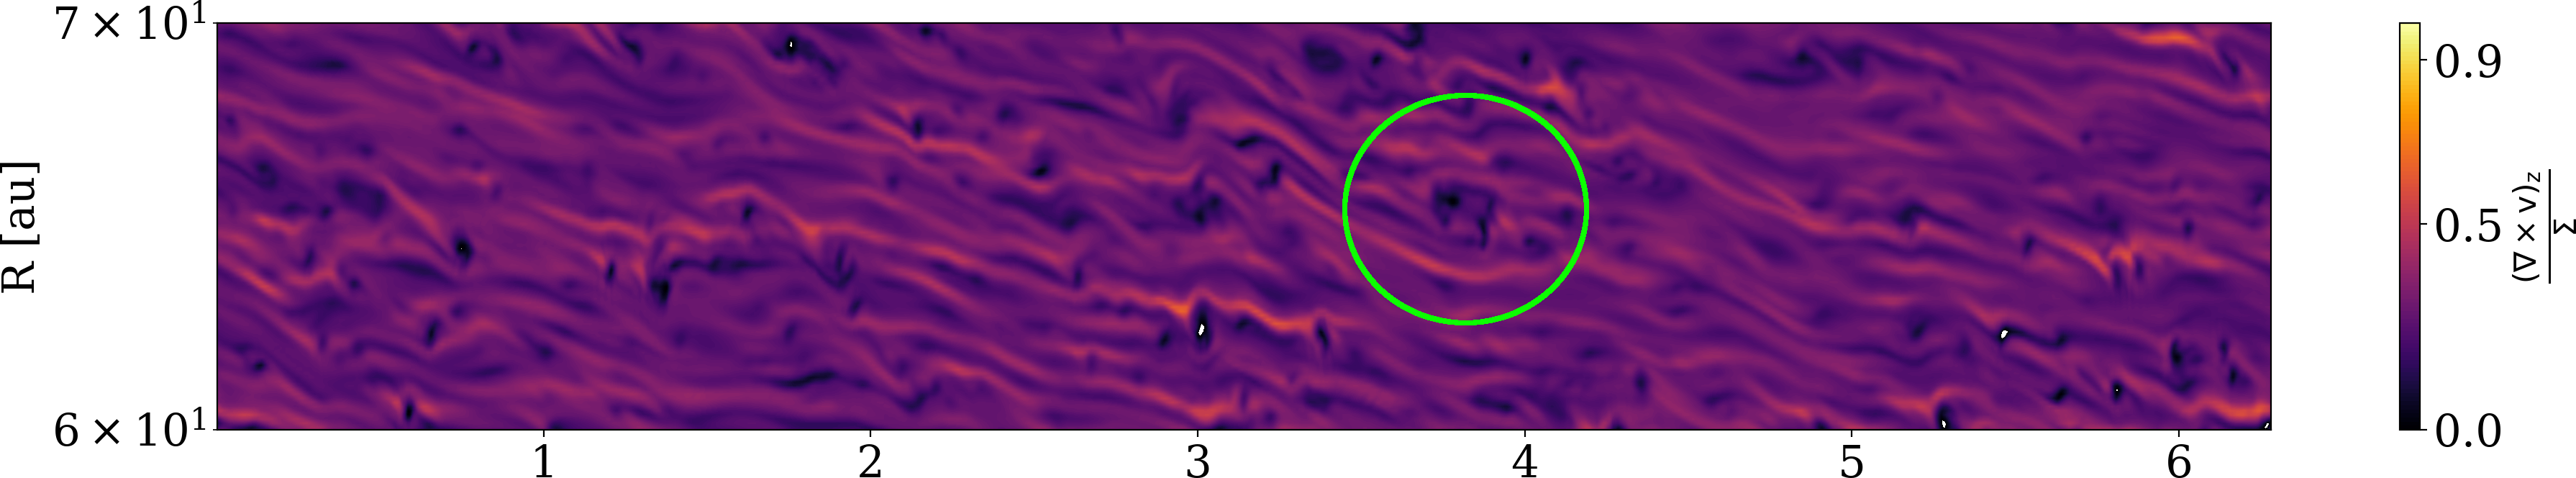
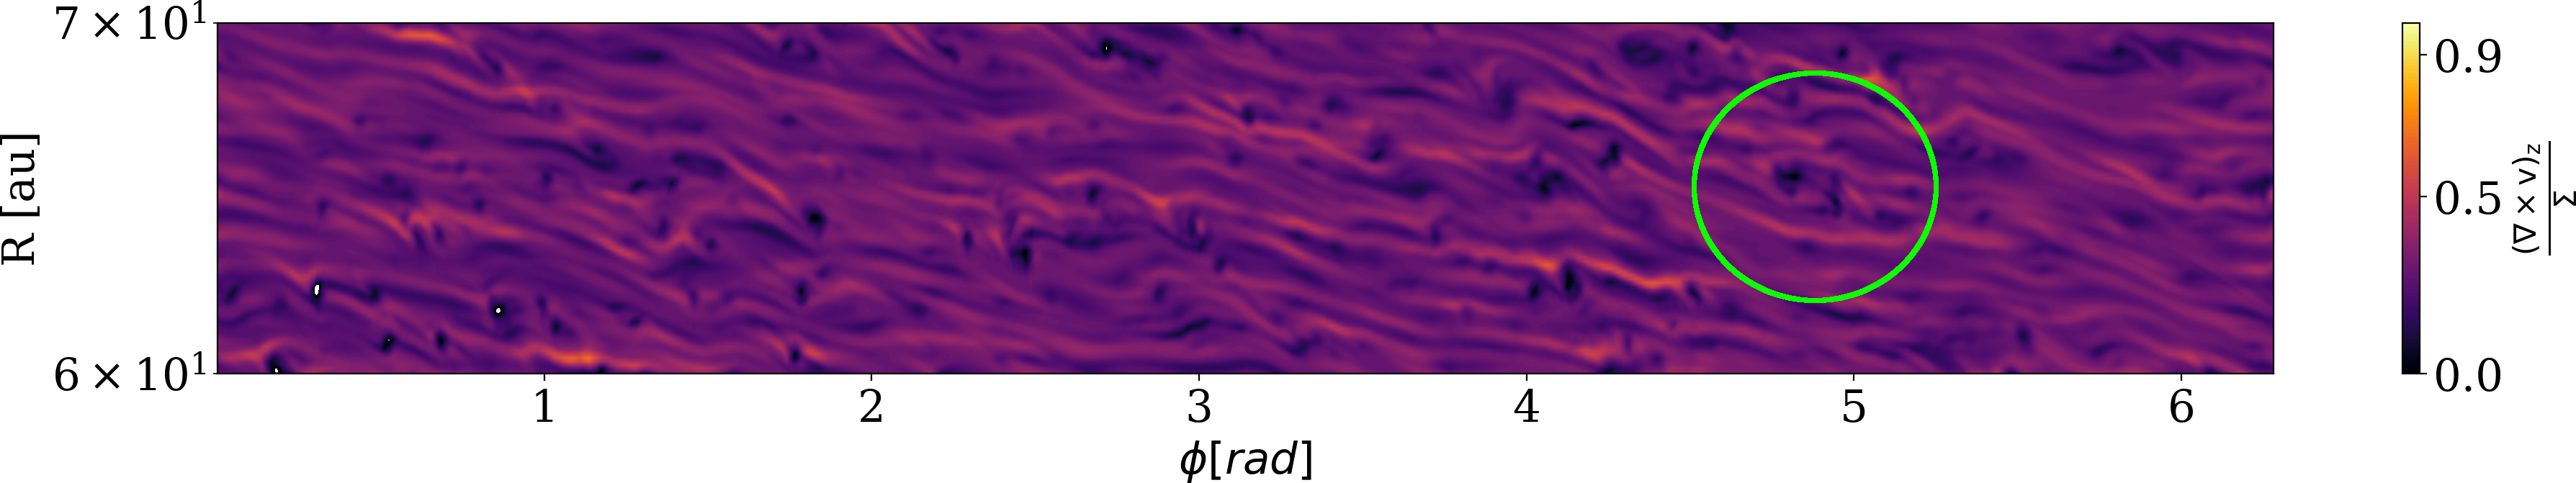
Here we investigate the formation and evolution of vortices in the simulation. We identify vortices using the vertical component of the vortensity . Fig. 5 shows a map of the vortensity in the midplane after 300 inner orbits. A single large vortex is visible as a dark region with a minimum in the vortensity around 30 au. The vortex is located radially inwards from the gas gap which is visible as a bright ring. The vortex is fully developed after 150 inner orbits. The position and size of the vortex are listed in Table 2. We define the vortex as the region where . The radial extent fluctuates between and , the azimuthal extent between and , and the aspect ratio between and . This vortex is generated by Rossby-wave instability and occurs in an annulus where the instability criterion of Li et al. (2000) is satisfied as we show in Appendix B. The detailed time evolution of the vortensity at 30 au is plotted in Fig. 6. During the first 50 inner orbits, the eight-fold symmetry from replicating run M3 is broken and a new steady-state develops. Small vortices form and merge up to 100 inner orbits. Thereafter a single large vortex is present. To lessen this vortex’s drift sideways on the plot, we shift each row in azimuth according to the orbital speed at 30 au. The vortex migrates only very slowly in radius (Table 2). A number of factors influence the speed at which a vortex migrates, including its size, strength, and aspect ratio (Paardekooper et al., 2010). For aspect ratios , Paardekooper et al. (2010) showed that vortex migration can be very slow, being two orders of magnitude slower than for a vortex with aspect ratio , for example, and hence it is likely the large aspect ratio of the vortex formed in the simulation () that explains its slow migration. Also important to note is that the vortex does not decay and is present for the whole remaining duration of the simulation. In contrast to our previous models of MHD turbulence arising from the magnetorotational instability (MRI), where a vortex was repeatedly formed and destroyed at the MRI dead-zone outer edge (Flock et al., 2015), here the vortex is not destroyed. Ignoring MHD effects, Lesur & Papaloizou (2009) showed that elliptical vortices are unstable with the exception of vortices with an aspect ratio between 4 and 6, which are stable. However the growth rate of the elliptical instability which could destroy the vortex remains small. For the aspect ratio of the large vortex we predict a growth time of about 100 orbits at the vortex position (Lesur & Papaloizou, 2009). Also, as this vortex is sustained by the RWI it might not be subject to the elliptical instability (Lyra, 2013). Further longer-term studies are needed to test the stability of this vortex, but close inspection of Fig. 5 indicates that the flow inside the vortex is not smooth, suggesting that the elliptical instability is operating to generate turbulence inside the vortex, but the tendency of this interior flow to destroy the vortex is counteracted by the continuous driving provided by the RWI due to the persistent pressure bump.
Many small, short-lived vortices present in our simulation are visible in Fig. 5. These appear similar to those reported by Richard et al. (2016), and likely have the same origin, namely small scale vorticity/vortensity perturbations generated by the VSI that undergo, local Rossby wave instability. In Appendix C, we isolate and observe the formation and evolution of such a small vortensity minimum. The lifetime is found to be approximately 1.4 local orbits, and this short life time is likely due to the elliptical instability acting strongly in these vortices which have small aspect ratios. As discussed in the next section, small local dust concentrations arise in these vortices, but are limited by the short lifetimes.
| time | [au] | [au] | [au] | |
|---|---|---|---|---|
| 150 | 30.1 | 4.6 | 45.1 | 9.8 |
| 200 | 30.4 | 3.6 | 45.3 | 12.6 |
| 300 | 29.9 | 4.1 | 35.6 | 8.7 |
| 400 | 29.5 | 3.6 | 34.8 | 9.6 |
3.3 Dust evolution
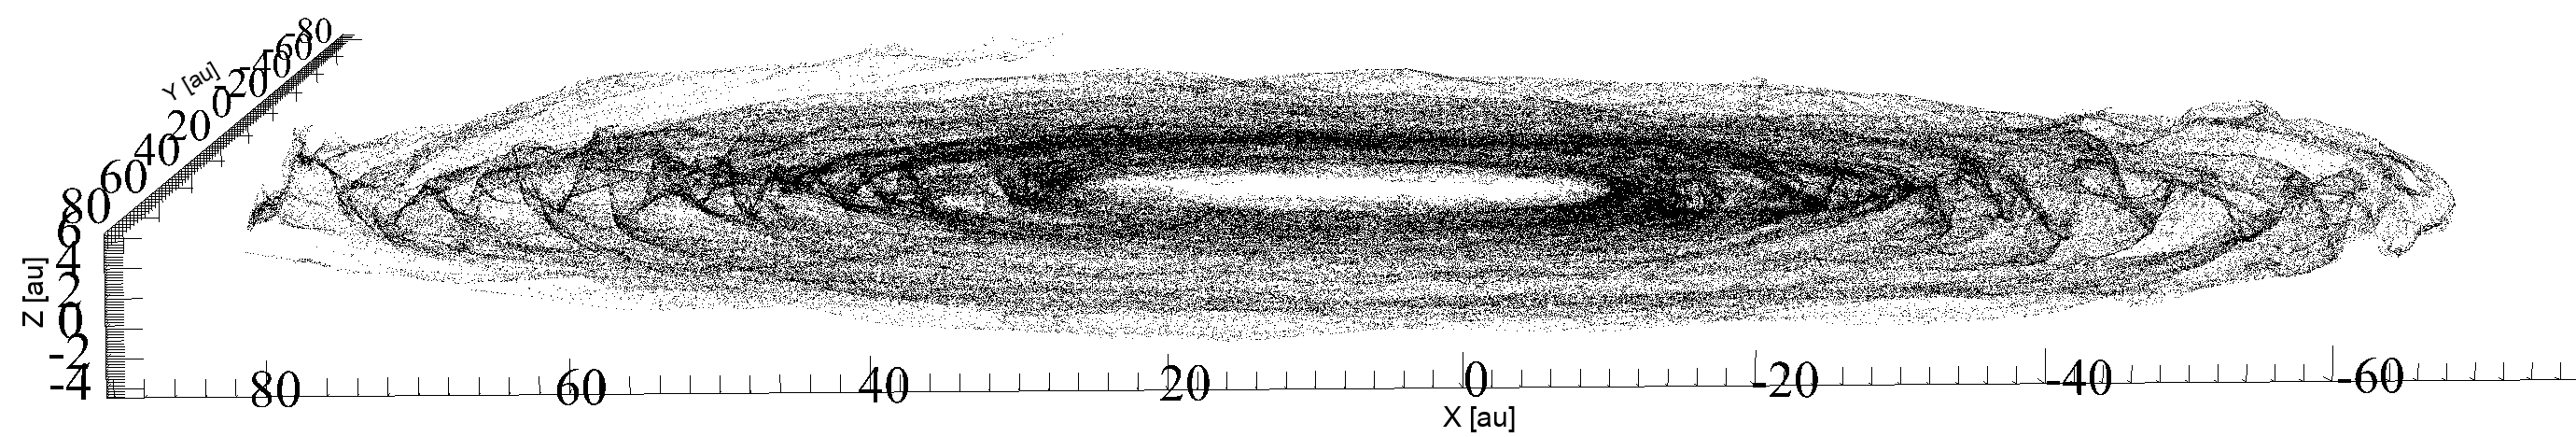
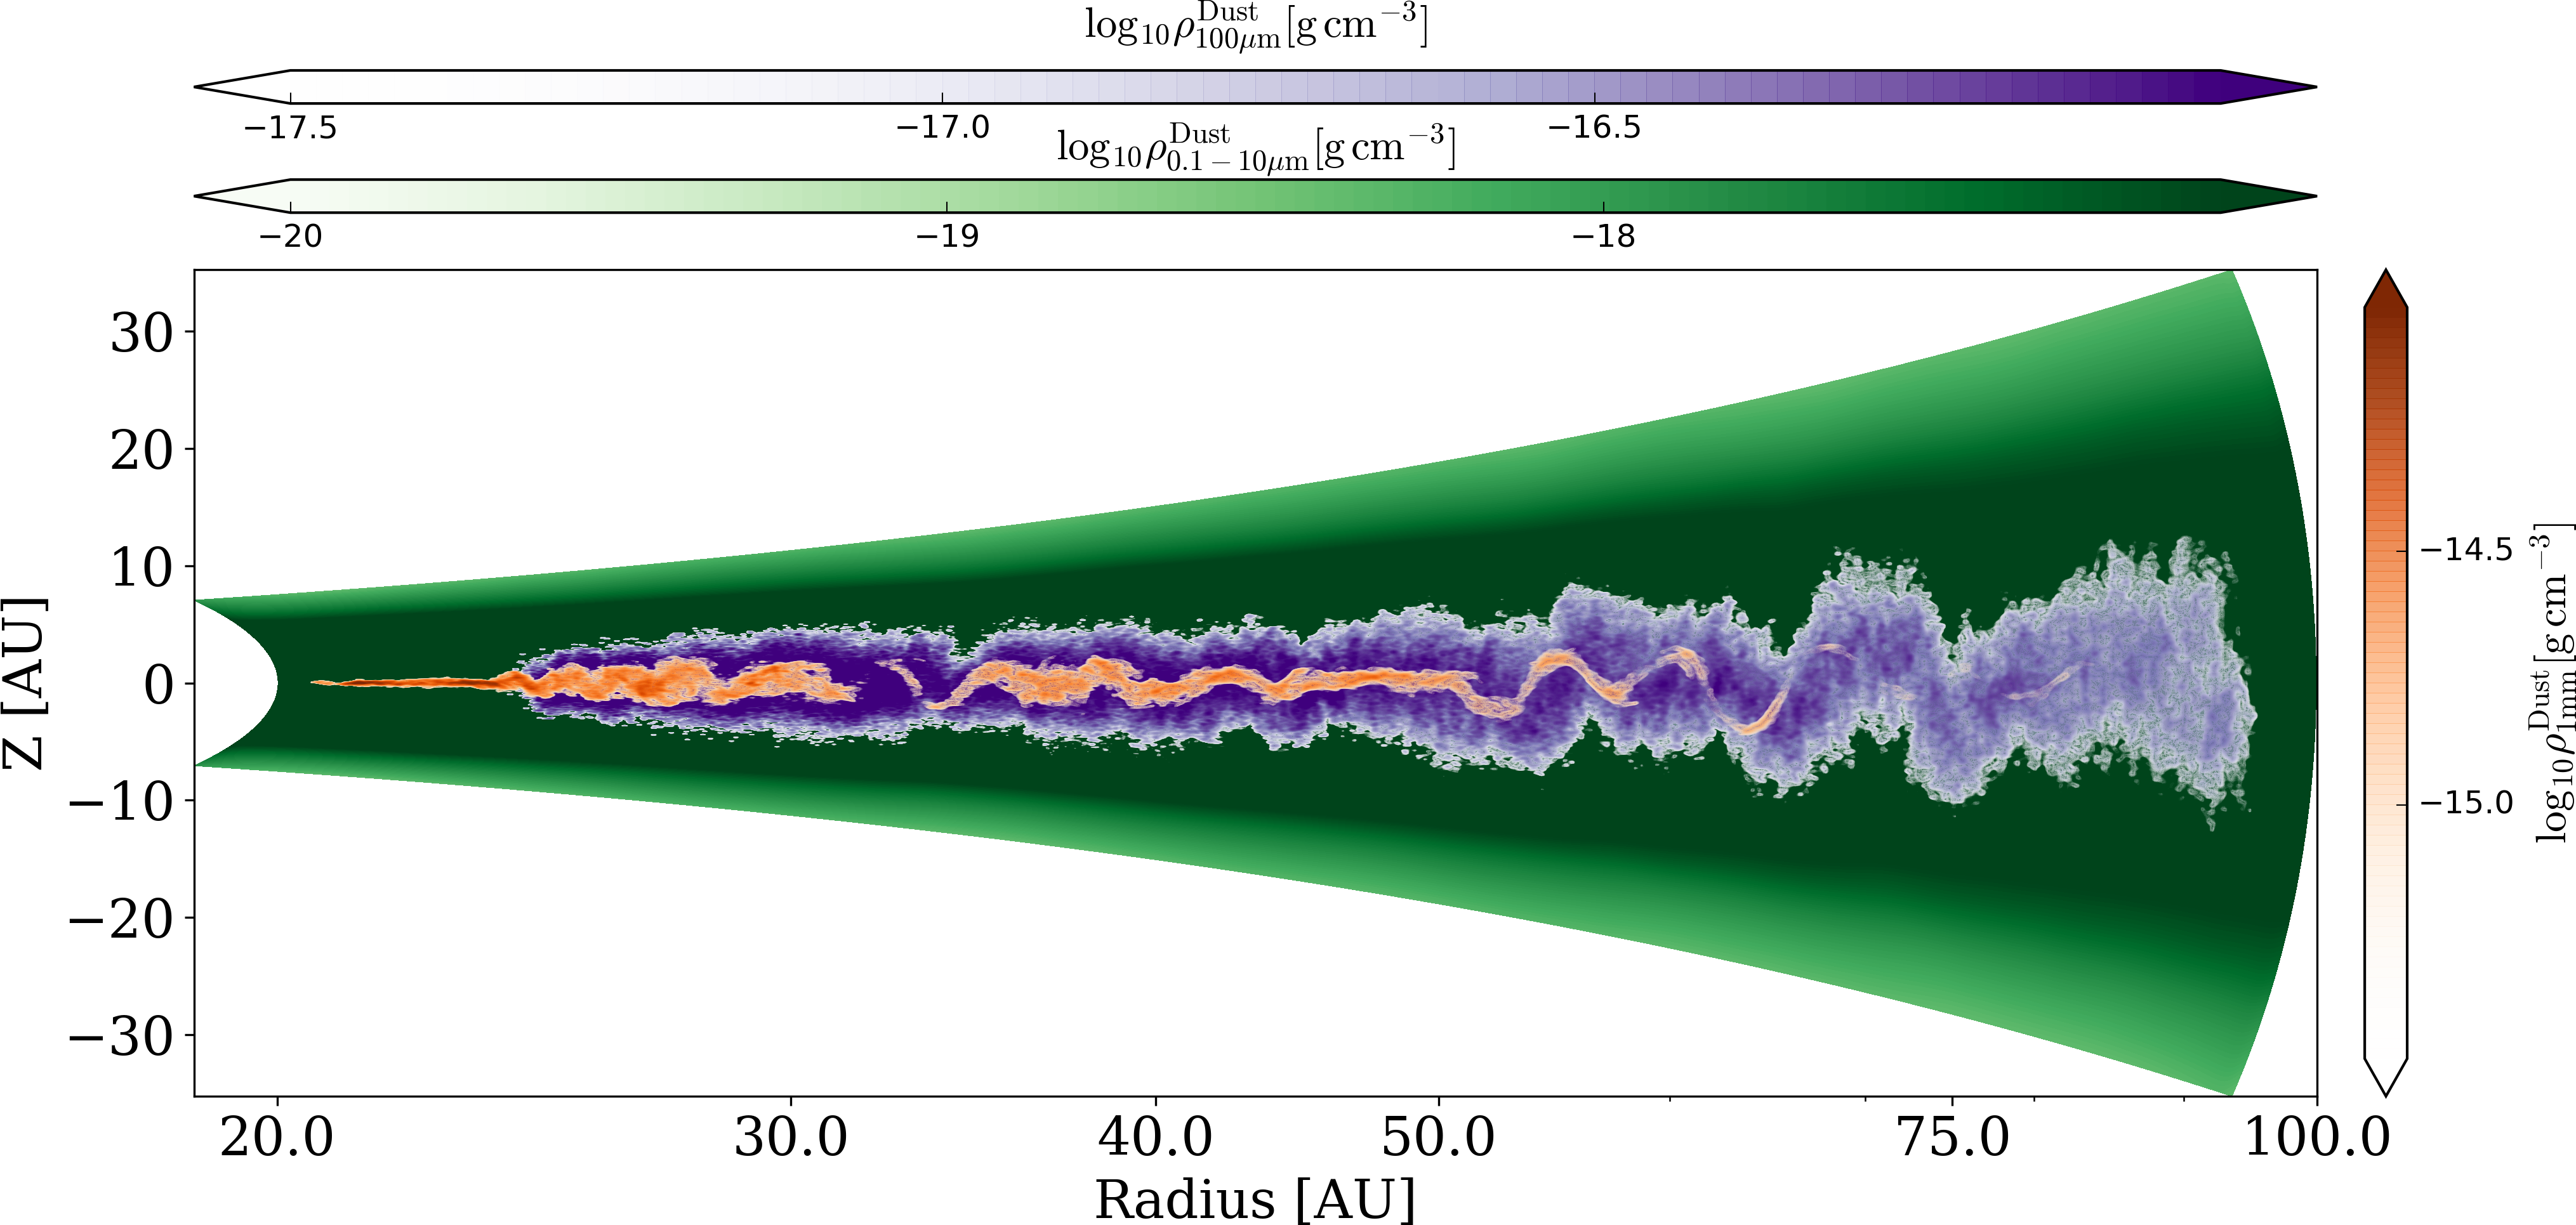
In this section we describe the results from the evolution of the 100 and 1 mm grains. A snapshot of the 1mm grains 50 inner orbits after the grains were added is shown in Figs. 7 and 8, close to edge-on and face-on, respectively. Most of the 1mm grains remain within of the midplane. In the outer regions, an oscillatory structure becomes visible due to the combination of radial drift and the vertical motions induced by the VSI. We note that in the outer disk the grains are not yet fully vertically mixed. For the 1mm grains we measure a mean inwards drift speed of outside of 70 au, which roughly corresponds to 0.2 au per inner orbit. This value is only slightly less than the analytical estimate of using the initial profiles. Fig. 8 shows the distribution in a face-on projection at the same time. The distribution of 1mm grains clearly shows the effect of the surface density depression with a lack of particles in this region. The vortex at the inner edge of the steep drop is clearly visible as a concentration of the 1mm grains to the south-east. The other disk regions exhibit small scale concentrations of particles. These concentrations are connected to the short lived vortices described in Section 3.2 and Richard et al. (2016). A fully edge-on view and comparison between both grain sizes can be found in Appendix D.
3.4 Dust vertical structure
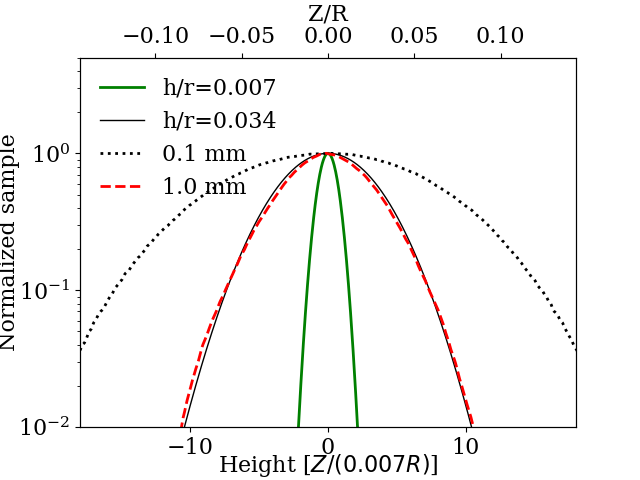
A critical ingredient for comparing 3D simulations of gas and dust with observations is the scale height of the dust grains. To measure the vertical distribution of the grains we consider all particles in the radial interval between 30 and 40 au. The particles are sampled by binning onto a high resolution grid with 1000 cells in the direction. The distribution is calculated at each inner orbit and then averaged from 30 inner orbits after introducing the dust particles until the end of the run. As we have shown in Flock et al. (2017b), grains at this position have already been mixed well enough to describe a new steady profile. The results are shown in Fig. 9. The plot shows that the 1 mm grains are mixed up very efficiently. We fit the dust scale height with a value of . This value is much higher than has been inferred from observations of the HL Tau system (Pinte et al., 2016), with , and higher than what we found in our previous non-ideal magnetohydrodynamical models (Flock et al., 2017b).
We also compare our results with the well-known equilibrium solution for dust settling in a turbulent medium (Dubrulle et al., 1995)
| (11) |
with the gas scale height in units of the radius , the Stokes number, , and the dimensionless diffusion coefficient defined as . The dimensionless diffusion coefficient is often expressed in units of the parameter (Dullemond & Dominik, 2004; Schräpler & Henning, 2004) with the Schmidt number close to unity (Johansen & Klahr, 2005; Turner et al., 2006). By using the values from our simulations for the 1 mm grains between 30 and 40 au, we obtain , a similar value to what we found in our non-ideal MHD simulations (Flock et al., 2017a) and to what has been inferred for the mm dust in HL Tau (Pinte et al., 2016). However to obtain the value , which we directly fitted to the dust grain distribution, we need to assume , which tells us that the VSI is 27 times more efficient in mixing vertically than in transporting angular momentum radially. We therefore suggest that if the VSI is operating in the HL Tau disk, the vertical mixing might be quenched either by non-ideal MHD effects by a magnetized wind layer (Cui & Bai, 2019) or by dust drag due to a high dust to gas mass ratio (Pinte et al., 2016; Lin, 2019a). Recently Schäfer et al. (2020) obtained results showing the VSI operating together with a dust layer. The efficiency of the streaming instability in these environments remains still under investigation (Yang et al., 2018; Umurhan et al., 2019; Schäfer et al., 2020; Chen & Lin, 2020). We discuss more on the dust scale height measurements in Section 4.7.
Following Fromang & Papaloizou (2006), another way to express the vertical diffusion is given by . To compare with previous models by Stoll & Kley (2016) we determine the eddy timescales . For the 1mm grains we determine in the annulus between 30 and 40 au which leads to . A similar value was found by Stoll & Kley (2016) for the vertical diffusion of particles (see Section 4.3 therein).
3.5 Individual grain motion
We illustrate how the grains evolve by here showing four representative particles, chosen at random from among the 0.1-mm particles, and four from among the 1-mm particles. Fig. 10 shows the spatial and thermal evolution of the four 1-mm grains.
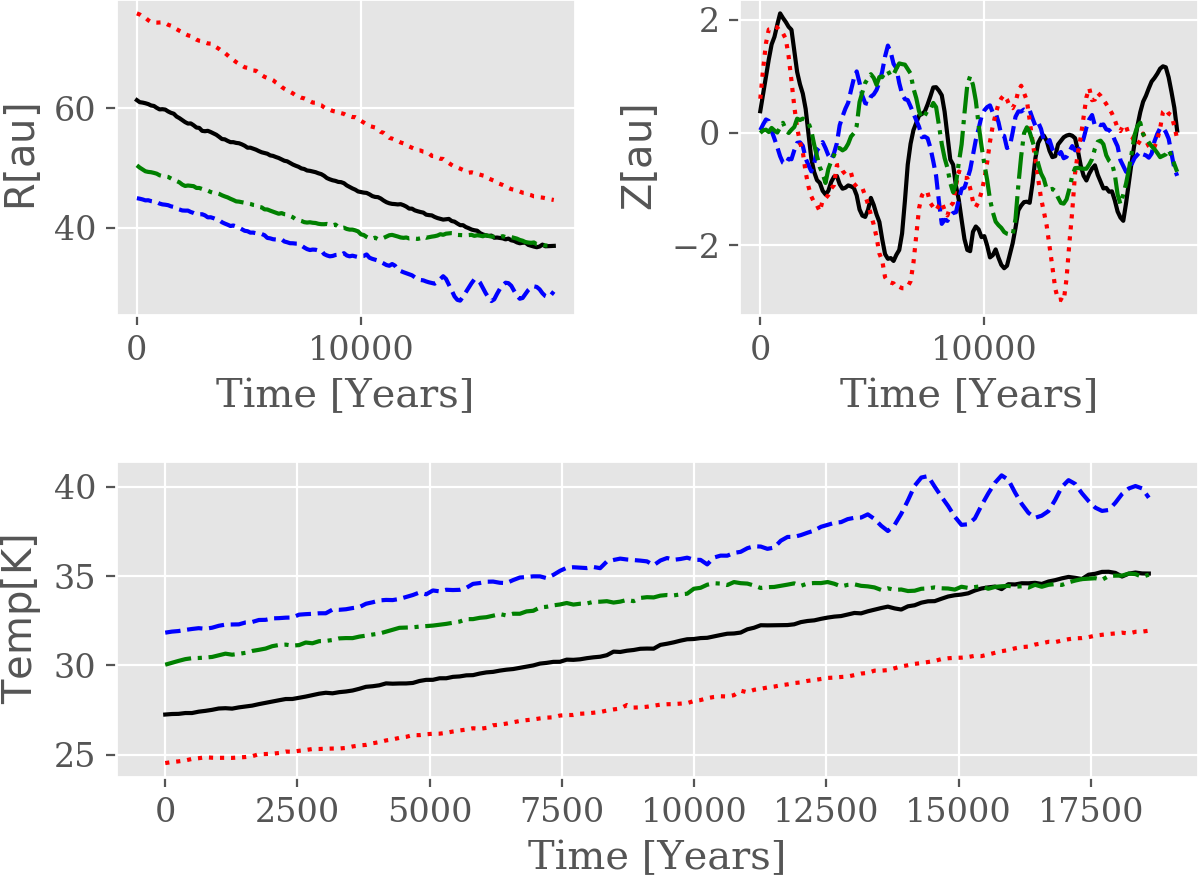
All four show a clear radial drift over the simulation runtime. The time is now given in years as their radial location is constantly changing. The 1mm grains drift inwards approximately 20 au in 10,000 years. Fig. 10, top left panel, also shows that locally the radial drift can be reduced (see green dash dotted line) or can halt inside the vortex (blue dashed line). The vertical distribution of the four grains is shown in Fig. 10, top right panel. The VSI’s characteristic upward and downward motions are clearly visible. At these distances, mm grains need around 5000 to 10000 years to travel from one hemisphere to the other, around 2 au above and below the midplane. None of the four mm grains make excursions up into the regions of the disc that are strongly heated by the star, as is clear from their temperature evolution. Fig. 10, bottom panel, shows the temperature evolution of the grains. We assume the dust and gas temperatures to be equal. All four grains warm up as they drift inward. The grain which gets trapped in the vortex (blue dashed line) shows oscillations in temperature around 40 K, connected to the radial oscillations due to the vortex rotation.
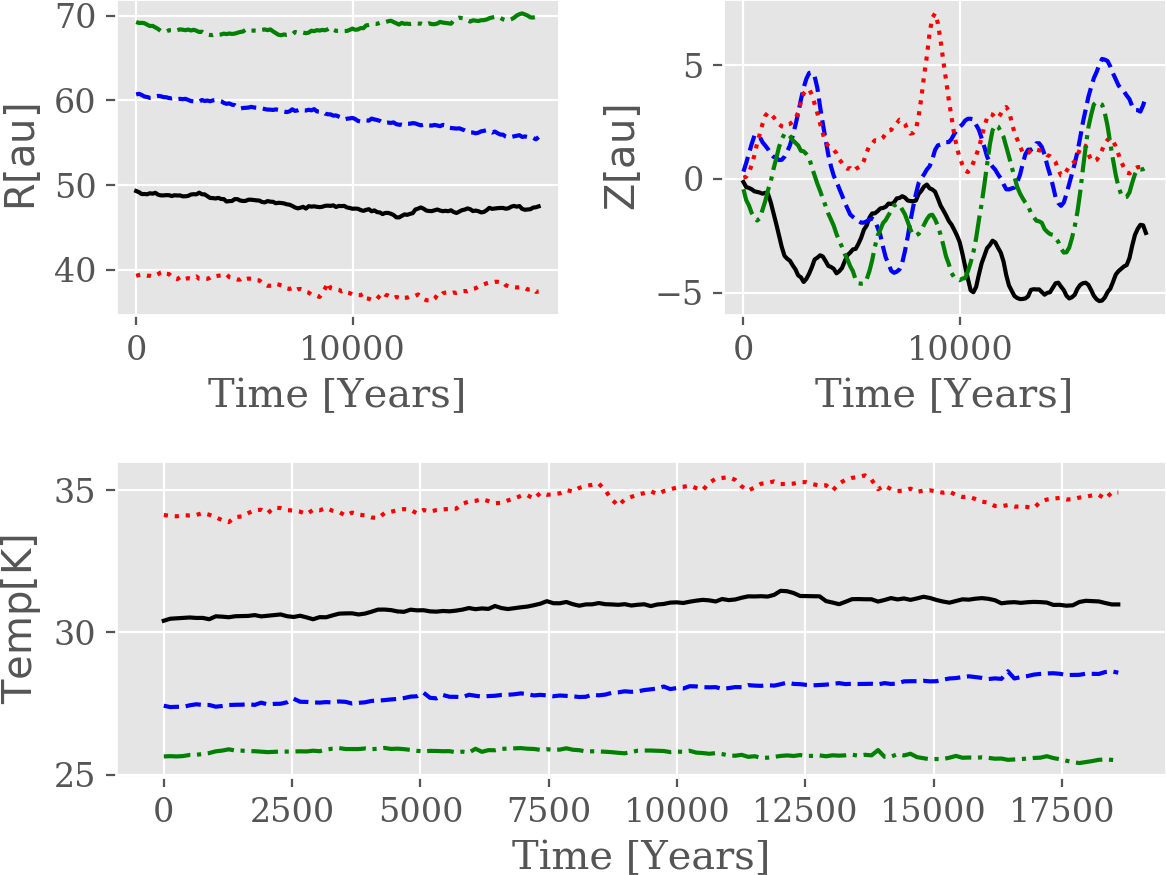
The evolution of four individual 100 grains is shown in Fig. 11. The top left panel shows the radial locations over time. As expected the radial drift of these grains is strongly reduced compared to the 1 mm grains. Three of the grains show no substantial radial drift, while one drifts about 5 au in 20 thousand years (blue dashed line). Fig. 11, top right panel, shows the vertical locations of the grains over time. Due to the their smaller size they are able to reach higher altitudes in the disk, spanning a region about the midplane, showing a similar pattern of upward and downward motions to the 1-mm grains. The 100 m grains also remain below the disk’s irradiated surface layers, as shown by the temperature evolution in Fig. 11 bottom panel. The warm starlight-irradiated layers begin about 2.2 scale heights or 12 au above and below the midplane at 50 au.
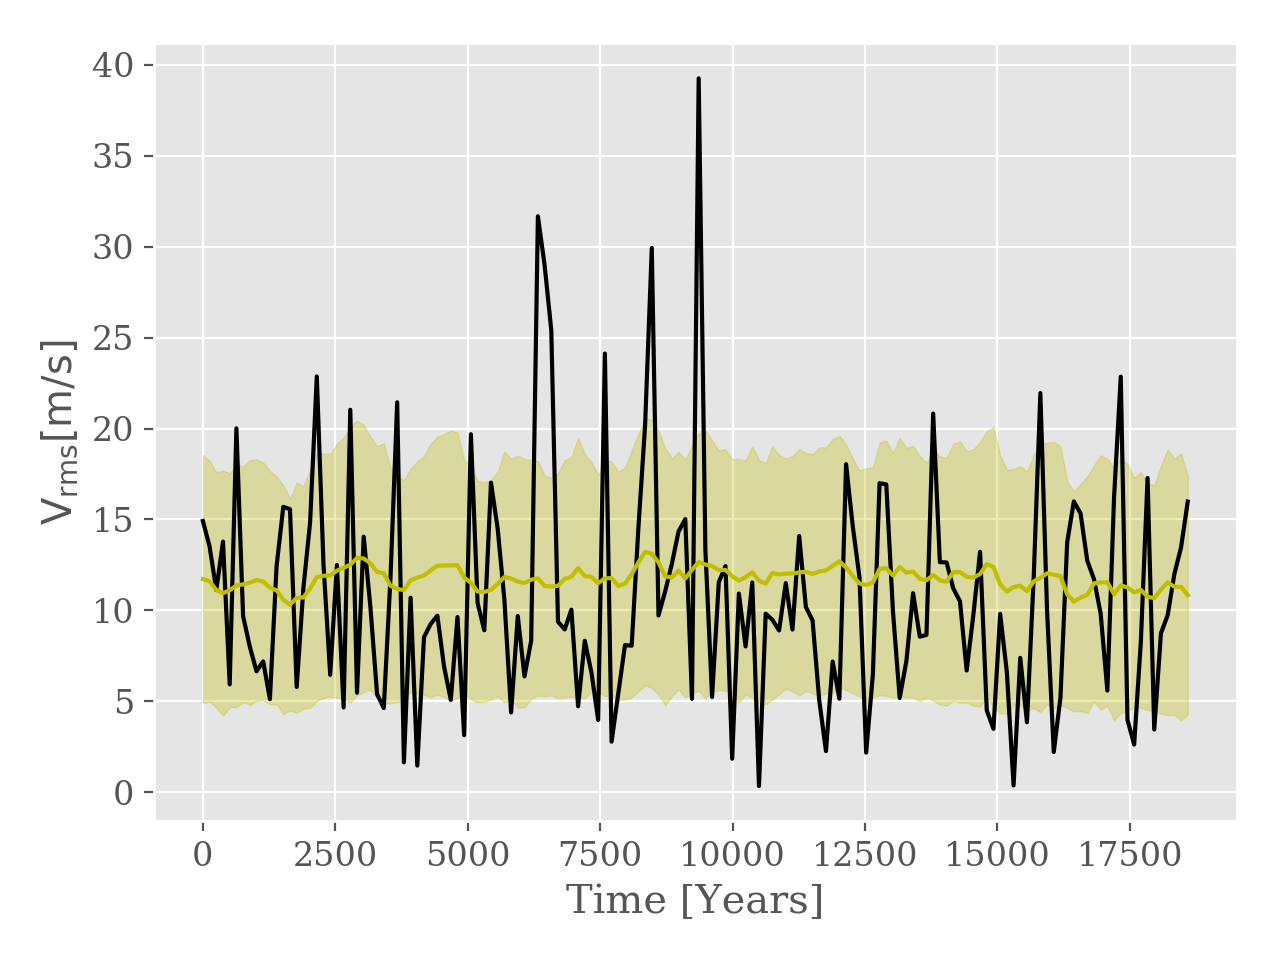
3.6 Turbulent speeds
To obtain the characteristic turbulent velocities of the grains we first perform a time average over the full simulation time of each velocity component. This temporal mean is subtracted from each particle’s velocity at each time step. This way the radial drift is removed from the radial component. The azimuthal component changes erratically with time, such that a mean azimuthal velocity is not easily chosen. We therefore focus here on the radial and vertical turbulent velocity components, and note that these provide a lower limit on the turbulent flows’ speed. Fig. 12 shows the time evolution of the turbulent speed for an individual 1mm grain. The root-mean-square and standard deviation of all remaining 1mm grains are over-plotted for reference. We determine a value of . The 100 grains show a slightly higher turbulent of . The representative individual particle plotted in Fig. 12 shows that locally grains are accelerated quite substantially to several tens of meters per second. For the chosen mm grain, for a short time period the speed exceeds 30 m/s.
4 Discussion
In this section we compare our results with other models and discuss the implications of our findings. We start with the turbulent saturation value, followed by the radial profile of , then vortex formation, and finally the dust mixing.
4.1 Turbulence saturation value
With our high resolution simulations covering all of azimuth we reach a turbulence level of . We note that this value is around 4 times higher than what we have found for our previous model with a limited azimuthal extent. This result is not surprising as larger modes can now fit into the domain and it is known that the VSI drives perturbations with large azimuthal scales (see also the spectrum analysis in Fig. 3). Our value of is similar to previous radiation HD simulations covering in azimuth by Stoll & Kley (2014) which also found . Isothermal simulations by Nelson et al. (2013) and Manger & Klahr (2018) reported higher values with . Such higher values are expected for isothermal simulations as those present the upper limit of fastest cooling times. In addition we note that the VSI strength depends on the disk’s aspect ratio (Nelson et al., 2013) with stronger turbulence for larger scale heights. Our aspect ratio H/R ranges from 0.09 at the inner radial boundary to 0.14 at the outer boundary. We also highlight the different nature of VSI turbulence compared with the turbulence driven by magneto-rotational instability (MRI). The azimuthal Fourier power spectrum we obtain for the VSI is similar to previous results. The slope is shallow between and , steepening to between and , and steepening further between and . Manger & Klahr (2018) reported a similar profile for wavenumbers up to .
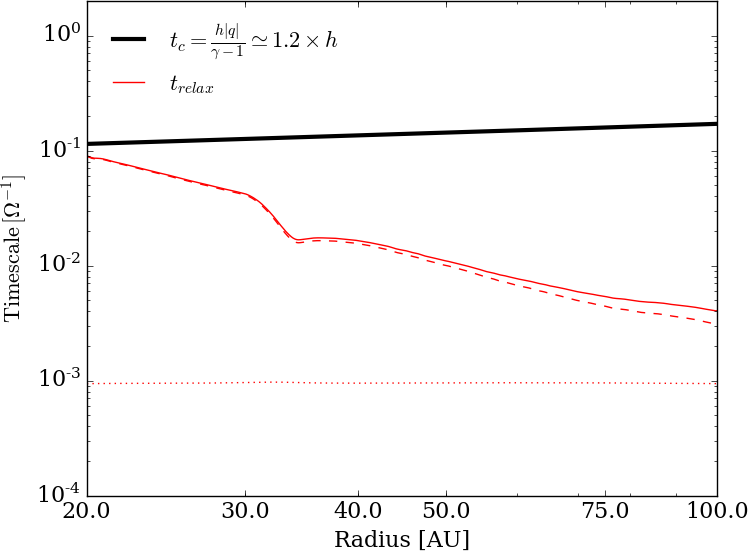
4.2 The inner edge of the VSI active zone
Our simulation results show increasing VSI activity with radius out to 35 au, after which the strength of the induced turbulence levels off. The increase is connected to the fact that the relaxation timescale is a decreasing fraction of the orbital period as we move away from the star, falling further below the threshold value below which the VSI operates. Moving radially outwards, the disk becomes less optically-thick, allowing faster thermal relaxation and strengthening the VSI. Nelson et al. (2013) found the threshold for the relaxation timescale to be . For they found that the VSI does not operate in the disk while decreasing the relaxation time by only one order of magnitude was enough to show a fully evolved turbulence (compare Fig. 12 in Nelson et al. (2013)). In Fig. 13, we compare the critical timescale of the VSI with the thermal relaxation timescale as described in Lin & Youdin (2015) and adopted by Malygin et al. (2017) and Lyra & Umurhan (2019). For our model we expect the VSI to be quenched inwards of 20 au. We find that between 20 and 30 au the turbulence strengthens, saturating at around 35 au (see Fig. 2). This turbulence profile triggers a modification of the surface density profile, and the structure that develops leads to the subsequent generation of a vortex by the RWI. It is interesting to note that such a process of surface density perturbation is very similar to the vortex generation mechanism in a magnetised disk which has a dead-zone in the inner disk but which supports magnetorotational turbulence in the outer disc. Here the change in turbulence activity also leads to the formation of a vortex at the outer edge of the dead-zone (Flock et al., 2015). We interpret our new result of a large scale and persistent vortex forming in a non-magnetised disk in terms of a VSI dead-zone transitioning to an active zone once the thermal equilibrium timescale reaches the critical timescale of the VSI. We note that the exact location and size of the vortex might be influenced by the initial surface density profile from which we restarted. We expect that the VSI transition region should also occur in simulations having a pure cooling which depends on radius and height. 2D maps of the thermal relaxation timescale were presented by Pfeil & Klahr (2019), and these could easily be implemented within the cooling framework. Future studies should test this transition regime of the VSI and its possible impact on ring formation in protoplanetary disks.
4.3 Dust opacity feedback on the VSI activity
The position of the inner edge of VSI activity depends on the optical depth and so on the total amount of dust. For a lower dust abundance, the VSI activity is shifted inwards (Flock et al., 2017b) while for a higher dust amount it is shifted outward. For our model we estimate the inner edge of the VSI activity to be at about 45 au, 18 au and 7 au for dust-to-gas mass ratios of small grains of , and .
The fact that the VSI activity is sensitive to the total optical depth and so the local dust abundance suggests positive feedback could occur. For example, a small local random fluctuation in the accretion stress may lead to the formation of neighbouring disk annuli with higher and lower surface densities. The resulting changes in the local optical depths might reinforce the variation in accretion stress, allowing the changes to amplify. Such a process may lead to the formation of ring-like perturbations in the surface density profile, as demonstrated by Dullemond & Penzlin (2018). Furthermore, substantial concentration of grains may have a positive dynamical feedback effect, as the additional inertia the grains provide might further reduce the turbulent activity in the higher surface density regions relative to the surrounding lower density regions (Lin, 2019a).
4.4 Vortex formation
Our model develops a large-scale, long-lived vortex at around 30 au. This vortex appears because of the surface density perturbation arising from the spatial variation in turbulent activity. The vortex aspect ratio of is very similar to the value reported in Manger & Klahr (2018), who also saw large-scale, long-lived vortices in their simulations of the VSI operating in discs with very short cooling timescales. Unlike their vortex, the one in our model does not migrate because it is generated and maintained at a single persistent feature in the surface density profile. The vortices in Manger & Klahr (2018) appear to be generated by the RWI operating at the locations of intermittent surface density features that arise as natural fluctuations in the flow. We do not see the spontaneous emergence of large scale vortices by this mechanism in our simulation, likely due to the fact that the cooling timescales adopted by Manger & Klahr (2018) lead to a more vigorously operating VSI with a larger value of , compared to the smaller value of we obtain in our simulations. Fluctuations around this larger value of likely lead to larger fluctuations in the surface density profile, allowing the emergence of multiple large scale vortices. Manger & Klahr (2018) also use steeper power-law radial declines in density and temperature, strengthening VSI activity and vortex formation.
In addition to the large persistent vortex, we observe the formation of many smaller vortices that have short life times, on the order of the orbital period, because of their small aspect ratios. Both Richard et al. (2016) and Manger & Klahr (2018) have reported the existence of similar small and short lived vortices in simulations of the VSI. These could arise from secondary instability because of the RWI or Kelvin-Helmholtz instability which acts on small scale vortensity perturbations generated by the VSI (Latter & Papaloizou, 2018). The formation of small, tightly wrapped vortices with small aspect ratios allows the elliptical instability to operate effectively, such that the vortices quickly dissolve into the background turbulent flow. Vorticity capturing schemes, such as that presented by Seligman & Laughlin (2017), might be well suited for studying such small scale vorticies. Finally, we note that the reduced resolution of 35 cells per H in azimuth should nonetheless be high enough to study the formation and evolution of vortices. For comparison Manger & Klahr (2018) used a resolution of 12 cells per H.
4.5 Dust mixing and depletion of CO
In a recent work Krijt et al. (2018) found that dust growth and settling can lead to a depletion of CO from the warm molecular layer located at higher altitudes in the disk. Connected to this idea we investigated whether the strong upward motions of the VSI can lift 100 sized grains into these warm molecular layers. However, none of the half-million 100 grains in our models reaches these irradiated layers. Nonetheless, the idea that grains in the cold midplane can be mixed up into the warm molecular layer, and release molecules to the gas phase, could still work for smaller grains or grains which are more fluffy. The efficiency of CO depletion, as presented in Krijt et al. (2018), should be investigated for the vertical shear instability in the future.
4.6 Influence on pebble accretion
The growth of planetesimals and planetary embryos by the accretion of pebbles is an important part of planet formation (Johansen et al., 2015). For efficient pebble accretion the pebbles’ scale height should be smaller than the Hill sphere of the planet, . The aspect ratio of our millimeter particles means that a planet at au has Hill radius exceeding the particles’ scale height if the planet’s mass is greater than times the stellar mass. For our 0.5- star this translates to efficient accretion of millimeter-sized pebbles by planets with more than . Picogna et al. (2018) investigated the pebble accretion efficiency in VSI turbulent disks and found a peak for Stokes number unity grains because of their more effective settling. Dust coagulation, fragmentation, and radial drift models predict typically a maximum Stokes number of between and (Testi et al., 2014; Ueda et al., 2019), similar to our 100 m and mm-sized grains. For these values, pebble accretion efficiency is reduced according to Picogna et al. (2018). Further study is needed of the pebble accretion efficiency on planets embedded in VSI turbulent disks. Our results indicate that the turbulent velocities induced by the VSI are likely to lead to the fragmentation of colliding mm-sized grains, and the scale height of mm-sized grains is too large to allow for efficient pebble accretion by terrestrial-mass planetary embryos. It is difficult to avoid concluding that the VSI is not conducive to either the early or late phases of planet formation. Both problems, however, could be overcome if strong local concentrations of dust grains can arise such that the VSI is suppressed by the additional inertia provided by the particles (Lin, 2019b).
4.7 What determines observed dust scale heights?
Good measurements of the dust scale height are so far available only for a few of the brightest protoplanetary disks , assuming the dust opacity and the relevant grain sizes are correctly modelled. One of these is HL Tau, where the dust scale height is much smaller than the expected gas scale height, with a best fit at 100 au for millimeter-size grains (Pinte et al., 2016). Millimeter-sized grains’ abundance is confirmed by the system’s spectrum at millimeter to centimeter wavelengths (Carrasco-González et al., 2019). However, to compare our results to HL Tau, we must allow for the differing Stokes number. If the grain density and size are the same, the Stokes number is proportional to .
The gas density in the disk around HL Tau has not been observationally determined, so we estimate upper and lower limits. The upper limit comes from the Toomre parameter, which governs when the disk is gravitationally unstable. As the disk shows no pattern or spiral, it is likely stable against self-gravity. Following Hasegawa et al. (2017), the gas surface density at 35 au then cannot exceed 100 g cm-2, eight times our value. The lower limit we derive from HCO+ observations by Yen et al. (2016). An HCO+-to-H2 ratio of 10-8 (Cleeves et al., 2015) would mean the HCO+ column density of 1016 cm-2 at this position translates to a gas surface density of 3 g cm-2. The gas scale height at 35 au from HL Tau is only slightly smaller than in our model, with a ratio . Taking all this together, for the upper gas density limit we estimate that the Stokes number for millimeter grains at this position in HL Tau is 7.2 times less than in our model, which by eq. 12 implies an even greater dust scale height of 0.072. For the lower gas density limit, which is around four times less than in our model, the Stokes number would be bigger by a factor 4.5, and so the dust scale height would be 0.017, still significantly greater than the value of 0.007 measured for HL Tau.
In both gas density limits, the strong VSI mixing would lead to a greater dust scale height than observed in HL Tau. In the lower limit, the dust-to-gas mass ratio would be near 0.1, perhaps large enough that the dust’s back-reaction on the gas could hamper VSI. However, it is unclear how a globally-enhanced dust-to-gas ratio would be reached in such a young system.
If the VSI is absent from these regions of protostellar disks, what could be the reason?
One possibility is that magnetic activity in the disk’s atmosphere could lead to turbulence that interferes with VSI (Lin, 2019a; Cui & Bai, 2019). Nelson et al. (2013) found that VSI is prevented when the magnetic accretion-stress-to-pressure ratio is several times . Whether magnetic activity is possible at these locations is worth further investigation.
5 Conclusion
We have examined the implications for protoplanetary disks of the vertical shear instability, using 3D radiation hydrodynamical simulations covering all of azimuth at a high resolution of 70 cells per scale height. Heating by the star’s light and cooling by thermal infrared re-radiation are included. The star and disk have parameters typical for a T Tauri system. Dust particles 0.1 and 1 mm in radius are tracked to examine how the VSI affects their motion.
Our findings for the gas kinematics and structure are the following:
-
•
The vertical shear instability is vigorous beyond 30 au from the star, but nearly absent near the domain’s inner edge at 20 au, where the longer thermal relaxation timescale hinders VSI’s growth. The accretion stress rises from 20 to 30 au, leading to a dip in the gas surface density centered at 35 au, and an associated ring and gap in the distribution of the dust particles.
-
•
The VSI leads to flows whose saturated state yields a stress-to-pressure ratio . The value of rises with radius to a peak near 35 au, and falls only slightly below this peak in the outer disk. The flows are mainly vertical, roughly axisymmetric, and cross the midplane with upward and downward speeds of 50 to 100 m s.
-
•
Rossby wave instability forms a single large vortex on the inner edge of the surface density dip. The vortex persists for the whole remainder of the run and shows no significant net migration. Its azimuthal and radial extent are approximately 40 and 4 au.
-
•
Many smaller vortices are seen by the vortensity maps and through the dust concentrations they produce. The smaller vortices are short-lived, disappearing usually within about one local orbital period.
Our findings for the dust evolution and structure based on the 100 and 1mm particles are as follows:
-
•
The scale height of the mm-size grains subject to the VSI is much larger than inferred from radio continuum observations of the thermal dust emission in protoplanetary disks. In units of the distance to the star, the scale height is 0.034, whereas values of 0.007 were found both in non-ideal MHD simulations (Flock et al., 2017b) and in radiative transfer modeling fit to observations of the HL Tau disk (Pinte et al., 2016).
-
•
The vertical shear instability mixes particles vertically much more strongly than it transfers angular momentum radially. Fitting the grains’ scale height by turbulent diffusion requires a coefficient 27 times greater than expected from the angular momentum transport rate, indicating extreme anisotropy. The mm-size grains’ time- and space-averaged RMS vertical turbulent speed and the eddy timescale is , comparable to the velocity autocorrelation timescale of magneto-rotational turbulence (Turner et al., 2006).
-
•
The RMS turbulent speeds of the 0.1 and 1 mm grains are at least 14 and 12 m s-1. Grains colliding at these speeds would fragment. Whether VSI drives fragmentation in these disks could in principle be determined by combining higher-resolution versions of the simulations with observations to determine the grain sizes present.
-
•
The pressure perturbations by the vertical shear instability reduce the radial drift of particles. The mm-size grains drift radially inwards at speeds of about 20 au per years at distances near 50 au which is only 16% lower than expected in a laminar disk. While drifting, they undergo upward and downward motions induced by the vertical shear instability. Some lucky grains drift more slowly, and some halt their drift when they become trapped inside the large vortex.
The large dust scale height produced by VSI turbulence appears incompatible with the small scale height measured in the HL Tau disk. The VSI’s efficient vertical mixing would lead to the inclined disk’s rings being projected one on top of the next, making the surface brightness profile much smoother than observed (Pinte et al., 2016). Further work is needed to identify the dominant angular transport mechanism, a crucial ingredient for our understanding of gas and dust evolution and planet formation in these disks.
Acknowledgments
We thank Chris Ormel for helpful discussions on the relative velocities between grains. Parallel computations have been performed on the pleiades supercomputer at NASA. This research was carried out in part at the Jet Propulsion Laboratory, California Institute of Technology, under a contract with the National Aeronautics and Space Administration and with the support of the NASA Exoplanet Research program via grant 14XRP14_20153. M. F. has received funding from the European Research Council (ERC) under the European Unions Horizon 2020 research and innovation programme (grant agreement No. 757957). N.J.T. was supported by the NASA Exoplanets Research Program through grant 17XRP17_20081. Richard Nelson acknowledges support from STFC through the grants ST/P000592/1 and ST/M001202/1. This research was supported in part by the National Science Foundation under Grant No. NSF PHY-1125915. Copyright 2017 California Institute of Technology. Government sponsorship acknowledged.
References
- ALMA Partnership et al. (2015) ALMA Partnership, Brogan, C. L., Pérez, L. M., et al. 2015, ApJ, 808, L3, doi: 10.1088/2041-8205/808/1/L3
- Armitage (2019) Armitage, P. J. 2019, Physical Processes in Protoplanetary Disks, ed. M. Audard, M. R. Meyer, & Y. Alibert (Berlin, Heidelberg: Springer Berlin Heidelberg), 1–150, doi: 10.1007/978-3-662-58687-7_1
- Bae et al. (2016) Bae, J., Nelson, R. P., Hartmann, L., & Richard, S. 2016, ApJ, 829, 13, doi: 10.3847/0004-637X/829/1/13
- Barge et al. (2016) Barge, P., Richard, S., & Le Dizès, S. 2016, A&A, 592, A136, doi: 10.1051/0004-6361/201628381
- Cameron & Pine (1973) Cameron, A. G. W., & Pine, M. R. 1973, Icarus, 18, 377, doi: 10.1016/0019-1035(73)90152-8
- Carrasco-González et al. (2019) Carrasco-González, C., Sierra, A., Flock, M., et al. 2019, ApJ, 883, 71, doi: 10.3847/1538-4357/ab3d33
- Chen & Lin (2020) Chen, K., & Lin, M.-K. 2020, arXiv e-prints, arXiv:2002.07188. https://arxiv.org/abs/2002.07188
- Chiang & Goldreich (1997) Chiang, E. I., & Goldreich, P. 1997, ApJ, 490, 368, doi: 10.1086/304869
- Cleeves et al. (2015) Cleeves, L. I., Bergin, E. A., Qi, C., Adams, F. C., & Öberg, K. I. 2015, ApJ, 799, 204, doi: 10.1088/0004-637X/799/2/204
- Cui & Bai (2019) Cui, C., & Bai, X.-N. 2019, arXiv e-prints, arXiv:1912.02941. https://arxiv.org/abs/1912.02941
- Decampli et al. (1978) Decampli, W. M., Cameron, A. G. W., Bodenheimer, P., & Black, D. C. 1978, ApJ, 223, 854, doi: 10.1086/156318
- Dubrulle et al. (1995) Dubrulle, B., Morfill, G., & Sterzik, M. 1995, Icarus, 114, 237, doi: 10.1006/icar.1995.1058
- Dullemond & Dominik (2004) Dullemond, C. P., & Dominik, C. 2004, A&A, 417, 159, doi: 10.1051/0004-6361:20031768
- Dullemond & Penzlin (2018) Dullemond, C. P., & Penzlin, A. B. T. 2018, A&A, 609, A50, doi: 10.1051/0004-6361/201731878
- Flock et al. (2013) Flock, M., Fromang, S., González, M., & Commerçon, B. 2013, A&A, 560, A43, doi: 10.1051/0004-6361/201322451
- Flock et al. (2016) Flock, M., Fromang, S., Turner, N. J., & Benisty, M. 2016, ApJ, 827, 144, doi: 10.3847/0004-637X/827/2/144
- Flock et al. (2017a) —. 2017a, ApJ, 835, 230, doi: 10.3847/1538-4357/835/2/230
- Flock et al. (2017b) Flock, M., Nelson, R. P., Turner, N. J., et al. 2017b, ApJ, 850, 131, doi: 10.3847/1538-4357/aa943f
- Flock et al. (2015) Flock, M., Ruge, J. P., Dzyurkevich, N., et al. 2015, A&A, 574, A68, doi: 10.1051/0004-6361/201424693
- Fricke (1968) Fricke, K. 1968, ZAp, 68, 317
- Fromang & Lesur (2019) Fromang, S., & Lesur, G. 2019, in EAS Publications Series, Vol. 82, EAS Publications Series, 391–413, doi: 10.1051/eas/1982035
- Fromang & Papaloizou (2006) Fromang, S., & Papaloizou, J. 2006, A&A, 452, 751, doi: 10.1051/0004-6361:20054612
- Goldreich & Schubert (1967) Goldreich, P., & Schubert, G. 1967, ApJ, 150, 571, doi: 10.1086/149360
- Gräfe et al. (2013) Gräfe, C., Wolf, S., Guilloteau, S., et al. 2013, A&A, 553, A69, doi: 10.1051/0004-6361/201220720
- Hartmann & Bae (2018) Hartmann, L., & Bae, J. 2018, MNRAS, 474, 88, doi: 10.1093/mnras/stx2775
- Hasegawa et al. (2017) Hasegawa, Y., Okuzumi, S., Flock, M., & Turner, N. J. 2017, ApJ, 845, 31, doi: 10.3847/1538-4357/aa7d55
- Johansen & Klahr (2005) Johansen, A., & Klahr, H. 2005, ApJ, 634, 1353, doi: 10.1086/497118
- Johansen et al. (2015) Johansen, A., Mac Low, M.-M., Lacerda, P., & Bizzarro, M. 2015, Science Advances, 1, 1500109, doi: 10.1126/sciadv.1500109
- Klahr & Hubbard (2014) Klahr, H., & Hubbard, A. 2014, ApJ, 788, 21, doi: 10.1088/0004-637X/788/1/21
- Klahr & Bodenheimer (2003) Klahr, H. H., & Bodenheimer, P. 2003, ApJ, 582, 869, doi: 10.1086/344743
- Krijt et al. (2018) Krijt, S., Schwarz, K. R., Bergin, E. A., & Ciesla, F. J. 2018, ApJ, 864, 78, doi: 10.3847/1538-4357/aad69b
- Latter & Papaloizou (2018) Latter, H. N., & Papaloizou, J. 2018, MNRAS, 474, 3110, doi: 10.1093/mnras/stx3031
- Lesur & Papaloizou (2009) Lesur, G., & Papaloizou, J. C. B. 2009, A&A, 498, 1, doi: 10.1051/0004-6361/200811577
- Lesur & Papaloizou (2010) —. 2010, A&A, 513, A60, doi: 10.1051/0004-6361/200913594
- Lesur & Latter (2016) Lesur, G. R. J., & Latter, H. 2016, MNRAS, 462, 4549, doi: 10.1093/mnras/stw2172
- Levermore & Pomraning (1981) Levermore, C. D., & Pomraning, G. C. 1981, ApJ, 248, 321, doi: 10.1086/159157
- Li et al. (2000) Li, H., Finn, J. M., Lovelace, R. V. E., & Colgate, S. A. 2000, ApJ, 533, 1023, doi: 10.1086/308693
- Lin (2019a) Lin, M.-K. 2019a, MNRAS, 485, 5221, doi: 10.1093/mnras/stz701
- Lin (2019b) —. 2019b, MNRAS, 485, 5221, doi: 10.1093/mnras/stz701
- Lin & Youdin (2015) Lin, M.-K., & Youdin, A. N. 2015, ApJ, 811, 17, doi: 10.1088/0004-637X/811/1/17
- Liu et al. (2012) Liu, Y., Madlener, D., Wolf, S., Wang, H., & Ruge, J. P. 2012, A&A, 546, A7, doi: 10.1051/0004-6361/201219336
- Liu et al. (2017) Liu, Y., Henning, T., Carrasco-González, C., et al. 2017, A&A, 607, A74, doi: 10.1051/0004-6361/201629786
- Lyra (2013) Lyra, W. 2013, in European Physical Journal Web of Conferences, Vol. 46, European Physical Journal Web of Conferences, 04003, doi: 10.1051/epjconf/20134604003
- Lyra (2014) Lyra, W. 2014, ApJ, 789, 77, doi: 10.1088/0004-637X/789/1/77
- Lyra et al. (2009) Lyra, W., Johansen, A., Zsom, A., Klahr, H., & Piskunov, N. 2009, A&A, 497, 869, doi: 10.1051/0004-6361/200811265
- Lyra & Umurhan (2019) Lyra, W., & Umurhan, O. M. 2019, PASP, 131, 072001, doi: 10.1088/1538-3873/aaf5ff
- Madlener et al. (2012) Madlener, D., Wolf, S., Dutrey, A., & Guilloteau, S. 2012, A&A, 543, A81, doi: 10.1051/0004-6361/201117615
- Malygin et al. (2017) Malygin, M. G., Klahr, H., Semenov, D., Henning, T., & Dullemond, C. P. 2017, A&A, 605, A30, doi: 10.1051/0004-6361/201629933
- Manger & Klahr (2018) Manger, N., & Klahr, H. 2018, MNRAS, 480, 2125, doi: 10.1093/mnras/sty1909
- Marcus et al. (2015) Marcus, P. S., Pei, S., Jiang, C.-H., et al. 2015, ApJ, 808, 87, doi: 10.1088/0004-637X/808/1/87
- Marcus et al. (2013) Marcus, P. S., Pei, S., Jiang, C.-H., & Hassanzadeh, P. 2013, Physical Review Letters, 111, 084501, doi: 10.1103/PhysRevLett.111.084501
- Masset (2000) Masset, F. 2000, A&AS, 141, 165, doi: 10.1051/aas:2000116
- Meheut et al. (2013) Meheut, H., Lovelace, R. V. E., & Lai, D. 2013, MNRAS, 430, 1988, doi: 10.1093/mnras/stt022
- Mignone et al. (2007) Mignone, A., Bodo, G., Massaglia, S., et al. 2007, ApJS, 170, 228, doi: 10.1086/513316
- Mignone et al. (2012) Mignone, A., Zanni, C., Tzeferacos, P., et al. 2012, ApJS, 198, 7, doi: 10.1088/0067-0049/198/1/7
- Nelson et al. (2013) Nelson, R. P., Gressel, O., & Umurhan, O. M. 2013, MNRAS, 435, 2610, doi: 10.1093/mnras/stt1475
- Paardekooper et al. (2010) Paardekooper, S.-J., Lesur, G., & Papaloizou, J. C. B. 2010, The Astrophysical Journal, 725, 146, doi: 10.1088/0004-637x/725/1/146
- Papaloizou & Pringle (1984) Papaloizou, J. C. B., & Pringle, J. E. 1984, MNRAS, 208, 721, doi: 10.1093/mnras/208.4.721
- Pfeil & Klahr (2019) Pfeil, T., & Klahr, H. 2019, ApJ, 871, 150, doi: 10.3847/1538-4357/aaf962
- Picogna et al. (2018) Picogna, G., Stoll, M. H. R., & Kley, W. 2018, A&A, 616, A116, doi: 10.1051/0004-6361/201732523
- Pinte et al. (2016) Pinte, C., Dent, W. R. F., Ménard, F., et al. 2016, ApJ, 816, 25, doi: 10.3847/0004-637X/816/1/25
- Richard et al. (2016) Richard, S., Nelson, R. P., & Umurhan, O. M. 2016, MNRAS, 456, 3571, doi: 10.1093/mnras/stv2898
- Sauter et al. (2009) Sauter, J., Wolf, S., Launhardt, R., et al. 2009, A&A, 505, 1167, doi: 10.1051/0004-6361/200912397
- Schäfer et al. (2020) Schäfer, U., Johansen, A., & Banerjee, R. 2020, arXiv e-prints, arXiv:2002.07185. https://arxiv.org/abs/2002.07185
- Schegerer et al. (2009) Schegerer, A. A., Wolf, S., Hummel, C. A., Quanz, S. P., & Richichi, A. 2009, A&A, 502, 367, doi: 10.1051/0004-6361/200810782
- Schegerer et al. (2008) Schegerer, A. A., Wolf, S., Ratzka, T., & Leinert, C. 2008, A&A, 478, 779, doi: 10.1051/0004-6361:20077049
- Schräpler & Henning (2004) Schräpler, R., & Henning, T. 2004, ApJ, 614, 960, doi: 10.1086/423831
- Seligman & Laughlin (2017) Seligman, D., & Laughlin, G. 2017, ApJ, 848, 54, doi: 10.3847/1538-4357/aa8e45
- Stoll & Kley (2014) Stoll, M. H. R., & Kley, W. 2014, A&A, 572, A77, doi: 10.1051/0004-6361/201424114
- Stoll & Kley (2016) —. 2016, A&A, 594, A57, doi: 10.1051/0004-6361/201527716
- Stoll et al. (2017) Stoll, M. H. R., Kley, W., & Picogna, G. 2017, A&A, 599, L6, doi: 10.1051/0004-6361/201630226
- Testi et al. (2014) Testi, L., Birnstiel, T., Ricci, L., et al. 2014, Protostars and Planets VI, 339, doi: 10.2458/azu_uapress_9780816531240-ch015
- Turner et al. (2014) Turner, N. J., Benisty, M., Dullemond, C. P., & Hirose, S. 2014, ApJ, 780, 42, doi: 10.1088/0004-637X/780/1/42
- Turner et al. (2006) Turner, N. J., Willacy, K., Bryden, G., & Yorke, H. W. 2006, ApJ, 639, 1218, doi: 10.1086/499486
- Ueda et al. (2019) Ueda, T., Flock, M., & Okuzumi, S. 2019, ApJ, 871, 10, doi: 10.3847/1538-4357/aaf3a1
- Umurhan et al. (2019) Umurhan, O. M., Estrada, P. R., & Cuzzi, J. N. 2019, arXiv e-prints, arXiv:1906.05371. https://arxiv.org/abs/1906.05371
- Umurhan et al. (2016) Umurhan, O. M., Shariff, K., & Cuzzi, J. N. 2016, ApJ, 830, 95, doi: 10.3847/0004-637X/830/2/95
- Urpin & Brandenburg (1998) Urpin, V., & Brandenburg, A. 1998, MNRAS, 294, 399, doi: 10.1046/j.1365-8711.1998.01118.x
- van Boekel et al. (2017) van Boekel, R., Henning, T., Menu, J., et al. 2017, ApJ, 837, 132, doi: 10.3847/1538-4357/aa5d68
- Wolf et al. (2003) Wolf, S., Padgett, D. L., & Stapelfeldt, K. R. 2003, ApJ, 588, 373, doi: 10.1086/374041
- Wolf et al. (2008) Wolf, S., Schegerer, A., Beuther, H., Padgett, D. L., & Stapelfeldt, K. R. 2008, ApJ, 674, L101, doi: 10.1086/529188
- Yang et al. (2018) Yang, C.-C., Mac Low, M.-M., & Johansen, A. 2018, ApJ, 868, 27, doi: 10.3847/1538-4357/aae7d4
- Yen et al. (2016) Yen, H.-W., Liu, H. B., Gu, P.-G., et al. 2016, ApJ, 820, L25, doi: 10.3847/2041-8205/820/2/L25
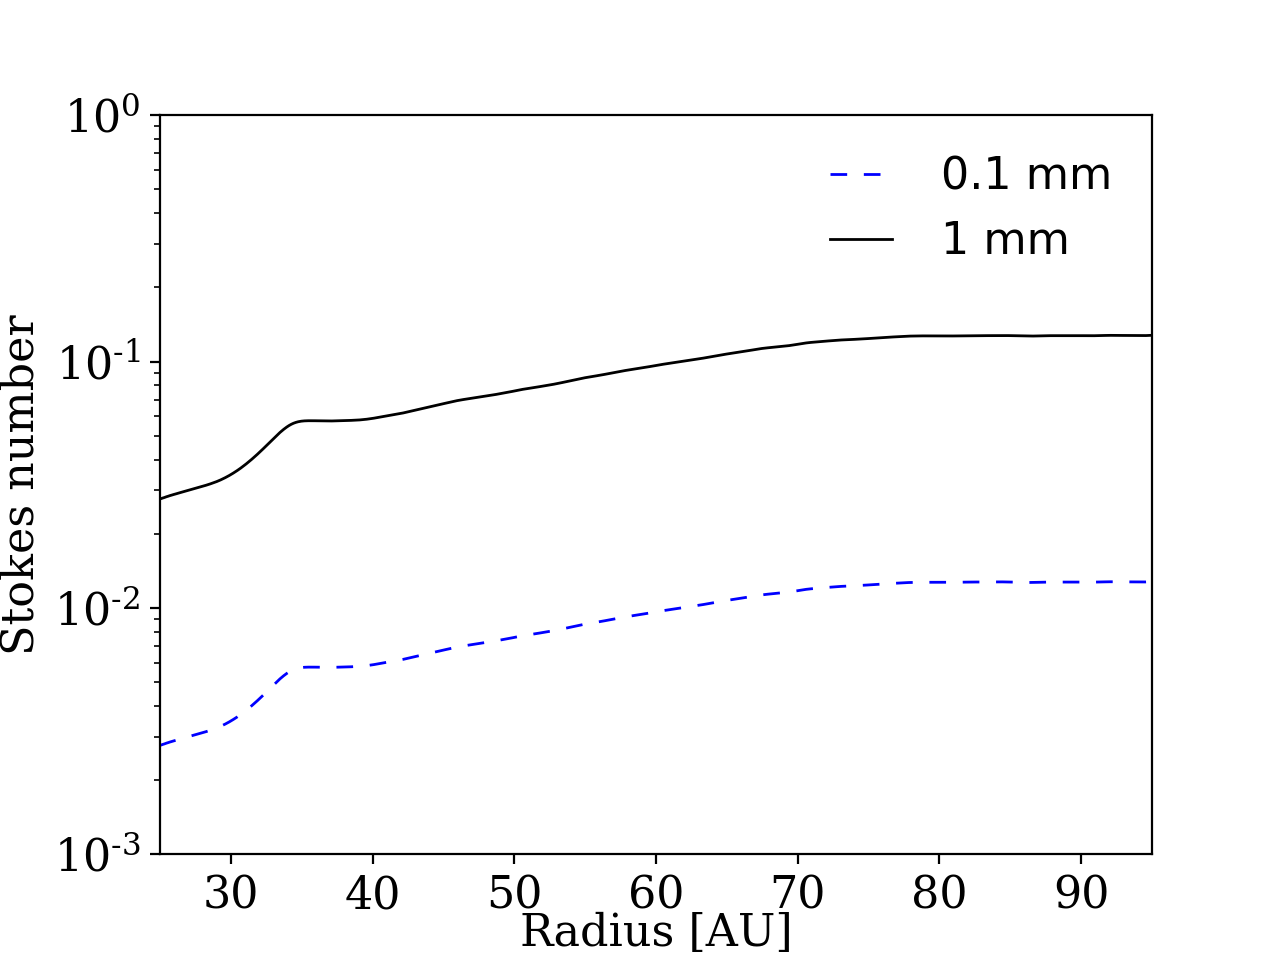
Appendix A Stokes number at the midplane
The Stokes number for the 0.1 and 1 mm grains, calculated at the midplane density, azimuthally averaged, after 300 inner orbits of gas evolution is shown in Fig. 14. The 1 mm grains show midplane Stokes numbers between and while the 0.1 mm grains are one order of magnitude below.
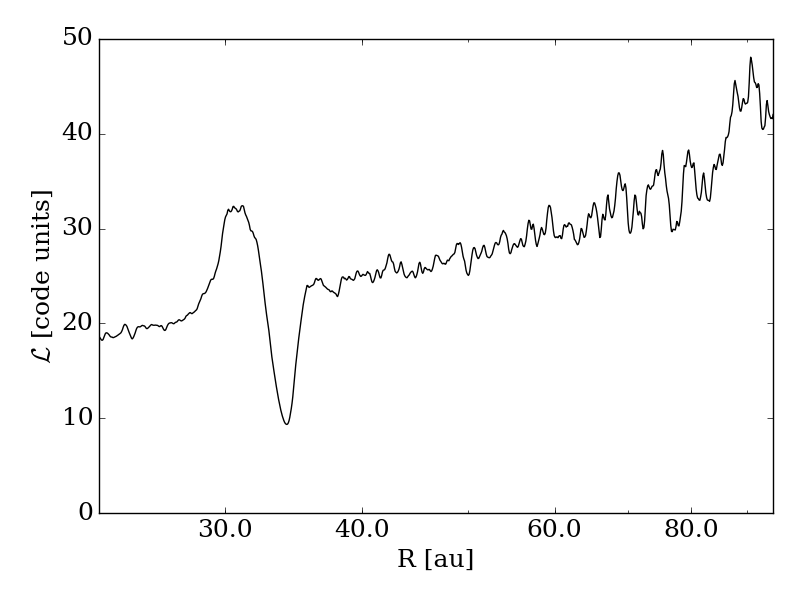
Appendix B Is the vortex caused by the Rossby-Wave-Instability?
Following Li et al. (2000); Lyra et al. (2009); Meheut et al. (2013), a necessary condition for the Rossby-Wave-Instability is an extremum in
| (B1) |
For our 3D model we calculate for the radial profile of at the midplane and averaging over the first 100 inner orbits. The results are shown in Fig. 15. There is a clear peak visible at around 30 au, the position where the vortex is formed.
Appendix C Evolution of short lived vortices
In Fig. 16 we show snapshots of different times for a small vortensity minimum which is formed and decays again after a lifetime of around 1.4 orbits.
Appendix D Fully Edge-On dust comparison
To compare the dust settling for the two grain sizes we show the particle distribution in Fig. 17.
Appendix E Relative velocities between grains
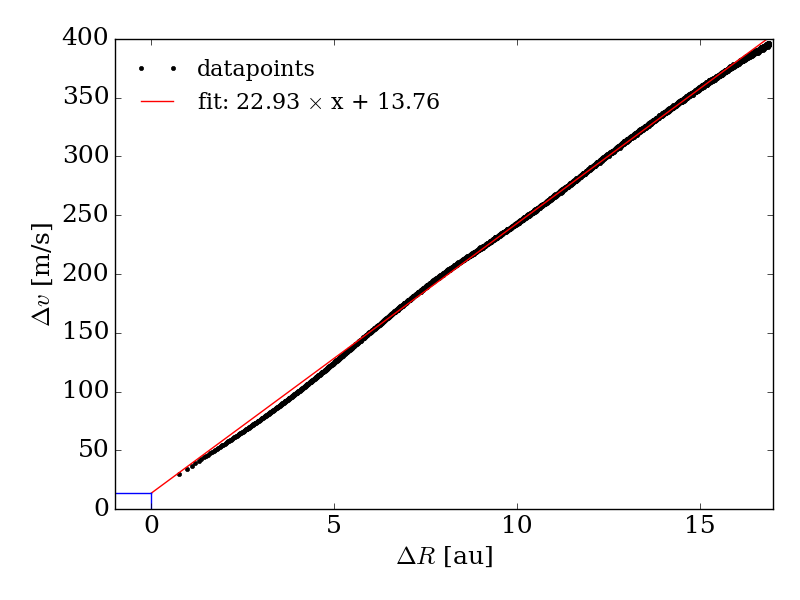
To further investigate the likely outcomes of collisions between grains we determine the relative velocity between the 100 and 1 mm grains. For 100,000 randomly-chosen particles from each size bin we first calculate the mutual distances and relative velocities. The resulting dataset is sorted over distance and then time averaged for each individual particle. The result is shown in Fig. 18 together with a linear fit. At collision the relative speed between the 100 and 1 mm grains is around 13.8 m/s. This value matches very well the estimated turbulent speeds from section 3.6. Such collisions could lead to fragmentation of silicate aggregate grains. However for ice covered grains the fragmentation threshold may be significantly higher, reaching 30 or above (Ueda et al., 2019). We do not resolve the ballistic scale. At 50 au, a grain with a Stokes number of 0.05 and a velocity of 13 m/s will stop in a distance roughly 8 times smaller than our radial grid cell size at 50 au. Resolving the stopping distance might lead to collision speeds low enough for efficient growth of ice coated grains. It is also the case that we do resolve the characteristic length scales of the VSI, including the length scales associated with the coherent up and down motion of the fluid generated by the VSI linear modes, and so the effects of these motions on the relative velocities of the grains is captured by our analysis. Future simulations which resolve the characteristic stopping lengths of the particles will be required to extrapolate the relative velocity versus distance curve with greater confidence.