33email: {weidongjun, liuyaxin, zhufuqing, zangliangjun, zhouwei, husonglin}@iie.ac.cn
33email: yijun.lyj@alibaba-inc.com
AutoSUM: Automating Feature Extraction and Multi-user Preference Simulation for
Entity Summarization
Abstract
With the growth of knowledge graphs, entity descriptions are becoming extremely lengthy. Entity summarization task, aiming to generate diverse, comprehensive and representative summaries for entities, has received an increasing interest recently. In most previous methods, features are usually extracted by the hand-crafted templates. Then the feature selection and multi-user preference simulation take place, depending too much on human expertise. In this paper, a novel integration method called AutoSUM is proposed for automatic feature extraction and multi-user preference simulation to overcome the drawbacks of previous methods. There are two modules in AutoSUM: extractor and simulator. The extractor module operates automatic feature extraction based on a BiLSTM with a combined input representation including word embeddings and graph embeddings. Meanwhile, the simulator module automates multi-user preference simulation based on a well-designed two-phase attention mechanism (i.e., entity-phase attention and user-phase attention). Experimental results demonstrate that AutoSUM produces the state-of-the-art performance on two widely used datasets (i.e., DBpedia and LinkedMDB) in both F-measure and MAP. The source code and outputs are available at https://github.com/WeiDongjunGabriel/AutoSUM.
Keywords:
Entity summarization Feature extraction Preference simulation Attention Mechanism Knowledge graphs1 Introduction
Semantic data enables users or machines to comprehend and manipulate the conveyed information quickly [10]. In major knowledge graphs, semantic data describes entities by Resource Description Framework (RDF) triples, referred as triples [4]. With the growth of knowledge graphs, entity descriptions are becoming extremely lengthy [23]. Since Google first released the knowledge graph, “get the best summary” for entities has been one of the main contributions in Google Search111https://www.google.com [25]. Specifically, Google Search returns a top- subset of triples which can best describe the entity from a query on the right-hand side of the result pages [15]. Motivated by the success of Google Search, entity summarization task has received an increasing interest recently [7, 25], it aims to generate diverse, comprehensive and representative summaries for entities. In addition, entity summarization has been integrated into various applications such as document browsing, Question Answering (QA), etc [15].
Most previous entity summarization methods are adopted from random surfer [4], clustering [9, 10] and Latent Dirichlet Allocation (LDA) [19] models, depending too much on the hand-crafted templates for feature extraction as well as human expertise for feature selection. Meanwhile, entities are capable to represent diverse information (or multi-aspect information) in knowledge graphs [21], resulting in different user preference (sometimes multi-user preference [27]). Take entity Triathlon_ at_the_2000_Summer_Olympics_Men’s in DBpedia222https://wiki.dbpedia.org for instance, different users may prefer to the medal, event or type of this entity, respectively. In order to generate more diverse summaries, the specific model needs to be selected for providing a more distinguishable multi-user preference simulation [9, 21]. However, due to the countless quantities and unpredictable types of entities in real large-scale knowledge graphs, extracting discriminative features or selecting suitable models based on human expertise could be arduous [15].
In this paper, a novel integration method called AutoSUM is proposed for automatic feature extraction and multi-user preference simulation to overcome the drawbacks of above previous models. There are two modules in AutoSUM: extractor and simulator. The extractor module operates automatic feature extraction based on a BiLSTM with a combined input representation including word embeddings and graph embeddings. Meanwhile, the simulator module automates multi-user preference simulation based on a well-designed two-phase attention mechanism (i.e., entity-phase attention and user-phase attention). Experimental results demonstrate that AutoSUM produces the state-of-the-art performance on two widely used datasets (i.e., DBpedia and LinkedMDB 333http://data.linkedmdb.org) in both F-measure and MAP.
2 Related Work
Previous entity summarization methods mainly rely on human expertise. To find the most central triples, RELIN [4] and SUMMARUM [24] compute the relatedness and informativeness based on the features extracted from hand-crafted templates. Meanwhile, FACES [9] and ES-LDA [19] introduce a clustering algorithm and LDA model for capturing multi-aspect information, respectively. In order to generate more diverse summaries, the specific models need to be selected for providing a more distinguishable multi-user preference simulation [9, 19]. However, due to the countless quantities and unpredictable types of entities in the real large-scale knowledge graphs, extracting discriminative features and selecting suitable models based on human expertise could be arduous.
Recently, deep learning methods relieve the dependency on human expertise in Natural Language Processing (NLP) [17] community. To generate the summaries without human expertise, an entity summarization method with a single-layer attention (ESA) [29] is proposed to calculate the attention score for each triple. Then top- triples which have the highest attention scores are selected as the final results. However, ESA cannot extract features and capture multi-aspect information with the single-layer attention mechanism. Following ESA work, our proposed AutoSUM automates feature extraction and multi-user preference based on a novel extractor-simulator structure. In extractor, a BiLSTM with a combined input representation is utilized for feature extraction. The word embeddings and graph embeddings are included. Meanwhile, in simulator, a two-phase attention mechanism is designed for multi-user preference simulation.
3 Proposed Model
3.1 Problem Description
An RDF triple is composed of a subject, a predicate, and an object. In major knowledge graphs, an entity of which is then defined as a subject with all predicates and corresponding objects to those predicates. When a user queries an entity in a knowledge graph, a set of triples related with the entity will be returned, referred as an entity description document , where is the -th triple in . Following Google Search [15, 7], given a positive integer , the summary of an entity is a top- subset of which can best describe the entity.
3.2 Overview
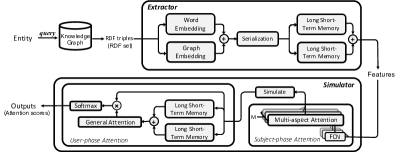
As shown in Figure 1, AutoSUM has a novel extractor-simulator structure. The extractor extracts the features of triples in as , where is the feature vector of . Given , the simulator calculates the attention scores , where is the attention score of . Then top- triples with the highest attention scores will be selected as the summary of an entity.
3.3 Extractor
The extractor module in AutoSUM aims at extracting features of triples automatically. In this section, we introduce the input representation and the automatic feature extraction in details.
3.3.1 Input Representation
As discussed above, the triples related with an entity share the same subject with different predicates and corresponding objects to those predicates. In order to map predicates and objects into a continuous vector space for feature extraction, we apply a combined input representation method including word embeddings and graph embeddings. Then we concatenate the embeddings of the predicates and corresponding objects as the representation for each triple.
Word Embedding: Learning word embeddings has been an effective method to enhance the performance of entity sumamrizers. In ES-LDAext [20], Pouriyeh et al. stated the key point of learning word embeddings was the definition for “words”. Following Pouriyeh’s work, we extract predicates and objects of triples as our words. Take “http://dbpedia.org/ontology/goldMedalist” for instance, we extract “goldMedalist” as the word for the above predicate. Given the embeddings of words, we then initialize a word embedding (lookup) table for future training.
Graph Embedding: Obviously, simple word embeddings cannot represent triples with a graph structure. To fully encode the graph information, we utilize a graph embedding technique called TransE [3] to pretrain the whole knowledge graph in the dataset. Given the embeddings of tirples, we then initialize a graph embedding table for future training.
3.3.2 Automatic Feature Extraction
In Named Entity Recognition (NER) task, the bidirectional LSTM (BiLSTM) has been widely used for automatic feature extraction [14]. For instance, in order to automatically extract features from a small and supervised training corpus, an LSTM-CRF model was proposed by Lample et al. [14], utilizing a BiLSTM for feature extraction and conditional random fields [13] for entity recognition. The BiLSTM extracted representative and contextual features of a word, aligning with other words in the same sentence [8]. As for summarizing entities, we also apply a BiLSTM to extract features of a triple, aligning with other triples related with the same entity. Specifically, due to the uncertain timing sequence of triples, we first map (serialize) the triples into a sequence comes randomly. Then we feed the input representation of triples in the sequence to the BiLSTM, and take the outputs as the extracted features for those triples.
3.4 Simulator
The simulator in AutoSUM aims at simulating multi-user preference based on a well-designed two-phase attention mechanism (i.e., entity-phase attention and user-phase attention). Entity-phase attention captures multi-aspect information from an entity, user-phase attention then simulates multi-user preference based on the captured information. In this section, we present the details of entity-phase attention and user-phase attention.
3.4.1 Entity-Phase Attention
The intuition of entity-phase attention is straightforward. Since the single-layer attention mechanism in ESA [29] cannot capture multi-aspect information, we then design a multi-aspect attention mechanism with multiple (stacked) attention layers to overcome the drawback of ESA. One seminal work using stacked attention layers is neural machine translation (NMT) [17], where the stacked attention layers (Transformer) [26] are utilized to capture the multi-aspect information from a sentence. To our knowledge, we are the first to utilize the stacked attention layers to capture the multi-aspect information from an entity. Specifically, different attention layers capture information from an entity in different aspects. In each attention layer, a general attention function [17] is utilized to calculate the relevance between each triple and the information captured from the attention layer, termed attention scores. Here, instead of combining all attention layers to generate overall attention scores of Transformer [26], we directly output the attention scores from each attention layer for multi-user preference simulation in user-phase attention. Notice that the number of the attention layers is a hyper-parameter which can be tuned during training.
3.4.2 User-Phase Attention
When users browse triples, they will allocate high preference values (more attention) to triples which are more related with the information they are interested in [9]. Meanwhile, as described above, entity-phase attention consists of different attention layers for capturing information in different aspects. In each attention layer, a general attention function is utilized to allocate higher attention scores to the triples which are more relevant to the information captured from the attention layer. To simulate the preference of users who are interested in the information captured by the current attention layer, user-phase attention assigns the user preference values of each triple with the same attention scores from the attention layer. Then different distributions of attention scores in different attention layers simulate the different preference of different users (multi-user preference).
After simulating the multi-user preference, we have to allocate different attention scores for different user preference rather than treating them equally. The main reason is that some user preference may represent the preference of most users for an entity, while others may represent the preference of few users for the same entity. Allocating proper attention scores for each user preference is critical to generate a more comprehensive entity summarization result. Therefore, we combine a BiLSTM with a general attention score function for allocation. In NER, a BiLSTM can maintain the independence and capture the intrinsic relationships among words [8]. Similarly, a BiLSTM is adopted in user-phase attention to preserve independence as well as capture the intrinsic relationships between different user preference. Then the outputs of the BiLSTM are taken as the inputs to a general attention score function, in order to allocate attention scores for each user preference. At last, we integrate all the user preference based on the allocated attention scores. In addition, due to the uncertain order in user preference like triples, we also randomly map the user preference into a sequence as our input of the BiLSTM.
3.5 The Complete Pipeline
In this section, we demonstrate the complete pipeline of AutoSUM. As described in Section 3.1, the input of AutoSUM is an entity description document . Here, is the -th triple in , which is composed of a same subject , a predicate and an object . Given , we first split into a predicate set and an object set , respectively. Given and , we combine word embeddings and graph embeddings to map and into a continuous vector space and concatenate them as , recursively. Given , we randomly map into a sequence . Then we apply a BiLSTM to extract the features vector of as follows,
| (1) |
where and are the final hidden states in forward and backward LSTM networks. Given and , we utilize the multi-aspect attention mechanism to capture multi-aspect information. Specifically, for the -th attention layer in multi-aspect attention mechanism, we calculate the attention score for triple with a general score attention function as follows,
| (2) |
where is a parameter matrix of the general attention score function in the -th attention layer, and is the number of attention layers in the multi-aspect attention mechanism. Given , we then simulate the preference of the -th user who is interested in the information of triple captured by the -th attention layer as follows,
| (3) |
where is the preference value allocated to triple by . Given { }, we randomly map into a sequence and utilize a BiLSTM to encode into as follows,
| (4) |
where and are the final hidden states from forward and backward LSTM networks. Then we calculate the attention score for user preference as follows,
| (5) |
where is a parameter matrix of the general attention score function. Having obtained , we integrate different user preference to generate the final attention score for each triple in as follows,
| (6) |
Finally, we employ cross-entropy loss and define the loss function for AutoSUM,
| (7) |
Here, is a gold(real) attention score vector associated with above entity from ESBM dataset. Specifically, we count the frequency of the -th triple selected by users in ESBM dataset following ESA work, denoted as . Then the gold attention score of is formulated as follows,
| (8) |
4 Experiments
4.1 Experimental Setup
4.1.1 Dataset
In this paper, we utilize ESBM dataset v1.1, which consists of k triples related with entities from DBpedia [2] and k triples related with entities from LinkedMDB [5]. Given an entity, ESBM asks different users to select top- and top- triples which can best describe the entity. In addition, ESBM provides an evaluator for the comparison of different entity summarization methods. Both datasets and evaluator can be accessed from the ESBM website444http://ws.nju.edu.cn/summarization/esbm/.
4.1.2 Baselines
Our baselines consist of some existing state-of-the-art entity summarization methods, including RELIN [4], DIVERSUM [21], CD [30], FACES [9], LinkSUM [23], MPSUM [28] and ESA [29]. MPSUM 555https://github.com/WeiDongjunGabriel/MPSUM is an open source implementation of ES-LDA. To provide ablation studies, we also modify the original AutoSUM into different versions, denoted as AutoSUM1∼5, which will be futher illustrated in Section 4.3.
4.1.3 Evaluation Methodology
Summarization tasks can be mainly divided into extractive and non-extractive tasks [16, 1], which orient to unstructured and structured data, respectively. Sydow et al. [22] stated that entity summarization task could be treated as an extractive task of information retrieval (IR). IR returns the most relevant documents for a query, while entity summarization selects the top- triples related with an entity. Following previous work, we utilize F-measure and mean average precision (MAP) metrics for evaluation, which are two standard evaluation metrics in IR [12, 15]. F-measure is the harmonic mean of recall and precision, and MAP is the mean average of precision. Meanwhile, given the limited number of entities in ESBM, we conduct -fold cross-validation to reduce the risk of overfitting without losing the number of learning instances [11]. Specifically, the entities in ESBM are divided into folds randomly. The parameters for each model are tuned on -of- folds. The final fold in each case is utilized to evaluate the optimal parameters. Since ESA has significantly better than all other state-of-the-art methods in our baselines, we then compare the statistical significance among ESA and AutoSUMs (i.e., the original AutoSUM and the modified AutoSUM1∼5, respectively) utilizing Student’s paired t-test (p-value ) [12].
4.1.4 Experimental Details
For experimental details, we tune the parameters on a validation set (i.e., a part of the training set). Specifically, to learn graph embeddings, we utilize TransE to pretrain the whole ESBM dataset. Here, the dimension of each triple is set to . As for word embeddings, we initialize the lookup table randomly, where the dimension of each word is set to . Then we apply a BiLSTM with a single layer in each LSTM cell for feature extraction, where the number of the layers in multi-aspect mechanism is set to . In addition, the graph embedding of each triple is fixed after pretraining, while all other parameters in AutoSUM are initialized randomly and tuned without weight sharing. We train the AutoSUM model for epochs, and report the results of the best epoch under early stopping.
| Model | DBpedia | LinkedMDB | ALL | ||||||
| k = 5 | k = 10 | k = 5 | k = 10 | k = 5 | k = 10 | min | max | avg | |
| RELIN | 0.242 | 0.455 | 0.203 | 0.258 | 0.231 | 0.399 | 25 | 118 | 72 |
| DIVERSUM | 0.249 | 0.507 | 0.207 | 0.358 | 0.237 | 0.464 | 12 | 114 | 54 |
| CD | 0.287 | 0.517 | 0.211 | 0.328 | 0.252 | 0.455 | 10 | 110 | 52 |
| FACES | 0.270 | 0.428 | 0.169 | 0.263 | 0.241 | 0.381 | 23 | 162 | 73 |
| FACES-E | 0.280 | 0.488 | 0.313 | 0.393 | 0.289 | 0.461 | 17 | 48 | 38 |
| LINKSUM | 0.274 | 0.479 | 0.140 | 0.279 | 0.236 | 0.421 | 18 | 216 | 80 |
| MPSUM | 0.289 | 0.510 | 0.270 | 0.380 | 0.301 | 0.479 | 11 | 64 | 35 |
| ESA | 0.310 | 0.525 | 0.320 | 0.403 | 0.312 | 0.491 | 8 | 38 | 26 |
| AutoSUM | 0.387+ | 0.569+ | 0.443+ | 0.556+ | 0.403+ | 0.565+ | - | - | - |
| AutoSUM1 | 0.303- | 0.425- | 0.316 | 0.442- | 0.290- | 0.462- | 22 | 40 | 31 |
| AutoSUM2 | 0.316+ | 0.538 | 0.375+ | 0.463- | 0.333- | 0.517+ | 6 | 22 | 16 |
| AutoSUM3 | 0.221- | 0.390- | 0.330+ | 0.406- | 0.252- | 0.394- | 34 | 75 | 49 |
| AutoSUM4 | 0.254- | 0.417- | 0.309 | 0.394- | 0.270- | 0.411- | 36 | 52 | 43 |
| AutoSUM5 | 0.325+ | 0.532+ | 0.343- | 0.413+ | 0.323 | 0.502+ | 7 | 35 | 21 |
4.2 Experimental Results
As shown in Table 1 and 2, AutoSUM is significantly better than some existing state-of-art methods in our baselines.
Comparison with Traditional Methods: Compared with traditional methods depending on manual feature extraction and multi-user preference simulation, AutoSUM automates the above processes without any human expertise effectively. The average improvement of AutoSUM over the best outperforming traditional methods is and , in terms of F-measure and MAP, respectively.
| Model | DBpedia | LinkedMDB | ALL | ||||||
| k = 5 | k = 10 | k = 5 | k = 10 | k = 5 | k = 10 | min | max | avg | |
| RELIN | 0.342 | 0.519 | 0.241 | 0.335 | 0.313 | 0.466 | 25 | 115 | 55 |
| DIVERSUM | 0.310 | 0.499 | 0.266 | 0.390 | 0.298 | 0.468 | 30 | 94 | 53 |
| CD | - | - | - | - | - | - | - | - | - |
| FACES | 0.255 | 0.382 | 0.155 | 0.273 | 0.227 | 0.351 | 69 | 234 | 114 |
| FACES-E | 0.388 | 0.564 | 0.341 | 0.435 | 0.375 | 0.527 | 15 | 64 | 36 |
| LinkSUM | 0.242 | 0.271 | 0.141 | 0.279 | 0.213 | 0.345 | 68 | 267 | 132 |
| MPSUM | 0.386 | 0.568 | 0.351 | 0.435 | 0.349 | 0.532 | 14 | 47 | 30 |
| ESA | 0.392 | 0.582 | 0.367 | 0.465 | 0.386 | 0.549 | 11 | 41 | 23 |
| AutoSUM | 0.459+ | 0.647+ | 0.517+ | 0.600+ | 0.476+ | 0.633+ | - | - | - |
| AutoSUM1 | 0.419- | 0.508- | 0.420+ | 0.522+ | 0.389- | 0.563 | 10 | 27 | 18 |
| AutoSUM2 | 0.404 | 0.598- | 0.431+ | 0.525+ | 0.412- | 0.578+ | 8 | 20 | 14 |
| AutoSUM3 | 0.291- | 0.456- | 0.383+ | 0.488+ | 0.317- | 0.465- | 23 | 58 | 41 |
| AutoSUM4 | 0.333- | 0.486- | 0.376- | 0.467 | 0.346- | 0.480- | 28 | 38 | 34 |
| AutoSUM5 | 0.405+ | 0.582 | 0.368 | 0.473 | 0.412+ | 0.550 | 11 | 40 | 21 |
Comparison with Deep Learning Methods: Compared with ESA, which calculates attention scores without feature extraction and multi-user preference, AutoSUM achieves the state-of-the-art performance. The average improvement of AutoSUM over ESA is and , in terms of F-measure and MAP, respectively.
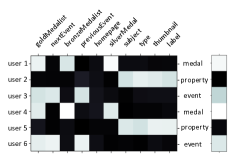
In addition, we track the attention scores of entity Triathlon (Triathlon_at_ the_ 2000_Summer_Olympics_Men’s) in user-phase attention, as shown in Figure 2. We can observe that the user-phase attention simulates groups of user preference of the entity, and the entity-phase attention allocates high attention scores to users who prefer medal as well as event than property, which is in accordance with the preference of most users in real world.
4.3 Ablation Studies
In this section, we provide ablation studies to demonstrate the effectiveness of the primary modules in AutoSUM.
AutoSUM1: To evaluate the features extracted by AutoSUM, AutoSUM1 removes the BiLSTM in extractor and feeds the input representation of triples into simulator directly. Experimental results show the original AutoSUM is significantly better than AutoSUM1, proving that the BiLSTM extracts high-quality features for user-preference simulation.
AutoSUM2 and AutoSUM4: To explore whether the attention scores of different user preference are appropriate, AutoSUM2 removes the BiLSTM in simulator and allocates equal attention scores for each user preference. Meanwhile, we also attempt to replace the BiLSTM with an FCN, referred as Auto-SUM4. As shown in Table 1 and 2, the original AutoSUM gains a significant improvement over AutoSUM2 and AutoSUM4, indicating the BiLSTM with a general attention function allocates appropriate attention scores for each user preference. In addition, we can observe that the performance of FCN (AutoSUM2) is even worse than allocating equal attention scores (AutoSUM4) in our experiments.
AutoSUM3: For comparison, AutoSUM4 removes the BiLSTM in both extractor and simulator. Experimental results show that the performance of Auto-SUM3 is worse than AutoSUM1 and AutoSUM2, which remove the BiLSTM in extractor and simulator respectively, further proving the irreplaceable role of BiLSTM in AutoSUM.
AutoSUM5 To explore whether the multi-aspect mechanism captures the multi-aspect information from an entity, we replace the multi-aspect mechanism with a single-aspect mechanism, i.e., setting the number of attention layers to . As shown in Table 1 and 2, we can observe that the original AutoSUM outperforms AutoSUM5 in both F-measure and MAP. Experimental results indicate that the multi-aspect attention mechanism successfully captures the multi-aspect information. We also notice that AutoSUM5 with a single-layer attention mechanism still outperforms all other methods in our baselines including ESA.
5 Conclusion
In this paper, we propose a novel integration model called AutoSUM to automate feature extraction and multi-user preference simulation for entity summarization. The performance of our proposed AutoSUM is significantly better than other state-of-the-art methods in both F-measure and MAP. Meanwhile, sufficient ablation studies are provided to demonstrate the effectiveness of each module in AutoSUM. In the future, we expect to expand the ESBM dataset and introduce the notion of AutoSUM into other applications such as recommender systems [6, 18].
Acknowledgment
This research is supported in part by the Beijing Municipal Science and Technology Project under Grant Z191100007119008.
References
- [1] Ahmed, M.: Data summarization: a survey. Knowledge and Information Systems (2019)
- [2] Bizer, C., Lehmann, J., Kobilarov, G., Auer, S., Becker, C., Cyganiak, R., Hellmann, S.: Dbpedia - a crystallization point for the web of data. J. Web Semant. 7, 154–165 (2009)
- [3] Bordes, A., Usunier, N., Garcia-Duran, A., Weston, J., Yakhnenko, O.: Translating embeddings for modeling multi-relational data. In: Advances in Neural Information Processing Systems. pp. 2787–2795 (2013)
- [4] Cheng, G., Tran, T.Q., Qu, Y.: Relin: Relatedness and informativeness-based centrality for entity summarization. In: ISWC (2011)
- [5] Consens, M.P.: Managing linked data on the web: The linkedmdb showcase. 2008 Latin American Web Conference pp. 1–2 (2008)
- [6] Doan, K.D., Yang, G., Reddy, C.K.: An attentive spatio-temporal neural model for successive point of interest recommendation. In: PAKDD (2019)
- [7] G.O.Blog: Introducing the knowledge graph: Things, not strings
- [8] Graves, A.: Generating sequences with recurrent neural networks. ArXiv abs/1308.0850 (2013)
- [9] Gunaratna, K., Thirunarayan, K., Sheth, A.P.: Faces: Diversity-aware entity summarization using incremental hierarchical conceptual clustering. In: AAAI (2015)
- [10] Gunaratna, K., Thirunarayan, K., Sheth, A.P., Cheng, G.: Gleaning types for literals in rdf triples with application to entity summarization. In: ESWC (2016)
- [11] Guo, J., Fan, Y., Ai, Q., Croft, W.B.: A deep relevance matching model for ad-hoc retrieval. In: CIKM (2016)
- [12] Hripcsak, G., Rothschild, A.S.: Technical brief: Agreement, the f-measure, and reliability in information retrieval. Journal of the American Medical Informatics Association : JAMIA (2005)
- [13] Lafferty, J.D., McCallum, A., Pereira, F.: Conditional random fields: Probabilistic models for segmenting and labeling sequence data. In: ICML (2001)
- [14] Lample, G., Ballesteros, M., Subramanian, S., Kawakami, K., Dyer, C.: Neural architectures for named entity recognition (2016)
- [15] Liu, Q., Cheng, G., Gunaratna, K., Qu, Y.: Entity summarization: State of the art and future challenges. ArXiv abs/1910.08252 (2019)
- [16] Liu, Y., Safavi, T., Dighe, A., Koutra, D.: Graph summarization methods and applications: A survey. ACM Computing Surveys (CSUR) (2018)
- [17] Luong, T., Pham, H., Manning, C.D.: Effective approaches to attention-based neural machine translation. In: EMNLP (2015)
- [18] Pang, B., Yang, M., Wang, C.: A novel top-n recommendation approach based on conditional variational auto-encoder. In: PAKDD. pp. 357–368. Springer (2019)
- [19] Pouriyeh, S.A., Allahyari, M., Kochut, K.J., Cheng, G., Arabnia, H.R.: Es-lda: Entity summarization using knowledge-based topic modeling. In: IJCNLP (2017)
- [20] Pouriyeh, S.A., Allahyari, M., Kochut, K.J., Cheng, G., Arabnia, H.R.: Combining word embedding and knowledge-based topic modeling for entity summarization. ICSC pp. 252–255 (2018)
- [21] Sydow, M., Pikula, M., Schenkel, R.: Diversum: Towards diversified summarisation of entities in knowledge graphs. ICDEW pp. 221–226 (2010)
- [22] Sydow, M., Pikula, M., Schenkel, R.: The notion of diversity in graphical entity summarisation on semantic knowledge graphs. Journal of Intelligent Information Systems 41, 109–149 (2013)
- [23] Thalhammer, A., Lasierra, N., Rettinger, A.: Linksum: Using link analysis to summarize entity data. In: ICWE (2016)
- [24] Thalhammer, A., Rettinger, A.: Browsing dbpedia entities with summaries. In: ESWC (2014)
- [25] Thoma, S., Thalhammer, A., Harth, A., Studer, R.: Fuse: Entity-centric data fusion on linked data. ACM Trans. Web 13(2), 8:1–8:36 (2019)
- [26] Vaswani, A., Shazeer, N., Parmar, N., Uszkoreit, J., Jones, L., Gomez, A.N., Kaiser, L., Polosukhin, I.: Attention is all you need. In: NIPS (2017)
- [27] Wang, W., Zheng, H.T., Liu, H.: User preference-aware review generation. In: Pacific-Asia Conference on Knowledge Discovery and Data Mining. pp. 225–236. Springer (2019)
- [28] Wei, D., Gao, S., Liu, Y., Liu, Z., Huang, L.: Mpsum: Entity summarization with predicate-based matching. In: EYRE@CIKM (2018)
- [29] Wei, D., Liu, Y., Zhu, F., Zang, L., Zhou, W., Han, J., Hu, S.: Esa: Entity summarization with attention. In: EYRE@CIKM (2019)
- [30] Xu, D., Zheng, L., Qu, Y.: Generating characteristic and diverse entity summaries. In: SumPr@ESWC (2016)