Descendant of the X-ogen carrier and a “mass of 69”:
Infrared action spectroscopic detection of HC3O+ and HC3S+ ††thanks: This article has been accepted for publication in “Molecular Physics”, published by Taylor and Francis
Abstract
The carbon chain ions \ceHC3O+ and \ceHC3S+ – longer variants of the famous “X-ogen” line carrier \ceHCO+ - have been observed for the first time using two cryogenic 22-pole ion trap apparatus (FELion, Coltrap) and two different light sources: the Free Electron Laser for Infrared eXperiments (FELIX), which was operated between 500 and 2500 cm-1, and an optical parametric oscillator operating near 3200 cm-1; signals from both experiments were detected by infrared predissociation action spectroscopy. The majority of vibrational fundamentals were observed for both ions and their vibrational wavenumbers compare very favorably with results from high-level anharmonic force field calculations performed here at the coupled-cluster level of theory. As the action spectroscopic scheme probes the Ne-tagged weakly bound variants, NeHC3O+ and NeHC3S+, corresponding calculations of these systems were also performed. Differences in the structures and molecular force fields between the bare ions and their Ne-tagged complexes are found to be very small.
keywords:
ion traps, action spectroscopy, vibrational spectroscopy, \ceHC3O+, \ceHC3S+1 Introduction
Acylium ions, RCO+, play a vital role as reaction intermediates in preparatory organic synthesis, most notably as electrophiles in coupling reactions such as the Friedel-Crafts acylation [see, e.g., Ref. 1]. These ions and their sulfur analogs, RCS+, have also been invoked in astrochemical reaction networks to account for the production of (carbon-rich) cumulenic chains via very fast dissociative recombination (DR) with free electrons [e.g., Ref. 2]
| (1) |
The astronomical identification of \ceC3O and \ceC3S, both products of reaction (1), nearly 35 years ago [3, 4] points to the importance of the parent ions in chemical networks of dark molecular clouds.
The prototypical acylium — formylium ion, \ceHCO+ — was the first polyatomic ion detected in space, although its identity was originally a mystery when a strong line at 89.2 GHz was observed towards several astronomical objects; for lack of a better name, the line was dubbed “X-ogen” [5] (“extraterrestrial origin”). However, it was not until the pure rotational spectrum of this ion was measured by Woods and co-workers a few years later [6] that the carrier of the astronomical line was established with certainty, and in doing so the bold prediction of Klemperer was confirmed [7]. Similarly, \ceHCS+ was first detected in space [8] almost simultaneously with a report of its high-resolution laboratory spectrum [9]. Since then, \ceHCO+ and \ceHCS+ have been the subjects of a number of high-resolution spectroscopic investigations [10, 11, 12, 13, 14, 15, 16].
While many mass spectrometric studies involving acylium and thioacylium ions have been reported [see, e.g., Refs. 17, 18, 19, 20, 21, 22, 23], gas-phase spectroscopic investigations beyond the simplest members of each family, \ceHCO+ and \ceHCS+, are scarce. Thioacylium species appear to have only been studied using mass spectrometry while gas-phase spectroscopy of acylium ions is limited to only a few species. The acetyl cation, \ceCH3CO+, for example, has been studied in a free-jet expansion source by infrared (IR) photodissociation of its van der Waals complex \ceCH3CO+Ar [24]. An electronic spectrum of \ceHC7O+ in the gas-phase and trapped in an inert gas matrix has also been obtained [25]. Very recently, IR photodissociation spectra of \ceHC_nO+CO complexes ( 512) have been reported in the 1600 to 3500 \cecm^-1 region [26, 27].
This paper reports the first spectroscopic observations of the HC3O+ and HC3S+ ions. Experimental measurements were performed at IR wavelengths by making use of sensitive action spectroscopic techniques in combination with modern ion traps. Spectroscopic assignment was based on high-level quantum-chemical calculations performed at the CCSD(T) level of theory [28], in conjunction with the experimental work.
2 Experiment
Experimental characterization of HC3O+ and HC3S+ in the wavenumber range from 500 to 2500 cm-1 was performed in the cryogenic 22-pole ion trap apparatus FELion connected to the Free Electron Laser for Infrared eXperiments, FELIX [29], located at Radboud University (Nijmegen, The Netherlands). The FELion apparatus has been described in detail recently [30]. Briefly, primary ions are produced using electron impact ionization of suitable precursor compounds and electron energies of a few tens of eV and source pressures in the mbar regime are common. Subsequent reactions in the storage ion source may lead to the formation of secondary ions. A pulse of ions is then extracted from the source into a first quadrupole mass filter to select the ion mass of interest, . These ions are then guided into a 22-pole ion trap [31] where they collide with a bath of rare gas (rg, typically Ne or He) provided as an intense pulse at the beginning of the trapping cycle. Collisions with rg atoms inside the trap cool the ions both kinetically and internally. Provided the temperature is sufficiently low, of order a few K, van der Waals clusters of ions and the rg will form by three-body collisions. Using a second mass filter stage connected to the exit of the 22-pole ion trap, the ions and their complexes can be mass filtered and detected using a very sensitive Daly type detector after a selected storage time. In the absence of any chemical reactions in the trap, the ion distribution exiting the trap includes the bare ion , with smaller amounts of weakly bound van der Waals clusters of the ion with one or more rg atoms, rgn [32, 33]. In the infrared predissociation (IRPD) action spectroscopy scheme employed here, the number of singly tagged rg cluster ions is constantly monitored while the FELIX (FEL-2) IR radiation traversing the ion trap is tuned in wavenumber. When a vibrational mode of the cluster and the radiation source are coincident in wavenumber, dissociation of the cluster occurs, resulting in depletion in the rg counts at the detector. Since the weakly bound rare gases He or Ne generally only slightly perturb the structure of the ion, the IRPD spectrum is highly representative of the nascent ion. Using FELion in combination with FELIX, the IRPD approach has been used successfully in recent years to infer infrared spectra for many fundamental ions [34, 30, 35, 36].
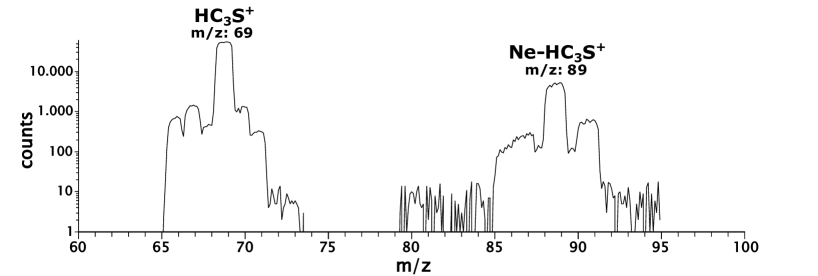
The results presented here were obtained during two independent observing campaigns, carried out at the FELIX laboratory in 2016 (HC3O+) and 2018 (HC3S+). Target ions were produced through electron impact ionization of simple commercially available precursors. HC3O+ was produced via dissociative ionization of propargyl alcohol (HCCCH2OH, Sigma-Aldrich) and HC3S+ from ionization and secondary reactions of a mixture of acetylene and \ceCS2. Following mass selection in the first quadrupole stage, HC3O+ () or HC3S+ () were introduced into a cold 3:1 mixture of He:Ne in the ion trap which was maintained at a nominal temperature of about 8 K. Typical mass spectra obtained from acetylene/\ceCS2-mixtures are shown in Fig. 1 (top, without storing in the ion trap). Per filling cycle of the ion trap, some 1000 NeHC3O+ and 5000 NeHC3S+ ions were obtained (Fig. 1, bottom). Typical trapping times were 2.5 to 3.5 s, and irradiation (per filling cycle) was performed with FELIX macropulses (10 Hz), typical pulse energies of a few up to a few tens of mJ and a Fourier-limited FWHM bandwidth of %. Action spectroscopy was then performed by tuning the wavenumber of FELIX light source while monitoring counts of the corresponding Ne-complexes of both ions (NeHC3O+, ; NeHC3S+, ). The depletion signal is power normalized prior to averaging over multiple individual scans.
To access the C–H stretching mode of HC3O+ in the 3 m region, a table-top pulsed optical parametric oscillator/amplifier (OPO/OPA, Laser Vision) has been used in combination with the cryogenic 22-pole trapping instrument COLTRAP [37] in the Cologne laboratory. The OPO/OPA system is pumped with a pulsed 1064 nm Nd:YAG laser operating at a repetition rate of 10 Hz and maximum pulse energies of up to 600 mJ. This system has been operated in an unseeded mode with a linewidth of about cm-1 (seeded operation allows a linewidth of well below cm-1) and pulse energies of up to 20 mJ in the infrared range. The IR laser wavelength is calibrated with a wavemeter (HighFinesse model WS-5).

3 Quantum-chemical calculations
Several computational investigations of HC3O+ [38, 39, 40, 22] at various levels of theory have been reported previously in the literature, while for structural parameters of HC3S+ only results at the Hartree-Fock level [41, 20] were found. In the present study, consistently for all species under study, quantum-chemical calculations have been performed at the coupled-cluster singles and doubles (CCSD) level augmented by a perturbative treatment of triple excitations (CCSD(T)) [28] together with correlation consistent (augmented) polarized valence and (augmented) polarized weighted core-valence basis sets, i.e. cc-pVZ, [42] aug-cc-pVZ,[42, 43, 44] cc-pwCVZ, [42, 45] and aug-cc-pwCVZ [42, 43, 44, 45] (with =T, Q). For basis sets denoted as cc-pV(+)Z or aug-cc-pV(+)Z an additional tight function [46] has been added to the sulfur atom only, while for all other elements cc-pV()Z or aug-cc-pV()Z have been used, respectively. Equilibrium geometries have been calculated using analytic gradient techniques [47], while harmonic frequencies have been computed using analytic second-derivative techniques [48, 49]. For anharmonic computations second-order vibrational perturbation theory (VPT2) [50] has been employed and additional numerical differentiation of analytic second derivatives has been applied to obtain the third and fourth derivatives required for the application of VPT2 [49, 51]. The frozen core approximation has been indicated throughout by “fc”.
4 Results and Discussion
4.1 The structures of HC3O+ and HC3S+ and their weakly bound complexes with Ne
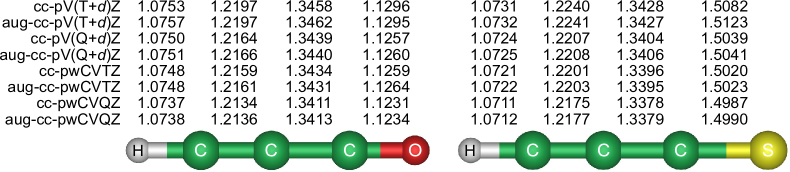
The equilibrium structures of HC3O+ and HC3S+ calculated at the CCSD(T) level of theory using different correlation consistent basis sets are summarized in Fig. 2. The calculated bond lengths are slightly elongated for augmented basis sets relative to those calculated using the standard basis sets, while most bond lengths become shorter as the size of the basis set increases. Over the range of basis sets employed here, the structural parameters vary by at most 610-3 Å, with the exception of the CO and CS distances, which vary by about 1.510-2 Å.
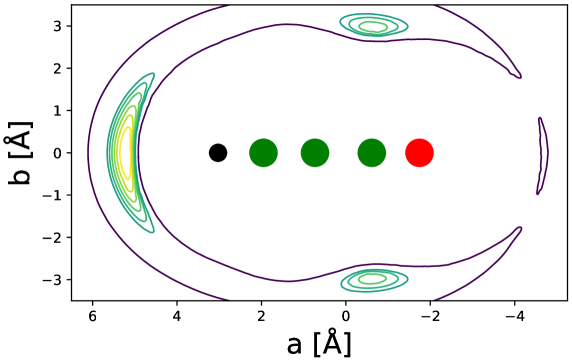
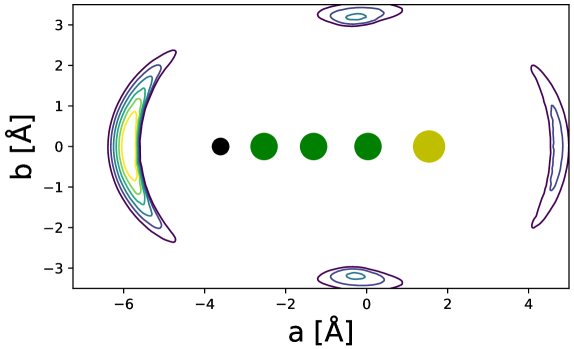
As a compromise between accuracy and computational demand, the Ne-complexes of HC3O+ and HC3S+ were calculated at the fc-CCSD(T)/aug-cc-pV(T+)Z level of theory. To determine the most energetically favorable locations of the Ne atom with respect to the HC3O+ and HC3S+ chains, i.e., to identify local minima on the NeHC3O+ and NeHC3S+ potential energy surfaces, the fc-CCSD(T)/aug-cc-pV(T+)Z equilibrium structures in Fig. 2 were kept fixed and the position of the Ne atom was varied on a 117 Å2 grid using a spacing of 0.25 Å and distances ranging from some 1.5 to 3.5 Å about the HC3O+ and HC3S+ chains. For each of the some 500 grid points for both surfaces single-point energy calculations were performed, the results of which are graphically represented in Fig. 3. This approach led to the identification of three minima for each complex: a H-bound linear structure, which is the global minimum for both complexes (e.g., similar to that of the Ne\ceHCO+ cluster [54]), followed by non-linear (T-shaped) variants. A third, weakly-bound minimum exists in which the Ne atom is located adjacent to the O and S atoms in a linear arrangement.
In a second approach, the structural optimizations of all minimum energy configurations were fully relaxed. As indicated in the structural parameters collected in Table 4.1, the perturbation of Ne on both HC3O+ and HC3S+ is small, with variations on the order of Å. The Ne bond dissociation energies differ by at most 0.6 kcal mol-1 in the minimum configurations identified, amounting to 1.0 kcal mol-1, 0.9 kcal mol-1, and 0.4 kcal mol-1 for NeHC3O+ and 0.9 kcal mol-1, 0.7 kcal mol-1, and 0.6 kcal mol-1 for NeHC3S+. When rough estimates of the zero-point vibrational effects on the Ne bond dissociation energies () are included, the H-bound and T-shaped forms are essentially isoenergetic for HC3O+, while the O-bound form is slightly less stable by about 0.5 kcal mol-1. For HC3S+, the energy difference between the three structures is more or less negligble.
Variation of bond distances of HC3O+ and HC3S+ with respect to Ne tagging as well as Ne bond dissociation energies . denotes the electronic contribution at the equilibrium geometry, while denotes augmented by a harmonic estimate of the zero-point vibrational contribution. All results have been obtained at the fc-CCSD(T)/aug-cc-pV(T+)Z level of theory. Bond lengths given in units of Å, Ne bond dissociation energies in kcal mol-1. Species R(CH) R(CC) R(CC) R(CO/S) HC3O+ 1.0757 1.2197 1.3462 1.1295 - - Ne-HC3O+ (lin.) 1.0763 1.2199 1.3459 1.1297 1.0 0.7 Ne-HC3O+ (nonlin.)a 1.0756 1.2195 1.3463 1.1294 0.9 0.7 HC3O+-Ne (lin.) 1.0757 1.2197 1.3463 1.1295 0.4 0.3 HC3S+ 1.0732 1.2241 1.3427 1.5123 - - Ne-HC3S+ (lin.) 1.0735 1.2243 1.3423 1.5125 0.9 0.6 Ne-HC3S+ (nonlin.)a 1.0731 1.2240 1.3427 1.5122 0.7 0.6 HC3S+-Ne (lin.) 1.0732 1.2241 1.3429 1.5124 0.6 0.5 \tabnotea Deviations from linearity in the bond angles of the non-linear (T-shaped) forms are found within a maximum of 1 degree, see Appendix 6.
4.2 The influence of Ne-tagging on the vibrational spectra of HC3O+ and HC3S+
As linear pentaatomic species, HC3O+ and HC3S+ both possess seven fundamental vibrational modes, four stretching () and three doubly degenerate () bending modes. To further investigate the perturbation caused by a single Ne atom on their vibrational spectra,harmonic vibrational wavenumbers of HC3O+, HC3S+, and their corresponding complexes with Ne were calculated at the fc-CCSD(T)/aug-cc-pV(T+)Z level of theory. As shown in Table 4.2, these values differ by a only few cm-1. One notable exception are the CCH-bending modes of the H-bound NeHC3O+ and NeHC3S+ linear isomers. Here Ne-tagging results in a 25 to 30 cm-1 blueshift of the modes. Nevertheless, no large shifts are expected for any of the vibrational modes in HC3O+ and HC3S+ upon Ne-tagging.
Harmonic frequencies (in cm-1) of HC3O+, HC3S+, and the corresponding complexes with Ne evaluated at the fc-CCSD(T)/aug-cc-pV(T+)Z level of theory. Modea HC3O+ Ne–HC3O+ Ne–HC3O+ HC3ONe HC3S+ Ne–HC3S+ Ne–HC3S+ HC3SNe lineara nonlineara lineara lineara nonlineara lineara 3351 3347 3352 3351 3370 3370 3371 3370 2346 2345 2347 2346 2133 2132 2134 2133 2094 2093 2095 2094 1634 1634 1634 1633 916 918 916 916 730 731 730 730 c,d 775 806 774/774 774 733 758 732/732 732 c,d 546 547 546/544 547 472 473 471/471 473 c,d 162 168 163/161 162 176 183 177/176 177 b - 75 61 48 - 67 48 48 b,c - 33 31 10 - 29 22 9 \tabnotea Mode index borrowed from untagged HC3O+ and HC3S+ for the sake of comparability. \tabnoteb Extra low-frequency vibrational modes introduced in the Ne–HC3O+ and Ne–HC3S+ complexes, arbitrary mode index. \tabnotec Doubly degenerate bending mode in linear species. \tabnoted Degeneracy is lifted in the non-linear forms.
4.3 Experimental spectra of NeHC3O+ and NeHC3S+
The IR results for HC3O+ and HC3S+ are summarized here. It should again be emphasized that the present IRPD scheme traces the weakly bound complexes with Ne rather than the bare ions themselves, but, as demonstrated in the previous section, the perturbation of the Ne atom on the vibrational fundamentals of the ions is very small. i.e. a few cm-1 at most. The anharmonic vibrational force fields guiding spectroscopic assignment and analysis were calculated at the fc-CCSD(T)/cc-pVTZ (HC3O+) and fc-CCSD(T)/cc-pV(T+)Z (HC3S+) levels. In an attempt to further improve the vibrational wavenumbers calculated for HC3O+, scaling factors derived from a comparison of the corresponding experimental and calculated values of isoelectronic \ceHC3N were employed (Table 4.3). These empirical corrections, however, were found to be very small ( cm-1) and do not affect any spectroscopic assignment. They are given here nonetheless for the sake of completeness.
Fundamental vibrational wavenumbers of HC3N and HC3O+ (in cm-1) and IR band intensities of HC3O+ (km/mol). HC3N HC3O+ Mode Harma Anharma Expb Harma Anharma BEc Expd Inta,e () CH stretch 3459 3325 3327 3362 3229 3231 3232 96 () CN/O stretch 2312 2271 2274 2353 2313 2316 2313 782 () CC stretch 2104 2069 2079 2097 2064 2074 104 () CC stretch 875 853 862 918 901 911 906 7 () CCH bending 663 650 663.2 773 758 773 764 54 () CCN/O bending 498 486 498.8 552 547 558 555 54 () CCC bending 227 217 222.4 181 166 169 6 \tabnotea fc-CCSD(T)/cc-pVTZ. \tabnoteb Experimental vibrational wavenumbers from Ref. [55]. \tabnotec Best estimate (BE) value: Anharmonic vibrational wavenumber of HC3O+ scaled by the ratio of Exp/Anharmonic wavenumbers of \ceHC3N. \tabnoted See Figure 4. \tabnotee IR intensities obtainted via VPT2.
4.3.1 FELIX and OPO spectra of Ne\ceHC3O+
The FELIX IRPD spectra of NeHC3O+ are shown in Figure 4. For comparison, a simulation based on results of an anharmonic VPT2 calculation at the fc-CCSD(T)/cc-pVTZ level of the bare HC3O+ ion is also presented. Wavenumbers of the experimental vibrational bands and those predicted theoretically are compared in Table 4.3. Experimentally, two regions were covered with FELIX: 530 to 1000 cm-1 and 2060 to 2500 cm-1. Four prominent features, all of which coincide virtually quantitatively with the calculated vibrational fundamentals of HC3O+, were observed in these two regions. The features are identified as the fundamental (CO stretch) at 2313 cm-1 (best estimate value at 2316 cm-1), (CC stretch) at 906 cm-1 (best estimate value 911 cm-1), (CCH bending) at 764 cm-1 (best estimate 773 cm-1), and (CCO bending) at 555 cm-1 (best estimate at 558 cm-1). Unfortunately, the mode (CC stretch) predicted at 2074 cm-1, was not detected. Presumably this band lies just outside the region accessible with FELIX during our observing run. As shown in section 4.3.2, the corresponding mode of NeHC3S+ is rather prominent.
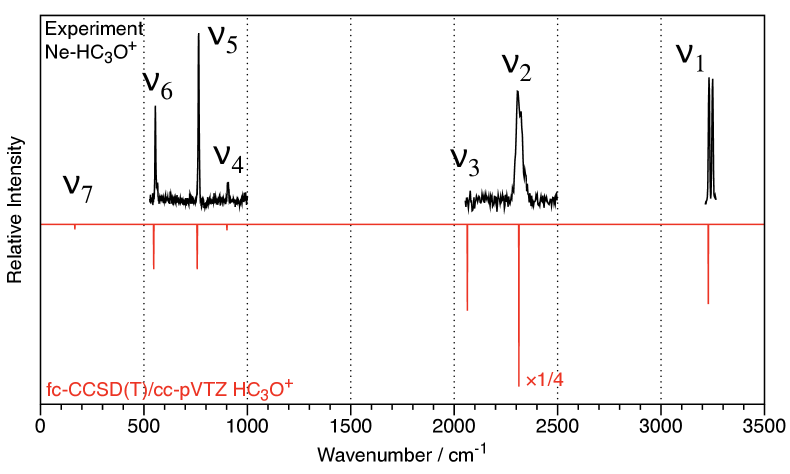
The mode around 3200 cm-1 was detected in the Cologne laboratory using a commercial pulsed OPO system. Based on the empirically-scaled predictions from Table 4.3, our best estimate was 3231 cm-1 for this mode, and indeed it was found very close by, at 3232 cm-1. Scanning further up in energy revealed a second band of similar intensity at 3249 cm-1. The origin of this second band is not entirely clear, since only one band is expected for the bare ion. Also, a combination of the and modes seems unlikely, which would be expected a few tens of cm-1 below . As the calculated Ne-induced shifts of this band for any of the three different complexes (see Table 4.2) are much smaller than the splitting observed, the possibility of a second structural isomer seems unlikely but cannot be ruled out. However, combination modes involving the Ne atom might need to be considered further. Such vibrational “tag-satellites” have been observed previously [56, 36], albeit at much less intensity. Assuming that the quantum-chemical calculations are correct, and the complex being probed is the linear H-bound form (global minimum), the NeHC bending mode would be the energetically lowest vibrational fundamental in the NeHC3O+ complex. While anharmonic force field calculations of weakly-bound molecules employing VPT2 are intrinsically difficult, trial calculations performed here at the fc-CCSD(T)/aug-cc-pVTZ level predict this mode has a vibrational frequency of roughly 10 cm-1. Hence, it is possible that the second mode is in fact a combination mode of CH stretching and NeHC bending.
Additional measurements at high spectral resolution may help to resolve this issue and others in the IR spectrum of Ne\ceHC3O+. For example, an analysis of the underlying rotational structure for the mode would likely clarify the carrier of these spectroscopic features, and in doing so provide a stringent test of the present spectroscopic assignment. Rotational resolution of the rather broad mode observed with FELIX would also be key to understanding possible causes for its width, such as lifetime broadening or the more speculative explanation that it arises from tag-satellites from the Ne tag.
4.3.2 Ne\ceHC3S+ observed with FELIX
The FELIX spectra of NeHC3S+ are shown in Fig. 5 along with a simulation based on results from an anharmonic VPT2 calculation at the fc-CCSD(T)/cc-pV(T+)Z level of the bare ion. As the vibrational spectrum of isoelectronic \ceHC3P has not yet been studied experimentally, no empirical scaling was possible. Experimentally, three regions were covered with FELIX: 460 to 540 cm-1, 600 to 1800 cm-1, as well as 2010 to 2490 cm-1. In total, four prominent features are observed; the frequencies of each agree very well with vibrational fundamentals calculated for HC3S+: observed at 2097 cm-1 (calculated at 2093 cm-1; see Table 4.3.2), at 1624 cm-1 (calculated at 1613 cm-1), and most likely overlapped to one feature observed at 731 cm-1 (calculated at 719 and 715 cm-1, respectively), and finally the mode at 481 cm-1 (calculated at 466 cm-1). The CH stretching () and CCC () bending modes calculated at 3247 cm-1 and 175 cm-1 lie outside our our measurement range, and were not observed experimentally here. The weakest feature in the NeHC3S+ spectrum is observed at 1446 cm-1. This feature is not from a vibrational fundamental, however, it is located close to two times the wavenumber of the / fundamental feature observed at 731 cm-1 and hence very likely corresponds to an overtone/combination mode. While the intensities observed in action spectra are not strictly related to spectroscopic band intensities, they are often found to be in qualitative agreement. From this viewpoint, it can be assumed that both the 731 cm-1 and 1446 cm-1 features are dominated by the contribution from the mode whose IR intensity in the bare ion is calculated to be 500 times higher than that of (Table 4.3.2).
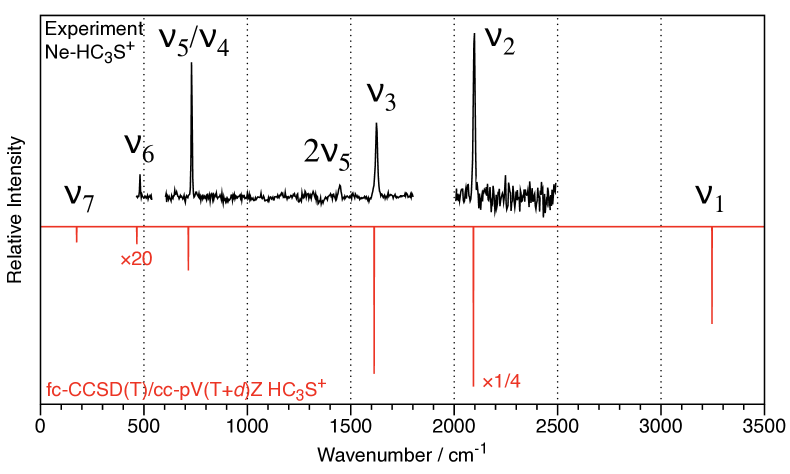
Fundamental vibrational wavenumbers of HC3S+ (in cm-1) and IR band intensities (km/mol). HC3S+ Mode Harma Anharma Expb Inta,e () CH stretch 3381 3247 111 () CC stretch 2137 2093 2097 730 () CS stretch 1636 1613 1624 168 () CC stretch 729 719 731 0.1 () CCH bending 738 715 731 50 () CCS bending 485 466 481 1 () CCC bending 185 175 18 \tabnotea fc-CCSD(T)/cc-pVTZ. \tabnoteb See Figure 5. \tabnotee IR intensities obtainted via VPT2.
5 Conclusions and Prospects
The present study marks the first spectroscopic detection of two fundamental molecular ions of potential astronomical relevance, HC3O+ and HC3S+. The detections were made possible by using very sensitive IR action spectroscopic methods in combination with ion traps, an approach that can likely be adapted to study similar and even (much) more complex species at high spectral resolution. Owing to mass selection prior to spectroscopic interrogation in the ion trap, the resulting spectra are free from contamination and can be readily assigned using high-level quantum-chemical calculations of the bare ion since coupling of the Ne tag to the ion is very weak.
While the molecular carriers of the vibrational features studied here, HC3O+ and HC3S+, have been established beyond any reasonable doubt, the present measurements lack the rotational information that is required for more detailed spectroscopic analysis or to undertake a radio astronomical search. Nevertheless, the present work provides a firm foundation for subsequent analysis in this and other wavelength regions. For example, now that the positions of several vibrational bands of \ceHC3O+ and \ceHC3S+ are known, the use of narrow-linewidth continuous-wave IR sources such as quantum cascade lasers or optical parametric oscillators may permit the observation of selected bands at very high spectral resolution. Recent examples of such studies in the Cologne laboratory include the observation of CH+ and \ceCD2H+ using laser induced reaction (LIR) or laser induced inhibition of complex growth (LIICG) schemes [57, 58], which provide spectroscopic information on the bare ions. Analogous higher-resolution studies of the Ne-ion complexes described here would allow to determine their precise geometrical structure and resolve the issue surrounding the assignment of the peculiar second band observed in the vicinity of the band of HC3O+.
In addition to any studies in the infrared, rotational spectra may be observed directly using the method of rotational state-specific attachment of rare gas atoms (ROSAA) to cations at very low temperatures [59], a method that has been used recently with excellent success to obtain the pure rotational spectra of fundamental ions [see, e.g., 60, 61, 62]. The rotational spectra of two species isoelectronic with HC3O+ and HC3S+– \ceHC3N and \ceHC3P – have been studied very accurately [see Refs. 63, 64, and references therein], and may be used to calibrate the computational results of the two ions obtained here. For \ceHC3N, the ground state rotational constant from a CCSD(T)/cc-pwCVQZ calculation and CCSD(T)/cc-pVTZ zero point vibrational corrections is 4542.7 MHz and hence deviates by only 0.14% from the experimental value of 4549.059 MHz. Using the ratio of \ceHC3N for scaling MHz of HC3O+ calculated at the same levels of theory yields a best estimate value of 4460.4 MHz (for of HC3O+). For \ceHC3P, this treatments yields MHz and MHz (0.05 %). Applying the ratio (\ceHC3P) to the calculated MHz constant of HC3S+, a best estimate value of MHz is obtained. The uncertainties of these best estimates may well be within 1 MHz, more than adequate for experimental searches by microwave techniques. Both ions are calculated to be very polar, with dipole moments of 3.26 D for HC3O+ and 1.73 D for HC3S+ the CCSD(T)/aug-cc-pwCVQZ level of theory.
Acknowledgement(s)
This work has been supported via Collaborative Research Centre 956, sub-project B2, funded by the Deutsche Forschungsgemeinschaft (DFG; project ID 184018867) and DFG SCHL 341/15-1 (“Cologne Center for Terahertz Spectroscopy”). We thank the Regional Computing Center of the Universität zu Köln (RRZK) for providing computing time on the DFG-funded High Performance Computing (HPC) system CHEOPS. We gratefully acknowledge the support of Radboud University and of the Nederlandse Organisatie voor Wetenschappelijk Onderzoek (NWO), for providing the required beam time at the FELIX Laboratory and the skillful assistance of the FELIX staff. The research leading to this publication has been supported by the Project CALIPSOplus under the Grant No. 730872 from the EU Framework Programme for Research and Innovation HORIZON 2020. M.C.M and K.L.K.L. acknowledge financial support from NASA grant 80NSSC18K0396.
Lastly, we thank Marie-Aline Martin-Drumel for support during the HC3O+ campaign and a careful reading of the manuscript as well as Mr. Bryan Adams (“Summer of 69”) for many entertaining moments during the spectroscopic study of the HC3S+ ion, lending inspiration to the title of this work.
References
- [1] F.A. Carey and R.J. Sundberg, Organische Chemie, 1st ed. (, , 1995).
- [2] D. McElroy, C. Walsh, A.J. Markwick, M.A. Cordiner, K. Smith and T.J. Millar, Astron. Astrophys. 550, A36 (2013).
- [3] H.E. Matthews, W.M. Irvine, P. Friberg, R.D. Brown and P.D. Godfrey, Nature 310 (5973), 125–126 (1984).
- [4] S. Yamamoto, S. Saito, K. Kawaguchi, N. Kaifu, H. Suzuki and M. Ohishi, Astrophys. J. 317 (2), L119–L121 (1987).
- [5] D. Buhl and L.E. Snyder, Nature 228 (5268), 267–269 (1970).
- [6] R.C. Woods, T.A. Dixon, R.J. Saykally and P.G. Szanto, Phys. Rev. Lett. 35, 1269–1272 (1975).
- [7] W. Klemperer, Nature 227, 1230 (1970).
- [8] P. Thaddeus, M. Guelin and R.A. Linke, Astrophys. J. 246 (1), L41–L45 (1981).
- [9] C.S. Gudeman, N.N. Haese, N.D. Piltch and R.C. Woods, Astrophys. J. 246 (1), L47–L49 (1981).
- [10] V. Lattanzi, A. Walters, B.J. Drouin and J.C. Pearson, Astrophys. J. 662 (1), 771–778 (2007).
- [11] F. Tinti, L. Bizzocchi, C.D. Esposti and L. Dore, Astrophys. J. 669 (2), L113–L116 (2007).
- [12] G. Cazzoli, L. Cludi, G. Buffa and C. Puzzarini, Astrophys. J. Suppl. Ser. 203 (1), 11 (2012).
- [13] B.M. Siller, J.N. Hodges, A.J. Perry and B.J. McCall, J. Phys. Chem. A 117, 10034–10040 (2013).
- [14] N.H. Rosenbaum, J.C. Owrutsky and R.J. Saykally, J. Mol. Struct. 133 (2), 365–382 (1989).
- [15] J. Tang and S. Saito, Astrophys. J. 451 (2), L93–L95 (1995).
- [16] L. Margulès, F. Lewen, G. Winnewisser, P. Botschwina and H.S.P. Müller, Phys. Chem. Chem. Phys. 5 (13), 2770–2773 (2003).
- [17] A.G. Harrison, in The Encylopedia of Mass Spectrometry Vol. 4, edited by Michael L Gross and Richard M. Caprioli (, , 2011), pp. 214–220.
- [18] M.C. Caserio and J.K. Kim, J. Am. Chem. Soc. 105 (23), 6896–6902 (1983).
- [19] N.A. Rahman, C.L. Fisher and M.C. Caserio, Org. Mass. Spectrom. 23 (7), 517–520 (1988).
- [20] Z. Liu, Z. Tang, R. Huang, Q. Zhang and L. Zheng, J. Phys. Chem. A 101 (22), 4019–4025 (1997).
- [21] Z.Y. Liu, R.B. Huang and L.S. Zheng, Int. J. Mass. Spectrom. Ion Proc. 155 (1-2), 79–87 (1996).
- [22] S. Peppe, S.J. Blanksby, S. Dua and J.H. Bowie, J. Phys. Chem. A 104, 5817–5824 (2000).
- [23] I. Derbali, H.R. Hrodmarsson, Z. Gouid, M. Schwell, M.C. Gazeau, J.C. Guillemin, M. Hochlaf, M.E. Alikhani and E.L. Zins, Phys. Chem. Chem. Phys. 21 (26), 14053–14062 (2019).
- [24] J.D. Mosley, J.W. Young and M.A. Duncan, J. Chem. Phys. 141 (2), 024306 (2014).
- [25] A. Chakraborty, J. Fulara and J.P. Maier, Mol. Phys. 114, 2794–2797 (2016).
- [26] J. Jin, W. Li, Y. Liu, G. Wang and M. Zhou, J. Chem. Phys. 146, 214301 (2017).
- [27] W. Li, J.Y. Jin, H. Qu, G.J. Wang and M.F. Zhou, Chin. J. Chem. Phys. 32, 77–83 (2019).
- [28] K. Raghavachari, G.W. Trucks, J.A. Pople and M. Head-Gordon, Chem. Phys. Lett. 157, 479–483 (1989).
- [29] D. Oepts, A.F.G. van der Meer and P.W. van Amersfoort, Infrared Phys. Technol. 36 (1), 297–308 (1995).
- [30] P. Jusko, S. Brünken, O. Asvany, S. Thorwirth, A. Stoffels, L. van der Meer, G. Berden, B. Redlich, J. Oomens and S. Schlemmer, Faraday Discuss. 217, 172–202 (2019).
- [31] O. Asvany, F. Bielau, D. Moratschke, J. Krause and S. Schlemmer, Rev. Sci. Instr. 81, 076102 (2010).
- [32] M. Brümmer, C. Kaposta, G. Santambrogio and K.R. Asmis, The Journal of Chemical Physics 119 (24), 12700–12703 (2003).
- [33] J. Jašík, J. Žabka, J. Roithová and D. Gerlich, Int. J. Mass Spectrom. 354, 204––210 (2013).
- [34] S. Brünken, F. Lipparini, A. Stoffels, P. Jusko, B. Redlich, J. Gauss and S. Schlemmer, J. Phys. Chem. A 123 (37), 8053–8062 (2019).
- [35] O. Asvany, S. Schlemmer, T. Szidarovszky and A.G. Császár, J. Phys. Chem. Lett. 10 (18), 5325–5330 (2019).
- [36] H. Kohguchi, P. Jusko, K.M.T. Yamada, S. Schlemmer and O. Asvany, J. Chem. Phys. 148 (14), 144303 (2018).
- [37] O. Asvany, S. Brünken, L. Kluge and S. Schlemmer, Appl. Phys. B 114 (1-2), 203–211 (2014).
- [38] J. Goddard, Chem. Phys. Lett. 109 (2), 170–174 (1984).
- [39] P. Botschwina, J. Chem. Phys. 90 (8), 4301–4313 (1989).
- [40] R.G.A.R. Maclagan and P. Sudkeaw, J. Chem. Soc. Faraday Trans. 89, 3325–3329 (1993).
- [41] R.G.A.R. Maclagan and P. Sudkeaw, Chem. Phys. Lett. 194 (3), 147–151 (1992).
- [42] T.H. Dunning, J. Chem. Phys. 90, 1007–1023 (1989).
- [43] R.A. Kendall, T.H. Dunning and R.J. Harrison, J. Chem. Phys 96, 6796–6806 (1992).
- [44] D.E. Woon and T.H. Dunning, J. Chem. Phys. 98, 1358–1371 (1993).
- [45] K.A. Peterson and T.H. Dunning, J. Chem. Phys. 117, 10548–10560 (2002).
- [46] T.H. Dunning, K.A. Peterson and A.K. Wilson, J. Chem. Phys. 114, 9244–9253 (2001).
- [47] J.D. Watts, J. Gauss and R.J. Bartlett, Chem. Phys. Lett. 200, 1–7 (1992).
- [48] J. Gauss and J.F. Stanton, Chem. Phys. Lett. 276, 70–77 (1997).
- [49] J.F. Stanton and J. Gauss, Int. Rev. Phys. Chem. 19, 61–95 (2000).
- [50] I.M. Mills, in Molecular Spectroscopy: Modern Research, edited by K. N. Rao and C. W. Mathews (Academic Press, New York, 1972), pp. 115–140.
- [51] J.F. Stanton, C.L. Lopreore and J. Gauss, J. Chem. Phys. 108, 7190–7196 (1998).
- [52] J.F. Stanton, J. Gauss, L. Cheng, M.E. Harding, D.A. Matthews and P.G. Szalay, CFOUR, Coupled-Cluster techniques for Computational Chemistry, a quantum-chemical program package With contributions from A.A. Auer, R.J. Bartlett, U. Benedikt, C. Berger, D.E. Bernholdt, Y.J. Bomble, O. Christiansen, F. Engel, R. Faber, M. Heckert, O. Heun, M. Hilgenberg, C. Huber, T.-C. Jagau, D. Jonsson, J. Jusélius, T. Kirsch, K. Klein, W.J. Lauderdale, F. Lipparini, T. Metzroth, L.A. Mück, D.P. O’Neill, D.R. Price, E. Prochnow, C. Puzzarini, K. Ruud, F. Schiffmann, W. Schwalbach, C. Simmons, S. Stopkowicz, A. Tajti, J. Vázquez, F. Wang, J.D. Watts and the integral packages MOLECULE (J. Almlöf and P.R. Taylor), PROPS (P.R. Taylor), ABACUS (T. Helgaker, H.J. Aa. Jensen, P. Jørgensen, and J. Olsen), and ECP routines by A. V. Mitin and C. van Wüllen. For the current version, see http://www.cfour.de.
- [53] M.E. Harding, T. Metzroth, J. Gauss and A.A. Auer, J. Chem. Theory Comput. 4, 64–74 (2008).
- [54] S.A. Nizkorodov, O. Dopfer, M. Meuwly, J.P. Maier and E.J. Bieske, J. Chem. Phys. 105 (5), 1770–1777 (1996).
- [55] A. Jolly, Y. Benilan and A. Fayt, J. Mol. Spectrosc. 242 (1), 46–54 (2007).
- [56] M. Okumura, L.I. Yeh and Y.T. Lee, J. Chem. Phys. 83, 3705–3706 (1985).
- [57] J.L. Doménech, P. Jusko, S. Schlemmer and O. Asvany, Astrophys. J. 857, 61 (2018).
- [58] P. Jusko, A. Stoffels, S. Thorwirth, S. Brünken, S. Schlemmer and O. Asvany, J. Mol. Spectrosc. 332, 59–66 (2017).
- [59] S. Brünken, L. Kluge, A. Stoffels, J. Pérez-Ríos and S. Schlemmer, J. Mol. Spectrosc. 332, 67–78 (2017).
- [60] J.L. Doménech, S. Schlemmer and O. Asvany, Astrophys. J. 849, 60 (2017).
- [61] S. Thorwirth, P. Schreier, T. Salomon, S. Schlemmer and O. Asvany, Astrophys. J. Lett. 882, L6 (2019).
- [62] C.R. Markus, S. Thorwirth, O. Asvany and S. Schlemmer, Phys. Chem. Chem. Phys. 21, 26406–26412 (2019).
- [63] S. Thorwirth, H.S.P. Müller and G. Winnewisser, J. Mol. Spectrosc. 204, 133–144 (2000).
- [64] L. Bizzocchi, S. Thorwirth, H.S.P. Müller, F. Lewen and G. Winnewisser, J. Mol. Spectrosc. 205 (1), 110–116 (2001).
6 Appendices
Internal coordinates for the Ne-complexes of HC3O+ (calculated at the fc-CCSD(T)/aug-cc-pVTZ level) and HC3S+ (fc-CCSD(T)/aug-cc-pV(T+)Z) from fully relaxed structural calculations. Bond lengths are given in Å, angles in degrees.
6.1 NeHC3O+, fc-CCSD(T)/aug-cc-pVTZ
6.1.1 Ne\ceHC3O+, linear form
O
C 1 r1
X 2 rd 1 a90
C 2 r2 3 a90 1 d180
X 4 rd 2 a90 3 d0
C 4 r3 5 a90 2 d180
X 6 rd 4 a90 5 d0
H 6 r4 7 a90 4 d180
X 8 rd 6 a90 7 d0
NE 8 r5 9 a90 6 d180

r1   =        1.129675503855228
rd   =        1.000000409314806
a90  =       90.000000000000000
r2   =        1.345852682859310
d180 =      180.000000000000000
d0   =        0.000000000000000
r3   =        1.219943167034099
r4   =        1.076271649089833
r5   =        2.191966102105850
6.1.2 \ceHC3O+Ne, non-linear (T-) form
H
C 1 r1
X 2 rd 1 a90
C 2 r2 3 a1 1 d180
X 4 rd 2 a90 3 d0
C 4 r3 5 a2 2 d180
X 6 rd 4 a90 5 d0
O 6 r4 7 a3 4 d180
NE 8 r5 6 a4 7 d0

r1   =        1.075618393685392
rd   =        1.000002251233508
a90  =       90.000000000000000
r2   =        1.219547134225782
a1   =       89.987605394672087
d180 =      180.000000000000000
d0   =        0.000000000000000
r3   =        1.346336487375038
a2   =       90.223210508956072
r4   =        1.129411452271238
a3   =       90.218170030502677
r5   =        3.167121007415886
a4   =       69.294364994274972
6.1.3 \ceHC3O+Ne, linear form
O
C 1 r1
X 2 rd 1 a90
C 2 r2 3 a90 1 d180
X 4 rd 2 a90 3 d0
C 4 r3 5 a90 2 d180
X 6 rd 4 a90 5 d0
H 6 r4 7 a90 4 d180
X 1 rd 2 a90 3 d0
NE 1 r5 9 a90 2 d180

r1   =        1.129522777467840
rd   =        1.000000613972272
a90  =       90.000000000000000
r2   =        1.346337295083560
d180 =      180.000000000000000
d0   =        0.000000000000000
r3   =        1.219669287299509
r4   =        1.075691499375670
r5   =        2.941664123884200
6.2 NeHC3S+, fc-CCSD(T)/aug-cc-pV(T+d)Z
6.2.1 Ne\ceHC3S+, linear form
S
C 1 r1
X 2 rd 1 a90
C 2 r2 3 a90 1 d180
X 4 rd 2 a90 3 d0
C 4 r3 5 a90 2 d180
X 6 rd 4 a90 5 d0
H 6 r4 7 a90 4 d180
X 8 rd 6 a90 7 d0
NE 8 r5 9 a90 6 d180

r1   =        1.508396620643273
rd   =        1.000000000000000
a90  =       90.000000000000000
r2   =        1.342701023969591
d180 =      180.000000000000000
d0   =        0.000000000000000
r3   =        1.224200791251630
r4   =        1.073475625100924
r5   =        2.241879594490575
6.2.2 \ceHC3S+Ne, non-linear (T-) form
H
C 1 r1
X 2 rd 1 a90
C 2 r2 3 a1 1 d180
X 4 rd 2 a90 3 d0
C 4 r3 5 a2 2 d180
X 6 rd 4 a90 5 d0
S 6 r4 7 a3 4 d180
NE 8 r5 6 a4* 7 d0

r1   =        1.073113918449037
rd   =        1.000001023287332
a90  =       89.000000000000000
r2   =        1.223905552313753
a1   =       91.009405591888765
d180 =      180.000000000000000
d0   =        0.000000000000000
r3   =        1.343046564596132
a2   =       91.035318504696349
r4   =        1.508072750853718
a3   =       91.003095953954897
r5   =        3.668256915522843
a4   =       60.467779413084898
6.2.3 \ceHC3S+Ne, linear form
S
C 1 r1
X 2 rd 1 a90
C 2 r2 3 a90 1 d180
X 4 rd 2 a90 3 d0
C 4 r3 5 a90 2 d180
X 6 rd 4 a90 5 d0
H 6 r4 7 a90 4 d180
X 1 rd 2 a90 3 d0
NE 1 r5 9 a90 2 d180

r1   =        1.508253279164069
rd   =        1.000000613972272
a90  =       90.000000000000000
r2   =        1.343211324073055
d180 =      180.000000000000000
d0   =        0.000000000000000
r3   =        1.223930047649706
r4   =        1.073146611305811
r5   =        3.177832307922192