Shapes and alignments of dark matter haloes and their brightest cluster galaxies in 39 strong lensing clusters
Abstract
We study shapes and alignments of 45 dark matter (DM) haloes and their brightest cluster galaxies (BCGs) using a sample of 39 massive clusters from Hubble Frontier Field (HFF), Cluster Lensing And Supernova survey with Hubble (CLASH), and Reionization Lensing Cluster Survey (RELICS). We measure shapes of the DM haloes by strong gravitational lensing, whereas BCG shapes are derived from their light profiles in Hubble Space Telescope images. Our measurements from a large sample of massive clusters presented here provide new constraints on dark matter and cluster astrophysics. We find that DM haloes are on average highly elongated with the mean ellipticity of , and position angles of major axes of DM haloes and their BCGs tend to be aligned well with the mean value of alignment angles of deg. We find that DM haloes in our sample are on average more elongated than their BCGs with the mean difference of their ellipticities of . In contrast, the Horizon-AGN cosmological hydrodynamical simulation predicts on average similar ellipticities between DM haloes and their central galaxies. While such a difference between the observations and the simulation may well be explained by the difference of their halo mass scales, other possibilities include the bias inherent to strong lensing measurements, limited knowledge of baryon physics, or a limitation of cold dark matter.
keywords:
dark matter – galaxies: clusters: general – gravitational lensing: strong1 Introduction
The standard cosmological model, dominated by cosmological constant and cold dark matter (CDM), explains various observations over Mpc to Gpc scales, such as cosmic microwave background anisotropy (e.g., Spergel et al., 2003; Planck Collaboration et al., 2016), the magnitude-redshift relation of Type Ia supernovae (e.g., Perlmutter et al., 1999; Riess et al., 1998), and baryon acoustic oscillations (e.g., Eisenstein et al., 2005). Cosmological parameters of the CDM model are determined very precisely from these observations. While the CDM model has passed many observational tests, there still remain several challenges at small scales such as core-cusp and missing satellite problems (e.g., Bullock & Boylan-Kolchin, 2017, for a review). These challenges may point to an interesting possibility that the underlying assumption of the CDM model has to be modified, including the modification of the nature of dark matter, although they might simply reflect a lack of our understanding of detailed baryon physics at small scales. Given their potential significance, it is important to confront CDM model predictions at small scales ( Mpc) with a variety of observations.
Among others, galaxy clusters provide a useful means of testing the CDM model, because their internal structure is mainly determined by the dynamics of dark matter and are less affected by detailed baryon physics at least as compared with galaxies for which effects of gas cooling and star formation on the internal structure are pronounced. An important characteristics of galaxy clusters is that they are highly non-spherical. There has been a number of observational studies that measure non-sphericities of galaxy clusters from member galaxy distribution (e.g., Binggeli, 1982; West et al., 2017), X-ray surface brightness (e.g., Hashimoto et al., 2008; Kawahara, 2010), gravitational lensing signal (e.g., Oguri et al., 2010; Oguri et al., 2012; Umetsu et al., 2018; Harvey et al., 2019), and the Sunyaev Zel’dovich effect (e.g., Donahue et al., 2016). Furthermore, -body simulations based on the CDM model also predict non-sphericities of galaxy cluster sized dark matter (DM) haloes (e.g., Jing & Suto, 2002). Since the degree of non-sphericities is sensitive to nature of dark matter (e.g., Yoshida et al., 2000; Peter et al., 2013), comparison of observed non-sphericities of galaxy clusters serves as a useful complementary test of the CDM model.
Previous comparisons against model predictions indicated that the observed non-sphericities of galaxy clusters are broadly consistent with the CDM model. However, for more accurate test of the CDM model both observations and theoretical model predictions have to be improved. While gravitational lensing provides a powerful tool to measure shapes of dark matter distributions directly, there is room for improvement in several ways. First, measurements of non-sphericities for individual clusters using weak lensing (e.g., Oguri et al., 2010; Umetsu et al., 2018) are still noisy. Second, strong lensing allows us to measure shapes more accurately if there are sufficiently large number of multiple images (e.g., Richard et al., 2010; Oguri et al., 2012), but the sample size is not very large in practice ( including poorly constrained systems). Third, while stacked weak lensing enables us to measure the average shape of clusters very accurately (e.g., Evans & Bridle, 2009; Clampitt & Jain, 2016; van Uitert et al., 2017; Shin et al., 2018), the interpretation of the observed signals is not easy because they depend on both non-sphericities of individual clusters and mis-alignments between prior directions of individual clusters used for stacking and their true orientations. In theoretical model predictions, even though the internal structure of clusters are relatively less affected by baryon physics, various baryon physics such as gas cooling, star formation, and feedback has non-negligible effects on shapes of dark matter distributions (e.g., Kazantzidis et al., 2004; Suto et al., 2017). Thus the hydrodynamical simulation is required for accurate model predictions of cluster shapes.
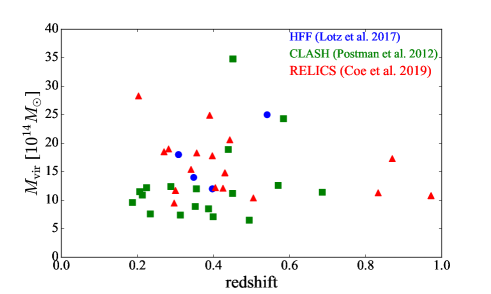
In this paper, we provide new measurements of shapes and orientations of 39 clusters by strong gravitational lensing. Our cluster sample is taken from recent three survey of clusters conduced with Hubble Space Telescope (HST), Hubble Frontier Field (Lotz et al., 2017), Cluster Lensing And Supernova survey with Hubble (Postman et al., 2012), and Reionization Lensing Cluster Survey (Coe et al., 2019). Thanks to deep imaging by HST, many multiple images have been identified for these clusters, leading to reliable measurements of dark matter distributions at the cores of 45 DM haloes. Measured ellipticities and orientations of dark matter distributions are then compared with those of Brightest Cluster Galaxies (BCGs). We also compare our results with theoretical model predictions based on the cosmological hydrodynamical simulation Horizon-AGN (Dubois et al., 2014) to see if the observed ellipticities and alignments of orientations between BCGs and their host DM haloes are consistent with the CDM model predictions.
The structure of this paper is as follows. In Section 2, we describe the cluster sample and observational data used for the analysis. We present measurements of ellipticities and alignments in Section 3, and the comparison with the Horizon-AGN simulation in Section 4. We discuss results in Section 5, and summarize results in Section 6. Throughout this paper, we adopt cosmological parameters based on the seven-year Wilkinson Microwave Anisotropy Probe (Komatsu et al., 2011); the total matter density , cosmological constant , the baryon density , the amplitude of the power spectrum of density fluctuations , the Hubble constant , and the power-law index of the primordial power spectrum , which are the parameter set adopted in the Horizon-AGN simulation.
2 Sample and data
2.1 Cluster sample: HFF, CLASH, and RELICS
We first describe how to measure ellipticities and orientations of galaxy clusters, all of which are observed with the HST. We use three survey data to construct our galaxy cluster sample: Hubble Frontier Field 111https://archive.stsci.edu/prepds/frontier/ (HFF; Lotz et al., 2017), Cluster Lensing And Supernova survey with Hubble 222https://archive.stsci.edu/prepds/clash/ (CLASH; Postman et al., 2012), and Reionization Lensing Cluster Survey 333https://archive.stsci.edu/prepds/relics/ (RELICS; Coe et al., 2019). Our strong lens mass models of 39 galaxy clusters from these three surveys (see Section 2.2) are used to measure ellipticities and orientations of their dark matter distributions, whereas we use the HST images to measure light profiles of their BCGs (see Section 2.3).
| survey | cluster name | ||
|---|---|---|---|
| HFF | Abell 2744 | 0.308 | 18.0 |
| HFF | MACS0416.12403 | 0.3971 | 12.0 |
| HFF | MACS1149.52223 | 0.541 | 25.0 |
| HFF | Abell S1063 | 0.348 | 14.0 |
| CLASH | Abell 209 | 0.206 | 11.5 |
| CLASH | Abell 383 | 0.187 | 9.6 |
| CLASH | MACS0329.70211 | 0.45 | 11.2 |
| CLASH | MACS0429.60253 | 0.399 | 7.1 |
| CLASH | MACS0744.93927 | 0.686 | 11.4 |
| CLASH | Abell 611 | 0.288 | 12.4 |
| CLASH | MACS1115.90129 | 0.355 | 12.0 |
| CLASH | Abell 1423 | 0.213 | 10.9 |
| CLASH | MACS1206.20847 | 0.439 | 18.9 |
| CLASH | MACS1311.00310 | 0.494 | 6.5 |
| CLASH | RXJ1347.51145 | 0.451 | 34.8 |
| CLASH | MACS1720.33536 | 0.387 | 8.5 |
| CLASH | Abell 2261 | 0.224 | 12.2 |
| CLASH | MACS1931.82635 | 0.352 | 8.9 |
| CLASH | RXJ2129.70005 | 0.234 | 7.6 |
| CLASH | MS 21372353 | 0.313 | 7.4 |
| CLASH | MACS0647.77015 | 0.584 | 24.3 |
| CLASH | MACS2129.40741 | 0.57 | 12.6 |
| RELICS | Abell 2163 | 0.203 | 28.3 |
| RELICS | Abell 2537 | 0.2966 | 9.5 |
| RELICS | Abell 3192 | 0.425 | 12.1 |
| RELICS | Abell 697 | 0.282 | 19.0 |
| RELICS | Abell S295 | 0.3 | 11.7 |
| RELICS | ACT-CL J0102-49151 | 0.87 | 17.3 |
| RELICS | CL J0152.7-1357 | 0.833 | 11.3 |
| RELICS | MACS J0159.8-0849 | 0.405 | 12.2 |
| RELICS | MACS J0257.1-2325 | 0.5049 | 10.4 |
| RELICS | MACS J0308.92645 | 0.356 | 18.3 |
| RELICS | MACSJ0417.5-1154 | 0.443 | 20.6 |
| RELICS | MACS J0553.4-3342 | 0.43 | 14.8 |
| RELICS | PLCK G171.9-40.7 | 0.27 | 18.5 |
| RELICS | PLCK G287.032.9 | 0.39 | 24.9 |
| RELICS | RXC J0142.94438 | 0.341 | 15.4 |
| RELICS | RXC J2211.7-0350 | 0.397 | 17.8 |
| RELICS | SPT-CL J0615-5746 | 0.972 | 10.8 |
Table 1 summarizes properties of the galaxy cluster sample, with being the virial mass in units of . We compute their virial masses as follows. For HFF, we use shown in Table 2 of Lotz et al. (2017). For CLASH, first we convert the X-ray temperature shown in Table 4 of Postman et al. (2012) to by using an empirical relation (Arnaud et al., 2007). We then obtain from by assuming the Navarro et al. (1997, hereafter NFW) profile with the concentration parameter of . For RELICS, we use shown in Table 2 of Coe et al. (2019) that are inferred from Sunyaev-Zel’dovich effect measurements by the Planck satellite and convert them to by assuming the NFW profile and . Figure 1 summarizes virial masses and redshifts of galaxy clusters in our sample.
2.2 Ellipticities and position angles of dark matter halo by strong lensing
We compare shapes of BCGs with those of dark matter distributions measured with strong lensing. See Appendix A for more details. In short, we use the software glafic (Oguri, 2010) for mass modeling, and reconstruct the mass distribution of each cluster assuming a parametric mass model that includes DM halo components modeled by an elliptical NFW profile as well as cluster member galaxy components (including BCG) modeled by an elliptical pseudo-Jaffe profile. More specifically, we introduce an ellipticity to the NFW profile simply by defining the convergence as
| (1) |
where is the convergence profile of a spherical NFW profile (e.g., Bartelmann, 1996) and and are coordinates along with minor and major axes of the ellipse. Therefore our definition of the ellipticity is , where and are major and minor axis lengths of the ellipse. An additional model parameter for the elliptical NFW profile is the position angle , which is defined as the polar angle of the major axis measured East of North. All model parameters including and of DM halo components are determined so as to reproduce observed multiple image positions (see also Appendix A). Since cluster member galaxies are modelled separately in our strong lens mass modeling, our measurements of halo shapes from the best-fitting and of DM halo components correspond to shapes of the smooth part of cluster DM haloes.
The precision and accuracy of strong lens mass modeling depend on the number of multiple images and the availability of spectroscopic redshifts for them. In order to obtain reliable measurements, we limit our analysis to clusters with three or more sets of multiple images. Since we are interested in comparing shapes of dark matter distributions with those of BCGs, we need to identify the corresponding BCG for each halo component. Specifically, we define it as the brightest cluster member galaxy among those located near the centre of a halo component. We remove clusters if identifications of BCGs are not secure due to large offsets () between halo components and putative BCGs or no obvious bright galaxies near halo centres. Such situation can be seen in complex merging clusters such as MACSJ0717.5+3745 in HFF. Clusters listed in Table 1 and Appendix A are those after these selections of the number of multiple images and the secure BCG identification are applied.
In some of the 39 clusters in our cluster sample, there are more than one prominent halo components. If their model parameters are well constrained by strong lensing data and bright central galaxies are securely identified for them, we include multiple halo components from a single cluster separately in our analysis. Since 6 out of the 39 clusters have two separate “haloes”, we measure shapes of 45 DM haloes in total.
2.3 Ellipticities and position angles of BCGs
We measure shapes of 45 BCGs at the centres of DM haloes whose shapes are measured by strong lensing. For all the BCGs, we use HST images in F814W band and calculate ellipticities and position angles using a tensor method following Okabe et al. (2018) and Okabe et al. (2019). Specifically, we compute the mass tensor
| (2) |
where , , labels the two-dimensional coordinates of the image, denotes the F814W-band surface brightness of the BCG at the pixel (, ), and is the projected position relative to the centre of the surface brightness defined as
| (3) |
We start with an ellipse fit within a circle of a given radius, diagonalize the tensor to obtain the axis ratio and the position angle. We repeat the ellipse fit within an ellipse with the axis ratio from the previous fit. Fitting is repeated until the fractional difference of eigenvalues of the tensor between the previous and new fits becomes smaller than , and is adopted as the ellipticity of the BCG. From the converged mass tensor we also derive the position angle measured East of North. Since the surface brightness distribution of galaxies in the red wavelength reflects the stellar mass distribution reasonable well, we assume that the measured ellipticity and position angle corresponds to those of the stellar mass distribution in the BCG when comparing our results with simulations. We consider three radii, , 20, and 30 pkpc, where pkpc denotes kpc in physical (instead of comoving) scales, for the radius of the ellipse for fitting. The choice of the value is somewhat arbitrary but roughly corresponds to typical scales of BCGs. We measure ellipticities at the three scales in order to discuss the effect of satellite galaxies around the BCGs because we do not remove them in the ellipse fit procedure. Then we adopt 20 pkpc as a fiducial scale throughout the paper. We note that the average size of point spread function (PSF) of the HST images of milliarcseconds (e.g., Scoville et al., 2007; Koekemoer et al., 2007), corresponding to a physical scale of pc at the mean redshift of clusters , is much smaller than the ellipse scales, and thus the effect of PSF can be safely ignored in the ellipse fit procedure.
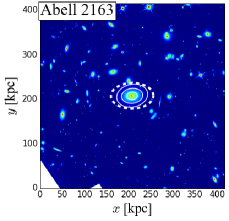
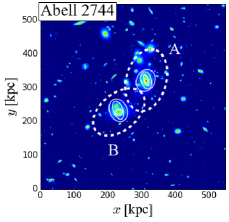
Figure 2 shows examples of F814W band HST images of single-peak (left) and double-peak (right) clusters. The ellipse scales of DM haloes in the figure are the Einstein radii for a typical source redshift probed by strong lensing method. As mentioned above, satellite galaxies in clusters indeed affect ellipse fits of BCGs such that their effects tend to be more significant for larger . Table 2 summarizes derived ellipticities and position angles of DM haloes and BCGs.
| survey | BCG name | ra | dec | ||||||||
|---|---|---|---|---|---|---|---|---|---|---|---|
| HFF | Abell 2744 A | ||||||||||
| HFF | Abell 2744 B | ||||||||||
| HFF | MACS0416.12403 A | ||||||||||
| HFF | MACS0416.12403 B | ||||||||||
| HFF | MACS1149.52223 | ||||||||||
| HFF | Abell S1063 | ||||||||||
| CLASH | Abell 209 | ||||||||||
| CLASH | Abell 383 | ||||||||||
| CLASH | MACS0329.70211 | ||||||||||
| CLASH | MACS0429.60253 | ||||||||||
| CLASH | MACS0744.93927 | ||||||||||
| CLASH | Abell 611 | ||||||||||
| CLASH | MACS1115.90129 | ||||||||||
| CLASH | Abell 1423 | ||||||||||
| CLASH | MACS1206.20847 | ||||||||||
| CLASH | MACS1311.00310 | ||||||||||
| CLASH | RXJ1347.51145 A | ||||||||||
| CLASH | RXJ1347.51145 B | ||||||||||
| CLASH | MACS1720.33536 | ||||||||||
| CLASH | Abell 2261 | ||||||||||
| CLASH | MACS1931.82635 | ||||||||||
| CLASH | RXJ2129.70005 | ||||||||||
| CLASH | MS 21372353 | ||||||||||
| CLASH | MACS0647.77015 | ||||||||||
| CLASH | MACS2129.40741 | ||||||||||
| RELICS | Abell 2163 | ||||||||||
| RELICS | Abell 2537 | ||||||||||
| RELICS | Abell 3192 | ||||||||||
| RELICS | Abell 697 | ||||||||||
| RELICS | Abell S295 A | ||||||||||
| RELICS | Abell S295 B | ||||||||||
| RELICS | ACT-CL J0102-49151 | ||||||||||
| RELICS | CL J0152.7-1357 | ||||||||||
| RELICS | MACS J0159.8-0849 | ||||||||||
| RELICS | MACS J0257.1-2325 | ||||||||||
| RELICS | MACS J0308.92645 | ||||||||||
| RELICS | MACSJ0417.5-1154 | ||||||||||
| RELICS | MACS J0553.4-3342 A | ||||||||||
| RELICS | MACS J0553.4-3342 B | ||||||||||
| RELICS | PLCK G171.9-40.7 | ||||||||||
| RELICS | PLCK G287.032.9 | ||||||||||
| RELICS | RXC J0142.94438 | ||||||||||
| RELICS | RXC J2211.7-0350 | ||||||||||
| RELICS | SPT-CL J0615-5746 A | ||||||||||
| RELICS | SPT-CL J0615-5746 B |
3 Ellipticities and alignment angles between dark matter haloes and BCGs in the HST cluster sample
Figure 3 shows the correlation between ellipticities of DM haloes from strong lensing method and those of BCGs from the HST images. The DM haloes are on average more elliptical than their BCGs. Specifically, the mean value of differences of ellipticities is , where and denote ellipticities of DM haloes measured by strong lensing and those of BCGs at the fiducial scale pkpc, respectively.444When we assume a more general form, , we obtain and . This result appears to be inconsistent with Okabe et al. (2018), who find that ellipticities of DM distribution and those of central galaxies of cluster-sized haloes are similar in the Horizon-AGN simulation despite with large scatters. We will make more careful comparison with the Horizon-AGN simulation in Section 4. Figure 3 also indicates that the correlation between and is not tight. This result is in line with Hashimoto et al. (2008), who showed that ellipticities of BCGs and X-ray surface brightness of their host clusters are not strongly correlated.
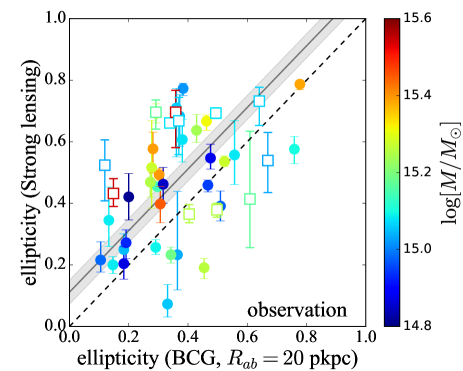
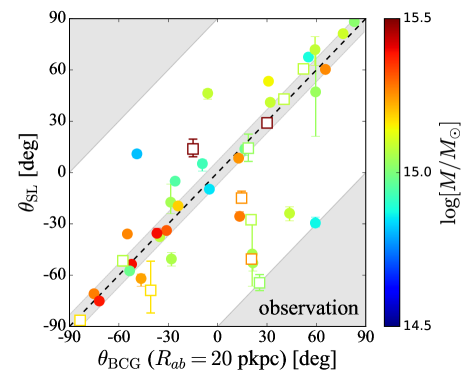
Figure 4 plots the correlation between position angles of DM haloes and BCGs, indicating that they are well aligned. This result is consistent with recent observational results by Harvey et al. (2019) which shows that the BCGs and DM haloes are well aligned with each other, and also is qualitatively consistent with those of cluster-sized haloes in the Horizon-AGN simulation shown in Okabe et al. (2018). We present further comparison with the Horizon-AGN simulation in Section 4.
Figures 5 and 6 show the redshift dependence of ellipticities of DM haloes and BCGs, respectively, which do not exhibit strong dependence on redshift. Figure 7 shows that the difference of ellipticities, , which also does not strongly depend on redshift.
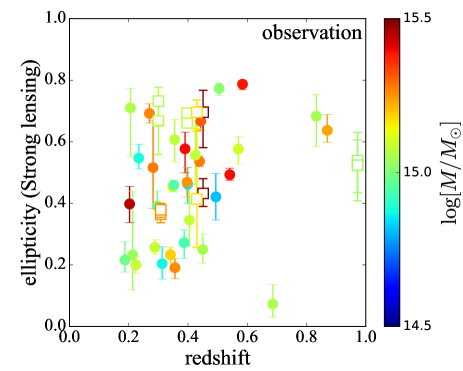
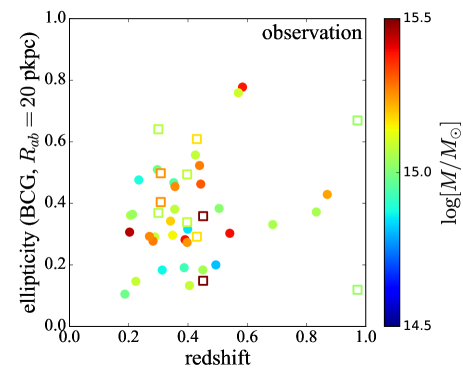
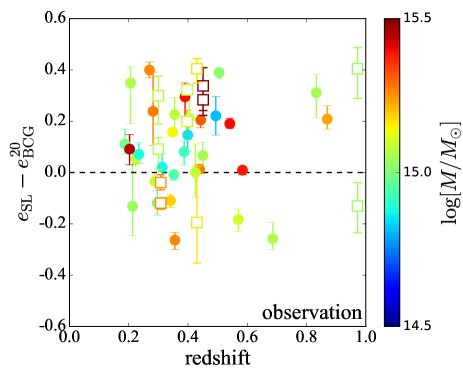
Figure 8 shows the redshift dependence of alignment angles between DM haloes and BCGs at pkpc. We find that the alignment angles do not strongly depend on redshift. Since we do not find significant redshift dependence for any observed quantities, we ignore the redshift dependence in the following analysis.

4 Comparison with Horizon-AGN simulation
Although we find that ellipticity values of DM haloes are on average larger than those of BCGs in galaxy clusters, they are similar in the Horizon-AGN simulation (Okabe et al., 2018). One possible explanation is due to the difference of mass scales between observations () and cluster-sized haloes in the Horizon-AGN simulation (). In order to check this possibility, we explore the mass dependence of DM haloes and central galaxies (CGs) in the Horizon-AGN simulation. Following Okabe et al. (2018) and Okabe et al. (2019), we refer to CGs as counterparts of BCGs in the simulation. Unfortunately, since there is no DM halo in the Horizon-AGN simulation whose mass is comparable to the observed galaxy clusters, we cannot directly compare the observation with the simulation. Nevertheless, we expect that the analysis of the mass dependence in the Horizon-AGN simulation may provide a clue to the origin of the difference.
In the Horizon-AGN simulation, we identify DM haloes using the ADAPTAHOP halo finder (Aubert et al., 2004; Tweed et al., 2009) and select all DM haloes with masses higher than , corresponding to massive galaxies. The masses of these haloes are defined by the Friend-of-Friend (FOF) mass which roughly corresponds to the virial mass. Since the redshift dependence of and both in the observations (see Section 3) and the simulation is weak, we choose a snapshot at redshift that is close to the mean value of redshifts of observed clusters, . The total number of DM haloes used for the analysis is 1265. In order to make a fair comparison with observations, we create projected particle distributions for each halo. We consider three different projection directions assuming -, -, and -axes as line-of-sight directions and regard these three projections as independent so that we effectively have DM haloes for our analysis.
We use the mass tensor (see Okabe et al., 2018; Okabe et al., 2019, for details) to fit the ellipse to both DM haloes and CGs from simulations. For DM haloes, we use only particles belonging to the most massive structure in the halo, where substructures are eliminated by ADAPTAHOP finder. This is because in our strong lensing analysis we model the cluster mass distribution by the sum of smooth DM halo components and cluster member galaxies (substructures) and derive DM halo shapes from those of the smooth DM halo components alone (see Section 2.2). In contrast, for the CGs in the simulation, we use all the stellar particles around the central region of the halo in projection because we do not exclude substructures in fitting to the observed BCGs (see Section 2.3). For the CGs, we extract all the stellar particles in a cube with size of (500 pkpc)3, create project images to use these particles, and perform the ellipse fit. We adopt , 20, and 30 pkpc for CGs in the same manner as in observations and 100 pkpc for DM haloes that matches the typical Einstein radii of the observed clusters. Even though both typical sizes of CGs and typical Einstein radii are smaller for haloes with smaller masses, we adopt these fixed radii for the ellipse fit independently of the halo mass, because we are mainly interested in the extrapolation of the simulation result to more massive haloes corresponding to observed clusters. We note that, while the ellipticity of DM haloes depend on the radius in DM only simulations (e.g., Allgood et al., 2006), the radial dependence is found to be much weaker in hydrodynamical simulations (e.g., Okabe et al., 2018). Thus in this paper we ignore the radial dependence of the shape of DM haloes for simplicity. Since the spatial resolution of the Horizon-AGN simulation of kpc is sufficiently small compared with the ellipse scales, we can safely ignore the effect of the spatial resolution in our analysis.
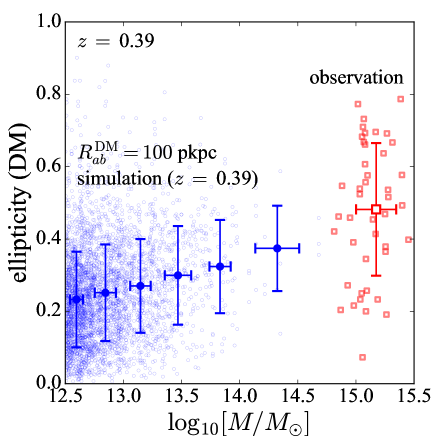
After we fit the ellipses for each halo in the simulation by the above procedure, we divide the haloes in 6 bins according to their DM halo masses, , , , , , and . We then compute mean values of ellipticities and alignment angles between DM haloes and CGs for each mass bin. Figure 9 shows mean values of ellipticities of DM haloes as a function of DM halo mass. There is a clear trend that shapes of DM haloes with higher mass are on average more elliptical than those with smaller masses. This result is qualitatively consistent with the result in e.g., Despali et al. (2014), who analysed three different cosmological simulations and investigated mass dependence of halo shapes. While their shape measurement is based on the three dimensional triaxial fitting and thus cannot be directly compared with our results, these DM only simulations also indicate that haloes with higher masses are more elongated (see their Figure 4). This is presumably because more massive DM haloes are dynamically young and still experiencing major mergers or smooth mass accretions along filaments (see also Okabe et al., 2019), whereas less massive ones form at earlier epochs and thus they have enough time to reach relaxation.
Mean value of ellipticities of observed clusters is also plotted in Figure 9. As expected, the observed value () is higher than those of DM haloes in the simulation, suggesting that the mass dependence of ellipticities might explain why for the observed clusters. Table 3 shows mean values of ellipticities of DM haloes. We also compute mean values of ellipticities for single- and double-peak clusters and find that double-peak clusters are more elongated than single-peak clusters. This is naturally understood because double-peak clusters are expected to be dynamically younger on average than single-peak clusters.
| [] | |||
| observation | all | ||
| single peak | |||
| double peak | |||
| HFF | |||
| CLASH | |||
| RELICS | |||
| simulation | |||
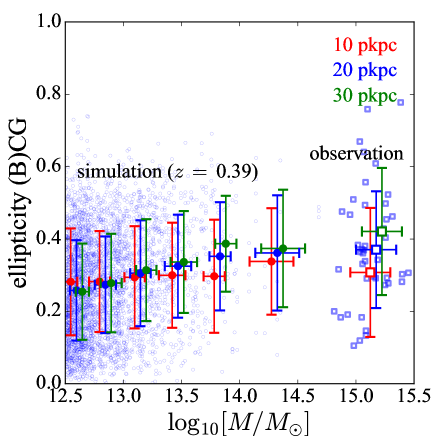
Figure 10 plots mean values of ellipticities of BCGs in observations and CGs in the simulation as a function of DM halo mass. For the scales of and 30 pkpc, we find the trend similar to DM haloes, whereas for 10 pkpc, mean values of ellipticities are almost constant against the halo mass in the simulation. For lower halo mass, the CG shapes are rounder at larger scales, whereas for higher mass, these are more elongated at larger scales. One possible reason of this result is that inner regions formed at the earlier epoch and have enough time to relax, and thus they are not affected by accretion or formation history and are independent of the host halo mass. Another possibility is the effect of satellite galaxies that tend to exist at larger scales and make ellipse more elongated.
Since we adopt the same tensor method for ellipse fit of observed BCGs and simulated CGs, they can be more directly compared unlike DM haloes. Figure 10 suggests that observed values can well be explained by the extrapolation of the simulation. Table 3 shows mean values of ellipticities of observed BCGs and CGs in the simulation. While double-peak clusters are more elongated than single-peak clusters in the outer region, 30 pkpc, their values are similar at 10 pkpc. This is presumably because stellar components in the inner region are tightly bound with each other, and thus their distributions are not affected by major mergers or mass accretions. Another possible explanation is that satellite galaxies are likely to be more abundant in double-peak clusters as they are dynamically younger and hence shape measurements of BCGs in the outer region are more severely affected by satellite galaxies.
| [] | [pkpc] | |||
| observation | all | 10 | ||
| 20 | ||||
| 30 | ||||
| single peak | 10 | |||
| 20 | ||||
| 30 | ||||
| double peak | 10 | |||
| 20 | ||||
| 30 | ||||
| HFF | 10 | |||
| 20 | ||||
| 30 | ||||
| CLASH | 10 | |||
| 20 | ||||
| 30 | ||||
| RELICS | 10 | |||
| 20 | ||||
| 30 | ||||
| simulation | 10 | |||
| 20 | ||||
| 30 | ||||
| 10 | ||||
| 20 | ||||
| 30 | ||||
| 10 | ||||
| 20 | ||||
| 30 | ||||
| 10 | ||||
| 20 | ||||
| 30 | ||||
| 10 | ||||
| 20 | ||||
| 30 | ||||
| 10 | ||||
| 20 | ||||
| 30 |
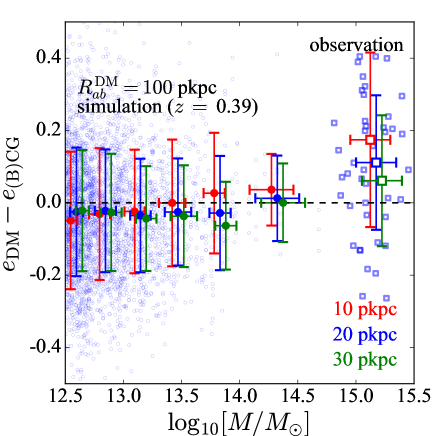
Figure 11 plots mean values of differences between ellipticities of DM haloes and those of observed BCGs and simulated CGs. While the mean values are close to zero in the simulation, those of observed values are significantly higher than zero, –. As we discussed in Section 3, this difference might be due to the difference of mass scales between observations and the simulation. Figure 11 suggests that there is no strong trend of the mean values against the halo mass in the simulation. There is, however, a weak trend of increasing particularly for pkpc, which might explain observed values by extrapolating the mass dependence. Since the mean ellipticies of are almost constant with mass and mean ellipticities of are not, the trend mainly comes from the mass dependence of .
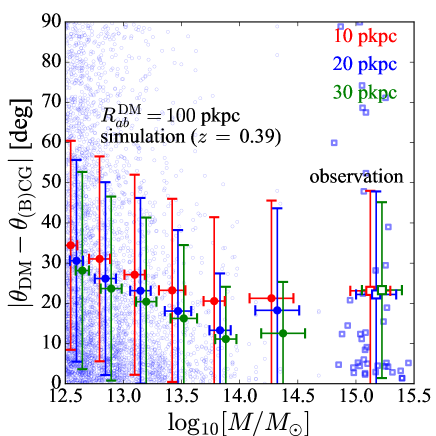
In addition to the mass dependence of ellipticities, we investigate that of alignment angles between DM haloes and CGs. Figure 12 plots mean values of the alignment angles. In the low mass region , there is a clear trend that the alignment becomes tighter with increasing masses. However, in the high mass region , the alignment appears to be constant independent of the mass increase. Table 5 summarizes mean values of the alignment angles.
| [] | [pkpc] | [deg] | ||
| observation | all | 10 | ||
| 20 | ||||
| 30 | ||||
| single peak | 10 | |||
| 20 | ||||
| 30 | ||||
| double peak | 10 | |||
| 20 | ||||
| 30 | ||||
| HFF | 10 | |||
| 20 | ||||
| 30 | ||||
| CLASH | 10 | |||
| 20 | ||||
| 30 | ||||
| RELICS | 10 | |||
| 20 | ||||
| 30 | ||||
| simulation | 10 | |||
| 20 | ||||
| 30 | ||||
| 10 | ||||
| 20 | ||||
| 30 | ||||
| 10 | ||||
| 20 | ||||
| 30 | ||||
| 10 | ||||
| 20 | ||||
| 30 | ||||
| 10 | ||||
| 20 | ||||
| 30 | ||||
| 10 | ||||
| 20 | ||||
| 30 |
5 Discussion
We find that the mean difference of ellipticities between DM haloes and BCGs in observations is . This seems inconsistent with the Horizon-AGN simulation results for which the mean value of the ellipticity difference is with DM halo mass of . We consider several possibilities to explain the difference, which are discussed below.
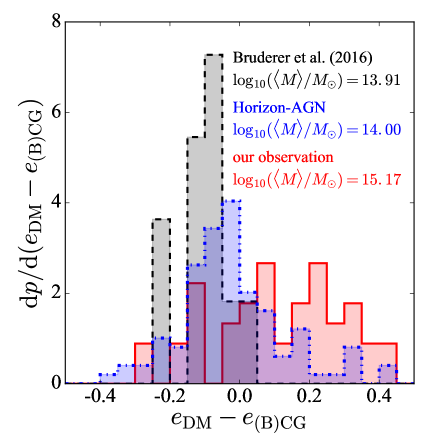
First, as already mentioned, a possible explanation comes from the difference of mass scales. Figure 9 indicates that ellipticities of DM haloes show a clear trend with mass and the observed value might be explained by the extrapolation of values in the simulation. Figure 10 shows that the observed ellipticity values of the BCGs can be explained by the extrapolation of the simulation, and thus the observed difference could also be explained by the mass dependence. Figure 11 indicates that the difference of ellipticities in the simulation shows a weak trend especially at the inner region such that the extrapolation of the trend may explain the observation. The possibility of this mass dependence may also be tested by other observations at smaller masses. Figure 13 compares the probability distributions of the ellipticity difference for our observation and the Horizon-AGN simulation with that of previous observational work by Bruderer et al. (2016), in which they measure projected shapes of 11 DM haloes by strong lensing and compare them with those of light profiles of the central galaxies. Since their definition of the ellipticity is different from ours, with and being lengths of semi-major and -minor axes, respectively, we convert their values to our definition. Their results show the opposite trend , implying that the mass dependence is strong (see also Rusu et al., 2016, for a similar result), although a caveat is that their strong lensing measurements probe radii smaller than 100 pkpc that we adopted in the simulation. Figure 13 also indicates that the probability distribution of the ellipticity difference in Bruderer et al. (2016) differs from that in the Horizon-AGN simulation with similar halo masses. More strong lens samples at different mass scales as well as simulations in larger box sizes are required to test this scenario further.
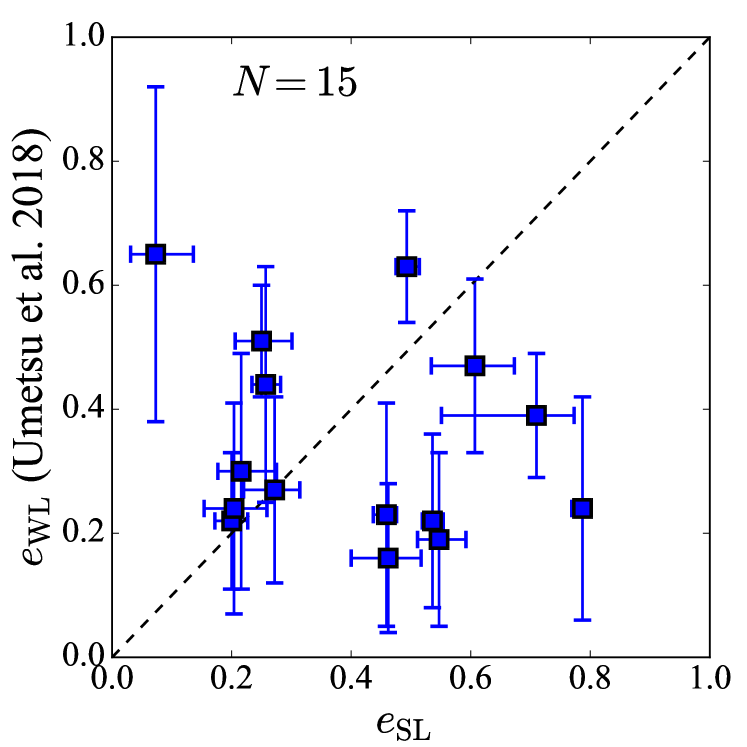
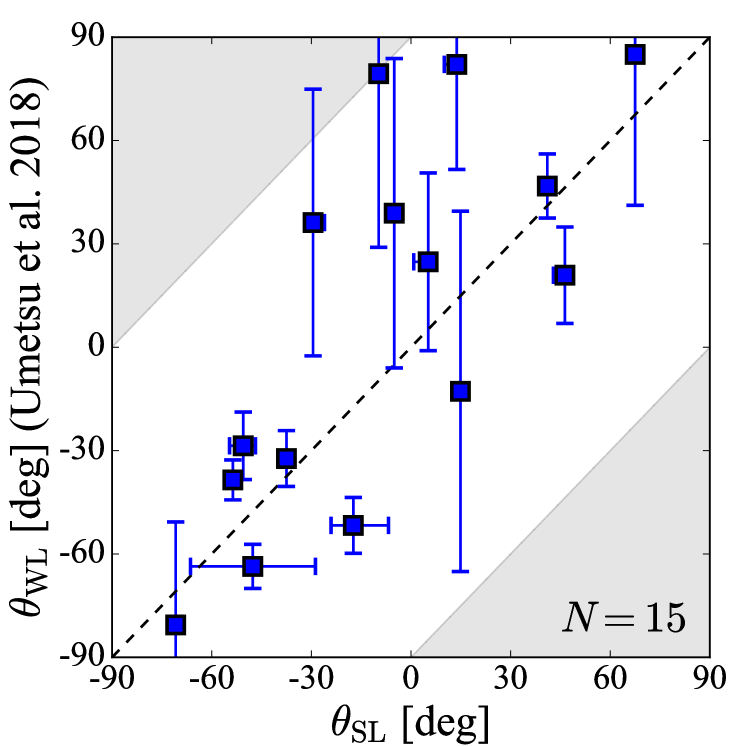
Second, another possibility is that the strong lensing method we use to measure ellipticities of DM haloes is biased such that it derives higher ellipticity values than those of real DM mass distributions. To check this possibility, Figure 15 compares our measurement values by strong lensing with those by weak lensing analysis (Umetsu et al., 2018) for 15 galaxy clusters whose ellipticities are evaluated by both strong and weak lensing, although a caveat is that strong and weak lensing probe different radii. The mean value estimated by strong lensing, , is higher than those by weak lensing, , although they are still consistent with each other within the errors. On the other hand, the comparison of position angles shown in Figure 16 indicates that both position angles are well aligned with each other despite the large errors for weak lensing measurements. Although we cannot draw any robust conclusion because weak and strong lensing measure ellipticities at different scales (see also e.g., Oguri et al., 2010; Harvey et al., 2019, for misalignment between inner and outer DM haloes), this result implies that the strong lensing method might slightly over-estimates ellipticities.
On the other hand, Meneghetti et al. (2017) compares real DM mass distributions with those inferred from various strong lensing methods by using simulated cluster images with mock multiple images which mimic the Hubble Frontier Field survey. This mock challenge demonstrated that if there are a sufficient number of multiple images (say ), strong lensing method accurately reproduces input DM mass distributions. In fact, our lensing method is one of the best methods to reproduce shapes of simulated haloes (see “GLAFIC” panel of their Figure 7). However, there are not many multiple images for some of the observed clusters (see Appendix A), for which derived ellipticities might be biased.
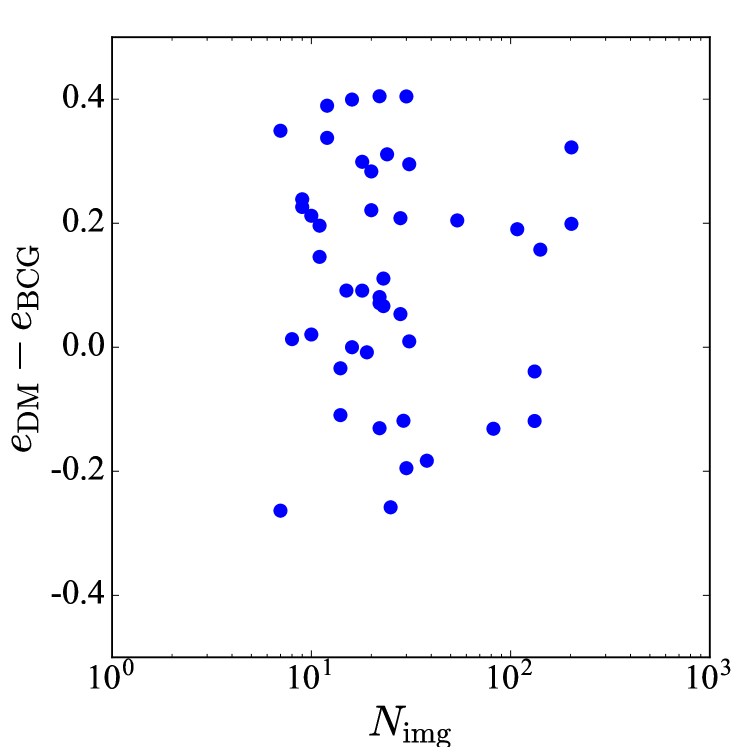
To check this possibility, in Figure 14 we compare ellipticity differences with the number of multiple images used for strong lens mass modeling. While the lack of any systematic correlation in Figure 14 suggests that such bias in measured ellipticity values from strong lensing may not be significant, future studies to validate strong lensing methods to measure ellipticities are warranted (see Harvey et al., 2019, for another validation test). Another possible systematic effect comes from the number of dark matter haloes that is allowed to vary in strong lens mass modeling. In the GLAFIC mass modeling, the number of haloes corresponds to the minimum number of haloes that leads to a reasonable fit to multiple image positions (see Kawamata et al., 2016), but such ellipticity measurements may be biased if the number of halos is not corresponding to the underlying mass distribution (see e.g., Lagattuta et al., 2017). This issues should also be explored carefully in validating strong lensing methods to measure ellipticities.
Finally, there are also some other possible explanations. One is the difference of ellipticities between DM haloes and BCGs might be explained by selection effects. For instance, all the clusters in HFF and a small fraction of clusters in CLASH and RELICS are selected based on their strong lensing features. Since projected mass distributions of clusters having large Einstein radii are rounder because they are preferentially elongated along the line-of-sight direction (Oguri & Blandford, 2009), this selection effect might also affect the statistics of the ellipticity difference studied in this paper. In addition, a large fraction of the CLASH clusters are selected such that their shapes are round in X-ray images, which also represents a biased cluster population. Although Tables 3 and 4 show that mean values of ellipticities of CLASH clusters are indeed smaller than in the other surveys, we find that differences of ellipticities between DM haloes and BCGs for these three surveys are consistent within error-bars, (HFF), (CLASH), and (RELICS). Therefore selection effects do not provide convincing explanation for our finding, although it is important to check ellipticities of DM haloes and BCGs for several different cluster samples to strengthen our conclusion on the measurements.
It is also possible that the Horizon-AGN simulation produces DM haloes or CGs with their shapes that are different from their true shapes in observations due to an imperfect modeling of baryon physics. Although the Horizon-AGN simulation is successful in explaining various observations (Chisari et al., 2015; Dubois et al., 2016; Volonteri et al., 2016; Chisari et al., 2016; Kaviraj et al., 2017; Peirani et al., 2017; Suto et al., 2017; Chisari et al., 2018; Martin et al., 2018; Choi et al., 2018; Okabe et al., 2018; Peirani et al., 2019; Habouzit et al., 2019), the implemented baryon physics is never perfect and the change of details of baryon physics may change quantitative results on halo shapes in simulations (see e.g., Suto et al., 2017, and references therein). Turning the problem around, we may be able to test the baryon physics such as AGN feedback by observations of ellipticities (see also Lau et al., 2012).
The remaining possibility is that the CDM model is not correct. Although the standard CDM model has passed many observational tests there remains several challenges at small-scales that need to be resolved (e.g., Bullock & Boylan-Kolchin, 2017). For example, the self-interacting dark matter (SIDM) model is proposed as one of the possibilities to solve small-scale problems (e.g., Spergel & Steinhardt, 2000; Tulin & Yu, 2018), although Robertson et al. (2019) investigate halo shapes by using cosmological simulations including both baryon physics and SIDM to show that the difference of ellipticities between collisionless and SIDM haloes become larger in the inner region such that SIDM haloes are on average rounder. Therefore it appears that SIDM cannot reconcile the difference between observations and Horizon-AGN simulation, but there may be other DM scenarios that better explain the observations.
While we cannot draw any robust conclusion on which scenario is correct, our observations can be regarded as new constraints on structure formation scenarios including dark matter models, theories of modified gravity, and cluster astrophysics.
6 Summary
In this paper, we have presented new measurements of ellipticities and position angles of galaxy clusters selected from three deep imaging surveys by HST, HFF, CLASH, and RELICS. The measurements of cluster shapes are based on detailed strong lensing analyses, from which we have derived shapes for 45 DM haloes in 39 galaxy clusters. Six of the 39 clusters have double peaks, for which we have measured shapes of individual DM peaks separately. In addition to DM haloes, we have also measured shapes of the BCG of each DM halo by diagonalizing the surface brightness tensor computed from F814W-band HST images.
We have obtained the mean value of ellipticities of DM haloes, , and those of BCGs, , , and at , 20, and 30 pkpc, respectively. We have found that DM haloes are on average more elongated than BCGs with mean value of differences of their ellipticities of . The ellipticities of DM haloes and BCGs, and their differences do not strongly depend on the redshift. We have also found that orientations of DM haloes and BCGs are well aligned with each other and the degree of alignment is almost independent of the redshift. Mean values of the alignment angles are , , and deg at , 20, and 30 pkpc, respectively.
To interpret our observed results, we have computed projected shapes of DM haloes and CGs in the Horizon-AGN simulation. We have extracted 1265 DM haloes with FOF mass higher than at and created projected particle distributions. We regard three different projection directions as independent to obtain 3795 projected DM haloes in our analysis. Since in the Horizon-AGN simulation there is no halo whose mass scale is comparable to those of observed galaxy clusters, , we have focused on the mass dependence of shapes in the range of . We have computed ellipticities by a tensor method for DM haloes without substructure and for CGs with substructures for a fair comparison with observations.
We have found that, for DM haloes, there is a clear trend that ellipticities become higher with increasing halo masses. Their mean values increase from at to at . Ellipticities of BCGs show the similar but weaker trend for the outer regions and 30 pkpc, whereas ellipticities are almost constant against the host halo mass in the inner region pkpc. Putting together, we have found that differences of ellipticities between DM haloes and CGs almost vanish on average. We have also found that the DM haloes and the CGs are well aligned with each other and the degree of the alignment exhibits the mass dependence such that the alignment becomes tighter with increasing halo masses. Mean values change from deg at to deg at . For all mass bins, the inner region of CGs shows tighter alignment than outer regions.
One of our main results is that observed values of the difference between ellipticities of DM haloes and BCGs, , are on average larger than zero, which differs from the result of the Horizon-AGN simulation for which the average difference is consistent with zero. We note that our results appear to be consistent with Gonzalez et al. (2005), who find that position angles of intracluster light (ICL) distributions tend to be aligned well with those of BCGs and ICL distributions are more elongated than BCGs, if we assume that ICL distributions trace DM distributions as suggested by e.g., Montes & Trujillo (2019). We have discussed possible reasons for the difference between observations and the Horizon-AGN simulation in Section 5. To discriminate different scenarios, however, future studies in both observations and simulations are needed. For the simulation side, larger box sizes are required so as to include higher mass haloes and also an exploration of baryon physics possibly to improve it. For the observational side, future large surveys such as the Subaru Hyper Suprime-Cam (HSC) 111https://hsc.mtk.nao.ac.jp/ssp/ (e.g., Miyazaki et al., 2018a, b; Oguri et al., 2018; Mandelbaum et al., 2018) and the Large Synoptic Survey Telescope (LSST) 222https://www.lsst.org/ (e.g., LSST Science Collaboration et al., 2009; Ivezić et al., 2019), as well as deep imaging by space telescopes such as the James Webb Space Telescope (JWST) 333https://www.jwst.nasa.gov/ (e.g., Gardner et al., 2006), the Wide Field Infrared Survey Telescope (WFIRST) 444https://wfirst.gsfc.nasa.gov/, the Euclid 555https://sci.esa.int/web/euclid/ would help to extend samples of strong lensing clusters and improve strong lensing constraints for individual clusters.
Acknowledgements
We would like to thank Masahiro Takada and Massimo Meneghetti for useful discussions and comments. We also thank the anonymous referee for useful comments and suggestions. T.O. is supported by Advanced Leading Graduate Course for Photon Science (ALPS) at the University of Tokyo. This work is supported partly by JSPS Core-to-Core Program “International Network of Planetary Sciences”. This work is supported in part by Japan Society for the Promotion of Science (JSPS) KAKENHI Grant Number JP17J05056 (T.O.), JP18K03693 (M.O.), JP15H05892 (M.O.), JP17K14273 (T.N.), JP18K03704 (T.K.), and JP18H01247 (Y.S.). T.N. acknowledges Japan Science and Technology Agency (JST) CREST Grant Number JPMJCR1414.
References
- Acebron et al. (2018) Acebron A., et al., 2018, ApJ, 858, 42
- Acebron et al. (2019) Acebron A., et al., 2019, ApJ, 874, 132
- Allgood et al. (2006) Allgood B., Flores R. A., Primack J. R., Kravtsov A. V., Wechsler R. H., Faltenbacher A., Bullock J. S., 2006, MNRAS, 367, 1781
- Arnaud et al. (2007) Arnaud M., Pointecouteau E., Pratt G. W., 2007, A&A, 474, L37
- Aubert et al. (2004) Aubert D., Pichon C., Colombi S., 2004, MNRAS, 352, 376
- Bartelmann (1996) Bartelmann M., 1996, A&A, 313, 697
- Binggeli (1982) Binggeli B., 1982, A&A, 107, 338
- Bruderer et al. (2016) Bruderer C., Read J. I., Coles J. P., Leier D., Falco E. E., Ferreras I., Saha P., 2016, MNRAS, 456, 870
- Bullock & Boylan-Kolchin (2017) Bullock J. S., Boylan-Kolchin M., 2017, ARA&A, 55, 343
- Caminha et al. (2017) Caminha G. B., et al., 2017, A&A, 607, A93
- Caminha et al. (2019) Caminha G. B., et al., 2019, arXiv e-prints, p. arXiv:1903.05103
- Cerny et al. (2018) Cerny C., et al., 2018, ApJ, 859, 159
- Chisari et al. (2015) Chisari N., et al., 2015, MNRAS, 454, 2736
- Chisari et al. (2016) Chisari N., et al., 2016, MNRAS, 461, 2702
- Chisari et al. (2018) Chisari N. E., et al., 2018, MNRAS, 480, 3962
- Choi et al. (2018) Choi H., Yi S. K., Dubois Y., Kimm T., Devriendt J. E. G., Pichon C., 2018, ApJ, 856, 114
- Cibirka et al. (2018) Cibirka N., et al., 2018, ApJ, 863, 145
- Clampitt & Jain (2016) Clampitt J., Jain B., 2016, MNRAS, 457, 4135
- Coe et al. (2019) Coe D., et al., 2019, ApJ, 884, 85
- Despali et al. (2014) Despali G., Giocoli C., Tormen G., 2014, MNRAS, 443, 3208
- Donahue et al. (2016) Donahue M., et al., 2016, ApJ, 819, 36
- Dubois et al. (2014) Dubois Y., et al., 2014, MNRAS, 444, 1453
- Dubois et al. (2016) Dubois Y., Peirani S., Pichon C., Devriendt J., Gavazzi R., Welker C., Volonteri M., 2016, MNRAS, 463, 3948
- Ebeling et al. (2017) Ebeling H., Qi J., Richard J., 2017, MNRAS, 471, 3305
- Eisenstein et al. (2005) Eisenstein D. J., et al., 2005, ApJ, 633, 560
- Evans & Bridle (2009) Evans A. K. D., Bridle S., 2009, ApJ, 695, 1446
- Gardner et al. (2006) Gardner J. P., et al., 2006, Space Sci. Rev., 123, 485
- Gonzalez et al. (2005) Gonzalez A. H., Zabludoff A. I., Zaritsky D., 2005, ApJ, 618, 195
- Habouzit et al. (2019) Habouzit M., Volonteri M., Somerville R. S., Dubois Y., Peirani S., Pichon C., Devriendt J., 2019, MNRAS, 489, 1206
- Harvey et al. (2019) Harvey D., Tam S.-I., Jauzac M., Massey R., Rhodes J., 2019, arXiv e-prints, p. arXiv:1911.06333
- Hashimoto et al. (2008) Hashimoto Y., Henry J. P., Boehringer H., 2008, MNRAS, 390, 1562
- Hsu et al. (2013) Hsu L.-Y., Ebeling H., Richard J., 2013, MNRAS, 429, 833
- Ivezić et al. (2019) Ivezić Ž., et al., 2019, ApJ, 873, 111
- Jing & Suto (2002) Jing Y. P., Suto Y., 2002, ApJ, 574, 538
- Kaviraj et al. (2017) Kaviraj S., et al., 2017, MNRAS, 467, 4739
- Kawahara (2010) Kawahara H., 2010, ApJ, 719, 1926
- Kawamata et al. (2016) Kawamata R., Oguri M., Ishigaki M., Shimasaku K., Ouchi M., 2016, ApJ, 819, 114
- Kawamata et al. (2018) Kawamata R., Ishigaki M., Shimasaku K., Oguri M., Ouchi M., Tanigawa S., 2018, ApJ, 855, 4
- Kazantzidis et al. (2004) Kazantzidis S., Kravtsov A. V., Zentner A. R., Allgood B., Nagai D., Moore B., 2004, ApJ, 611, L73
- Koekemoer et al. (2007) Koekemoer A. M., et al., 2007, ApJS, 172, 196
- Komatsu et al. (2011) Komatsu E., et al., 2011, ApJS, 192, 18
- LSST Science Collaboration et al. (2009) LSST Science Collaboration et al., 2009, arXiv e-prints, p. arXiv:0912.0201
- Lagattuta et al. (2017) Lagattuta D. J., et al., 2017, MNRAS, 469, 3946
- Lau et al. (2012) Lau E. T., Nagai D., Kravtsov A. V., Vikhlinin A., Zentner A. R., 2012, ApJ, 755, 116
- Lotz et al. (2017) Lotz J. M., et al., 2017, ApJ, 837, 97
- Mahler et al. (2019) Mahler G., et al., 2019, ApJ, 873, 96
- Mandelbaum et al. (2018) Mandelbaum R., et al., 2018, PASJ, 70, S25
- Martin et al. (2018) Martin G., Kaviraj S., Devriendt J. E. G., Dubois Y., Pichon C., Laigle C., 2018, MNRAS, 474, 3140
- Meneghetti et al. (2017) Meneghetti M., et al., 2017, MNRAS, 472, 3177
- Miyazaki et al. (2018a) Miyazaki S., et al., 2018a, PASJ, 70, S1
- Miyazaki et al. (2018b) Miyazaki S., et al., 2018b, PASJ, 70, S27
- Montes & Trujillo (2019) Montes M., Trujillo I., 2019, MNRAS, 482, 2838
- Navarro et al. (1997) Navarro J. F., Frenk C. S., White S. D. M., 1997, ApJ, 490, 493
- Oguri (2010) Oguri M., 2010, PASJ, 62, 1017
- Oguri & Blandford (2009) Oguri M., Blandford R. D., 2009, MNRAS, 392, 930
- Oguri et al. (2010) Oguri M., Takada M., Okabe N., Smith G. P., 2010, MNRAS, 405, 2215
- Oguri et al. (2012) Oguri M., Bayliss M. B., Dahle H., Sharon K., Gladders M. D., Natarajan P., Hennawi J. F., Koester B. P., 2012, MNRAS, 420, 3213
- Oguri et al. (2018) Oguri M., et al., 2018, PASJ, 70, S20
- Okabe et al. (2018) Okabe T., Nishimichi T., Oguri M., Peirani S., Kitayama T., Sasaki S., Suto Y., 2018, MNRAS, 478, 1141
- Okabe et al. (2019) Okabe T., et al., 2019, arXiv e-prints, p. arXiv:1911.04653
- Paterno-Mahler et al. (2018) Paterno-Mahler R., et al., 2018, ApJ, 863, 154
- Peirani et al. (2017) Peirani S., et al., 2017, MNRAS, 472, 2153
- Peirani et al. (2019) Peirani S., et al., 2019, MNRAS, 483, 4615
- Perlmutter et al. (1999) Perlmutter S., et al., 1999, ApJ, 517, 565
- Peter et al. (2013) Peter A. H. G., Rocha M., Bullock J. S., Kaplinghat M., 2013, MNRAS, 430, 105
- Planck Collaboration et al. (2016) Planck Collaboration et al., 2016, A&A, 594, A13
- Postman et al. (2012) Postman M., et al., 2012, ApJS, 199, 25
- Richard et al. (2010) Richard J., et al., 2010, MNRAS, 404, 325
- Riess et al. (1998) Riess A. G., et al., 1998, AJ, 116, 1009
- Robertson et al. (2019) Robertson A., Harvey D., Massey R., Eke V., McCarthy I. G., Jauzac M., Li B., Schaye J., 2019, MNRAS, 488, 3646
- Rusu et al. (2016) Rusu C. E., et al., 2016, MNRAS, 458, 2
- Scoville et al. (2007) Scoville N., et al., 2007, ApJS, 172, 38
- Shin et al. (2018) Shin T.-h., Clampitt J., Jain B., Bernstein G., Neil A., Rozo E., Rykoff E., 2018, MNRAS, 475, 2421
- Spergel & Steinhardt (2000) Spergel D. N., Steinhardt P. J., 2000, Physical Review Letters, 84, 3760
- Spergel et al. (2003) Spergel D. N., et al., 2003, ApJS, 148, 175
- Suto et al. (2017) Suto D., Peirani S., Dubois Y., Kitayama T., Nishimichi T., Sasaki S., Suto Y., 2017, PASJ, 69, 14
- Tulin & Yu (2018) Tulin S., Yu H.-B., 2018, Phys. Rep., 730, 1
- Tweed et al. (2009) Tweed D., Devriendt J., Blaizot J., Colombi S., Slyz A., 2009, A&A, 506, 647
- Ueda et al. (2018) Ueda S., et al., 2018, ApJ, 866, 48
- Umetsu et al. (2018) Umetsu K., et al., 2018, ApJ, 860, 104
- Volonteri et al. (2016) Volonteri M., Dubois Y., Pichon C., Devriendt J., 2016, MNRAS, 460, 2979
- West et al. (2017) West M. J., de Propris R., Bremer M. N., Phillipps S., 2017, Nature Astronomy, 1, 0157
- Yoshida et al. (2000) Yoshida N., Springel V., White S. D. M., Tormen G., 2000, ApJ, 535, L103
- Zitrin et al. (2011) Zitrin A., Broadhurst T., Barkana R., Rephaeli Y., Benítez N., 2011, MNRAS, 410, 1939
- Zitrin et al. (2015) Zitrin A., et al., 2015, ApJ, 801, 44
- Zitrin et al. (2017) Zitrin A., et al., 2017, ApJ, 839, L11
- van Uitert et al. (2017) van Uitert E., et al., 2017, MNRAS, 467, 4131
Appendix A Strong lens mass models
Strong lens mass models that are used in the analysis of this paper are summarized in Table 6. All the mass models are constructed using the software glafic (Oguri, 2010). The mass models of HFF clusters have already been presented in Kawamata et al. (2016) and Kawamata et al. (2018), whereas those of CLASH and RELICS clusters have not been published elsewhere.
We follow Kawamata et al. (2016) for mass modeling procedure of CLASH and RELICS clusters. We assume simply parametrized mass models that consist of halo components modeled by an elliptical NFW profile and cluster galaxies modeled by an elliptical pseudo-Jaffe profile. To reduce the number of parameters, we assume scaling relations between galaxy luminosities and model parameters (velocity dispersions and truncation radii) of the pseudo-Jaffe profile. Ellipticities and position angles of cluster member galaxies are fixed to measured values of their light profiles, whereas ellipticities and position angles of halo components are treated as free parameters. We may also add external perturbations to the lens potential. We start with a simple mass model, and keep adding more halo components or external perturbations until we obtain reasonably good fit. Interested readers are referred to Kawamata et al. (2016) for more details.
We optimize model parameters so that the model can reproduce positions of multiple images. We rely on previous work as listed in Table 6 for identifications of multiple images and spectroscopic redshift information for some of them. Positional uncertainties of multiple images are set so as to achieve reasonably good fit i.e., reduced being of order one. is defined by differences of observed and model-predicted image positions evaluated in the source plane (see Appendix 2 of Oguri, 2010, for more details). The minimum for our best-fitting models are listed in Table 6. Errors of model parameters are estimated using the Markov chain Monte Carlo method.
| Survey | Cluster name | [′′] | /dof | References | |||
|---|---|---|---|---|---|---|---|
| HFF | Abell 2744 | 45 | 24 | 132 | 0.4 | 130.2/134 | 1 |
| HFF | MACSJ0416.12403 | 75 | 34 | 202 | 0.4 | 240.0/196 | 1 |
| HFF | MACSJ1149.5+2223 | 36 | 16 | 108 | 0.4 | 100.1/103 | 2 |
| HFF | Abell S1063 | 53 | 19 | 141 | 0.4 | 136.2/138 | 1 |
| CLASH | Abell 209 | 3 | 0 | 7 | 0.8 | 2.8/1 | 3,4 |
| CLASH | Abell 383 | 8 | 6 | 23 | 0.4 | 22.5/18 | 3,4 |
| CLASH | MACSJ0329.70211 | 9 | 8 | 23 | 0.4 | 16.3/12 | 5,4 |
| CLASH | MACSJ0429.60253 | 3 | 2 | 11 | 0.4 | 7.2/9 | 5,4 |
| CLASH | MACSJ0744.9+3927 | 10 | 0 | 25 | 0.4 | 6.7/8 | 3,4 |
| CLASH | Abell 611 | 3 | 2 | 14 | 0.4 | 11.6/12 | 3,4 |
| CLASH | MACSJ1115.9+0129 | 3 | 1 | 9 | 0.6 | 4.9/3 | 5,4 |
| CLASH | MACSJ1206.2-0847 | 27 | 27 | 82 | 0.4 | 79.9/83 | 6,4 |
| CLASH | MACSJ1311.00310 | 3 | 1 | 8 | 0.6 | 7.2/4 | 5,4 |
| CLASH | RXJ1347.51145 | 8 | 4 | 20 | 0.4 | 1.9/4 | 7,5,4 |
| CLASH | MACSJ1423.8+2404 | 3 | 2 | 12 | 0.8 | 6.9/9 | 3,4 |
| CLASH | MACSJ1720.3+3536 | 7 | 0 | 22 | 0.6 | 16.1/14 | 3,4 |
| CLASH | Abell 2261 | 11 | 0 | 28 | 0.4 | 13.4/13 | 3,4 |
| CLASH | MACSJ1931.82635 | 7 | 7 | 19 | 0.4 | 17.9/12 | 5,4 |
| CLASH | RXJ2129.7+0005 | 7 | 7 | 22 | 0.4 | 17.1/21 | 5,4 |
| CLASH | MS21372353 | 3 | 3 | 10 | 0.6 | 5.7/6 | 3,4 |
| CLASH | MACSJ0647.8+7015 | 11 | 0 | 31 | 0.4 | 24.3/20 | 3,4 |
| CLASH | MACSJ2129.40741 | 11 | 11 | 38 | 0.6 | 45.6/37 | 5,4 |
| RELICS | Abell 2163 | 4 | 0 | 15 | 0.4 | 6.6/12 | 8,4 |
| RELICS | Abell 2537 | 8 | 1 | 29 | 0.6 | 16.1/23 | 8,4 |
| RELICS | Abell 3192 | 5 | 2 | 16 | 0.8 | 7.4/6 | 9,4 |
| RELICS | Abell 697 | 3 | 0 | 9 | 0.4 | 6.7/6 | 10,4 |
| RELICS | Abell S295 | 6 | 4 | 18 | 0.4 | 5.4/13 | 10,4 |
| RELICS | ACT-CL J010249151 | 10 | 0 | 28 | 0.6 | 17.6/15 | 8,4 |
| RELICS | CL J0152.71357 | 8 | 1 | 24 | 0.4 | 8.1/16 | 11,4 |
| RELICS | MACSJ0159.80849 | 4 | 0 | 10 | 0.6 | 5.6/4 | 10,4 |
| RELICS | MACSJ0257.12325 | 4 | 0 | 12 | 0.4 | 10.1/7 | 12,4 |
| RELICS | MACSJ0308.9+2645 | 3 | 0 | 7 | 0.4 | 0.7/1 | 13,4 |
| RELICS | MACSJ0417.51154 | 20 | 7 | 54 | 0.4 | 29.4/40 | 14,4 |
| RELICS | MACSJ0553.43342 | 10 | 2 | 30 | 0.8 | 29.9/25 | 15,4 |
| RELICS | PLCK G171.940.7 | 5 | 0 | 16 | 0.4 | 11.7/7 | 13,4 |
| RELICS | PLCK G308.320.2 | 11 | 0 | 31 | 0.6 | 17.8/18 | 16,4 |
| RELICS | RXC J0142.9+4438 | 4 | 0 | 14 | 0.4 | 8.8/9 | 8,4 |
| RELICS | RXC J2211.70350 | 3 | 1 | 11 | 0.4 | 2.7/3 | 8,4 |
| RELICS | SPT-CL J06155746 | 6 | 5 | 22 | 0.4 | 5.2/17 | 17,4 |