Temperature dependence of the
optical properties of silicon
nanocrystals
Abstract
Silicon nanocrystals (SiNCs) have been under active investigation in the last decades and have been considered as a promising candidate for many optoelectronic applications including highly-efficient solar cells. Some of the fundamental properties of interest in these nanostructures is the temperature dependence of their optical absorption onset, and how this is controlled by different passivation regimes. In the present work we employ first-principles calculations in conjunction with the special displacement method to study the temperature dependence of the band gap renormalization of free-standing hydrogen-terminated, and oxidized SiNCs, as well as matrix-embedded SiNCs in amorphous silica, and we obtain good agreement with experimental photoluminescence data. We also provide strong evidence that the electron-phonon interplay at the surface of the nanocrystal is suppressed by oxidation and the surrounding amorphous matrix. For the matrix-embedded SiNCs, we show a high correlation between the temperature dependence of the band gap and the Si-Si strained bonds. This result emphasizes the immanent relationship of electron-phonon coupling and thermal structural distortions. We also demonstrate that, apart from quantum confinement, Si-Si strained bonds are the major cause of zero-phonon quasidirect transitions in matrix-embedded SiNCs. As a final point, we clarify that, unlike optical absorption in bulk Si, phonon-assisted electronic transitions play a secondary role in SiNCs.
pacs:
PACS: 71.15.Mb, 78.67.BfI Introduction
Over the last decades, quantum confined semiconductors based on silicon have drawn great scientific attention owing to their unique electronic and optical properties. In this regard, silicon nanocrystals (SiNCs) have enabled interesting technological applications, including optoelectronic devices Pavesi et al. (2000); Kai-Yuan et al. (2011); Wang et al. (2018); Zhenyi et al. (2019), quantum dot sensors Gonzalez and Veinot (2016); Julian et al. (2018), photodetectors Nayfeh et al. (2005); Kim et al. (2009); Martuza et al. (2018) and bioimaging devices McVey and Tilley (2014); McVey et al. (2018). Despite the numerous investigations in SiNCs, either free-standing or matrix-embedded, our understanding on the temperature dependence of their absorption onset and band gap renormalization remains incomplete. This topic is of fundamental and practical interest for optimizing the efficiency of next generation solar cells Conibeer et al. (2008); Luo et al. (2011); Zhao et al. (2016); Mazzarella et al. (2019); Mazzaro et al. (2019), and silicon-based photonics Yuan et al. (2009); Valenta et al. (2019).
Various temperature-dependent photoluminescence (PL) measurements of SiNCs have been reported Heitmann et al. (2004); Wang et al. (2005); Rinnert et al. (2009); Hartel et al. (2012); Ksová et al. (2012). It has been found that the energies of PL peaks of matrix-embedded SiNCs in amorphous silica (a-SiO2) exhibit a Varshni behavior Varshni (1967), following closely the band gap renormalization of bulk Si. However, the origin of this observation is still unclear. Ksová et al. [Ksová et al., 2012] have reported temperature-dependent PL spectra of free-standing oxide-passivated SiNCs. Their results reveal that, as the temperature increases, the PL energy shift of free-standing SiNCs is significantly larger than the corresponding shift of matrix-embedded SiNCs. This difference has been attributed solely to compressive strain exerted on the nanocrystals by the a-SiO2 matrix, ignoring the effect of atomic vibrations on the electronic structure.
The interaction of electrons with quantized atomic vibrations, namely the electron-phonon coupling, is the underlying mechanism associated with temperature-dependent optical properties of materials Giustino (2017). In particular, electron-phonon coupling is responsible, among others, for the quantum zero-point renormalization and temperature dependence of the electronic energy levels. This latter effect determines the thermally induced energy shifts of the absorption onset in bulk and nanostructured semiconductors.
In this study we rely on a recently developed methodology Zacharias and Giustino (2016, 2020), namely the special displacement method (SDM), and present first-principles calculations of temperature-dependent band gaps of SiNCs. We demonstrate that the electron-phonon coupling leads to a larger band gap renormalization in free-standing than matrix-embedded SiNCs. To explain this difference we also calculate Eliashberg spectral functions and analyze the contribution to the band gap renormalization from individual phonon modes. Importantly, our results reveal that surface oxidation and embedding strongly suppress the coupling of electrons with phonons at the surface of the SiNC. Our findings also confirm that the band gap renormalization of the SiNC/a-SiO2 system is in good agreement with the Varshni-like temperature-dependence of bulk Si.
In addition to modifying the band structure, the electron-phonon coupling plays an important role in optical absorption leading to phonon-assisted electronic transitions. For example, in indirect gap crystals, optical transitions between the band extrema require the participation of a phonon to satisfy the momentum conservation rule. In nanocrystals made of indirect gap solids, however, the intensity of the absorption onset is also determined by zero-phonon quasidirect recombination that breaks the momentum conservation rule. This effect has been found to be pronounced in SiNCs, especially in relatively small size clusters Hybertsen (1994); Kovalev et al. (1998); Lee et al. (2016).
Quantum confinement (QC) is the primary factor controlling quasidirect transitions. However, the absorption onset of SiNC structures is found to be consistently well below the quantum confined band gap Luppi and Ossicini (2005). Various suggestions have been made in this respect. These are based on oxygen-related surface/interface states Wolkin et al. (1999); Luppi and Ossicini (2005); Hadjisavvas and Kelires (2007); Lee et al. (2012), chemical passivation by other ligands Dohnalová et al. (2014), strained Si-Si bonds at the interface layer Allan et al. (1996); Hadjisavvas and Kelires (2004); Lee et al. (2012), and interface scattering Lee et al. (2016).
In this manuscript, we also report results of first-principles calculations that unambiguously identify some of the main sources of quasidirect transitions in the SiNC/a-SiO2 system, and clarify the role of each of its components (NC core, interface, matrix). This is made possible by the decomposition of density of states and optical absorption into atomic contributions, probing in this way the optical response of individual sites and local areas in the system. Our results show that, apart from QC, the dominant source of quasidirect transitions originates from strained Si-Si bonds in the core region induced by embedding.
The organization of the manuscript is as follows: in Sec. II we briefly introduce the theory and main equations employed to investigate temperature-dependent optical properties of SiNCs, and outline the recipe used to obtain site decomposition of optical absorption. Section III reports all computational details of the calculations performed in this work. In Sec. IV we present our results on various SiNC systems. In particular, in Sec. IV.1 we report band gaps of H-terminated, oxidized, and matrix-embedded SiNCs as a function of the nanocrystal diameter and compare to experiment. In Sec. IV.2 we compare our calculations of temperature-dependent band gaps of H-terminated, oxidized, and matrix-embedded SiNCs (all with diameter 2 nm) with bulk Si and experimental data. These calculations are followed by the analysis of phonon density of states and Eliashberg spectral functions of the three SiNC systems in Sec. IV.3. In Sec. IV.4 we present the role of Si-Si strained bonds in the optical properties of matrix-embedded SiNCs, and in Sec. IV.5, for the same structure, we compare Tauc plots of zero-phonon and phonon-assisted spectra. In Sec. V we summarize our key findings and indicate avenues for future work.
II Theory
In this section, we briefly describe the theoretical framework of the methodology employed to calculate temperature-dependent optical properties, and the decomposition of the dielectric function into site contributions. In the following, we adopt a -point formalism, since our calculations are for free-standing and extended matrix-embedded SiNCs.
II.1 Temperature-dependent optical properties
Within the Williams-Lax Williams (1951); Lax (1952) theory in the harmonic approximation, the imaginary part of the dielectric function at photon frequency and temperature is given by Zacharias et al. (2015):
| (1) |
Here the multi-dimensional Gaussian integral is taken over all normal coordinates and the superscript denotes the dielectric function evaluated with the nuclei in configuration . The widths of the Gaussian distributions are defined by the mean square displacements of the atoms along a vibrational mode , with frequency , and is given by , where is the proton mass and represents the Bose-Einstein occupation. The fundamental approach to numerically evaluate Eq. (1) is to employ Monte Carlo integration and perform an average of the dielectric functions calculated for multiple atomic configurations . Those configurations are constructed independently by generating normal coordinates from the multivariate normal distribution .
Recently, it has been shown that one can identify a single atomic configuration Zacharias and Giustino (2016, 2020), namely the ZG configuration, to evaluate the integral in Eq. (1). The set of special atomic displacements that lead to the ZG configuration are obtained via:
| (2) |
where is the displacement of atom along the Cartesian direction , and is the component of the phonon polarization vector associated with the normal mode coordinate . The calculation of optical spectra with the ZG configuration yields correctly the adiabatic limit of phonon-assisted optical absorption as described by Hall, Bardeen, and Blatt Hall et al. (1954), and at the same time incorporates the effect of electron-phonon renormalization on the band structure.
In the same way with the Williams-Lax optical spectra, one can calculate temperature-dependent transition energies by directly replacing the dielectric function in Eq. (1) with the transition energy Zacharias and Giustino (2020). In the thermodynamic limit, the band gap evaluated for the ZG configuration at temperature is given, up to fourth order in atomic displacements, by Zacharias and Giustino (2016):
where indicates the band gap energy evaluated with the nuclei of the system at their equilibrium geometry. The quadratic terms consist of the Fan-Migdal and Debye-Waller contributions to the electron-phonon renormalization Patrick and Giustino (2014); Giustino (2017), and the fourth order terms [last line of Eq. (II.1)] represent two-phonon contributions.
A standard way to investigate the vibrational mode contribution to the band gap renormalization at finite temperatures is to calculate the Eliashberg spectral function, defined as:
| (4) |
Integrating over all phonon energies yields the sum of the Fan-Migdal and Debye-Waller corrections. This sum is usually evaluated in state-of-the-art perturbative calculations Giustino et al. (2010); Cannuccia and Marini (2011); Gonze et al. (2011); Poncé et al. (2014a, b); Antonius et al. (2014); Villegas et al. (2016); Lihm and Park (2020) of temperature-dependent band structures that rely on the Allen-Heine theory Allen and Heine (1976).
II.2 Site decomposition of optical spectra
The imaginary part of the dielectric function in the independent particle and electric dipole approximations is given by Yu and Cardona (2010):
| (5) |
In this expression and are the electron mass and charge, the factor of two is for the spin degeneracy, is the volume of the system, and is the optical matrix element representing direct transitions between the valence and conduction Kohn-Sham states and with energies and , respectively.
Taking the expansion of the Kohn-Sham states as a linear combination of atomic orbitals, the optical matrix element is written as:
| (6) |
where represents the Kohn-Sham expansion coefficients of the state , and are the corresponding atomic basis states. To alleviate the notation we also define the matrix elements describing transitions between the basis states as .
Now we split the system into two groups of atoms, and , so that the total optical matrix element can be decomposed into the following contributions:
| (7) |
where
| (8) |
Here the self matrix elements, and , represent optical transitions between basis states that are associated entirely with atoms in the same group, while the cross-coupling matrix elements, and , represent optical transitions between basis states that are associated with atoms in different groups.
By substituting Eq. (7) into Eq. (6) and expanding the square modulus we can obtain the decomposition of the dielectric function into site contributions. The result is:
| (9) |
where, for example, the dielectric function
| (10) |
corresponds to optical absorption from atoms in group only, and “” refers to the various cross coupling terms. We note that the above prescription to decompose optical absorption into site contributions can be generalized straightforwardly to an arbitrary number of groups.
III Computational details and Methods
All first-principles calculations are based on density functional theory using numeric atom-centered orbitals as basis functions in the PBE generalized gradient approximation Perdew et al. (1996) as implemented in the electronic structure package FHI-aims Blum et al. (2009). The sampling of the Brillouin zone of each nanocrystal was performed using the point, and a vacuum of at least 20 Å was considered in all Cartesian directions to avoid spurious interactions between periodic images. Ground state geometries were obtained via BFGS optimization Jorge and Stephen (2006) until the residual force component per atom was less than 10-2 eV/Å.
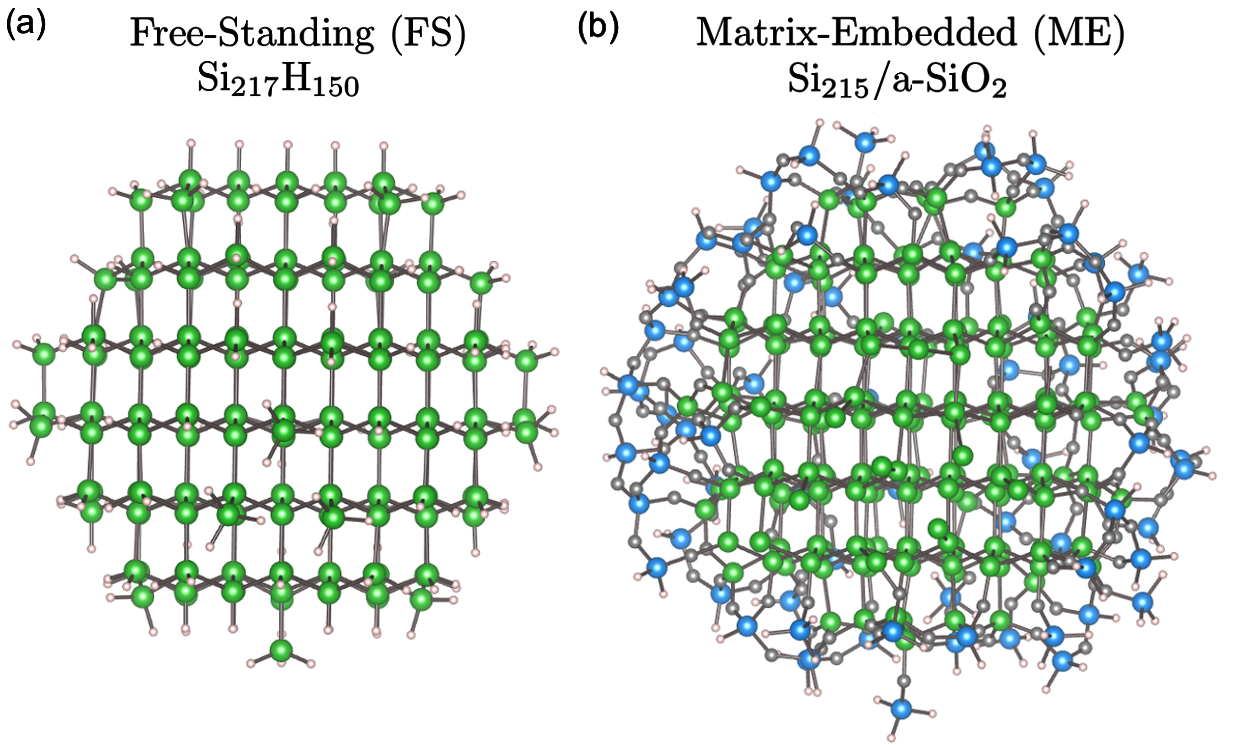
The dangling bonds of free-standing SiNCs are passivated with hydrogen atoms, as shown in Fig. 1(a). Oxidized free-standing SiNCs were obtained by replacing two hydrogens with one oxygen atom followed by geometry optimization. Configurations containing only double-bonded oxygens were considered. Unlike Si-O-Si bridge bonds, SiO double bonds are known to vary significantly the electronic structure of relatively small SiNCs Luppi and Ossicini (2005). For example, our calculations on free-standing SiNCs with nm (Si45H58) reveal that the formation of SiO and Si-O-Si bonds cause a band gap reduction of 845 meV and 214 meV, respectively.
Initial matrix-embedded SiNCs were obtained by a well tested Monte Carlo (MC) approach, as described in detail elsewhere Hadjisavvas and Kelires (2004, 2007). They consist of small spherical NCs with a size of 1.4 nm (99 Si atoms) and 2.0 nm (215 Si atoms), embedded in a-SiO2 matrices containing 400 and 2450 oxide atoms, respectively. To make the first-principles calculations tractable in the latter case, we constructed from the original network a smaller cell containing 659 atoms, in which the large NC is coated with an oxide layer of only 292 atoms, representing the rest of the oxide, and passivated with 152 H atoms, as shown in Fig. 1(b). These initial structures were first thoroughly annealed and relaxed with ab initio Molecular Dynamics at 800 K. Then, they were cooled to 0 K and brought into their ground state via geometry relaxation. The final structures contain only Si-O-Si bridge bonds, which have been shown to form the lowest energy configuration at the interface Hadjisavvas and Kelires (2004). We note that no SiO double bonds could be stabilized under relaxation, even after artificially imposing them, which indicates their high formation energy in embedded NCsLuppi et al. (2007); Pennycook et al. (2010).
All calculations of temperature-dependent optical properties were performed on SiNCs with diameter nm. The structures with the nuclei at their relax positions are shown in Fig 1. The Williams-Lax theory in the harmonic approximation together with SDM Zacharias and Giustino (2016, 2020)[Eq. (2)] were employed to calculate dielectric functions and band gaps at finite temperatures. Optical matrix elements were calculated within the independent particle approximation by taking the isotropic average over the Cartesian directions. Vibrational frequencies and eigenmodes were obtained via the frozen-phonon method Kunc and Martin (1983); Ackland et al. (1997) as implemented in PHONOPY Togo and Tanaka (2015). ZG configurations were generated via Eq. (2). For the ZG displacement in the H-passivated matrix-embedded SiNC we excluded the modes associated with displacements of H atoms. This choice avoids to a large extent the spurious contributions to the band gap renormalization coming from the artificial passivation to the system. All calculations of temperature-dependent band gaps and spectra were performed using the ZG configuration and its antithetic pair Zacharias and Giustino (2016) to ensure that contributions from the linear terms in atomic displacements reduce to zero. The derivatives required to obtain the Eliashberg spectral function in Eq. (4) were calculated by finite differences Capaz et al. (2005). This procedure required frozen-phonon calculations, where is the number of atoms in the system.
To elucidate the origin of the phonon density of states and band gap renormalization in different structures we decompose the atoms of the nanocrystal into two groups: surface and core atoms. The core contains Si atoms having as neighbors only Si0, i.e. Si atoms not bonded to any O or H atoms. The surface of free-standing SiNCs contains H, O, and passivated Si atoms (suboxides Si+1, Si+2, and Si+3). The surface of the matrix-embedded SiNC contains matrix atoms (suboxide Si+4 and O), and passivated Si atoms (suboxides Si+1, Si+2, and Si+3).
To account for the effect of thermal expansion on the band gap of SiNCs we performed the following steps: (i) We took the volume of all nanocrystals to be equal to the convex hull volume formed by the outermost Si atoms. (ii) We mimicked volume expansion by increasing the distance of all Si atoms from the center of the nanocrystal by the same fraction. That is, we increased the volume without inducing distortion to the bond angles, and thus keeping the structures similar. (iii) For the case of matrix-embedded SiNCs, we neglected the thermal expansion of the matrix and left the positions of amorphous silica atoms at their relaxed coordinates. The rationale behind this choice is that the thermal expansion coefficient of amorphous silica Lager et al. (1982) (0.510−6 K-1) is five times less than that of bulk Si Okada and Tokumaru (1984) (2.6 K-1). (iv) We took the thermal expansion coefficient of SiNCs to be 2.5 times larger than that of bulk Si Neto et al. (2012).
IV Results
IV.1 Size dependent band gap of SiNCs
Figure 2(a) shows the calculated band gaps of H-terminated free-standing SiNCs/SinHm (red discs), oxidized free-standing SiNCs/SinOHm-2 (green discs), and two embedded SiNCs in a-SiO2 (blue squares) as a function of the nanocrystal diameter . Experimental data of embedded SiNCs in a-SiO2 (black squares) Hartel et al. (2012) and free-standing SiNCs with oxidized surface (black discs) Ledoux et al. (2002) are shown for comparison. Our results show that the band gap of free-standing SiNCs opens with decreasing nanocrystal size. As expected, this trend follows the QC theory and compares favorably with other electronic structure calculations Proot et al. (1992); Delerue et al. (1993); Wang and Zunger (1997); Puzder et al. (2002). The significant reduction of oxidized and matrix-embedded SiNCs from the QC values is also clear. For example, our calculations on nanocrystals with nm reveal a band gap reduction of 0.27 eV and 0.43 eV after oxidation and embedding, respectively. The latter value is in close agreement with 0.4 eV extracted from experimental data of SiNCs with nm.
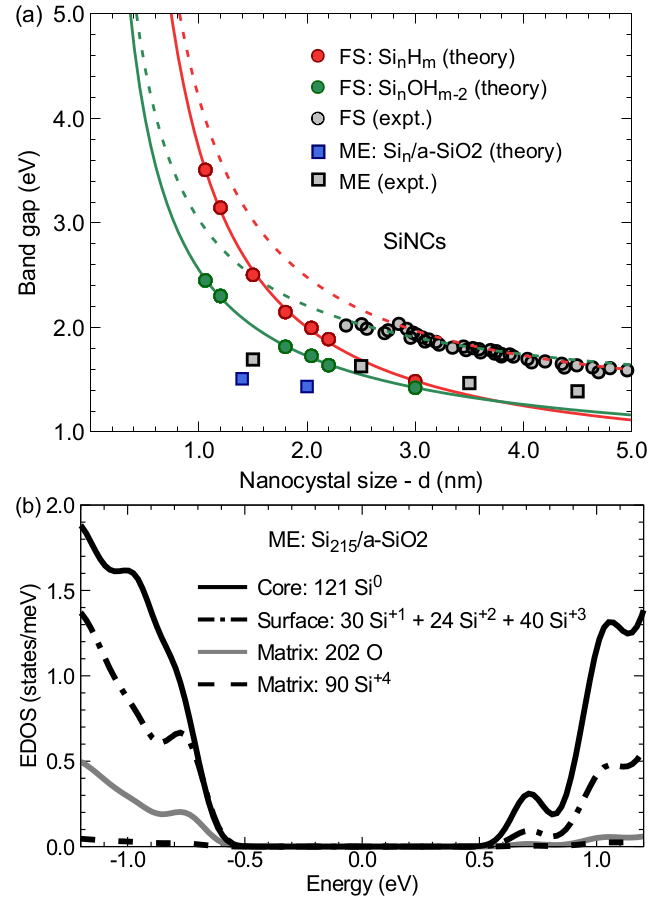
The solid curves in Fig. 2(a) represent fits to the data of free-standing SiNCs and are of the form , where eV is the calculated PBE band gap of bulk Si and , are fitting parameters. The fit to SinHm band gaps gives and , which compare nicely with the theoretical values of and obtained in Ref. [Delerue et al., 1993]. In both cases the exponent is different from 2 showing that the effective mass model is inadequate to describe the energy levels of nanocrystal clusters Rama Krishna and Friesner (1991); Luo et al. (2006). The fit to SinOHm band gaps gives and . We attribute the further decrease of and to the new electronic states that appear near the band edges as a result of the formation of a SiO double bond Luppi and Ossicini (2005). The systematic underestimation of the measured band gaps is mainly due to the PBE approximation to the exchange-correlation energy used in our calculations. As illustrated by the dashed green and red curves in Fig. 2(a), this underestimation is adjusted by a “scissor” shift equal to 0.5 eV that mimics the GW quasiparticle corrections to the band gap of bulk Si Lebègue et al. (2003).
Figure 2(b) shows the decomposition of the electronic density of states (EDOS) near the band gap of the matrix-embedded SiNC with nm. The main contribution to the EDOS is from Si core and surface atoms. At variance with Si matrix atoms, O atoms participate in the formation of the band edges leading to the reduction of the band gap energy from its QC value Lee et al. (2012). However, this is not the primary factor contributing to the band gap closing and thereby to quasidirect transitions close to the absorption edge; as we demonstrate in Secs. IV.4 and IV.5 embedding causes large strains to Si-Si bonds that alter significantly the electronic band structure and optical absorption.
IV.2 Temperature-dependent band gap of SiNCs
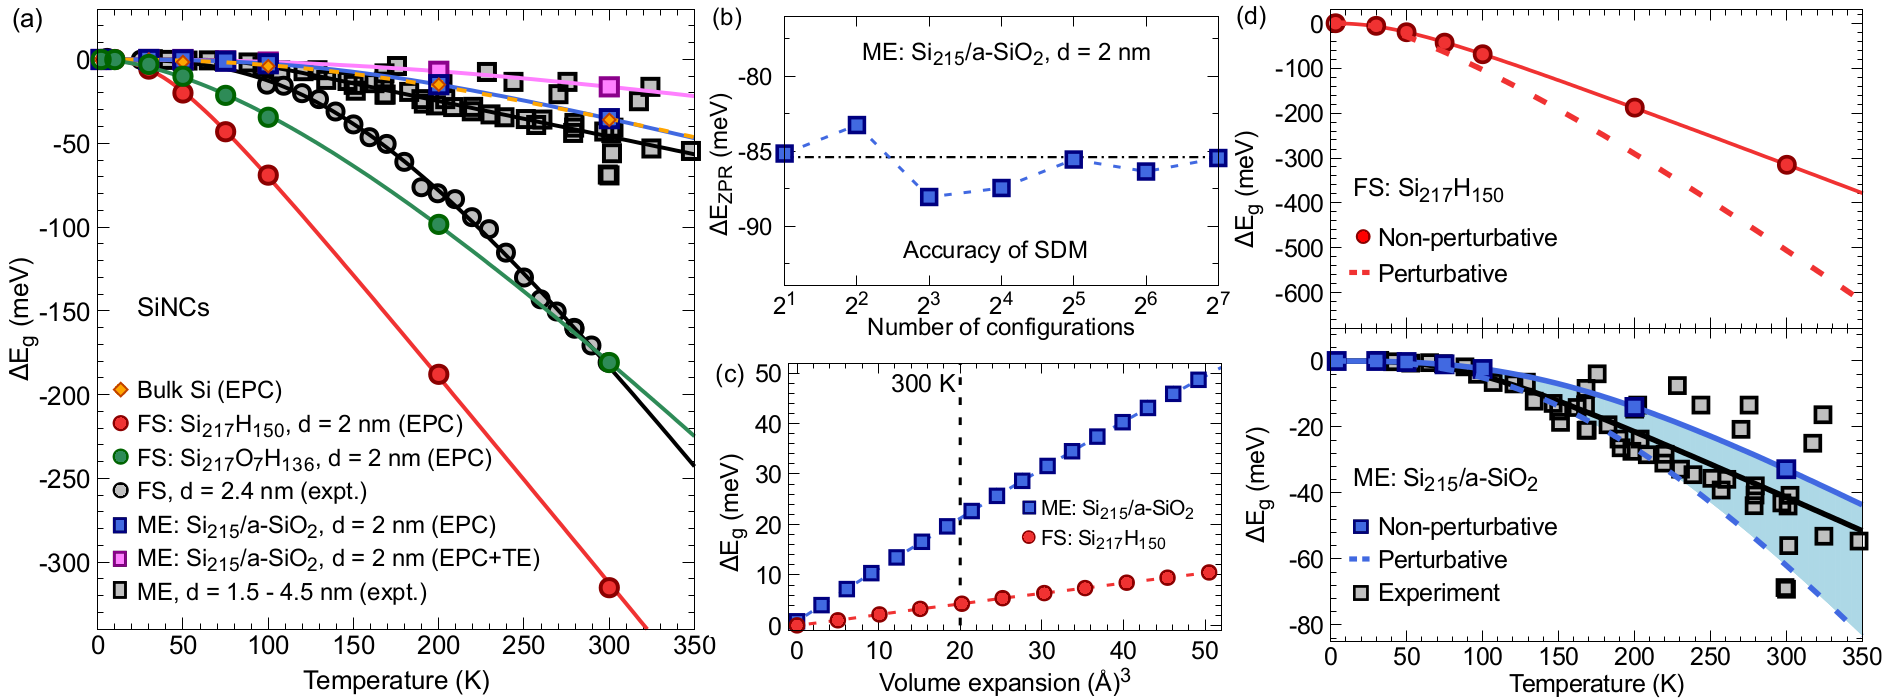
In Fig. 3(a) we compare our calculations of the temperature-dependent band gap renormalization of SiNCs with experiments from Refs. [Ksová et al., 2012; Wang et al., 2005; Rölver et al., 2005; Rinnert et al., 2009; Hartel et al., 2012], up to K. To facilitate comparison with data obtained from photoluminescence measurements we define the band gap renormalization as . The effect of electron-phonon coupling (EPC) is included in our calculations using SDM. Red discs, green discs and blue squares represent calculations of fully H-terminated, oxidized and matrix-embedded SiNCs with nm, respectively. The oxidized SiNC (Si217O7H136) was prepared by replacing 14 hydrogen with 7 oxygen atoms to form SiO double bonds that are uniformly distributed in the outer-shell of the nanocrystal.
As shown in Fig. 3(a), oxidation of the nanocrystal leads to a significantly smaller variation of the band gap with temperature. For example, our results reveal a decrease in the band gap renormalization of 135 meV at 300 K, amounting to 43% of the band gap renormalization calculated for the fully H-terminated SiNC. This difference is explained by the fact that the oxidized nanocrystal exhibits a weaker electron-phonon coupling at the surface; this aspect is analyzed in detail in Sec. IV.3. Our calculated temperature-dependent band gaps of the oxidized SiNC compare well with measurements Ksová et al. (2012) made on free-standing oxide-passivated SiNCs with nm (black discs). We note that we did not explore how the formation of Si-O-Si bridge bonds, or other oxidation combinations Luppi and Ossicini (2005), affect the temperature dependence of the band gap. Such a study requires systematic and extended analysis, and will be presented elsewhere.
Figure 3(a) also shows that electron-phonon renormalization of the band gap is further reduced by placing the nanocrystal inside the a-SiO2 cage. The interpretation of this result is given in Sec. IV.3. Our data (blue squares) exhibits a very similar behavior to the band gap renormalization calculated for bulk Si Zacharias and Giustino (2020) (orange diamonds). Compared to experimental data Wang et al. (2005); Rölver et al. (2005); Rinnert et al. (2009); Hartel et al. (2012); Ksová et al. (2012) (black squares) reported for nanocrystals with diameter 1.5 – 4.5 nm the agreement is very good. As already shown for bulk Si in Ref. [Karsai et al., 2018], this agreement can be improved by taking into account GW corrections to the electron-phonon coupling. For completeness, we include in our calculations the additional change in the band gap resulting from the thermal expansion of the nanocrystal inside the matrix [magenta squares in Fig 3(a)]. Also in this case, the theoretical data lie within the experimental range.
| (meV K-1) | (K) | (meV) | ||
|---|---|---|---|---|
| FS: Si217H150 | 1.29 | 118 | 2.26 | 230 |
| FS: Si217O7H136 | 1.07 | 486 | 1.68 | 141 |
| ME: Si215/a-SiO2 | 0.25 | 365 | 3.00 | 86 |
| ME with TE | 0.15 | 534 | 2.45 | 86 |
| Bulk Si | 0.26 | 425 | 2.47 | 57 |
| FS (expt.) | 1.32 | 365 | 2.99 | - |
| ME (expt.) | 0.17 – 0.4 | 68 – 400 | 2.5 – 2.8 | - |
| Bulk Si (expt.) | 0.3176 | 406 | 2.33 | 64 |
All curves in Fig. 3(a) represent fits to the band gap renormalization of SiNCs using an alternative expression to Varshni’s law, given byPässler (1996a):
| (11) |
where , and are model parameters representing the gradient of the high-temperature asymptote, the effective phonon temperature and the exponent of the temperature power law. This expression was chosen to (i) describe more accurately the non-linear dependence of the band gap at very low temperaturesPässler (1996b), and (ii) facilitate comparison with available experimental dataRinnert et al. (2009). The values of , and obtained from our analysis and the corresponding experimental parameters from Refs. [Rinnert et al., 2009] and [Cardona, 2001] are summarized in Table 1.
As a sanity check, we performed calculations to test the accuracy of SDM for the case of finite size nanocrystal clusters. Figure 3(b) shows the change of the average zero-point renormalization (ZPR) of the band gap with the number of ZG displacements generated for the matrix-embedded SiNC, d = 2 nm. The zero-point renormalization of the band gap is defined as . The ZG displacements were generated such that the numerical error in the evaluation of the ZPR is reduced with configurational averaging Zacharias and Giustino (2016). Our results confirm that meV is already well converged using a single antithetic pair of ZG displacements. The calculated for all nanocrystals and bulk Si obtained using SDM are listed together with experimental data of bulk Si in Table 1.
Figure 3(c) shows the band gap change as a function of homogeneous volume expansion of the free-standing H-terminated (red discs) and matrix-embedded (blue squares) SiNCs. The approach we employed to mimic the volume expansion of SiNCs is provided in Sec. III. The band gap of both structures increases linearly with volume. For the free-standing structure, the linear fit gives a slope of 0.2 meV/Å3, and the band gap opening is attributed solely to the expansion of the average Si-Si bond length. For the matrix-embedded nanocrystal, the linear fit gives a relatively much larger slope of 1 meV/Å3. This difference is explained by the presence of matrix oxygen atoms at the interface. In particular, as the nanocrystal expands inside the matrix, the overlap between the orbitals of oxygen and outermost silicon atoms increases. Since oxygen orbitals contribute to the electronic density of states at the band edges [Fig. 2(b)], then the decrease/distortion of Si-O-Si bridge bonds at the surface of the nanocrystal leads effectively to an additional band gap opening. To account for the effect of volume expansion to the band gap renormalization in matrix-embedded SiNCs we take the thermal expansion coefficient of the nanocrystal equal to K-1; see for details in Sec. III. This amounts to a volume increase of 20 Å3 at 300 K as indicated by the vertical dashed line in Fig. 3(c). We also note that by taking the bulk modulus of the nanocrystal to be equal to 105 GPa Kleovoulou and Kelires (2013a), the average compressive stress exerted on the nanocrystal by the matrix at 300 K can be estimated to be 1.6 GPa. This value is in line with the corresponding average stress calculated in Ref. [Kleovoulou and Kelires, 2013b] using Monte Carlo simulations.
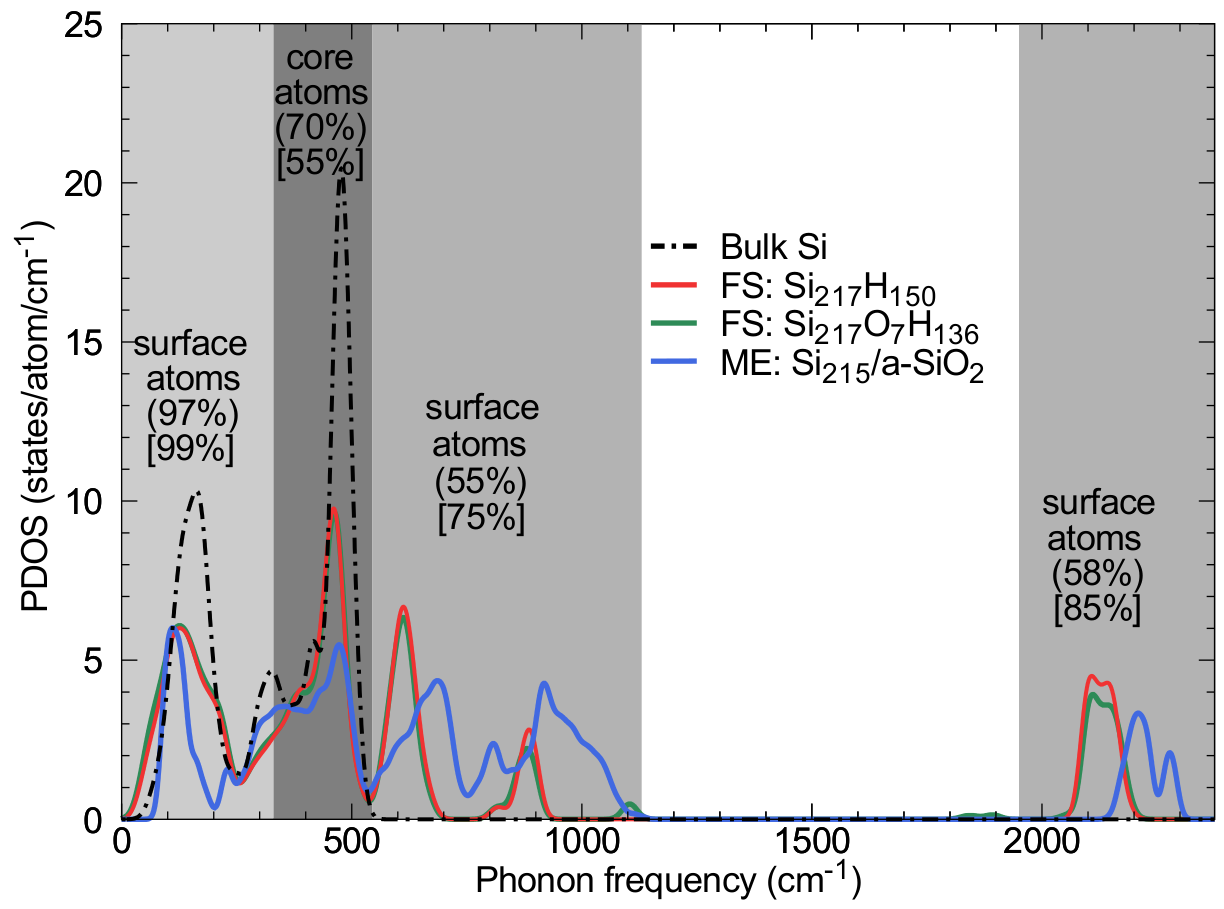
Figure 3(d) shows the temperature-dependent band gap renormalization of the H-terminated free-standing (top panel) and matrix-embedded (bottom panel) SiNCs calculated using SDM (solid lines) and finite differences Capaz et al. (2005) (dashed lines). These methodologies are used to evaluate the temperature dependence of the band gap within the non-perturbative adiabatic and perturbative adiabatic Allen-Heine theory Allen and Heine (1976); Giustino (2017), respectively. The advantage of non-perturbative over perturbative approaches is that higher order electron-phonon coupling terms, beyond second-order perturbation theory, are included in the calculation of temperature-dependent observables [see for example the terms in the last line of Eq. (II.1)]. Regarding the band gap renormalization of bulk Si, these terms are known to be negligible Zacharias and Giustino (2016); Poncé et al. (2014a). However, this is not the case for H-terminated free-standing SiNCs. Our finite difference calculations reveal meV and a high temperature asymptote meV K-1, which are well above than the corresponding values calculated using SDM (see Table 1). We attribute this difference to the presence of light mass H atoms at the surface of the free-standing SiNC. In particular, vibrational modes that are associated with large displacements of H atoms couple to modes of the nanocrystal, or to each other, leading to a non-negligible higher order electron-phonon coupling renormalization. Further analysis of this aspect requires a separate set of elaborate calculations, and is beyond the scope of this manuscript. Our perturbative calculations for the matrix-embedded SiNC give meV and meV K-1, which are more than twice the corresponding non-perturbative values (see Table 1). The difference between our perturbative and non-perturbative calculations can be explained by the remaining spurious displacements of the artificially imposed H atoms that contribute to the band gap renormalization. This uncertainty in our calculations is shown as a blue shaded area in Fig. 3(d).
IV.3 Phonon DOS and Eliashberg spectral functions
To explain the different behavior between the temperature-dependent band gaps of the three SiNCs employed in our calculations, we proceed with the analysis of their phonon density of states (PDOS) and the temperature dependence of their Eliashberg spectral functions (ESFs).
Figure 4 shows our calculated PDOS of the H-terminated (red curve), oxidized (green curve), and matrix-embedded (blue curve) SiNCs. For comparison purposes, we also include data of bulk Si (black dashed curve). We conclude that surface oxidation has a minor effect on the PDOS of free-standing SiNCs. Instead, placing the nanocrystal inside the matrix leads to distinct changes in the PDOS, and in particular for phonon frequencies larger than 500 cm-1, i.e. beyond the phonon frequency range of bulk Si. In the same figure we also indicate the frequency ranges (shaded areas) and percentage contribution of the vibrational modes associated mainly with displacements of surface atoms (light gray), and core atoms (dark gray). Details for this classification are provided in Sec. III.
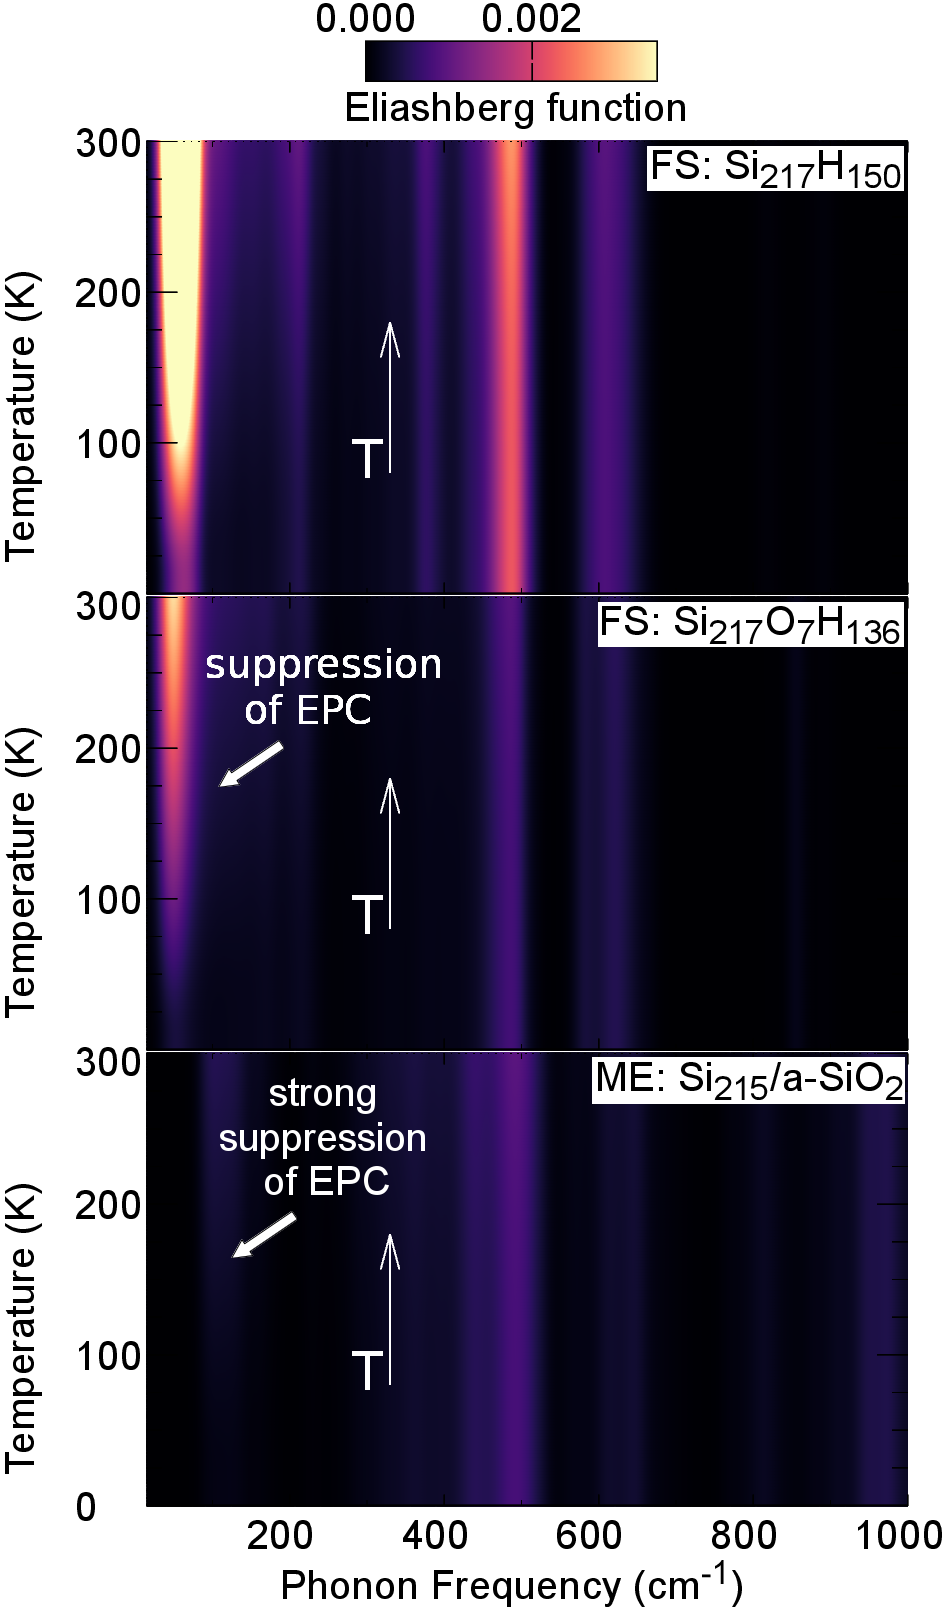
Figure 5 shows the temperature dependence of the ESFs up to 300 K calculated for the three SiNCs in the phonon frequency range 0 – 1000 cm-1. We exclude from our analysis the vibrational modes with frequencies higher than 1000 cm-1, since their contribution to the total ZPR is less than 1%. Furthermore, these high frequency modes have much lower occupation probability according to the Bose-Einstein distribution. It is evident from our calculated ESFs that the band gap renormalization of the two free-standing SiNCs is dominated by the low frequency vibrational modes associated with displacements of surface atoms. On the contrary, the largest contribution to the band gap renormalization of the matrix-embedded SiNC comes from the modes associated with displacements of core atoms. It is also pronounced that oxidation, although does not cause any significant changes in the PDOS, it suppresses the coupling of electrons with surface phonons, justifying the sizable difference between the band gap renormalization of oxidized and fully H-terminated SiNCs, reported in Fig. 2(a). The underlying mechanism responsible for this behavior is the participation of oxygen orbitals to the formation of the electron states close to band edges Luppi and Ossicini (2005), thereby modifying the associated electron-phonon coupling matrix elements Giustino (2017). Even more remarkably, the interaction of electrons with surface phonons is strongly suppressed when the nanocrystal is embedded in amorphous silica. This suggests that the large difference between the temperature-dependent photoluminescence shifts measured for oxide-passivated and matrix-embedded SiNCs in Ref. [Ksová et al., 2012] is mainly due to the strong suppression of electron-phonon coupling at the surface of the nanocrystal. We attribute to the same effect, the observation that the band gap renormalization of matrix-embedded SiNCs follows closely the Varshni behavior of bulk Si data. In fact, as demonstrated in Ref. [Monserrat and Needs, 2014] the dominant contribution to the electron-phonon coupling in bulk Si originates from the phonon modes in the frequency range 415 - 515 cm-1, which coincides to a large extent with the frequency range of the modes associated with displacements of the core atoms in the matrix-embedded SiNC.
IV.4 Role of Si-Si strained bonds in the optical properties of matrix-embedded SiNCs
In this section, we analyze the role of Si-Si strained bonds in the optical absorption and band gap renormalization of matrix-embedded SiNCs.
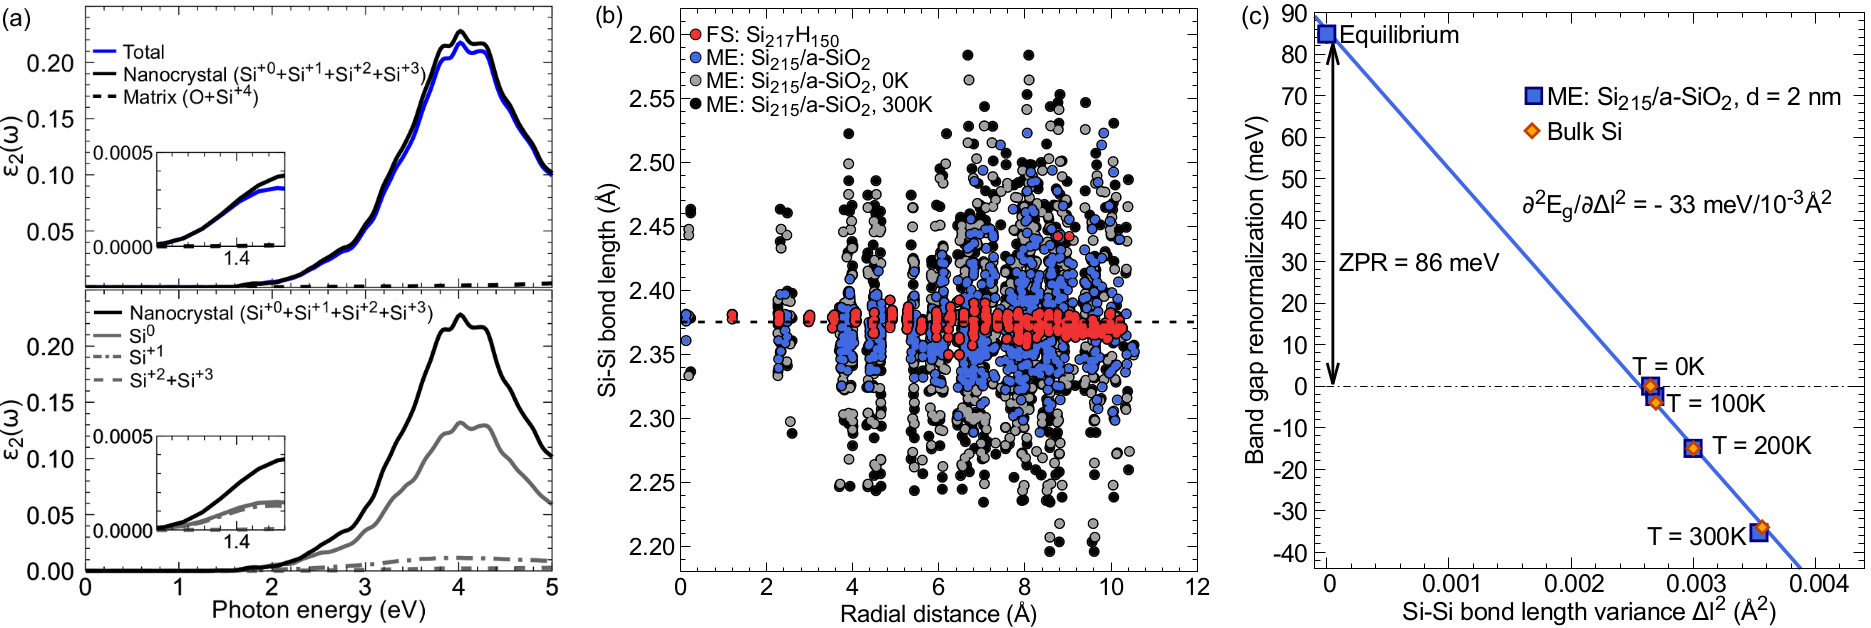
Figure 6(a) shows the spectra decomposition into groups of atoms of the matrix-embedded SiNC calculated with the nuclei at their equilibrium geometry. Details of the method are available in Sec. II.2. The top panel shows the total imaginary part of the dielectric function (blue solid line) and its decomposition into nanocrystal (black solid line) and matrix (black dashed line) self contributions. It is evident that the optical spectrum is dominated by the nanocrystal site, while the matrix contribution is essentially zero. This suggests that although matrix oxygen states participate in the formation of the absorption edge [Fig. 2(b)], they do not participate actively in the absorption process. The bottom panel of Fig. 6(a) shows the spectra decomposition of the nanocrystal into suboxide contributions. Our results reveal that for energies well above the absorption onset the largest contribution to originates from the core Si0 atoms (gray solid line), which are not bonded to any O atoms. Closer to the absorption onset [inset of Fig. 6(a)], the core atoms contribute as much as the inner-interface Si+1 atoms (gray dashed line), while the central Si+2 and outer Si+3 atoms (green solid line) are very weak absorbing elements. The above findings lead us to the conclusion that the band gap decrease from the QC values in matrix-embedded SiNCs is due to silicon states, mainly in the nanocrystal core, while oxygen states play a secondary role. As we demonstrate below, this effect has its origins in the large bond length strains induced by embedding, previously suggested by Ref. [Hadjisavvas and Kelires, 2004], both at the interface and deeper in the core.
Figure 6(b) shows the equilibrium Si-Si bond lengths in free-standing (red discs) and matrix-embedded (blue discs) SiNCs, nm, as we move radially outwards from the center of the nanocrystal. The average equilibrium Si-Si bond length in the matrix-embedded SiNC is indicated by the horizontal black dashed line cutting the vertical axis at 2.375 Å. This value differs by only 0.005 Å from the corresponding value calculated for the free-standing SiNC. It can be readily seen that the vast majority of Si-Si bond lengths in the free-standing SiNC are very close to the average value, giving a standard deviation Å. On the contrary, for the matrix-embedded SiNC, the variation of Si-Si bond lengths from the average is substantial, giving a standard deviation Å. In Fig. 6(b), we also include the Si-Si bond lengths in ZG geometries of the matrix-embedded system at K (gray discs) and K (black discs). The corresponding standard deviations are 0.062 Å and 0.068 Å. These large differences in the standard deviations exemplify the large strain induced by embedding and thermal effects, and can be correlated with the band gap closing in matrix-embedded SiNCs.
To clarify this observation, Fig. 6(c) shows the relationship between the calculated band gap renormalization of the matrix-embedded SiNC and the Si-Si bond length variance . We define the bond length variance at temperature as:
| (12) |
where and are the bond lengths in ZG and equilibrium geometries, respectively, and is the number of total bond lengths. Our choice of a quadratic deviation measure is rationalized by the fact that, the electron-phonon renormalization, for relatively low temperatures, is predominantly quadratic in atomic displacements [first line of Eq. (II.1)]. Therefore, we proceed with the following simple relationship
| (13) |
to correlate the band gap change and bond length distortion. The fit of Eq. (13) to the calculated band gaps (equilibrium and four temperatures up to 300 K) gives a slope -33 meV/10-3 Å2, meV, and a Pearson’s linear correlation coefficient . This result confirms the linear variation of with emphasizing the major importance of Si-Si strained bonds on the electronic structure of matrix-embedded SiNCs.
In Fig. 6(c) we also show that the corresponding data calculated for bulk Si using ZG configurations (orange diamonds) Zacharias and Giustino (2020) almost overlap with those obtained for the matrix-embedded SiNC. This finding further supports the conclusion that the band gap renormalization of the matrix-embedded SiNC behaves very similarly to that of its bulk counterpart.
IV.5 Quasidirect optical absorption in SiNCs
In this section we analyze the Tauc plots Tauc et al. (1966) of SiNCs and investigate the origin of quasidirect optical transitions Hybertsen (1994); Lee et al. (2016) in these nanoscale structures. We present calculations of the imaginary part of the dielectric function from which the absorption properties follow directly.
In bulk semiconductors with an indirect band gap, optical transitions between the states of the valence band maximum (VBM) and conduction band minimum (CBM) are forbidden in the absence of phonons owing to the momentum conservation rule Yu and Cardona (2010). This is indeed the case for bulk Si for which it has been shown, from first-principles Noffsinger et al. (2012); Zacharias et al. (2015), that phonon-assisted transitions are required to reveal absorption for photon energies below the fundamental direct gap. However, it is well known that structural perturbations can relax the momentum conservation rule leading to zero-phonon transitions between the band edges Hybertsen (1994); Lee et al. (2016); Ksová et al. (2014). In particular, deviations from translational invariance of the crystal can cause the overlap between the electron and hole wavefunctions allowing for quasidirect (vertical) transitions with finite probability.
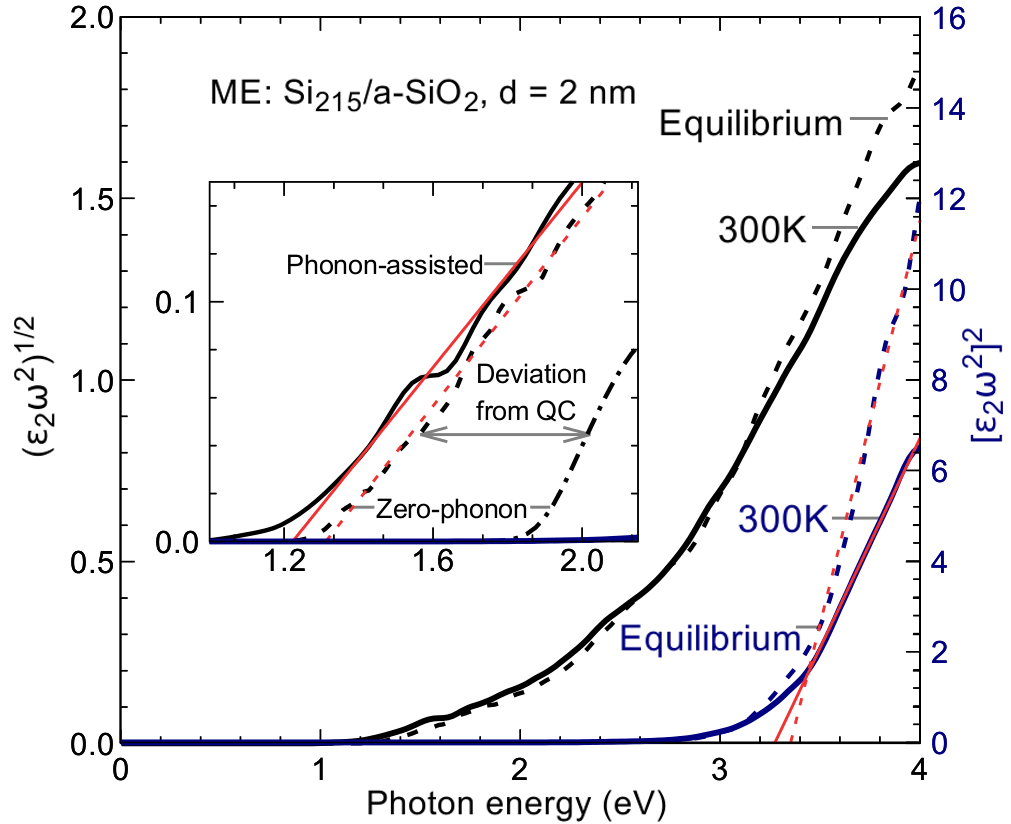
Figure 7 shows the Tauc plots (black) and (blue) representing indirect and direct allowed transitions in the matrix-embedded SiNC. We combine on the same plot the spectra calculated with the atoms at equilibrium positions (dashed curve) and with the atoms at thermal positions defined by the ZG displacement for K (solid curve). It can be readily seen that the Tauc plots for direct transitions reveal optical absorption for energies higher than the calculated band gap at eV. These plots can be very well fitted in the energy range 3.4 – 4.0 eV by linear regressions (red lines) representing the expression , where is the first direct gap. The linear regressions cross the energy axis at eV and eV which are well above than . At variance with this result, Tauc plots for indirect transitions exhibit an absorption onset close to the band gap energy, as illustrated in the inset of Fig. 7. In this case, linear fits to in the range 1.3 – 2.0 eV give eV and eV. We note that these values are less than the corresponding calculated band gaps by about 0.1 eV due to the artificial Gaussian broadening applied to our spectra.
It is evident that unlike crystalline silicon Zacharias et al. (2015), the equilibrium spectrum of SiNCs is driven by zero-phonon transitions that behave similarly to indirect recombination channels leading to optical absorption for energies below . Furthermore, the phonon-assisted spectrum at K is almost a rigid shift of the equilibrium spectrum in the energy range 1.3 – 2.0 eV, reflecting essentially the band gap difference between and . This latter behavior is manifest in bulk semiconductors with a direct band gap Zacharias and Giustino (2016), where vertical transitions dominate. Taking these two observations together, we identify that optical absorption below the pseudo direct gap in nanoscale silicon structures is dominated by quasidirect absorption, while phonon-assisted transitions play a less important role.
In the inset of Fig. 7, we also include the spectrum of the H-terminated free-standing SiNC calculated with the nuclei at their relaxed QC positions (dashed-dotted curve). This shows essentially that the absorption onset of the matrix-embedded SiNC deviates from its QC value by more than 0.5 eV. Therefore, besides QC, a substantial contribution to the quasidirect transition probability in SiNCs originates from strained Si-Si bonds and oxygen surface states, as evidenced in Secs. IV.4 and IV.1. These effects reflect further structural modifications that enhance the relaxation of the -conservation rule, thereby allowing for additional zero-phonon optical transitions between the VBM and CBM.
V Conclusions
In this manuscript we have performed a first-principles study of temperature-dependent optical properties of SiNCs. In a nutshell, we have demonstrated using SDM that the electron-phonon renormalization of the band gap of SiNCs strongly depends on the different passivation regimes. Starting from H-terminated free-standing SiNCs we have shown that the large zero-point renormalization and the band gap variation with temperature originates from the coupling of electrons with surface phonons. This surface effect is suppressed by oxidation and almost vanishes by inserting the nanocrystal inside the a-SiO2 matrix. The present results help to clarify the experimental measurements regarding the energy shifts between the temperature-dependent PL peaks of oxidized free-standing and matrix-embedded SiNCs. Furthermore, our data for the band gap renormalization of matrix-embedded SiNCs exhibits good agreement with the experiment and follows closely the Varshni behavior of bulk Si.
Importantly, our analysis reveals that the electronic structure of SiNCs is highly correlated with the strain of Si-Si bonds. In fact, in the case of matrix-embedded SiNCs, we have demonstrated a strong linear dependence between the band gap and the bond length variance induced by atomic vibrations. This result suggests the inherent relationship between electron-phonon coupling and thermally averaged structural perturbations that can be explored with non-perturbative approaches, like SDM.
Beyond studying the temperature dependence of the band gap, we investigate the effect of phonon-assisted electronic transitions on the optical spectra of SiNCs. At variance with bulk Si, the spectrum close to the absorption onset of SiNCs is dominated by zero-phonon quasidirect transitions, while phonon-assisted recombination is less important. We also clarify that the origin of quasidirect transition probability in SiNCs is not only due to quantum confinement, but also due to strained Si-Si bonds (primarily) and oxygen-related surface states (secondarily).
Finally, it should be possible to extend our present work to explore how the formation of oxygen bridge bonds, or other oxidation combinations can explicitly affect electron-phonon coupling in SiNCs. Furthermore, we expect that the calculation of temperature-dependent band gaps of other important nanostructures, such as Ge, SiGe and TiO2 passivated nanocrystals should be within reach. Our study can also be upgraded with calculations of full photoluminescence spectra accounting for excitonic effects and exciton-phonon coupling Paleari et al. (2019) via the combination of Bethe-Salpeter approach and SDM.
Acknowledgements.
MZ and PC thank Christos Mathioudakis and George Hadjisavvas for help in generating the structures of SiNCs embedded in amorphous SiO2. This work was supported by the Strategic Infrastructure Project NEW INFRASTRUCTURE / TPATH / 0308 / 04, which is co-funded by the European Regional Development Fund, the European Social Fund, the Cohesion Fund, and the Research Promotion Foundation of the Republic of Cyprus. The calculations were supported by the Cy-Tera Project (NEW INFRASTRUCTURE / TPATH / 0308 / 31), which is co-funded by the European Regional Development Fund and the Republic of Cyprus through the Research Promotion Foundation. All electronic structure calculations performed in this study are available on the NOMAD repository: http://dx.doi.org/10.17172/NOMAD/2020.04.30-1References
- Pavesi et al. (2000) L. Pavesi, L. Dal Negro, C. Mazzoleni, G. Franzo, and F. Priolo, Nature 408, 440 (2000).
- Kai-Yuan et al. (2011) C. Kai-Yuan, A. Rebecca, R. K. Uwe, and J. H. Russell, Nano Lett. 11, 1952 (2011).
- Wang et al. (2018) D.-C. Wang, C. Zhang, P. Zeng, W.-J. Zhou, L. Ma, H.-T. Wang, Z.-Q. Zhou, F. Hu, S.-Y. Zhang, M. Lu, and X. Wu, Science Bulletin 63, 75 (2018).
- Zhenyi et al. (2019) N. Zhenyi, Z. Shu, Z. Shuangyi, P. Wenbing, Y. Deren, and P. Xiaodong, Mater. Sci. Eng. Rep. 138, 85 (2019).
- Gonzalez and Veinot (2016) C. M. Gonzalez and J. G. C. Veinot, J. Mater. Chem. C 4, 4836 (2016).
- Julian et al. (2018) K. Julian, K. P. Tapas, K. Simon, R. Konstantinos N., W. Malte, L. Theresa, A. Maryam, H. Marianne, R. Katia, H. Tobias, P. Christine M., G. C. V. Jonathan, and R. Bernhard, Langmuir 34, 4888 (2018).
- Nayfeh et al. (2005) M. H. Nayfeh, Satish Rao, O. M. Nayfeh, A. Smith, and J. Therrien, IEEE Trans. Nanotechnol. 4, 660 (2005).
- Kim et al. (2009) S.-K. Kim, B.-H. Kim, C.-H. Cho, and S.-J. Park, Appl. Phys. Lett. 94, 183106 (2009).
- Martuza et al. (2018) M. A. Martuza, S. Ghanbarzadeh, C. Lee, C. Con, and K. S. Karim, IEEE Trans. Electron Devices 65, 584 (2018).
- McVey and Tilley (2014) B. F. P. McVey and R. D. Tilley, Acc. Chem. Res. 47, 3045 (2014).
- McVey et al. (2018) B. F. P. McVey, D. König, X. Cheng, P. B. O’Mara, P. Seal, X. Tan, H. A. Tahini, S. C. Smith, J. J. Gooding, and R. D. Tilley, Nanoscale 10, 15600 (2018).
- Conibeer et al. (2008) G. Conibeer et al., Thin Solid Films 516, 6748 (2008).
- Luo et al. (2011) J.-W. Luo, P. Stradins, and A. Zunger, Energy Environ. Sci. 4, 2546 (2011).
- Zhao et al. (2016) S. Zhao, X. Pi, C. Mercier, Z. Yuan, B. Sun, and D. Yang, Nano Energy 26, 305 (2016).
- Mazzarella et al. (2019) L. Mazzarella, Y.-H. Lin, S. Kirner, A. B. Morales-Vilches, L. Korte, S. Albrecht, E. Crossland, B. Stannowski, C. Case, H. J. Snaith, and R. Schlatmann, Adv. Energy Mater. 9, 1803241 (2019).
- Mazzaro et al. (2019) R. Mazzaro, A. Gradone, S. Angeloni, G. Morselli, P. G. Cozzi, F. Romano, A. Vomiero, and P. Ceroni, ACS Photonics 6, 2303 (2019).
- Yuan et al. (2009) Z. Yuan, A. Anopchenko, N. Daldosso, R. Guider, D. Navarro-Urrios, A. Pitanti, R. Spano, and L. Pavesi, Proc. IEEE 97, 1250 (2009).
- Valenta et al. (2019) J. Valenta, M. Greben, A. Dyakov, S., A. Gippius, N., D. Hiller, S. Gutsch, and M. Zacharias, Sci. Rep. 9 (2019).
- Heitmann et al. (2004) J. Heitmann, F. Müller, L. Yi, M. Zacharias, D. Kovalev, and F. Eichhorn, Phys. Rev. B 69, 195309 (2004).
- Wang et al. (2005) X. X. Wang, J. G. Zhang, L. Ding, B. W. Cheng, W. K. Ge, J. Z. Yu, and Q. M. Wang, Phys. Rev. B 72, 195313 (2005).
- Rinnert et al. (2009) H. Rinnert, O. Jambois, and M. Vergnat, J. Appl. Phys. 106, 023501 (2009).
- Hartel et al. (2012) A. M. Hartel, S. Gutsch, D. Hiller, and M. Zacharias, Phys. Rev. B 85, 165306 (2012).
- Ksová et al. (2012) K. Ksová, L. Ondič, E. Klimešová, K. Herynková, I. Pelant, S. Daniš, J. Valenta, M. Gallart, M. Ziegler, B. Hönerlage, and P. Gilliot, Appl. Phys. Lett. 101, 143101 (2012).
- Varshni (1967) Y. Varshni, Physica 34, 149 (1967).
- Giustino (2017) F. Giustino, Rev. Mod. Phys. 89, 015003 (2017).
- Zacharias and Giustino (2016) M. Zacharias and F. Giustino, Phys. Rev. B 94, 075125 (2016).
- Zacharias and Giustino (2020) M. Zacharias and F. Giustino, Phys. Rev. Res. 2, 013357 (2020).
- Hybertsen (1994) M. S. Hybertsen, Phys. Rev. Lett. 72, 1514 (1994).
- Kovalev et al. (1998) D. Kovalev, H. Heckler, M. Ben-Chorin, G. Polisski, M. Schwartzkopff, and F. Koch, Phys. Rev. Lett. 81, 2803 (1998).
- Lee et al. (2016) B. G. Lee, J.-W. Luo, N. R. Neale, M. C. Beard, D. Hiller, M. Zacharias, P. Stradins, and A. Zunger, Nano Lett. 16, 1583 (2016).
- Luppi and Ossicini (2005) M. Luppi and S. Ossicini, Phys. Rev. B 71, 035340 (2005).
- Wolkin et al. (1999) M. V. Wolkin, J. Jorne, P. M. Fauchet, G. Allan, and C. Delerue, Phys. Rev. Lett. 82, 197 (1999).
- Hadjisavvas and Kelires (2007) G. Hadjisavvas and P. C. Kelires, Physica E Low-Dimensional Systems and Nanostructures 38, 99 (2007).
- Lee et al. (2012) B. G. Lee, D. Hiller, J.-W. Luo, O. E. Semonin, M. C. Beard, M. Zacharias, and P. Stradins, Adv. Funct. Mater. 22, 3223 (2012).
- Dohnalová et al. (2014) K. Dohnalová, T. Gregorkiewicz, and K. Kůsová, J. Phys. Condens. Matter 26, 173201 (2014).
- Allan et al. (1996) G. Allan, C. Delerue, and M. Lannoo, Phys. Rev. Lett. 76, 2961 (1996).
- Hadjisavvas and Kelires (2004) G. Hadjisavvas and P. C. Kelires, Phys. Rev. Lett. 93, 226104 (2004).
- Williams (1951) F. E. Williams, Phys. Rev. 82, 281 (1951).
- Lax (1952) M. Lax, J. Chem. Phys. 20, 1752 (1952).
- Zacharias et al. (2015) M. Zacharias, C. E. Patrick, and F. Giustino, Phys. Rev. Lett. 115, 177401 (2015).
- Hall et al. (1954) L. Hall, J. Bardeen, and F. Blatt, Phys. Rev. 95, 559 (1954).
- Patrick and Giustino (2014) C. E. Patrick and F. Giustino, J. Phys.: Condens. Matter 26, 365503 (2014).
- Giustino et al. (2010) F. Giustino, S. G. Louie, and M. L. Cohen, Phys. Rev. Lett. 105, 265501 (2010).
- Cannuccia and Marini (2011) E. Cannuccia and A. Marini, Phys. Rev. Lett. 107, 255501 (2011).
- Gonze et al. (2011) X. Gonze, P. Boulanger, and M. Côté, Ann. Phys. 523, 168 (2011).
- Poncé et al. (2014a) S. Poncé, G. Antonius, Y. Gillet, P. Boulanger, J. Laflamme Janssen, A. Marini, M. Côté, and X. Gonze, Phys. Rev. B 90, 214304 (2014a).
- Poncé et al. (2014b) S. Poncé, G. Antonius, P. Boulanger, E. Cannuccia, A. Marini, M. Côté, and X. Gonze, Comput. Mater. Sci. 83, 341 (2014b).
- Antonius et al. (2014) G. Antonius, S. Poncé, P. Boulanger, M. Côté, and X. Gonze, Phys. Rev. Lett. 112, 215501 (2014).
- Villegas et al. (2016) C. E. P. Villegas, A. R. Rocha, and A. Marini, Nano Lett. 16, 5095 (2016).
- Lihm and Park (2020) J.-M. Lihm and C.-H. Park, Phys. Rev. B 101, 121102 (2020).
- Allen and Heine (1976) P. B. Allen and V. Heine, J. Phys. C 9, 2305 (1976).
- Yu and Cardona (2010) P. Y. Yu and M. Cardona, Fundamentals of Semiconductors, 4th ed. (Springer, Heidelberg, 2010) pp. 200–343.
- Perdew et al. (1996) J. P. Perdew, K. Burke, and M. Ernzerhof, Phys. Rev. Lett. 77, 3865 (1996).
- Blum et al. (2009) V. Blum, R. Gehrke, F. Hanke, P. Havu, V. Havu, X. Ren, K. Reuter, and M. Scheffler, Comput. Phys. Commun. 180, 2175 (2009).
- Jorge and Stephen (2006) N. Jorge and W. Stephen, J., Numerical optimization, 2nd ed. (Springer, 2006).
- Luppi et al. (2007) E. Luppi, F. Iori, R. Magri, O. Pulci, S. Ossicini, E. Degoli, and V. Olevano, Phys. Rev. B 75, 033303 (2007).
- Pennycook et al. (2010) T. J. Pennycook, G. Hadjisavvas, J. C. Idrobo, P. C. Kelires, and S. T. Pantelides, Phys. Rev. B 82, 125310 (2010).
- Kunc and Martin (1983) K. Kunc and R. M. Martin, in Ab initio calculation of phonon spectra, edited by J. Devreese, V. Van Doren, and P. Van Camp (Plenum, New York, 1983) p. 65.
- Ackland et al. (1997) G. J. Ackland, M. C. Warren, and S. J. Clark, J. Phys.: Condens. Matter 9, 7861 (1997).
- Togo and Tanaka (2015) A. Togo and I. Tanaka, Scr. Mater. 108, 1 (2015).
- Capaz et al. (2005) R. B. Capaz, C. D. Spataru, P. Tangney, M. L. Cohen, and S. G. Louie, Phys. Rev. Lett. 94, 036801 (2005).
- Lager et al. (1982) G. A. Lager, J. D. Jorgensen, and F. J. Rotella, J. Appl. Phys. 53, 6751 (1982).
- Okada and Tokumaru (1984) Y. Okada and Y. Tokumaru, J. Appl. Phys. 56, 314 (1984).
- Neto et al. (2012) E. S. F. Neto, N. O. Dantas, S. W. da Silva, P. C. Morais, M. A. P. da Silva, A. J. D. Moreno, V. López-Richard, G. E. Marques, and C. Trallero-Giner, Nanotechnology 23, 125701 (2012).
- Ledoux et al. (2002) G. Ledoux, J. Gong, F. Huisken, O. Guillois, and C. Reynaud, Appl. Phys. Lett. 80, 4834 (2002).
- Proot et al. (1992) J. P. Proot, C. Delerue, and G. Allan, Appl. Phys. Lett. 61, 1948 (1992).
- Delerue et al. (1993) C. Delerue, G. Allan, and M. Lannoo, Phys. Rev. B 48, 11024 (1993).
- Wang and Zunger (1997) L.-W. Wang and A. Zunger, Semiconductor Nanoclusters - Physical, Chemical, and Catalytic Aspects, Studies in Surface Science and Catalysis, 103, 161 (1997).
- Puzder et al. (2002) A. Puzder, A. J. Williamson, J. C. Grossman, and G. Galli, Phys. Rev. Lett. 88, 097401 (2002).
- Lebègue et al. (2003) S. Lebègue, B. Arnaud, M. Alouani, and P. E. Bloechl, Phys. Rev. B 67, 155208 (2003).
- Rama Krishna and Friesner (1991) M. V. Rama Krishna and R. A. Friesner, J. Chem. Phys. 95, 8309 (1991).
- Luo et al. (2006) J.-W. Luo, S.-S. Li, J.-B. Xia, and L.-W. Wang, Appl. Phys. Lett. 88, 143108 (2006).
- Rölver et al. (2005) R. Rölver, O. Winkler, M. Först, B. Spangenberg, and H. Kurz, Microelectronics Reliability 45, 915 (2005), 13th Workshop on Dielectrics in Microelectronics.
- Karsai et al. (2018) F. Karsai, M. Engel, G. Kresse, and E. Flage-Larsen, New J. Phys. 20, 123008 (2018).
- Cardona (2001) M. Cardona, Phys. Status Solidi A 188, 1209 (2001).
- Pässler (1996a) R. Pässler, Phys. Status Solidi B 193, 135 (1996a).
- Pässler (1996b) R. Pässler, Solid-State Electron. 39, 1311 (1996b).
- Kleovoulou and Kelires (2013a) K. Kleovoulou and P. C. Kelires, Phys. Rev. B 88, 245202 (2013a).
- Kleovoulou and Kelires (2013b) K. Kleovoulou and P. C. Kelires, Phys. Rev. B 88, 085424 (2013b).
- Monserrat and Needs (2014) B. Monserrat and R. J. Needs, Phys. Rev. B 89, 214304 (2014).
- Tauc et al. (1966) J. Tauc, R. Grigorovici, and A. Vancu, Phys. Status Solidi B 15, 627 (1966).
- Noffsinger et al. (2012) J. Noffsinger, E. Kioupakis, C. G. Van de Walle, S. G. Louie, and M. L. Cohen, Phys. Rev. Lett. 108, 167402 (2012).
- Ksová et al. (2014) K. Ksová, P. Hapala, J. Valenta, P. Jelínek, O. Cibulka, L. Ondič, and I. Pelant, Adv. Mater. Interfaces 1, 1300042 (2014).
- Paleari et al. (2019) F. Paleari, H. P. C. Miranda, A. Molina-Sánchez, and L. Wirtz, Phys. Rev. Lett. 122, 187401 (2019).