The Mean Absorption Line Spectra of a Selection of
Luminous Lyman Break Galaxies
Abstract
We examine the absorption line spectra of a sample of 31 luminous () Lyman break galaxies at redshift using data taken with the FOCAS and OSIRIS spectrographs on the Subaru and GTC telescopes. For two of these sources we present longer exposure data taken at higher spectral resolution from ESO’s X-shooter spectrograph. Using these data, we demonstrate the practicality of stacking our lower resolution data to measure the depth of various interstellar and stellar absorption lines to probe the covering fraction of low ionization gas and the gas-phase and stellar metallicities near the end of the era of cosmic reionization. From maximum absorption line depths of Siii1260 and Cii1334, we infer a mean covering fraction of for our sample. This is larger than that determined using similar methods for lower luminosity galaxies at slightly lower redshifts, suggesting that the most luminous galaxies appear to have a lower escape fraction than fainter galaxies, and therefore may not play a prominent role in concluding reionization. Using various interstellar absorption lines we deduce gas-phase metallicities close to solar indicative of substantial early enrichment. Using selected stellar absorption lines, we model our spectra with a range of metallicities using techniques successfully employed at lower redshift and deduce a stellar metallicity of solar, consistent with the stellar mass - stellar metallicity relation recently found at . We discuss the implications of these metallicity estimates for the typical ages of our luminous galaxies and conclude our results imply initial star formation at redshifts , consistent with independent analyses of earlier objects.
Subject headings:
galaxies: formation — galaxies: evolution — galaxies: high-redshift1. Introduction
Spectroscopy remains a fundamental tool for understanding the physical processes which govern the evolution of high redshift star-forming galaxies (Stark 2016). Emission line measurements have been effective not only in supplying galaxy redshifts essential for time-slicing deep survey data, but also in interpreting the nature of their radiation field and analyzing gas-phase metallicities (e.g. Erb et al. 2006, Nakajima et al. 2016, Shivaei et al. 2018, Saxena et al. 2020). Although more challenging observationally, absorption line spectroscopy can provide additional physical constraints including evidence of kinematic outflows (Steidel et al. 2010, Jones et al. 2018), the chemistry and ionization state of the interstellar gas (Jones et al. 2012) and, ultimately, stellar metallicities (Leethochawalit et al. 2019, Cullen et al. 2019).
With the exception of studies of rare luminous or gravitationally-lensed examples (e.g. Dow-Hygelund et al. 2005, Jones et al. 2013, Leethochawalit et al. 2016), most progress in absorption line spectroscopy of high redshift galaxies has necessarily involved stacked spectra of representative samples. Following the pioneering study of over 800 Lyman break galaxies (LBGs) at redshift by Shapley et al. (2003), Jones et al. (2012) produced a mean rest-frame UV spectrum utilising 80 LBGs at and, more recently, Cullen et al. (2019) analyzed composite spectra drawn from a sample of 681 galaxies in the VANDELS survey spanning a range with a mean redshift of . Redshift-dependent trends in the stacked spectra of LBGs matched in UV luminosity and stellar mass over based on these earlier campaigns are discussed by Du et al. (2018).
One of the most interesting trends, discussed by both Jones et al. (2013) and Du et al. (2018) is that the equivalent width of low ionization species (LIS) absorption decreases with increasing redshift, possibly due to a reduced covering fraction of neutral hydrogen, , and, by implication an increased escape fraction, , of ionizing radiation. The latter deduction follows Chisholm et al. (2018) who find a correlation between and estimated from LIS absorption using Lyman continuum leakers. On the other hand, Reddy et al. (2016) argue that, while the covering fraction of LIS absorption may be a reasonable proxy for that of neutral hydrogen, it may be an unreliable estimate of if metal-enriched outflowing gas has a dust content that varies with the covering fraction of hydrogen. Nonetheless, Du et al. (2018) conclude the evolution of LIS absorption to likely represents an increase in the ionizing capability of higher redshift galaxies with important consequences for cosmic reionization. At redshifts where the escape fraction can be directly measured, the average for both LBGs and metal-poor Lyman alpha emitters (LAEs) is (Steidel et al. 2018, Fletcher et al. 2019). Based on the census of early galaxies, an average % is necessary to complete cosmic reionization by (Robertson et al. 2013). An increase in the average with redshift would thus be an important result, perhaps indicating earlier galaxies have higher star formation rate surface densities capable of creating porous channels in the interstellar medium (Wise et al. 2014).
Of course it is unlikely that galaxies of different luminosities and stellar masses have similar covering fractions of hydrogen and LIS gas. In this respect to concept of an average escape fraction is perhaps naive. Recently there has been much discussion in the literature on the apparent rapidity with which the neutral gas in the intergalactic medium (IGM) became ionized. Estimates of the neutral fraction , including those from the Gunn-Peterson troughs and proximity zones seen in QSO absorption spectra and the fraction of Lyman emission seen in color-selected galaxies, collectively imply a rapid evolution from at to zero at i.e. within a time interval of only 250 Myr (Naidu et al. 2020). Such an abrupt ending of reionization may indicate a contribution of ionizing photons from the rarer, more massive, systems which assemble during at the end of the reionization epoch.
The present paper is motivated, in part, to test this hypothesis by examining the absorption spectra of LBGs at a redshift . It is not yet practical with current facilities to study a representative sample of galaxies down to the luminosity limit which Naidu et al propose might be responsible for concluding reionization. However, by analysing the spectra of a more luminous subsample we can at least test whether their escape fractions are large compared to expectations based on reionization being driven uniformly from galaxies across the entire luminosity function. To date there has been no study at this epoch comparable to those undertaken by the above cited workers at . We present spectra taken with both X-shooter at the ESO Very Large Telescope (VLT) as well as a sample of 31 galaxies taken with Faint Object Camera and Spectrograph (FOCAS; Kashikawa et al. 2002) and Optical System for Imaging and low-intermediate-Resolution Integrated Spectroscopy (OSIRIS; Cepa et al. 2000) at the Subaru and Gran Telescopio Canarias (GTC) telescopes, respectively. We analyze both individual spectra as well as a composite example to determine the nature of LIS features at the highest redshift for which absorption line work is currently practical.
Such absorption line spectra can also be used to examine the stellar metallicity of galaxies at high redshift and, particularly, the stellar mass - stellar metallicity relation (Cullen et al. 2019). This is a more attractive, although admittedly more challenging, observational target than that based on gas-phase metallicites, for which there remains debate in the literature about the merits of using local calibrations for the various accessible emission lines, as well as the relative importance of composition and the ionizing radiation field (Steidel et al. 2014). Indeed, gas-phase metallicities beyond redshifts vary widely according to the technique used. Shapley et al. (2017) estimate the metallicity of a luminous galaxy at to be using the [Neiii]/[Oii] ratio, suggesting a source in the process of enrichment, whereas Faisst et al. (2016) report near solar metallicities at based on empirically calibrated relations between absorption line equivalent widths and metallicities.
A plan of the paper follows. In §2 we discuss the selection of LBGs which form the basis of the present analysis as well as the spectroscopic observations and associated data reduction. In §3 we use a cross-correlation technique to determine the individual redshifts prior to producing composite spectra and their uncertainties. In §4 we discuss our spectra in terms of the covering fraction of LIS absorption and investigate the reliability of using absorption line depths based on our lower resolution Subaru and GTC spectra via comparisons with the X-shooter data. We also derive both stellar and interstellar based metallicities and compare these with mass-dependent relationships available at lower redshifts. In §5 we discuss briefly the implications of our results both for recent models of late cosmic reionization and constraints on the age and earlier enrichment history of our sample.
Throughout this paper we use the recent Planck cosmological parameter sets constrained with the temperature power spectrum, temperature-polarization cross spectrum, polarization power spectrum, low- polarization, CMB lensing, and external data (TT, TE, EE+lowP+lensing+ext result; Planck Collaboration et al. 2016): , , , and . We assume the Salpeter (1955) initial mass function (IMF) with lower and upper mass cutoffs of and , respectively. All magnitudes are in the AB system (Oke & Gunn 1983), and are corrected for Galactic extinction (Schlegel et al. 1998). The definition of the solar metallicity is given by and (Asplund et al. 2009).
2. Data
2.1. Galaxy Selection
The galaxies in this study were selected from the Subaru/Hyper Suprime-Cam Subaru strategic program (HSC-SSP) survey datasets (Aihara et al. 2018). The Subaru/HSC survey is a photometric survey with optical broad band filters and several narrow-band filters. The survey comprises three layers, UltraDeep, Deep, and Wide, with different combinations of area and depth (see Aihara et al. 2018 for details). LBGs at are selected from the HSC datasets using the dropout selection technique (Matsuoka et al. 2016, 2018a, 2018b, 2019; Ono et al. 2018; Harikane et al. 2018; Toshikawa et al. 2018), and some of the LBGs have been spectroscopically confirmed (Matsuoka et al. 2016, 2018a, 2018b, 2019; Ono et al. 2018). In this study, we focus on luminous LBGs near the end of the era of cosmic reionization, whose rest-frame UV spectra can be studied with optical spectrographs.

2.2. Spectroscopic Observations
2.2.1 Subaru/FOCAS and GTC/OSIRIS
A total of 31 luminous () LBGs at were spectroscopically confirmed with Subaru/FOCAS and GTC/OSIRIS. These 31 LBGs were classified as galaxies in Matsuoka et al. (2016, 2018a, 2018b, 2019) because the spectra do not show apparent AGN signatures such as broad or high ionization Nv emission lines. The spectroscopic data were taken in the SHELLQs program (Matsuoka et al. 2016, 2018a, 2018b, 2019). We will briefly explain the Subaru/FOCAS and GTC/OSIRIS observations and data reduction. Please see the SHELLQs papers (Matsuoka et al. 2016, 2018a, 2018b, 2019) for more details.
The majority of spectra were taken with Subaru/FOCAS observations from 2015 November to 2019 May (IDs: S15B-070, S16B-071I, and S18B-011I; P.I.: Y. Matsuoka). The observations were conducted with the VPH900 grism, SO58 order-sorting filter, and a ″ slit. This configuration provides coverage from to with a spectral resolution of , which covers Ly, Siii1260, Oi1302, Siii1304, Cii1334, and Siiv1394,1403 lines at . All the observations were carried out on gray nights with a seeing of ″″.
Six galaxies were observed with GTC/OSIRIS from 2016 April to 2018 September (GTC19-15B, GTC4-16A, GTC8-17A, GTC3-18A, GTC8-18B, and GTC32-19A; PI: K. Iwasawa). These data were taken with the R2500I grism and a ″ slit, providing coverage from to with a spectral resolution of . The observations were carried out on both dark and gray nights with a seeing of ″″.
The FOCAS and OSIRIS exposures are summarized in Table 1. All of the data was reduced using the Image Reduction and Analysis Facility (IRAF). Bias correction, flat fielding with dome flats, sky subtraction, and 1d extraction were performed using standard techniques and wavelength calibration was performed with reference to night sky emission lines. Flux calibration was based on white dwarf or B-type standard stars observed within a few days of the target observations. Slit losses were accounted for by scaling spectra to match the HSC magnitudes.
2.2.2 VLT/X-shooter
Our team was granted 4 half-nights in Visitor Mode in August-September 2017 initially to observe four LBGs among the HSC sample (J0215-0555, J0210-0523, J0219-0416 and J0210-0559, Program 099.A-0128, P.I.: R. Ellis). The planned observing time in each arm was chosen to maximize that in the NIR arm (, , and ). We adopted 1.0″11″, 0.9″11″, and 0.9″11″slits in the UVB, VIS, and NIR arms, respectively, covering Ly, Siii1260, Oi1302, Siii1304, Cii1334, Siiv1394,1403, Heii1640, Oiii]1661,1666, [Ciii]1907, and Ciii]1909 lines at . As a result of inclement weather, we concentrated our observations on the two brightest objects, namely J0215-0555111A fluorescent line Cii*1335Å has been detected in this spectra (see Bosman et al. 2019) () and J0210-0523 () for which we secured 7.5 hours in good seeing (0.7”) for each target. Data was reduced using the ESOReflex pipeline (Freudling et al. 2013) version 3.2.0. The rest-frame spectra for these two sources are shown in Figure 1. The systemic redshifts used to produce the rest-frame spectra were measured to be and for J0215-0555 and J0210-0523, respectively, following methods presented in Section 3.1. The median continuum signal-to-noise ratio is /pixel. As discussed below, the spectral resolution for these two sources ( in VIS and in NIR) complements that available for the larger sample of galaxies enabling us to test whether the lower resolution of the FOCAS and OSIRIS spectra is adequate for quantitative absorption line studies. The absence of high ionization lines such as Civ indicate no strong AGN activity in J0215-0555 and J0210-0523.
3. Analysis
3.1. Redshift Determination
In previous studies (Matsuoka et al. 2016, 2018a, 2018b, 2019), provisional redshifts for our 31 galaxies were determined using a variety of tracers including the Ly emission line, interstellar absorption lines and the Lyman discontinuity. It is well known that Ly emission is offset in velocity from the systemic redshift of a galaxy (Pettini et al. 2001). While various workers have attempted to infer the systemic redshift from Ly using trends based on its line strength (e.g. Adelberger et al. 2003, Nakajima et al. 2018a), these relations are poorly understood. Instead, for the purposes of stacking our spectra, we have determined their individual absorption line redshifts based on a cross-correlation technique (Tonry & Davis 1979). This has the advantage of using all the absorption features in each of our spectra rather than simply those few recognised visually. Each spectrum was zero-meaned and placed on a logarithmic wavelength scale and cross-correlated against the similarly-processed composite spectrum of 80 galaxies in Jones et al. (2012) smoothed to account for resolution differences. The absorption line redshift for each of our galaxies was determined using the peak in the cross-correlation function. The same technique was used for the higher resolution X-shooter spectra of J0215-0555 and J0210-0523. Since we will primarily be interested in the depth of absorption lines, small absorption line velocity offsets that might be present between the template and our spectra would lead to somewhat reduced covering fractions (discussed further in Section 4.2).
The newly-derived redshifts are presented in Table 1 and typically accurate to . Apart from the velocity offset of Ly, the results do not significantly differ from those reported in Matsuoka et al. (2016, 2018a, 2018b, 2019). In the specific case of J1211-0118 we adopt given this is more accurately determined from an ALMA observation (Harikane et al. 2020).
3.2. Composite Spectrum
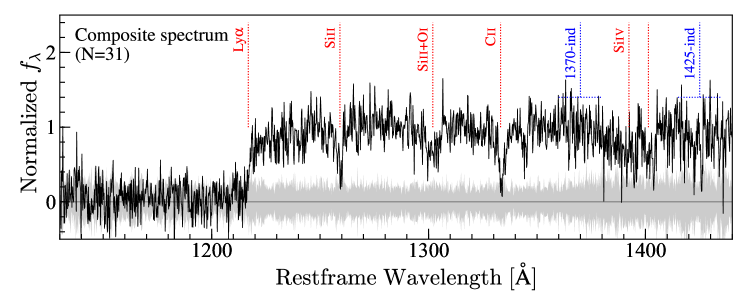
A composite spectrum of the 31 galaxies studied by FOCAS and OSIRIS was generated by resampling the individual spectra to the rest-frame, normalizing their fluxes to unity, and median stacking. In this way, all individual spectra have equal weight irrespective of the target brightness or spectral signal/noise. The error spectrum was estimated via bootstrap resampling. We created 100 alternate composites using the same reduced number of spectra drawn at random from the parent sample and adopted an error based upon the standard deviation of these composites. Both the composite and its error are presented in Figure 2. The median continuum signal-to-noise ratio is 5/pixel. The median redshift and UV luminosities of our sample of galaxies are and mag, respectively. Matsuoka et al. (2019) also constructed a composite spectrum of the same 31 galaxies using the provisional redshifts they measured. We note that the equivalent widths (EW) of the absorption lines we analyze in our composite spectrum agree well with their measurements.
4. Results
4.1. Absorption Features
In both the composite spectrum (Figure 2) and individual spectra (Figure 1), we can identify several interstellar absorption lines, including Siii1260, Oi1302, Siii1304, Cii1334, and Siiv1394,1403. In addition to these interstellar lines, we can also identify an absorption feature near Å consistent with a blend of stellar photospheric absorption lines arising from metal rich stars (Rix et al. 2004). In the individual X-shooter spectra of J0215-0555 and J0210-0523 that extend the wavelength coverage to longer wavelengths, we identify Siii1260, Oi1302, Siii1304, Cii1334, Siiv1394,1403, and Civ1548,1550. However, even with the superior spectral resolution, the Oi1302 and Siii1204 absorption lines remain blended. Collectively, the presence of these absorption lines indicate that the interstellar media (ISM) of our luminous galaxies are metal enriched, which we discuss in more detail in Section 4.3.
To obtain quantitative measures of these absorption lines, we fit the individual and composite spectra with Gaussian profiles as follows:
| (1) |
where , , , and are maximum line strength, central wavelength, line dispersion, and continuum intensity, respectively. The Oi1302 and Siii1304 lines are fitted only in the wavelength ranges corresponding to and , respectively, following Jones et al. (2013) in order to avoid contamination from the other feature. Table 2 presents the resulting absorption line depths, line widths (FWHM) and rest-frame EW. Velocity offsets from the systemic redshift are typically , consistent with the result derived from the composite spectrum (Jones et al. 2012). The absorption line widths are typically .
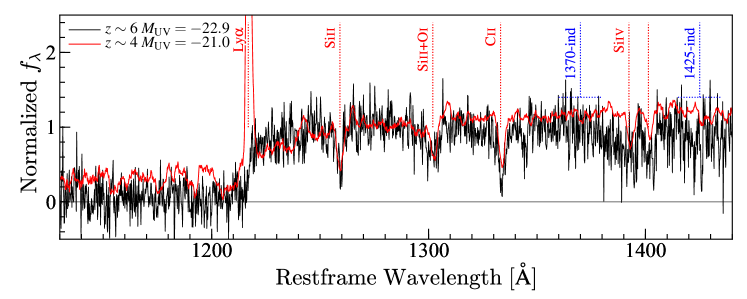
In Figure 3 we compare our composite spectrum with that derived for the 80 galaxies in Jones et al. (2012). The absorption lines at are deeper than those at , which we consider is more likely due to the increased luminosity of our sample ( c.f. at ) rather than an evolutionary effect over a modest time interval. Several studies have reported larger EWs in more luminous galaxies (e.g., Jones et al. 2012). Specifically, over the redshift range Du et al. (2018) report shallower absorption lines in higher redshift galaxies matched in the UV luminosity and stellar mass. This is opposite to the trend we would find if we interpreted our results as due to evolution.
4.2. Covering Fraction
To estimate the neutral gas (Hi) covering fraction, we now measure the maximum absorption depth for LIS interstellar absorption lines following the methodology adopted by Jones et al. (2013). Assuming the gas is distributed in a spherical shell, the absorption line profile is related to the covering fraction, , via
| (2) |
where is the continuum intensity defined as the median flux over the wavelength range without absorption lines, and is the optical depth of the relevant absorption line which is related to the column density as
| (3) |
where , , and are the ion oscillator strength, the transition wavelength in Å, and the column density in , respectively.
In their study, Jones et al. (2013) used Siii, , and and estimated as a function of velocity for several individual gravitationally-lensed galaxies. They found consistent results despite the different oscillator strengths indicating that the gas is optically thick. In the optically thick case (), Equation (2) simplifies to
| (4) |
Note that the covering fraction derived in this way formally represents a lower limit.
For the present analysis we constructed the average absorption line profile by calculating a weighted mean of LIS absorption lines as a function of velocity using only Siii1260 and Cii1334. We chose not to use Oi1302 or Siii1304 transitions because they are blended. Figure 4 shows the averaged absorption line profiles for our composite spectrum, the two X-shooter individual spectra of J0215-0555 and J0210-0523, and the composite in Jones et al. (2012). The estimated maximum absorption line depths are , , , and for our composite spectrum, J0215-0555, J0210-0523, and the composite spectrum, respectively, as summarized in Table 3. We note that if the systemic redshifts are not measured precisely, the absorption depth in our composite will be underestimated, indicating that true covering fraction could be larger. Finally we note that Jones et al. (2013) examined their average absorption line depths for a subsample based on the prominence of Ly emission where they found a possible positive correlation. Out of our sample of 31 spectra, only 8 galaxies show prominent Ly emission (with a median EW of 6.4 Å). We found no significant difference between the absorption line statistics in this stack and that for the larger sample of 23 sources without Ly emission.
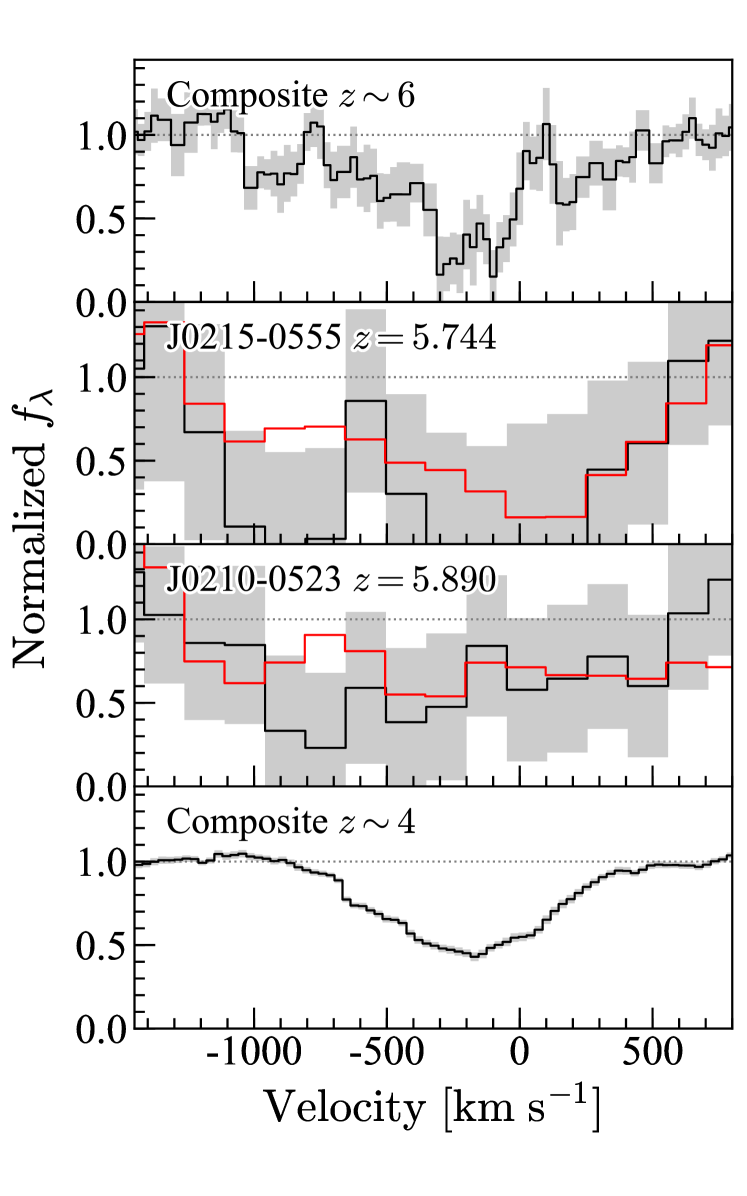
To understand possible systematics in our estimates of the maximum absorption depth based on the lower-resolution FOCAS and OSIRIS spectra, we constructed profiles for the specific cases of J0215-0555 and J0210-0523 and compared these with those based on the higher resolution X-shooter spectra (see red and black lines in Figure 4). We found no significant difference indicating that the resolution of FOCAS () is sufficient to estimate the maximum absorption line depth largely because of broad line widths involved (typically ). We also degraded the X-shooter spectra to the lower resolution appropriate for the FOCAS/OSIRIS composite and similarly found no change in the absorption line depth.
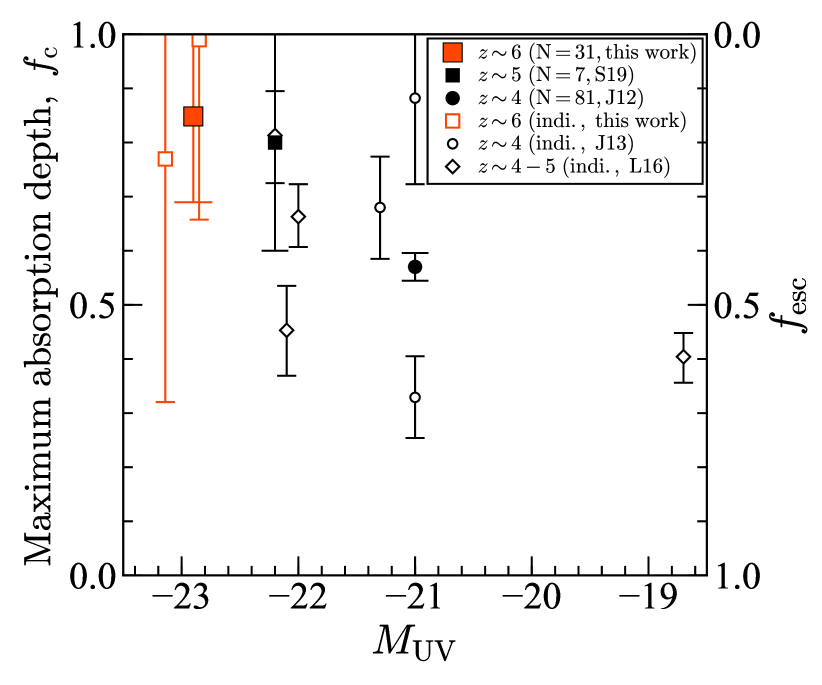
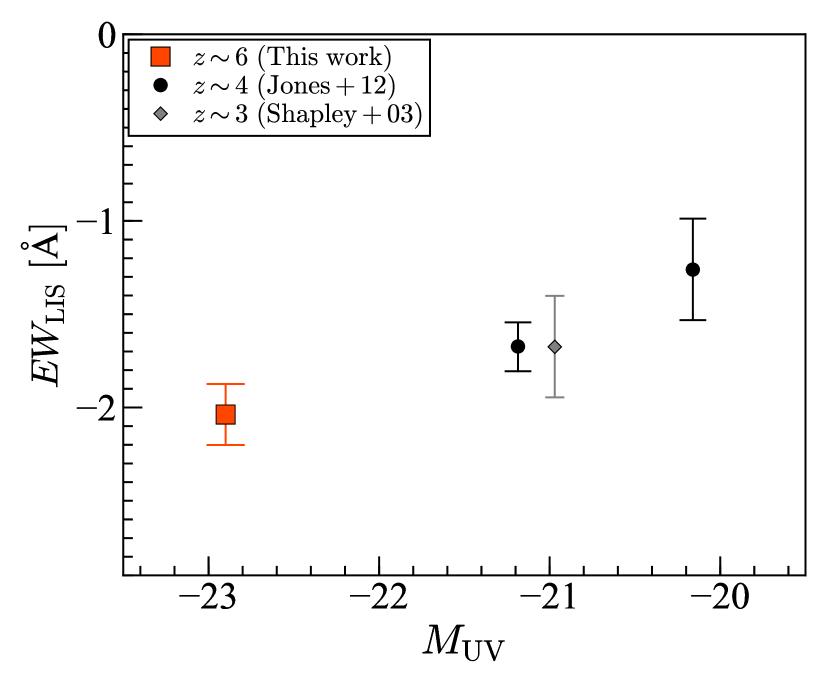
In Figure 5, we plot the estimated maximum absorption depth as a function of the UV luminosity. As discussed earlier, the maximum absorption depth of our galaxies is larger than those of less luminous sources at (Jones et al. 2012, 2013; Leethochawalit et al. 2016; Sugahara et al. 2019). This should not be interpreted as an evolutionary trend given the significantly different luminosities. The major implication is for a higher covering fraction of low ionization gas for our sample of luminous galaxies and thus a lower typical ionizing photon escape fraction. Figure 6 shows the EW of LIS absorption, , estimated from Siii1260 and Cii1334. is stronger with increasing luminosity, consistent with the trend in the maximum absorption depth.
4.3. Gas-phase metallicity
Since the rest-frame optical emission lines normally used to estimate gas-phase metallicities are redshifted to the mid-infrared beyond reach of ground-based telescopes, we can only use empirically-calibrated relations between the oxygen abundance and interstellar absorption line measures (Faisst et al. 2016). For this measure, we use the Oi1302+Siii1304 complex (referred to as the Siiii1300 complex in Faisst et al. 2016), Cii1334, Siiv1394,1403, and Civ1548,1550 (only for the X-shooter spectra). We use the best-fit parameters in Faisst et al. (2016), but an uncertainty of assuming the best-fit parameters is much smaller than the statistical errors. We estimate the metallicity for each absorption line, and calculate the weighted mean as the fiducial value. In this way, we find gas-phase metallicities close to solar values. Specifically, , , and (, , and ) for the composite spectrum, J0215-0555, and J0210-0523, respectively, as summarized in Table 3.
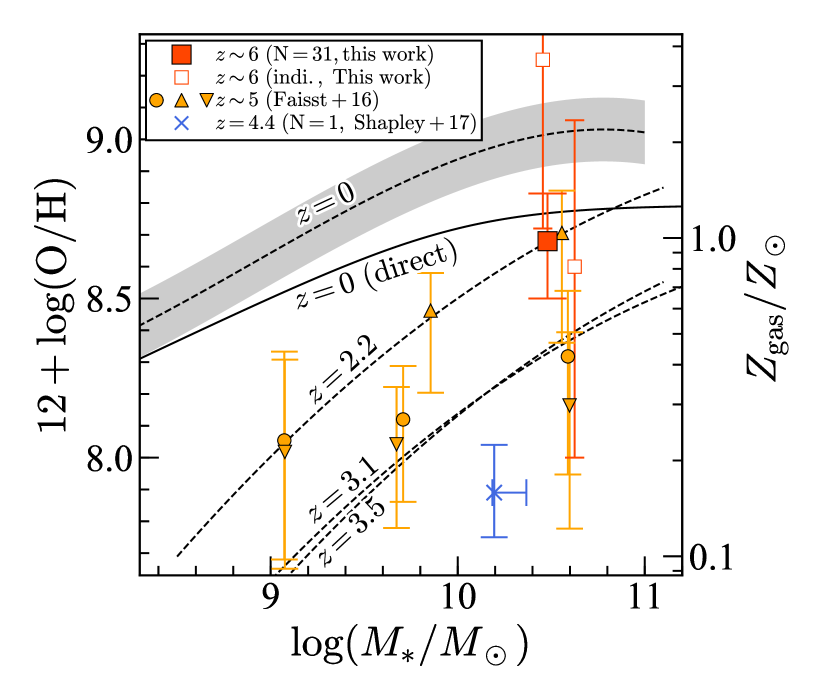
In Figure 7, we plot these gas-phase metallicities as a function of stellar mass where, in absence of Spitzer photometry, we derive approximate stellar masses based on an empirical relation with the UV luminosity given in Song et al. (2016). The resulting relation shows that our galaxies are already metal-enriched, and have metallicities comparable to those at the massive end of the mass-metallicity relation in Curti et al. (2020). Although these measures are comparable with those of galaxies with weak/no Ly emission (Faisst et al. 2016), they lie above mass metallicity relations at and in Maiolino et al. (2008) and Mannucci et al. (2009) which seems surprising. However, Nakajima & Ouchi (2014) point out that the published metallicities at would be higher if the assumed ionization parameter was closer to more recent estimates (e.g., Nakajima et al. 2013; Nakajima & Ouchi 2014; Harikane et al. 2020). Future JWST rest-frame optical spectroscopy for a large sample of high redshift galaxies will resolve this issue and securely determine the gas-phase metallicities and the mass-metallicity relation of high redshift galaxies.
4.4. Stellar metallicity
In our composite spectrum, we identify a significant feature near Å which arises from photospheric absorption associated with stellar winds in massive stars. Its absorption line strength (and that of the blend near 1370 and 1425 Å; the ‘1370’ and ‘1425’ indices) have been used as indicator of stellar metallicity (Leitherer et al. 2001; Rix et al. 2004).
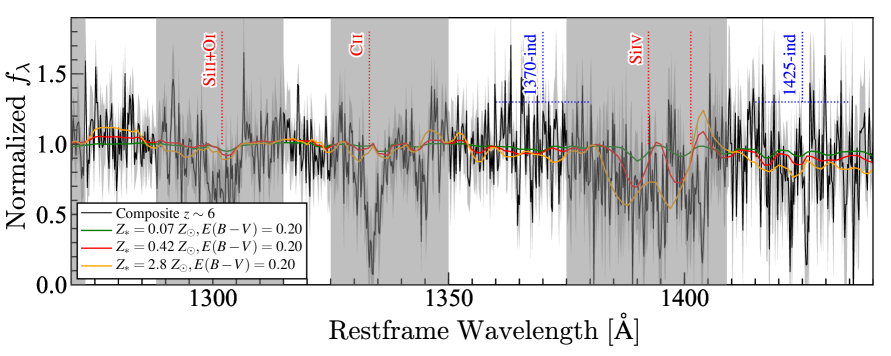
Although undoubtedly challenging to consider the possibility of deriving the stellar composition at , we compared our observed composite spectrum with model spectra assuming different metallicities following the techniques described by Steidel et al. (2016) and Cullen et al. (2019). By simulating the entire spectrum, we can also use additional weaker features. For our model spectra we ran BPASSv2222https://bpass.auckland.ac.nz/ (Eldridge & Stanway 2016; Stanway et al. 2016) sampling metalliticies over a grid of , adopting the Salpeter (1955) IMF including binary stars and a continuous star formation history with a duration of .333Assuming a shorter duration of does not change the conclusions, and assuming an older age does not affect our the results because the photospheric absorption line EWs near 1370 and 1425 Å are saturated at (Rix et al. 2004) As these models do not include the nebular continuum, we calculated the additional contribution using Cloudy (Ferland et al. 1998, 2017) version 17.01. Assuming typical high redshift values for the electron density and ionization parameter (Steidel et al. 2016), this contributes an additional 10% to the total far-UV continuum. The resulting model spectra were reddened following the Calzetti et al. (2000) dust extinction law parameterized by a color excess in the range of , and IGM attenuation applied following the approach given by Inoue et al. (2014). Finally the model spectra are smoothed to various resolutions to match the velocity width. Figure 8 shows a selection of models with , , and with alongside our composite spectrum.
To determine the best model, we calculated value for each model following
| (5) |
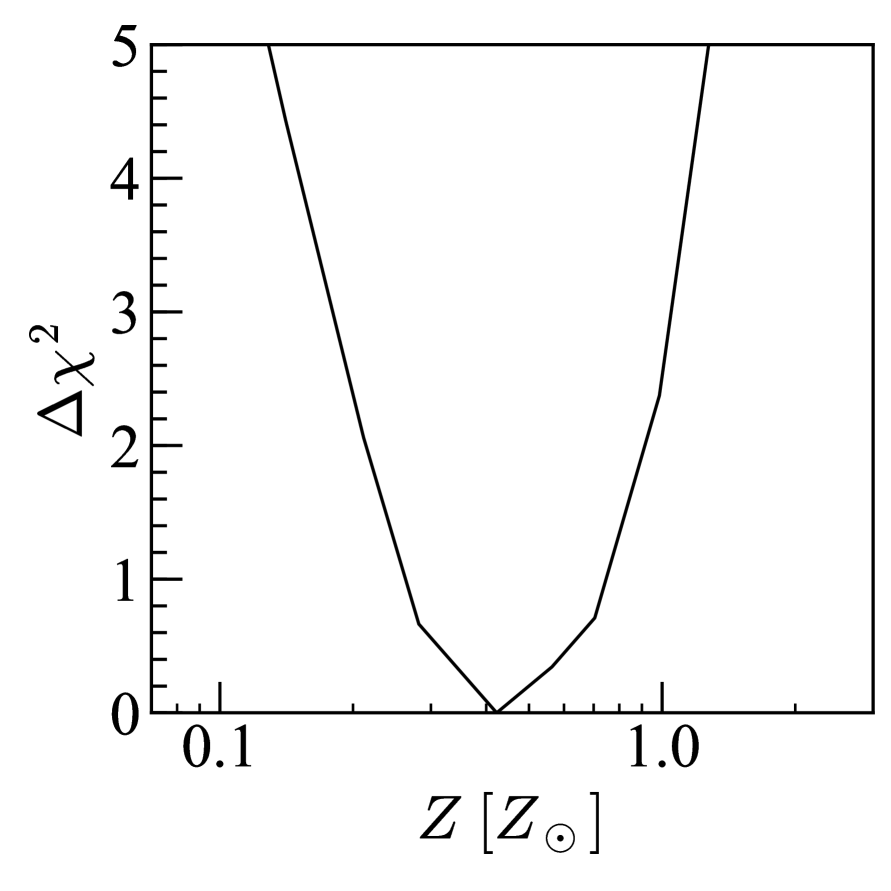
where and are the observed flux and its error at each wavelength, and is the model spectrum normalized to the observed continuum level. The fit was confined to wavelength ranges of , , , and which include absorption features near 1370 and 1425 Å and avoid interstellar features. Based on the values, our best-fit stellar metallicity and color excess with errors are, respectively, and with a reduced value of (see Table 3 and the red curve in Figure 8). Naturally the error bar for our stellar metallicity estimate is larger than that in Cullen et al. (2019) since our continuum signal-to-noise ratio is not as high as in their spectra.
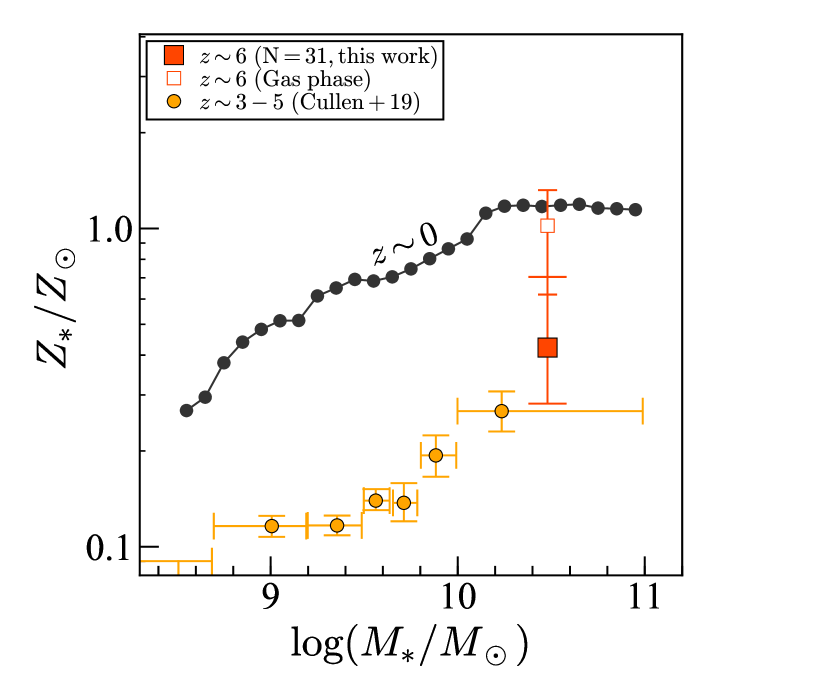
In Figure 9, we plot our estimated stellar metallicity as a function of the stellar mass. It can be seen that, for our luminous galaxies, our result agrees with an extrapolation of the mass-metallicity relation at from VANDELS in Cullen et al. (2019) and is significantly lower than the relation (Zahid et al. 2017). Importantly, our stellar metallicity is lower than the gas-phase metallicity estimated in Section 4.3. We return to discuss this difference in Section 5.2.
4.5. Emission Lines
The FOCAS and OSIRIS spectra cover Lya emission lines at . Among the 31 galaxies, only 8 galaxies show prominent Ly emission with a median EW of 6.4 Å (Matsuoka et al. 2016, 2018a, 2018b, 2019), indicating that Ly emission is weak in our luminous galaxies. The X-shooter spectra cover the both optical and near-infrared wavelength region where, at high redshift, important rest-frame UV emission lines such as Ly, Heii1640, Oiii]1661,1666, [Ciii]1907, and Ciii]1909 might be visible. We detect Ly emission lines in J0215-0555 whose EW is Å, consistent with Matsuoka et al. (2018a) within . We do not detect any of the other emission lines with typical upper limits of the rest-frame EW of Å. These non-detections are consistent with published trends for weaker emission in more luminous galaxies (e.g., Shapley et al. 2003; Shibuya et al. 2018). Since some of these lines are seen in metal-poor galaxies (e.g., Berg et al. 2018; Nakajima et al. 2018b), this provides further evidence that our galaxies are metal-enriched.
5. Discussion
5.1. Implication for Reionization
We find that the average low ionization gas covering fractions for our luminous galaxies is significant, , and, as shown in Figure 5, we consider this arises primarily due to a luminosity dependence. Given the expected inverse relationship with respect to the ionizing photon escape fraction, i.e. , and the fact the ionizing photon production efficiency for LBGs, , does not depend strongly on UV luminosity (e.g., Bouwens et al. 2016), our result implies that the most luminous galaxies at are not exceptional in their ionizing contribution, as we discuss further below.
Recently, there has been much interest in the suggestion that galaxies of various luminosities made distinct contributions to the reionization process due, for example, to differing escape fractions or ionizing photon production rates. This contrasts with early articles (e.g. Robertson et al. 2013, 2015) which assumed a constant and independent of luminosity so that the process was governed by the most abundant, low-luminosity, sources. Even so, a high average fraction, 0.2, was deemed necessary to complete reionization by .
To resolve this possible ‘ionizing photon deficit’, Finkelstein et al. (2019) presented a model where the escape fraction is significantly higher in less luminous galaxies on the basis of simulations conducted by Paardekooper et al. (2015). In this model, of the ionizing budget arises from sub-luminous galaxies with . While possibly consistent with the present paper’s results, Finkelstein’s model predicts a relatively smooth evolution of the IGM neutral hydrogen fraction, e.g., at , which seems in tension with measures of QSO damping wings and Ly fractions, (Bolton et al. 2011; Bañados et al. 2018; Mason et al. 2018, 2019; Hoag et al. 2019), as mentioned in Finkelstein et al. (2019) and Naidu et al. (2020).
The apparent rapid evolution of over led Naidu et al. (2020) to propose an alternative model where late reionization is governed by the most luminous galaxies with high star formation rate surface densities, . Adopting a relationship whereby resulting in the higher escape fraction in more luminous galaxies, of the ionizing budget is contributed by luminous galaxies with , and the abrupt end of the reionization process as indicated by Gunn-Peterson troughs, QSO damping wings and Ly fractions can be reconciled. Although we emphasize it is not yet practical to conduct absorption line spectroscopy for a representative sample of the galaxy population to , the larger covering fraction we find for a more luminous subset does not provide any support for such a model.
Ultimately, progress in addressing the relative roles of galaxies of different luminosities will depend on the accuracy of the various measures of the IGM neutral fraction, . Finkelstein et al. (2019) discuss several reasons to be cautious when interpreting QSO damping wing and Ly fraction data, because the derived measurements are very model dependent. If, as we suggest, escape fractions are indeed lower in luminous galaxies, the validity of current measures of may need to be re-considered. Other factors that may need to be reconsidered include the dependence on UV luminosity and the AGN contribution. Higher in more luminous galaxies, or a significant contribution from AGN could reproduce the observed rapid evolution of , although current observations do not strongly support these.
5.2. Enhanced ratio
We find that the gas-phase metallicity estimated from our composite spectrum, , is higher than the stellar metallicity, . Such a difference is also seen in lower redshift galaxies (Steidel et al. 2016; Cullen et al. 2019). We note that the empirical relations used to estimate the gas-phase metallicity is calibrated with the oxygen abundance, , whereas the stellar metallicity is estimated from photospheric absorption in the rest-UV continuum dominated mainly by iron-peak element (Steidel et al. 2016). Accordingly the difference between gas-phase and stellar metallicities indicates a non-solar elemental abundance pattern, i.e., a super-solar ratio.444It is safe to assume that gas-phase and stellar metallicities trace similar timescales because our stellar metallicity is estimated from the rest-UV spectrum dominated by short-lived massive stars. From our two metallicity estimates in the composite spectrum, we derive an ratio of . Although the error is large, such a super-solar ratio has also been reported at lower redshifts; at (Steidel et al. 2016; Strom et al. 2018; Topping et al. 2019) and at (Cullen et al. 2019).
A super-solar ratio is not surprising for galaxies whose ISM has been enriched primarily by Type II (core-collapse) supernovae (SNe) . Oxygen is a primary product of core-collapse SNe and therefore has a short formation timescale, while iron production occurs largely from Type Ia SNe which form Gyr after star formation (Figure 1 in Maiolino & Mannucci 2019). Quantitatively, the yield from core-collapse SNe is a super-solar ratio; for the Salpeter (1955) IMF (Nomoto et al. 2006), for the Kroupa (2001) IMF (Chieffi & Limongi 2004; Limongi & Chieffi 2006). By contrast, the yield from Type Ia SNe is (Iwamoto et al. 1999). For our galaxies, seen after the Big Bang, metal enrichment is therefore dominated by core-collapse SNe with yields of .
5.3. Implication for star formation prior to
The near-solar gas-phase metallicity we observe for our galaxies is higher than that predicted by recent theoretical simulations. For example, the IllustrisTNG simulation predicts a gas-phase metallicity of for massive galaxies at with (Torrey et al. 2019). Although the FIRE simulation predicts the mass-metallicity relation only to masses of (Ma et al. 2016), extrapolating the relation still implies at . As discussed in Cullen et al. (2019), these simulations suffer from uncertainties in the assumed stellar yields, the strength of galactic outflows and star formation histories. Although there are several large uncertainties in the stellar mass and metallicity estimates, the higher metallicities we observe may imply star formation began much earlier than predicted in the simulations.
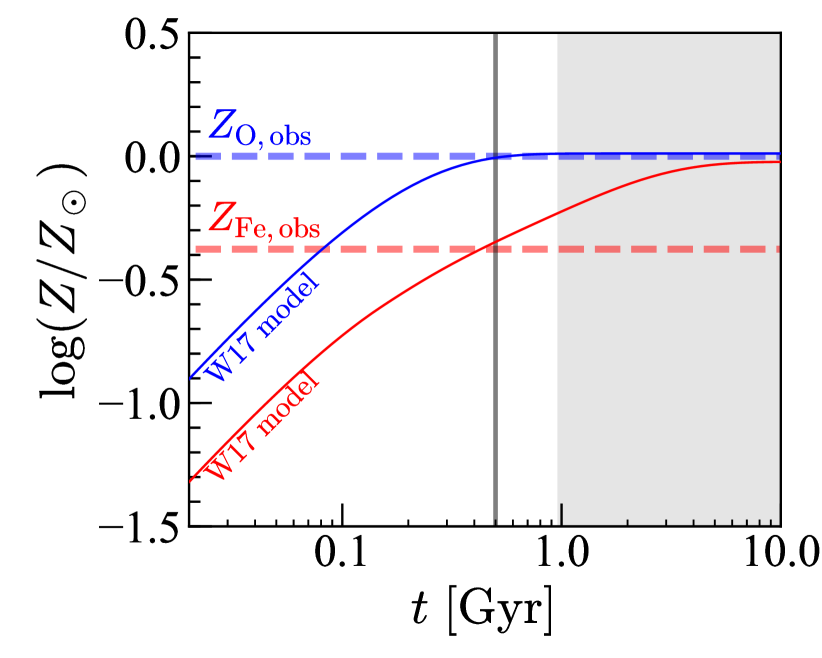
To quantify the possibility of star formation prior to , we compare our results with the analytic one-zone chemical evolution model presented in Weinberg et al. (2017, hereafter W17). In this model, gas is enriched from both core-collapse and Type Ia SNe with yields given by Chieffi & Limongi (2004), Limongi & Chieffi (2006), and Iwamoto et al. (1999). Type Ia SNe suffer a minimum delay time of and an -folding timescale of that are fiducial values in W17. The star formation rate (SFR) is coupled to the gas mass () with a gas depletion timescale, , assumed to be constant. Here we adopt following the prescription of Scoville et al. (2017) at . The gas outflow is assumed to be a constant multiple of the SFR with a mass-loading factor of , where we assume (we discuss the sensitivity to this choice below). The case for three star formation histories are explicitly solved in W17, but here we consider the constant star formation history for illustrative purposes.
Figure 10 shows the evolving abundances as a function of time from initial star formation. The oxygen abundance rapidly reaches a solar value in whereas for the iron abundance this takes . To reproduce the observed values in the case of a constant SFR we need a stellar age of . Decreasing pushes metal enrichment to earlier epochs, but a constant SFR is still needed over a duration of even for the case of zero outflow (). While uncertainties remain, the metallicities we observe in our galaxies indicate enrichment that began up to prior to , corresponding to a formation redshift , consistent with that implied by mature stellar populations inferred in higher redshift galaxies (Hashimoto et al. 2018; Roberts-Borsani et al. 2020).
6. Summary
We examine the absorption line spectra of a sample of 31 luminous Lyman break galaxies at redshift selected from the Subaru/Hyper Suprime-Cam Subaru strategic program for which spectra were taken using the Subaru/FOCAS and GTC/OSIRIS spectrographs. For two individual sources we present longer exposure data taken at higher spectral resolution with VLT/X-shooter. Using these data, we demonstrate the practicality of stacking our lower resolution data to measure the depth of absorption lines and thereby to probe both the covering fraction of low ionization gas and the mean gas-phase and stellar metallicity near the end of cosmic reionization. Our major findings are summarized below.
-
1.
We identify interstellar absorption lines of Siii, Oi, Cii, and Siiv in the composite and individual spectra of our galaxies. These absorption lines are deep and broad, typically with EWs of Å and line widths of . As a result of these broad absorption lines, we verify using our higher resolution X-shooter spectra that the spectral resolution of the FOCAS and OSIRIS data is sufficient to reliably estimate the depth of absorption.
-
2.
We find a maximum absorption depth of in the composite spectrum of our luminous ( mag) galaxies. This is deeper than that of less luminous ( mag) galaxies at and indicates a higher gas covering fraction and, by implication, a lower ionizing photon escape fraction. Our result suggests that the most luminous galaxies may not play a prominent role in concluding reionization. Our result tends to support earlier models where the bulk of the ionizing photons arise from lower luminosity galaxies (e.g. Robertson et al. 2013, 2015, Finkelstein et al. 2019). Since the predictions from these models in tension with model-dependent measurements of the neutral fraction based on the damping wing in QSO spectra and the incidence of Ly emission in color-selected galaxies, it is important to understand the accuracy of such measures, as well as other factors such as the dependence on UV luminosity and the AGN contribution.
-
3.
We estimate the gas-phase metallicity of our galaxies using empirical relations linking these to the EWs of interstellar absorption lines. We find abundances close to solar, indicating that our luminous galaxies are already metal enriched at . Similarly, we estimate a lower stellar metallicity of solar, which we interpret in terms of a super-solar O/Fe ratio given the stellar and gas-phase metallicities trace different elements enriched by core-collapse SNe. A comparison with the one-zone chemical evolution model in Weinberg et al. (2017) indicates that metal enrichment in our galaxies began up to prior to , corresponding to a formation redshift .
Our study provides a valuable impetus for more detailed absorption line studies of individual galaxies which will become practical with the James Webb Space Telescope.
| Name | Instrument | (mins) | Ref. | |||
|---|---|---|---|---|---|---|
| (1) | (2) | (3) | (4) | (5) | (6) | (7) |
| J02150555 | X-shooter | 450 | This work | |||
| FOCAS | 220 | M16 | ||||
| J02100523 | X-shooter | 450 | This work | |||
| FOCAS | 83 | M16 | ||||
| J02190416 | FOCAS | 80 | M16 | |||
| J02100523 | FOCAS | 83 | M16 | |||
| J08570142 | FOCAS | 100 | M16 | |||
| J08480045 | FOCAS | 140 | M16 | |||
| J16284312 | FOCAS | 170 | M18a | |||
| J12110118 | OSIRIS | 60 | M18a | |||
| J16304315 | FOCAS | 45 | M18a | |||
| J22330124 | FOCAS | 60 | M18a | |||
| J02120158 | OSIRIS | 60 | M18a | |||
| J02180220 | FOCAS | 60 | M18a | |||
| J01590359 | FOCAS | 60 | M18a | |||
| J22370006 | FOCAS | 100 | M18a | |||
| J14280159 | OSIRIS | 30 | M18b | |||
| J09170056 | OSIRIS | 120 | M18b | |||
| J02120315 | FOCAS | 50 | M18b | |||
| J02120532 | FOCAS | 50 | M18b | |||
| J23110050 | FOCAS | 50 | M18b | |||
| J16095515 | FOCAS | 80 | M18b | |||
| J10060300 | FOCAS | 45 | M18b | |||
| J09140442 | FOCAS | 50 | M18b | |||
| J02190132 | FOCAS | 30 | M18b | |||
| J09150051 | FOCAS | 75 | M18b | |||
| J135348.55001026.5 | OSIRIS | 60 | M19 | |||
| J144216.08423632.5 | FOCAS | 30 | M19 | |||
| J092117.65030521.5 | FOCAS | 30 | M19 | |||
| J115755.51001356.2 | FOCAS | 40 | M19 | |||
| J123841.97011738.8 | FOCAS | 30 | M19 | |||
| J162657.22431133.0 | FOCAS | 50 | M19 | |||
| J020649.98020618.2 | OSIRIS | 60 | M19 |
Note. — (1) Object Name. (2) Redshift. (3) Absolute UV magnitude. (4) Stellar mass estimated from the UV magnitude with the relation at in Song et al. (2016). (5) Instrument. (6) Exposure time. (7) Reference (M16: Matsuoka et al. 2016, M18a: Matsuoka et al. 2018a, M18b: Matsuoka et al. 2018b, M19: Matsuoka et al. 2019).
∗The systemic redshift of J12110118 is derived from ALMA observations in Harikane et al. (2020).
| Name | Ion | FWHM | |||
|---|---|---|---|---|---|
| (Å) | ) | (Å) | |||
| (1) | (2) | (3) | (4) | (5) | (6) |
| Composite spectrum | Ly | 1215.69 | |||
| Si ii | 1260.42 | ||||
| O i | 1302.17 | ||||
| Si ii | 1304.37 | ||||
| C ii | 1334.53 | ||||
| Si iv | 1393.76 | ||||
| Si iv | 1402.77 | ||||
| J02150555 | Ly | 1215.69 | |||
| Si ii | 1260.42 | ||||
| O i | 1302.17 | ||||
| Si ii | 1304.37 | ||||
| C ii | 1334.53 | ||||
| Si iv | 1393.76 | ||||
| Si iv | 1402.77 | ||||
| C iv | 1548.20 | ||||
| C iv | 1550.78 | ||||
| He ii | 1640.42 | ||||
| O iii] | 1660.81 | ||||
| O iii] | 1666.15 | ||||
| [C iii] | 1906.68 | ||||
| C iii] | 1908.73 | ||||
| J02100523 | Ly | 1215.69 | |||
| Si ii | 1260.42 | ||||
| O i | 1302.17 | ||||
| Si ii | 1304.37 | ||||
| C ii | 1334.53 | ||||
| Si iv | 1393.76 | ||||
| Si iv | 1402.77 | ||||
| C iv | 1548.20 | ||||
| C iv | 1550.78 | ||||
| He ii | 1640.42 | ||||
| O iii] | 1660.81 | ||||
| O iii] | 1666.15 | ||||
| [C iii] | 1906.68 | ||||
| C iii] | 1908.73 |
Note. — (1) Object Name. (2) Ion. (3) Rest-frame vacuum wavelength. (4) Amplitude of the line. (5) Width of the line corrected for the instrumental broadening. (6) Equivalent width of the line. The upper limit is .
| Name | Max. abs. depth | |||||
|---|---|---|---|---|---|---|
| (1) | (2) | (3) | (4) | (5) | (6) | (7) |
| composite | ||||||
| J02150555 | ||||||
| J02100523 |
Note. — (1) Object Name. (2) Redshift. (3) Absolute UV magnitude. (4) Stellar mass estimated from the UV magnitude with the empirical relation in Song et al. (2016). (5) Maximum absorption depth. (6) Gas-phase metallicity. (7) Stellar metallicity
References
- Adelberger et al. (2003) Adelberger, K. L., Steidel, C. C., Shapley, A. E., & Pettini, M. 2003, ApJ, 584, 45
- Aihara et al. (2018) Aihara, H., Arimoto, N., Armstrong, R., et al. 2018, PASJ, 70, S4
- Asplund et al. (2009) Asplund, M., Grevesse, N., Sauval, A. J., & Scott, P. 2009, ARA&A, 47, 481
- Bañados et al. (2018) Bañados, E., Venemans, B. P., Mazzucchelli, C., et al. 2018, Nature, 553, 473
- Berg et al. (2018) Berg, D. A., Erb, D. K., Auger, M. W., Pettini, M., & Brammer, G. B. 2018, ApJ, 859, 164
- Bolton et al. (2011) Bolton, J. S., Haehnelt, M. G., Warren, S. J., et al. 2011, MNRAS, 416, L70
- Bosman et al. (2019) Bosman, S. E. I., Laporte, N., Ellis, R. S., Ouchi, M., & Harikane, Y. 2019, MNRAS, 487, L67
- Bouwens et al. (2016) Bouwens, R. J., Smit, R., Labbé, I., et al. 2016, ApJ, 831, 176
- Calzetti et al. (2000) Calzetti, D., Armus, L., Bohlin, R. C., et al. 2000, ApJ, 533, 682
- Cepa et al. (2000) Cepa, J., Aguiar, M., Escalera, V. G., et al. 2000, Society of Photo-Optical Instrumentation Engineers (SPIE) Conference Series, Vol. 4008, OSIRIS tunable imager and spectrograph, ed. M. Iye & A. F. Moorwood, 623–631
- Chieffi & Limongi (2004) Chieffi, A., & Limongi, M. 2004, ApJ, 608, 405
- Chisholm et al. (2018) Chisholm, J., Gazagnes, S., Schaerer, D., et al. 2018, A&A, 616, A30
- Cullen et al. (2019) Cullen, F., McLure, R. J., Dunlop, J. S., et al. 2019, MNRAS, 487, 2038
- Curti et al. (2020) Curti, M., Mannucci, F., Cresci, G., & Maiolino, R. 2020, MNRAS, 491, 944
- Dow-Hygelund et al. (2005) Dow-Hygelund, C. C., Holden, B. P., Bouwens, R. J., et al. 2005, ApJ, 630, L137
- Du et al. (2018) Du, X., Shapley, A. E., Reddy, N. A., et al. 2018, ApJ, 860, 75
- Eldridge & Stanway (2016) Eldridge, J. J., & Stanway, E. R. 2016, MNRAS, 462, 3302
- Erb et al. (2006) Erb, D. K., Shapley, A. E., Pettini, M., et al. 2006, ApJ, 644, 813
- Faisst et al. (2016) Faisst, A. L., Capak, P. L., Davidzon, I., et al. 2016, ApJ, 822, 29
- Ferland et al. (1998) Ferland, G. J., Korista, K. T., Verner, D. A., et al. 1998, PASP, 110, 761
- Ferland et al. (2017) Ferland, G. J., Chatzikos, M., Guzmán, F., et al. 2017, Rev. Mexicana Astron. Astrofis., 53, 385
- Finkelstein et al. (2019) Finkelstein, S. L., D’Aloisio, A., Paardekooper, J.-P., et al. 2019, ApJ, 879, 36
- Fletcher et al. (2019) Fletcher, T. J., Tang, M., Robertson, B. E., et al. 2019, ApJ, 878, 87
- Freudling et al. (2013) Freudling, W., Romaniello, M., Bramich, D. M., et al. 2013, A&A, 559, A96
- Harikane et al. (2018) Harikane, Y., Ouchi, M., Ono, Y., et al. 2018, PASJ, 70, S11
- Harikane et al. (2020) Harikane, Y., Ouchi, M., Inoue, A. K., et al. 2020, ApJ, 896, 93
- Hashimoto et al. (2018) Hashimoto, T., Laporte, N., Mawatari, K., et al. 2018, Nature, 557, 392
- Hoag et al. (2019) Hoag, A., Bradač, M., Huang, K., et al. 2019, ApJ, 878, 12
- Inoue et al. (2014) Inoue, A. K., Shimizu, I., Iwata, I., & Tanaka, M. 2014, MNRAS, 442, 1805
- Iwamoto et al. (1999) Iwamoto, K., Brachwitz, F., Nomoto, K., et al. 1999, ApJS, 125, 439
- Jones et al. (2012) Jones, T., Stark, D. P., & Ellis, R. S. 2012, ApJ, 751, 51
- Jones et al. (2018) —. 2018, ApJ, 863, 191
- Jones et al. (2013) Jones, T. A., Ellis, R. S., Schenker, M. A., & Stark, D. P. 2013, ApJ, 779, 52
- Kashikawa et al. (2002) Kashikawa, N., Aoki, K., Asai, R., et al. 2002, PASJ, 54, 819
- Kewley & Ellison (2008) Kewley, L. J., & Ellison, S. L. 2008, ApJ, 681, 1183
- Kroupa (2001) Kroupa, P. 2001, MNRAS, 322, 231
- Leethochawalit et al. (2016) Leethochawalit, N., Jones, T. A., Ellis, R. S., Stark, D. P., & Zitrin, A. 2016, ApJ, 831, 152
- Leethochawalit et al. (2019) Leethochawalit, N., Kirby, E. N., Ellis, R. S., Moran, S. M., & Treu, T. 2019, ApJ, 885, 100
- Leitherer et al. (2001) Leitherer, C., Leão, J. R. S., Heckman, T. M., et al. 2001, ApJ, 550, 724
- Limongi & Chieffi (2006) Limongi, M., & Chieffi, A. 2006, ApJ, 647, 483
- Ma et al. (2016) Ma, X., Hopkins, P. F., Faucher-Giguère, C.-A., et al. 2016, MNRAS, 456, 2140
- Maiolino & Mannucci (2019) Maiolino, R., & Mannucci, F. 2019, A&A Rev., 27, 3
- Maiolino et al. (2008) Maiolino, R., Nagao, T., Grazian, A., et al. 2008, A&A, 488, 463
- Mannucci et al. (2009) Mannucci, F., Cresci, G., Maiolino, R., et al. 2009, MNRAS, 398, 1915
- Mason et al. (2018) Mason, C. A., Treu, T., Dijkstra, M., et al. 2018, ApJ, 856, 2
- Mason et al. (2019) Mason, C. A., Fontana, A., Treu, T., et al. 2019, MNRAS, 485, 3947
- Matsuoka et al. (2016) Matsuoka, Y., Onoue, M., Kashikawa, N., et al. 2016, ApJ, 828, 26
- Matsuoka et al. (2018a) —. 2018a, PASJ, 70, S35
- Matsuoka et al. (2018b) Matsuoka, Y., Iwasawa, K., Onoue, M., et al. 2018b, ApJS, 237, 5
- Matsuoka et al. (2019) —. 2019, ApJ, 883, 183
- Naidu et al. (2020) Naidu, R. P., Tacchella, S., Mason, C. A., et al. 2020, ApJ, 892, 109
- Nakajima et al. (2016) Nakajima, K., Ellis, R. S., Iwata, I., et al. 2016, ApJ, 831, L9
- Nakajima et al. (2018a) Nakajima, K., Fletcher, T., Ellis, R. S., Robertson, B. E., & Iwata, I. 2018a, MNRAS, 477, 2098
- Nakajima & Ouchi (2014) Nakajima, K., & Ouchi, M. 2014, MNRAS, 442, 900
- Nakajima et al. (2013) Nakajima, K., Ouchi, M., Shimasaku, K., et al. 2013, ApJ, 769, 3
- Nakajima et al. (2018b) Nakajima, K., Schaerer, D., Le Fèvre, O., et al. 2018b, A&A, 612, A94
- Nomoto et al. (2006) Nomoto, K., Tominaga, N., Umeda, H., Kobayashi, C., & Maeda, K. 2006, Nucl. Phys. A, 777, 424
- Oke & Gunn (1983) Oke, J. B., & Gunn, J. E. 1983, ApJ, 266, 713
- Ono et al. (2018) Ono, Y., Ouchi, M., Harikane, Y., et al. 2018, PASJ, 70, S10
- Paardekooper et al. (2015) Paardekooper, J.-P., Khochfar, S., & Dalla Vecchia, C. 2015, MNRAS, 451, 2544
- Pettini et al. (2001) Pettini, M., Shapley, A. E., Steidel, C. C., et al. 2001, ApJ, 554, 981
- Planck Collaboration et al. (2016) Planck Collaboration, Ade, P. A. R., Aghanim, N., et al. 2016, A&A, 594, A13
- Reddy et al. (2016) Reddy, N. A., Steidel, C. C., Pettini, M., Bogosavljević, M., & Shapley, A. E. 2016, ApJ, 828, 108
- Rix et al. (2004) Rix, S. A., Pettini, M., Leitherer, C., et al. 2004, ApJ, 615, 98
- Roberts-Borsani et al. (2020) Roberts-Borsani, G., Ellis, R. S., & Laporte, N. 2020, arXiv e-prints, arXiv:2002.02968
- Robertson et al. (2015) Robertson, B. E., Ellis, R. S., Furlanetto, S. R., & Dunlop, J. S. 2015, ApJ, 802, L19
- Robertson et al. (2013) Robertson, B. E., Furlanetto, S. R., Schneider, E., et al. 2013, ApJ, 768, 71
- Salpeter (1955) Salpeter, E. E. 1955, ApJ, 121, 161
- Saxena et al. (2020) Saxena, A., Pentericci, L., Mirabelli, M., et al. 2020, A&A, 636, A47
- Schlegel et al. (1998) Schlegel, D. J., Finkbeiner, D. P., & Davis, M. 1998, ApJ, 500, 525
- Scoville et al. (2017) Scoville, N., Lee, N., Vanden Bout, P., et al. 2017, ApJ, 837, 150
- Shapley et al. (2003) Shapley, A. E., Steidel, C. C., Pettini, M., & Adelberger, K. L. 2003, ApJ, 588, 65
- Shapley et al. (2017) Shapley, A. E., Sanders, R. L., Reddy, N. A., et al. 2017, ApJ, 846, L30
- Shibuya et al. (2018) Shibuya, T., Ouchi, M., Harikane, Y., et al. 2018, PASJ, 70, S15
- Shivaei et al. (2018) Shivaei, I., Reddy, N. A., Siana, B., et al. 2018, ApJ, 855, 42
- Song et al. (2016) Song, M., Finkelstein, S. L., Ashby, M. L. N., et al. 2016, ApJ, 825, 5
- Stanway et al. (2016) Stanway, E. R., Eldridge, J. J., & Becker, G. D. 2016, MNRAS, 456, 485
- Stark (2016) Stark, D. P. 2016, ARA&A, 54, 761
- Steidel et al. (2018) Steidel, C. C., Bogosavljević, M., Shapley, A. E., et al. 2018, ApJ, 869, 123
- Steidel et al. (2010) Steidel, C. C., Erb, D. K., Shapley, A. E., et al. 2010, ApJ, 717, 289
- Steidel et al. (2016) Steidel, C. C., Strom, A. L., Pettini, M., et al. 2016, ApJ, 826, 159
- Steidel et al. (2014) Steidel, C. C., Rudie, G. C., Strom, A. L., et al. 2014, ApJ, 795, 165
- Strom et al. (2018) Strom, A. L., Steidel, C. C., Rudie, G. C., Trainor, R. F., & Pettini, M. 2018, ApJ, 868, 117
- Sugahara et al. (2019) Sugahara, Y., Ouchi, M., Harikane, Y., et al. 2019, ApJ, 886, 29
- Tonry & Davis (1979) Tonry, J., & Davis, M. 1979, AJ, 84, 1511
- Topping et al. (2019) Topping, M. W., Shapley, A. E., Reddy, N. A., et al. 2019, arXiv e-prints, arXiv:1912.10243
- Torrey et al. (2019) Torrey, P., Vogelsberger, M., Marinacci, F., et al. 2019, MNRAS, 484, 5587
- Toshikawa et al. (2018) Toshikawa, J., Uchiyama, H., Kashikawa, N., et al. 2018, PASJ, 70, S12
- Weinberg et al. (2017) Weinberg, D. H., Andrews, B. H., & Freudenburg, J. 2017, ApJ, 837, 183
- Wise et al. (2014) Wise, J. H., Demchenko, V. G., Halicek, M. T., et al. 2014, MNRAS, 442, 2560
- Zahid et al. (2017) Zahid, H. J., Kudritzki, R.-P., Conroy, C., Andrews, B., & Ho, I. T. 2017, ApJ, 847, 18