Insight-HXMT identification of a non-thermal X-ray burst from SGR J1935+2154 and with FRB 200428
Abstract
Fast radio bursts (FRBs) are short pulses observed in radio band from cosmological distances[2]. One class of models invoke soft gamma-ray repeaters (SGRs), or magnetars, as the sources of FRBs[3]. Some radio pulses have been observed from some magnetars[4], however, no FRB-like events had been detected in association any magnetar burst, including one giant flare[5]. Recently, a pair of FRB-like bursts (FRB 200428 hereafter) separated by 29 milliseconds (ms) were detected from the general direction of the Galactic magnetar SGR J1935+2154[6, 7]. Here we report the detection of a non-thermal X-ray burst in the 1–250 keV energy band with the Insight-HXMT satellite[8], which we identify as emitted from SGR J1935+2154. The burst showed two hard peaks with a separation of 34 ms, broadly consistent with that of the two bursts in FRB 200428. The delay time between the double radio and X-ray peaks is s, fully consistent with the dispersion delay of FRB 200428. We thus identify the non-thermal X-ray burst is associated with FRB 200428 whose high energy counterpart is the two hard peaks in X-ray. Our results suggest that the non-thermal X-ray burst and FRB 200428 share the same physical origin in an explosive event from SGR J1935+2154.
Key Laboratory of Particle Astrophysics, Institute of High Energy Physics, Chinese Academy of Sciences, 19B Yuquan Road, Beijing 100049, China
Department of Astronomy, Beijing Normal University, Beijing 100875, China
University of Chinese Academy of Sciences, Chinese Academy of Sciences, Beijing 100049, China
Department of Astronomy, Tsinghua University, Beijing 100084, China
Department of Physics and Astronomy, University of Nevada, Las Vegas, NV 89154, USA
Technology and Engineering Center for Space Utilization, Chinese Academy of Sciences, Beijing 100094, China
Institut für Astronomie und Astrophysik, Kepler Center for Astro and Particle Physics, Eberhard Karls Universität, Sand 1, 72076 Tübingen, Germany
Institute of High Energy Physics, Chinese Academy of Sciences, 19B Yuquan Road, Beijing 100049, China
Department of Physics, Tsinghua University, Beijing 100084, China
Department of Engineering Physics, Tsinghua University, Beijing 100084, China
Computing Division, Institute of High Energy Physics, Chinese Academy of Sciences, 19B Yuquan Road, Beijing 100049, China
Key Laboratory of Space Astronomy and Technology, National Astronomical Observatories, Chinese Academy of Sciences, Beijing 100012, China
College of physics Sciences and Technology, Hebei University, Baoding City, Hebei Province, 071002, China
School of Physics and Optoelectronics, Xiangtan University, Xiangtan City, Hunan Province, 411105, China
College of Physics, Jilin University, Changchun City, Jilin Province, 130012, China
SGR J1935+2154 was discovered when it went into outburst in 2014[9]. Since then and before 2020, the source experienced several activities in 2015 February, 2016 May to July and 2019 November[10, 11, 12]. Between outbursts, isolated bright flares or short bursts in X-ray or gamma-ray have been detected from the source[13, 11]. These make SGR J1935+2154 one of the most active magnetars. Starting from 2020 April 27 18:26:20 UT, a series of X-ray and gamma-ray instruments were triggered by multiple short bursts and a burst forest including hundreds of bursts from SGR J1935+2154[14, 15]. Within thirteen hours, we started a long Target of Opportunity (ToO) observation of this source using Insight-HXMT with all its three collimated telescopes covering 1–10 keV (Low Energy X-ray telescope, LE), 5–30 keV (Medium Energy X-ray telescope, ME) and 20–250 keV (High Energy X-ray telescope, HE), respectively. This pointed ToO observation continued for 60 ks from April 28 07:14:52 UT to April 29 11:53:01 UT. During the Insight-HXMT observation, a double-peaked and short radio burst, FRB 200428, from the general direction of SGR J1935+2154 was reported by CHIME/FRB[6] and STARE2[7] at April 28 UTC 14:34:24 (at 600 MHz and 1.4 GHz), respectively. The fluence of this radio burst recorded by STARE2[7] is 1.5 MJy ms, which is over six magnitudes brighter than those radio bursts from XTE J1810-197[4], which had been the brightest radio bursts from magnetars. This makes it the first possible magnetar radio burst detectable from an extra-galactic distance (e.g FRB 180916.J0158+65 at 149 Mpc[7]), if FRB 200428 were emitted from SGR J1935+2154.
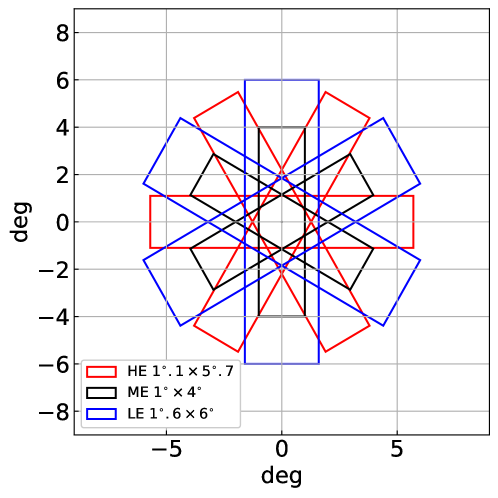
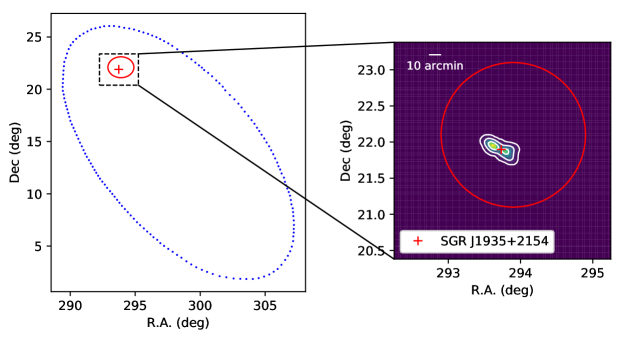
Insight-HXMT detected a series of 11 bursts within about 17 hours of exposure to SGR J1935+2154 (see Methods for description and Supplementary Table 1 for burst list). It is mostly likely that most, if not all, of these bursts came from SGR J1935+2154, since it was the only active magnetar in this period and in the field of view of Insight-HXMT. The brightest burst with a trigger time (denoted as ) of April 28 14:34:24.0000 UT (satellite time) or 14:34:24.0114 UT (geocentric time) lasted for about 1 second in 1–250 keV and was seen clearly in all three telescopes. This burst is also the closest one in time to FRB 200428. With different orientations of the collimators, Insight-HXMT can localize the burst within its field of view, as shown in Figure 1. The burst is located at deg, deg, 3.7 arcmin away from SGR J1935+2154 with error of 10 arcmin. We thus identify this burst as coming from SGR J1935+2154. INTEGRAL was also triggered on this event and identified its source to the same magnetar[16].
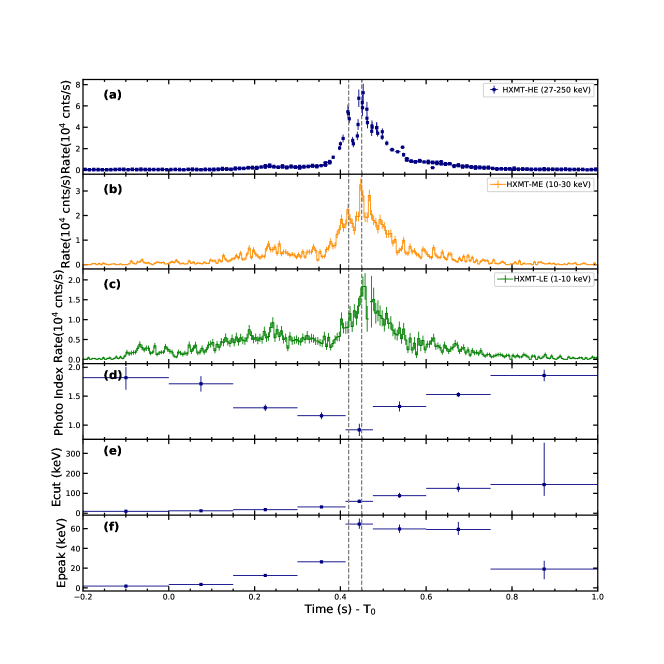
This burst was so bright that it saturated both LE and HE, and also caused moderate deadtime effects in ME. After correcting all these effects (see Methods), the lightcurves of the burst obtained by the three telescopes are presented in Figure 2. The full lightcurves of this burst consist of two major bumps separated by about 0.2 s, and a minor soft bump just before that is only present in LE and ME data, indicating overall spectral evolution as shown in Figure 2 during the burst. The second major bump, which was also detected by INTEGRAL[16] and Konus-Wind[17], is much brighter than the first one. In the lightcurves of both ME and HE, two narrow peaks are clearly seen (see Methods) during the second major bump. In the LE lightcurve, only the second narrow peak is visible significantly, indicating somewhat different broad band energy spectra between the two narrow peaks. The separation time between the two narrow X-ray peaks ( ms) is broadly consistent with the 29 ms separation between the two narrow peaks in FRB 200428, and the apparent time lag between X-ray and radio peaks (8.62 s) is in good agreement with the calculated dispersion delay (8.62 s) between X-ray and radio using the DM (333 pc/cm3) measured by CHIME/FRB[6] and STARE2[7]. We thus identify the burst detected by Insight-HXMT is associated with FRB 200428 and both belong to a single explosive event from SGR J1935+2154.
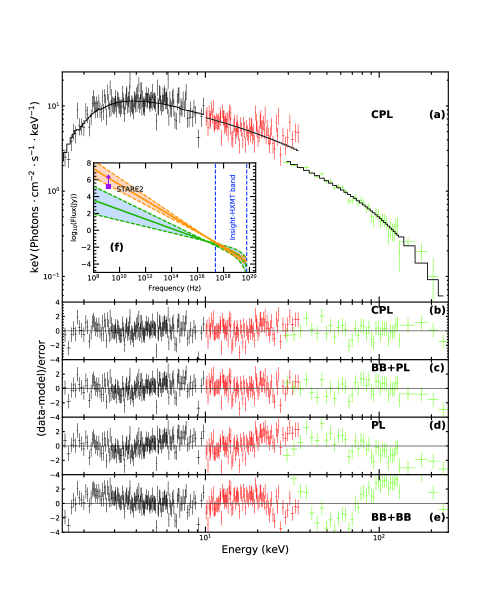
The time-integrated spectrum of this burst ( s to s) is derived jointly using HE, ME and LE data (Figure 3, see Methods for details of spectral fitting). The best fit and statistically acceptable model is a cutoff power-law (CPL) with neutral hydrogen column density , photon index and cutoff energy (corresponding to a peak energy keV). The unabsorbed fluence is ( in 1–250 keV, corresponding to a total emission energy of for the 12.5 kpc[18] distance of SGR J1935+2154 and for a closer distance of 4.4 kpc[16]. This burst is brighter than of events collected from the source during with Fermi/GBM[11]. We also fit the spectrum with several other spectral models, e.g., single power-law (PL), double blackbody (BB+BB) and blackbody plus power-law (BB+PL). The fit to the BB+PL model is marginally consistent with data, with slightly higher column density () and larger photon index (); the flux of the unabsorbed blackbody component with temperature of is only 18% of the total flux in 1–250 keV. The other two models provide significantly worse fit and are thus rejected.
We conclude that the integrated spectrum is dominated by a power-law covering at least the 1-100 keV range, and thus this burst is primarily non-thermal in nature. It is also clear that the two narrow peaks separated by 34 ms must also be dominated by a non-thermal spectrum, since the peak energy ( in time resolved spectral analysis) reaches its maximum during the peak of the second bump of the lightcurves where the two narrow peaks are found. It is interesting to note that the lower limit of the radio flux detected with STARE2[7] falls in between the extrapolated values from the non-thermal X-ray spectrum with the power-law parameters of the fits to the CPL and BB+PL models (see the inset (f) in Figure 3).
In summary, with the observation of Insight-HXMT we have identified that the short non-thermal X-ray burst was emitted by the Galactic magnetar SGR J1935+2154 and produced almost simultaneously with FRB 200428 in a single explosive event. In the literature, FRB emission has been interpreted as either coherent curvature radiation of electron-positron pairs from a neutron star magnetosphere[19, 20, 21] or synchrotron maser emission in a relativistic, magnetized shock[22, 23]. Since magnetar bursts are believed to be magnetosphere-related[24], the fact that the narrow double peaks in both radio and X-ray are emitted around the same time, and hence, likely originate from the same emission region, lends support to the magnetospheric models of FRBs.
However, a thermal origin is preferred for normal short bursts from magnetars[25, 26]. We notice that of the bursts () from SGR J1935+2154 detected with Fermi/GBM between 2014 and 2016 can be best fit with a power-law model[11]. The fluence of these bursts is about one order of magnitude dimmer than this one associated with FRB 200428. We therefore set a conservative upper limit of to the percentage of magnetar bursts which may have similar radio emission to FRB 200428. This is consistent with the non-radio detection from the hard X-ray bursts of SGR J1935+2154 during the same bursting phase[27]. Actually, non-thermal X-ray bursts are very rarely observed from magnetars in general, which may explain why events similar to FRB 200428 have not been seen previously. However, selection bias cannot be excluded since large field of view radio observations have only become available recently.
Previously we have conducted a search for prompt -ray counterparts to FRBs[28] in the Insight-HXMT data and obtained only upper limits as low as erg s-1 over 1 s for the periodic repeater FRB 180916.J0158+65. If this X-ray burst were emitted from an extragalactic magnetar located at a distance of FRB 180916.J0158+65 at 149 Mpc[29], and assume the distance of SGR J1935+2154 is 12.5 kpc[18], then the observed fluence should be in 1-250 keV ( for a distance of 4.4 kpc[16]), which is far below the sensitivity limits of the X-ray telescopes currently in orbit (or in the foreseeable future). This may explain the non-detection of the X-ray counterpart of any cosmological FRB so far. Nevertheless, our identification of FRB 200428 with a magnetar means at least some of FRBs are produced by magnetars, thus FRBs can be used as an effective tool to study the extra-galactic magnetars, which are otherwise undetectable. On the other hand, giant flares from magnetars can have peak luminosity of , about 4–7 orders of magnitude more luminous than this non-thermal X-ray burst, and thus might be detectable with the current X-ray telescopes in orbit or the future X-ray missions, such as eXTP[30] which has a much larger effective area in the X-ray band than those X-ray telescopes in orbit.
Methods
0.1 Insight-HXMT observations and burst search
The Insight-Hard X-ray Modulation Telescope (Insight-HXMT) is China’s first X-ray astronomy satellite[8, 31, 32] which was launched on June 15th, 2017. It has an altitude of 550 km and an inclination of 43 degrees. As a broadband X-ray (1–250 keV) observatory, Insight-HXMT consists of three telescopes, i.e., the High Energy X-ray telescope (HE) using 18 NaI(Tl)/CsI(Na) phoswich scintillation detectors for 20–250 keV[33], the Medium Energy X-ray telescope (ME) using 1728 Si-PIN detectors for 5–30 keV[34], and the Low Energy X-ray telescope (LE) using 96 Swept Charge Device (SCD) detectors for 1–15 keV[35]. All three telescopes use slat collimators to confine their Field Of Views (FOVs). In addition to the pointed or scanning observation with the collimators, Insight-HXMT can also monitor the all-sky in gamma-ray (0.2–3 MeV) using the CsI scintillation detectors of HE. More details about the Insight-HXMT can be found in[8].
A dedicated and long Time of Opportunity (ToO) observation of Insight-HXMT was implemented for SGR J1935+2154 from 2020-04-28T07:14:51 to 2020-04-29T00:00:00, and a throughout search for X-ray bursts have been made. The trigger condition for the search is that the count rates of three or more NaI detectors of HE exceeds the background count rate, which is the mean count rate in the previous 10 s, with significance greater than at five time scales ( 0.05 s, 0.1 s, 0.2 s, 0.5 s and 1 s). This search results in 11 bursts. The starting time and other properties are listed in Supplementary Table 1, where the fluence is obtained by fitting their spectra with simple spectral models (i.e. PL or CPL), as the fluence does not varies significantly with which spectral model is used. Saturation and deadtime corrections are made before spectral fitting, according to the procedures described below. More detailed analyses of these bursts will be presented elsewhere.
The rest of this Methods part is mainly dedicated to the burst at 2020-04-28T14:34:24.00 (UTC) that is associated with FRB 200428. Because of the extreme brightness, the Insight-HXMT data suffers substantial saturation and deadtime effects, which require dedicated corrections as detailed below.
0.2 Data analysis
The timing and spectral results of the X-ray burst associated with FRB 200428 are obtained by analysing the Insight-HXMT 1L data with the Insight-HXMT Data Analysis Software package (HXMTDAS) version 2.02. Specifically, the steps are: (1) Use the commands hepical, mepical, lepical in HXMTDAS to calibrate the photon events from the 1L data according to the Calibration Database (CALDB) of Insight-HXMT. As for HE, the short spikes with known characteristics produced in the electronics are removed from the physical events. (2) Select the good time intervals (GTIs) from -0 to +1 s, where is 2020-04-28 14:34:24 UTC. (3) Extract the good events based on the GTIs using the commands hescreen, mescreen, and lescreen. (4) Generate the spectrum with the selected events using the commands hespecgen, mespecgen, and lespecgen. (5) Create the background spectrum from the events in the time interval to . (6) Generate the response matrix files required for spectral analysis using the commands herspgen, merspgen, and lerspgen. (7) Produce the raw ME and LE lightcurves using the commands, melcgen, and lelcgen.
Due to the strong saturation effect in both LE and HE data, the raw data in some time intervals were discarded on-board and their lightcurves need to be corrected as presented below.
0.3 Data saturation and deadtime correction
Because of the extremely high flux of the burst, the detected events exceeded the storage limits of their on-board data buffer, and so the observed data suffered from saturation. The observational effect of saturation is that in some time intervals the events are lost. Besides the saturation effect, during the procession of an event by the front-end electronics, the detectors sharing the same Physical Data Acquisition Unit (PDAU) can not record any photons, and such an effect is called deadtime. As will be detailed below, both HE and LE suffered strongly from the saturation effects, while the deadtime effects are significant in the HE and ME data. Both the saturation and deadtime need to be corrected when we produce the lightcurves and spectra.
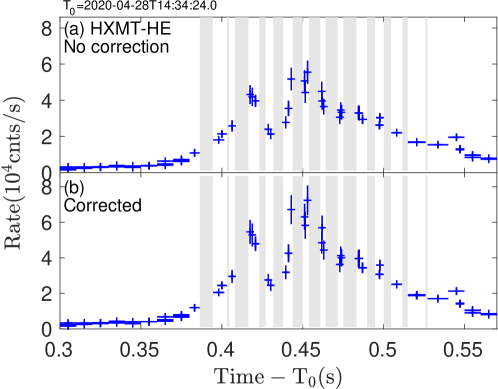
The 18 phoswich X-ray detectors of HE are divided into three groups, each contains six detectors that share one PDAU. Therefore, the three groups of detectors have different event-lost intervals and the common gaps for three groups are shown in Supplementary Figure 1. We correct for the saturation effects in the data of the three groups independently, and then combine them together when we produce the final lightcurve.
The steps of saturation correction for a group of HE detectors are listed as follows: (1) Find the start and stop time of the intervals in which the raw data are not lost. (2) Calculate the deadtime ratio of each detector as a function of time, the details of which can be found in Xiao et al. (2020)[36]. (3) Screen the data in these time intervals to discard the CsI events (anti-coincident events), as well as the events whose energies are out of the selected energy band. Then, the number of NaI events can be obtained for each detector in the group. Using the time intervals selected in the first step and the deadtime ratio calculated in the second step, the true source count rate of each detector in the group can be obtained. (4) Merge the count rate of all detectors in each group and calculate the error of the merged rate. It should be noted that, for the third group (Group ID is 2), as the events of the blinded detector are not used, a factor of 6/5 is used to normalize its count rate, so that the count rates of the three groups can be compared at the same level and combined together to produce the overall HE lightcurve.
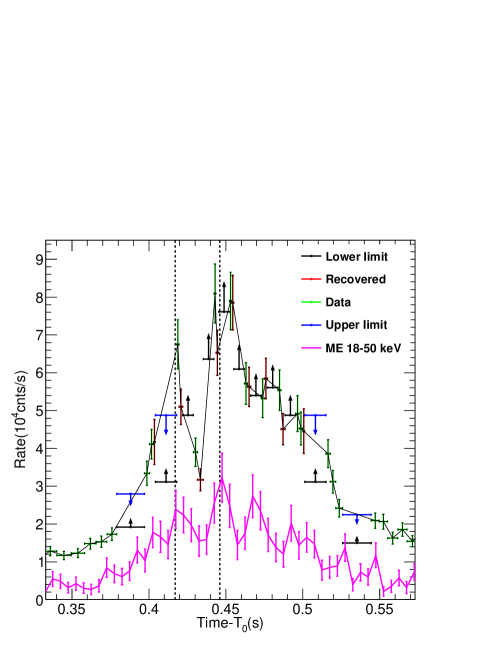
According to the design of HE, the detected events are sent to a First-In-First-Out (FIFO) storage buffer. Limited by the FIFO memory capacity and the data transmission bandwidth on board, part of data blocks would be lost when observing ultra bright sources. That is why we can find some gaps in the original light curves. Fortunately, thanks to the special status flags of the FIFO, we can recover some data points with average count rate values or absolute upper/lower limit values to fill the gaps in the raw count rates, consisting of events of all energies between 20-250 keV but without information on the energy deposition of each event. As shown in Supplementary Figure 2, the structure of the two narrow peaks is visible more clearly in the HE raw count rates during the X-ray burst. From the upper limits of the raw count rates corresponding to the first peak of the FRB, the data gaps do not affect either the position of first narrow peak or the separation of the double narrow peaks of the X-ray burst.
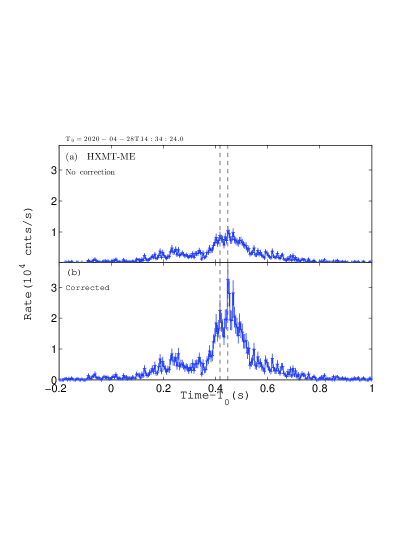
ME does not suffer from the saturation effect and the raw data have no time gap. The deadtime of ME can be calculated with HXMTDAS v2.02. The number and ratio of the lost events in and are also listed in Supplementary Table 2. The lightcurves before and after deadtime corrections are shown in Supplementary Figure 3. The lightcurve in energy range 18-50 keV is shown in Supplementary Figure 2. There are three narrow peaks in this light cure. The first two narrow peaks correspond to the two narrow peaks of HE lightcurve. While the third narrow peak around T0+0.47s, corresponding to the second bright peak in whole lightcurve in Figure 2(b) (10-30 keV), is softer, which means that most of the X-ray photons have lower energy and caused the data loss of LE and the gaps in the LE lightcurve as shown in Figure 2(c) or Supplementary Figure 4.
LE has three detector boxes and each box contains 32 SCD detectors. The data of each detector box can be processed independently. In the LE data, besides the normal physical events with energies above the on-board threshold, LE also has the forced trigger events, which record the amplitude of the noise or the pedestal offset for each SCD detector in every 32 ms[32]. The count rate of the forced trigger events in each detector box is 1000 counts per second if there is no saturation effect.
The LE lightcurves are then corrected for saturation using the count rate of the recorded forced trigger events. Since the three detector boxes have different saturated time intervals, we reconstructed the LE lightcurve with almost the full time coverage. The lightcurves before and after saturation correction are shown in Supplementary Figure 4. The deadtime of LE caused by the force trigger events can also be calculated by HXMTDAS, which are listed in Supplementary Table 2. It is a minor and negligible issue.
0.4 The two narrow peaks
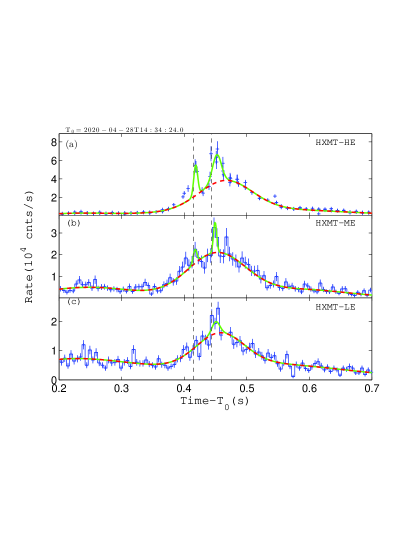
As shown in Figure 2, the lightcurve in each energy band roughly consists of two bumps located at around +0.2 and +0.45 s, and the HE and ME lightcurves show two narrow peaks on the second main bump. In order to estimate the significance and to get the exact time of each peak, the HE and ME lightcurves are fitted by five Gaussian functions, in which two of them are used to describe the two narrow peaks,
| (1) |
where , and are the normalization, and are the arrival times of the two narrow peaks, and are the Gaussian widths of the two narrow peaks. describes the three Gaussian functions for the broad components of the lightcurve, where is the background level of the lightcurve. From the fitting results, the separation of the two narrow peaks is calculated from .
As shown in Supplementary Figure 5 (a) and (b), the lightcurves of HE and ME could be well fitted by equation 1. If the normalization of the two narrow components is set to 0, the reduced- is 4.1 (d.o.f.=30) for the fitting to the data points in +0.35 to +0.43 s that contains the first narrow peak. Similarly, the reduced- is 3.0 (d.o.f.=29) for duration +0.43 to +0.50 s that contains the second narrow peak. These large reduced- values verify the high detection significance of the two narrow peaks.
As shown in Supplementary Figure 5 (c), the lightcurve of LE can be well fitted by . A narrow peak corresponding to the second narrow peak in HE and ME lightcurves is also visible, though not as significant as in HE and ME lightcurves.
0.5 Spectral analyses and model comparison
We extract the spectrum using data in a duration of 1.2 s, from - 0.2 s to + 1 s. Deadtime correction is a built-in function of the HXMTDAS and has been considered in spectral analysis. However, the saturation correction is not implemented in spectrum generation but will be dealt with in spectral fitting process.
We use XSPEC version 12.10.0c to analyze the spectra. Four different models are used to fit the spectra, which are (1) single power-law (PL), (2) cutoff power-law (CPL) , (3) two blackbody (BB+BB) and (4) blackbody plus power-law (BB+PL). In addition, we use a constant () to represent the saturation effect in LE and HE and the model to account for the absorption of the interstellar medium. Eventually, the four models are: , , and . The best-fit parameters and their uncertainties are listed in Supplementary Table 4. The distribution of the fitted residuals is displayed in Figure 2 of the main article.
From Supplementary Table 4 and Figure 2 of the main article we can easily reject the single power-law model and the two temperature blackbody model, but the cutoff power-law (CPL) and the blackbody plus power-law model (BB+PL) fit the burst spectra well, though the latter has relatively higher values and slightly structured residual above 80 keV. Discussions about these models can be found in the main article.
Supplementary Table 5 lists the spectrum parameters of the burst compared with Konus-Wind and INTEGRAL. When using all data of LE, ME and &HE, the reduced indicates that the CPL model is much better than the 2BB model, while Konus-Wind and INTEGRAL data can not distinguish the two models. For comparison, we limit the energy band of the spectrum as from 20 keV to 250 keV, and re-extract the spectrum in time range from +0.2 s to +0.8 s (similar to INTEGRAL) or from +0.435 s to +0.7 s (similar to Konus-Wind). In such cases, we obtain similar spectrum parameters as Konus-Wind and INTEGRAL, and can not determine which model is preferred. The unabsorbed flux is ( in 20–200 keV with the CPL model, which is slightly lower than the one obtained by INTEGRAL (), possibly due to cross-calibration issues between the two instruments. As mentioned in the main article, we can exclude the thermal spectral model (BB+BB) and conclude the non-thermal nature of this peculiar X-ray burst, due to the broad energy coverage of Insight-HXMT, especially the 1-20 keV coverage which is not available in either Konus-Wind or INTEGRAL.
0.6 Time resolved spectrum
In order to analyze the spectral evolution, we split the GTI from s to s into eight time intervals and extract the spectrum from each of them (Supplementary Table 6). We fit the eight spectra with cut-off power-law model and statistics. The neutral hydrogen column density is fixed to the same value of the time-integrated spectrum. The parameter of the component in the model is set free due to the data saturation and deadtime effects. The evolution of , photon index and for the burst associated with the FRB are shown in the bottom three panels of Figure 2. increases with time, reaches the minimum value at the two peaks, while arises before the two peaks, keeps a plateau during the burst, and falls down to a low value after the burst.
0.7 Localization of the X-ray burst
Although the three telescopes of Insight-HXMT point to the same nominal directions, the long axis directions of their Field Of Views (FOVs) are different, which could be used to locate the burst. Supplementary Figure 6 shows the FOVs of the three telescopes of Insight-HXMT. Every telescope has three groups of FOVs whose long axis directions are 60 degree different from the neighbouring ones. When the direction of a source deviates from the center of the FOVs, the count rates on detectors with different FOVs decrease with different slopes, following the shapes of the Point Spread Functions (PSF) [37], which allow us to fit the position of the source using the count rates of the burst on different detectors and their PSFs and thus provides localization of bright sources within the FOV of Insight-HXMT with several arcmin accuracy [37].
PSFs of all Insight-HXMT collimators have been calibrated [37], which are then used to reconstruct the position of the source from the differences of the count rates between different FOVs. This localization method has been extensively tested and verified with Insight-HXMT observations [38, 39].
For the localization of this burst, count rates of all the three telescopes from UTC 2020-04-28T14:34:24 to UTC 2020-04-28T14:34:25 are used, after saturation and deadtime corrections according to Supplementary Table 2. In the fitting, for all the the three telescopes the same burst position (RA and Dec) parameters are assumed with three different normalized flux parameters. A Markov Chain Monte Carlo (MCMC) algorithm is utilized in the fitting. The best fitting result gives a reduced of 0.845 for 4 degrees of freedom. Figure 1 shows the distributions of position parameters derived from the MCMC approach. The best-fit location of the burst is 3.7 arcmin away from that of SGR J1935+2154 with uncertainty of 10 arcmin, fully consistent with SGR J1935+2154.
Data availability
The data that support the plots within this paper and other findings of this study are available from the Insight-HXMT website (http://www.hxmt.cn/ or http://www.hxmt.org/).
Code Availability
The Insight-HXMT data reduction was performed using software available from the Insight-HXMT website (http://www.hxmt.cn/ or http://www.hxmt.org/). The model fitting of spectra was completed with XSPEC, which is available from the HEASARC website (https://heasarc.gsfc.nasa.gov/).
References
References
- [1]
- [2] Lorimer, D. R., Bailes, M., McLaughlin, M. A., Narkevic, D. J. & Crawford, F. A Bright Millisecond Radio Burst of Extragalactic Origin. Science 318, 777 (2007).
- [3] Petroff, E., Hessels, J. W. T. & Lorimer, D. R. Fast radio bursts. Ann. Rev. Astron. Astrophys. 27, 4 (2019).
- [4] Camilo, F. et al. Transient pulsed radio emission from a magnetar. Nature 442, 892–895 (2006).
- [5] Tendulkar, S. P., Kaspi, V. M. & Patel, C. Radio Nondetection of the SGR 1806-20 Giant Flare and Implications for Fast Radio Bursts. Astrophys. J. 827, 59 (2016).
- [6] The Chime/FRB Collaboration, B. Â. C., Andersen et al. A bright millisecond-duration radio burst from a Galactic magnetar. Nature 587, 54–58 (2020).
- [7] Bochenek, C. D. et al. A fast radio burst associated with a Galactic magnetar. Nature 587, 59–62 (2020).
- [8] Zhang, S.-N. et al. Overview to the Hard X-ray Modulation Telescope (Insight-HXMT) Satellite. Science China Physics, Mechanics, and Astronomy 63, 249502 (2020).
- [9] Israel, G. L. et al. The discovery, monitoring and environment of SGR J1935+2154. Mon. Not. R. Astron. Soc. 457, 3448–3456 (2016).
- [10] Younes, G. et al. X-Ray and Radio Observations of the Magnetar SGR J1935+2154 during Its 2014, 2015, and 2016 Outbursts. Astrophys. J. 847, 85 (2017).
- [11] Lin, L. et al. Burst Properties of the Most Recurring Transient Magnetar SGR J1935+2154. Astrophys. J. 893, 156 (2020).
- [12] Lin, L. et al. Fermi/GBM View of the 2019 and 2020 Burst Active Episodes of SGR J1935+2154. Astrophys. J. Lett. 902, L43 (2020).
- [13] Kozlova, A. V. et al. The first observation of an intermediate flare from SGR 1935+2154. Mon. Not. R. Astron. Soc. 460, 2008–2014 (2016).
- [14] Palmer, D. M. & BAT Team. A Forest of Bursts from SGR 1935+2154. GRB Coordinates Network 27665, 1 (2020).
- [15] Younes, G. et al. The NICER View of the 2020 Burst Storm and Persistent Emission of SGR 1935+2154. Astrophys. J. Lett. 904, L21 (2020).
- [16] Mereghetti, S. et al. INTEGRAL Discovery of a Burst with Associated Radio Emission from the Magnetar SGR 1935+2154. Astrophys. J. Lett. 898, L29 (2020).
- [17] Ridnaia, A. et al. A peculiar hard X-ray counterpart of a Galactic fast radio burst. arXiv e-prints arXiv:2005.11178 (2020).
- [18] Kothes, R., Sun, X., Gaensler, B. & Reich, W. A Radio Continuum and Polarization Study of SNR G57.2+0.8 Associated with Magnetar SGR 1935+2154. Astrophys. J. 852, 54 (2018).
- [19] Katz, J. I. Coherent emission in fast radio bursts. Phys. Rev. D. 89, 103009 (2014).
- [20] Kumar, P., Lu, W. & Bhattacharya, M. Fast radio burst source properties and curvature radiation model. Mon. Not. R. Astron. Soc. 468, 2726–2739 (2017).
- [21] Yang, Y.-P. & Zhang, B. Bunching Coherent Curvature Radiation in Three-dimensional Magnetic Field Geometry: Application to Pulsars and Fast Radio Bursts. Astrophys. J. 868, 31 (2018).
- [22] Lyubarsky, Y. A model for fast extragalactic radio bursts. Mon. Not. R. Astron. Soc. 442, L9–L13 (2014).
- [23] Plotnikov, I. & Sironi, L. The synchrotron maser emission from relativistic shocks in Fast Radio Bursts: 1D PIC simulations of cold pair plasmas. Mon. Not. R. Astron. Soc. 485, 3816–3833 (2019).
- [24] Thompson, C. & Duncan, R. C. The soft gamma repeaters as very strongly magnetized neutron stars - I. Radiative mechanism for outbursts. Mon. Not. R. Astron. Soc. 275, 255–300 (1995).
- [25] Israel, G. L. et al. A Swift Gaze into the 2006 March 29 Burst Forest of SGR 1900+14. Astrophys. J. 685, 1114–1128 (2008).
- [26] Lin, L. et al. Broadband Spectral Investigations of SGR J1550-5418 Bursts. Astrophys. J. 756, 54 (2012).
- [27] Lin, L. et al. No pulsed radio emission during a bursting phase of a Galactic magnetar. Nature 587, 63–65 (2020).
- [28] Guidorzi, C. et al. A search for prompt -ray counterparts to fast radio bursts in the Insight-HXMT data. Astron. Astrophys. 637, A69 (2020).
- [29] Marcote, B. et al. A repeating fast radio burst source localized to a nearby spiral galaxy. Nature 577, 190–194 (2020).
- [30] Zhang, S. et al. The enhanced X-ray Timing and Polarimetry mission—eXTP. Science China Physics, Mechanics, and Astronomy 62, 29502 (2019).
- [31] Zhang, S. et al. The insight-HXMT mission and its recent progresses. In Space Telescopes and Instrumentation 2018: Ultraviolet to Gamma Ray, vol. 10699 of Society of Photo-Optical Instrumentation Engineers (SPIE) Conference Series, 106991U (2018).
- [32] Li, X. et al. In-flight calibration of the insight-hard x-ray modulation telescope. Journal of High Energy Astrophysics 27, 64 – 76 (2020).
- [33] Liu, C. et al. The High Energy X-ray telescope (HE) onboard the Insight-HXMT astronomy satellite. Science China Physics, Mechanics, and Astronomy 63, 249503 (2020).
- [34] Cao, X. et al. The Medium Energy X-ray telescope (ME) onboard the Insight-HXMT astronomy satellite. Science China Physics, Mechanics, and Astronomy 63, 249504 (2020).
- [35] Chen, Y. et al. The Low Energy X-ray telescope (LE) onboard the Insight-HXMT astronomy satellite. Science China Physics, Mechanics, and Astronomy 63, 249505 (2020).
- [36] Xiao, S. et al. Deadtime calculation method of the High Energy X-ray telescope (HE) onboard the Insight-HXMT satellite. Journal of High Energy Astrophysics 26, 58–64 (2020).
- [37] Nang, Y. et al. In-orbit calibration to the point-spread function of Insight-HXMT. Journal of High Energy Astrophysics 25, 39–47 (2020).
- [38] Sai, N. et al. Methodology and performance of the two-year galactic plane scanning survey of insight-hxmt. Journal of High Energy Astrophysics 26, 1 – 10 (2020).
- [39] Guan, J. et al. A modified direct demodulation method applied to insight-hxmt galactic plane scanning survey. Journal of High Energy Astrophysics 26, 11 – 20 (2020).
This work made use of the data from the Insight-HXMT mission, a project funded by China National Space Administration (CNSA) and the Chinese Academy of Sciences (CAS). The Insight-HXMT team gratefully acknowledges the support from the National Program on Key Research and Development Project (Grant No. 2016YFA0400800) from the Minister of Science and Technology of China (MOST) and the Strategic Priority Research Program of the Chinese Academy of Sciences (Grant No. XDB23040400). The authors thank supports from the National Natural Science Foundation of China under Grants U1838105, U1838111, U1838113, U1838202, 11473027, 11733009, U1838201, 1173309, U1838115, U1938109, Y829113, 11673023, U1838104, 11703002
C.-K.L., L.L. and S.-L.X. are co-first authors and listed in alphabetical order. T.-P.L., F.-J.L. and S.-N.Z. are co-corresponding authors and listed in alphabetical order. T.-P.L. was the initial proposer and PI of Insight-HXMT. S.-N.Z. is the current PI of Insight-HXMT since 2016, organized the observations, data analysis and presentation of the results, writing and editing of the paper. L.L. proposed the ToO observation, is a main writer of the paper and participated in discussions. S.-L.X. participated in organizing the observations, data analysis, discussion and paper writing. F.-J.L. is a leader in building Insight-HXMT and participated in organizing the data analysis, discussions and paper writing. C.-K.L. is the main contributor to the data analysis and participated in paper writing. B.Z. is responsible for theoretical interpretation, and participated in organizing the observations, discussions, and paper writing. M.-Y.G., Y.-L.T., X.-B.L., Y.N., S.X., Y.C., L.-M.S., Y.T., X.-F.Z., C.-Z.L., S.-M.J., J.-Y.L. and B.L. participated in the data analysis and discussion. All other authors contributed to developing, building and operating the Insight-HXMT payloads and science data center.
The authors declare no competing interests.
Correspondence and requests for materials should be addressed to (T.-P.L., F.-J.L. and S.-N.Z., email: litp@ihep.ac.cn, lufj@ihep.ac.cn, zhangsn@ihep.ac.cn).
| Trigger time (UTC) | Fluence | Duration | |
|---|---|---|---|
| s | s | ||
| 2020-04-28T08:03:34.35 | 0.11 | -23458.65 | |
| 2020-04-28T08:05:50.15 | 0.07 | -23322.85 | |
| 2020-04-28T09:08:44.30 | 0.06 | -19548.70 | |
| 2020-04-28T09:51:04.90 | 0.42 | -17008.10 | |
| 2020-04-28T11:12:58.55 | 0.06 | -12094.45 | |
| 2020-04-28T12:54:02.20 | 0.40 | -6030.80 | |
| 2020-04-28T14:20:52.50 | 0.60 | -820.50 | |
| 2020-04-28T14:20:57.90 | 0.06 | -815.10 | |
| 2020-04-28T14:34:24.00 | 0.53 | -9.00 | |
| 2020-04-28T17:15:26.25 | 0.08 | 9653.25 | |
| 2020-04-28T19:01:59.85 | 0.16 | 16046.85 |
| Telescope | Group ID | N1a | LR1b | N2c | LR2d |
|---|---|---|---|---|---|
| 0 | 5627 | 66.0% | 981 | 11.5% | |
| HE | 1 | 6210 | 70.8% | 1106 | 12.6% |
| 2 | 4793 | 61.7% | 909 | 11.7% | |
| 0 | 0 | 0 | 379 | 32.8% | |
| ME | 1 | 0 | 0 | 554 | 47.6% |
| 2 | 0 | 0 | 688 | 53.0% | |
| 0 | 276 | 29.6% | 0.26 | 0.03% | |
| LE | 1 | 377 | 35.2% | 0.27 | 0.03% |
| 2 | 418 | 37.6% | 0.27 | 0.03% |
a N1 is the number of events lost due to saturation.
b LR1 is the lost ratio of events due to saturation.
c N2 is the number of events lost due to deadtime. For LE, the deadtime is induced by the forced trigger events.
d LR2 is the lost ratio of events due to deadtime.

| Telescope | (ms) | (ms) | (ms) | (ms) | (ms) |
| HE | |||||
| ME | |||||
| LE | – | – | – |
| Model | ||||||||||||
|---|---|---|---|---|---|---|---|---|---|---|---|---|
| () | (keV) | (keV) | (keV) | |||||||||
| CPL | 1.00/242 | |||||||||||
| PL | 1.48/243 | |||||||||||
| BB+BB | 2.14/241 | |||||||||||
| BB+PL | 1.05/241 |
| Model | CPL | BB+BB | ||||
|---|---|---|---|---|---|---|
| Instrument | index | Epeak | ||||
| Integral/IBIS (main) | 1.8/13 | 1.6/12 | ||||
| LE & ME& HE (main) | 1.13/211 | 3.47/210 | ||||
| ME& HE (20keV, main) | 1.08/66 | 1.26/65 | ||||
| KW (on-burst) | 49.1/46 | 45.6/47 | ||||
| LE&ME&HE (on-burst) | 1.34/118 | 3.14/117 | ||||
| ME&HE (20keV, on-burst) | 0.91/22 |
The errors of KW are given at the 90% confidence level. PG-stat statistic is applied by KW instead of statistic.
| time interval | index | Ecut | Epeak | |
|---|---|---|---|---|
| (keV) | (keV) | |||
| -0.200 - 0.000 | 37.62 /25 | |||
| 0.000 - 0.150 | 111.63 /79 | |||
| 0.150 - 0.300 | 105.46 /88 | |||
| 0.300 - 0.412 | 89.17 /86 | |||
| 0.412 - 0.476 | 107.07 /86 | |||
| 0.476 - 0.600 | 75.79 /87 | |||
| 0.600 - 0.750 | 97.67 /89 | |||
| 0.750 - 1.000 | 43.07 /50 |