Chemical Analysis of the Ultra-Faint Dwarf Galaxy Grus II.
Signature of high-mass stellar nucleosynthesis 111This paper includes data gathered with the 6.5m Magellan Telescopes located at Las Campanas Observatory, Chile.
Abstract
We present a detailed abundance analysis of the three brightest member stars at the top of the giant branch of the ultra faint dwarf galaxy Grus II. All stars exhibit a higher than expected ratio compared to metal-poor stars in other ultra faint dwarf galaxies and in the Milky Way halo. Nucleosynthesis in high mass (M⊙) core-collapse supernovae has been shown to create this signature. The abundances of this small sample (3) stars suggests the chemical enrichment of Grus II could have occurred through substantial high-mass stellar evolution, and is consistent with the framework of a top-heavy initial mass function. However, with only three stars it can not be ruled out that the abundance pattern is the result of a stochastic chemical enrichment at early times in the galaxy. The most metal-rich of the three stars also possesses a small enhancement in rapid neutron-capture (-process) elements. The abundance pattern of the -process elements in this star matches the scaled -process pattern of the solar system and -process enhanced stars in other dwarf galaxies and in the Milky Way halo, hinting at a common origin for these elements across a range of environments. All current proposed astrophysical sites of -process element production are associated with high-mass stars, thus the possible top-heavy initial mass function of Grus II would increase the likelihood of any of these events occurring. The time delay between the and -process element enrichment of the galaxy favours a neutron star merger as the origin of the -process elements in Grus II.
1 Introduction
Recent exploration of the chemical abundances in ultra faint dwarf (UFD) galaxies have revealed abundance patterns of these objects similar to those which have been detected in the majority of metal-poor Milky Way (MW) halo stars (Frebel & Norris, 2015). However, some notable outliers have also been observed, for example Reticulum II (Ret II) and Tucana III (Tuc III) both show enhancement in rapid neutron-capture (-process) elements (Ji et al., 2016a; Roederer et al., 2016; Hansen et al., 2017; Marshall et al., 2019). This chemical signature is also seen in a very small fraction of MW halo stars (Barklem et al., 2005; Hansen et al., 2018). More rare abundance patterns have also been detected in the UFD galaxies Horologium I (Hor I) and Hercules (Her), with Hor I exhibiting a deficiency in elements like Mg and Ca (Nagasawa et al., 2018), and some stars in Her showing very high ratios compared to the average metal-poor MW halo and UFD galaxy stars (Koch et al., 2008).
The UFD galaxies are small dark matter dominated systems which have slower chemical enrichment compared to the larger dwarf spheroidal galaxies and the MW (Simon, 2019). Hence the chemical abundances of the stars in these systems provide a window to study single nucleosynthesis events in closed environments. The peculiar chemical patterns described above are particularly important to study rare chemical enrichment events, such as neutron star mergers (NSMs) or special types of core-collapse supernovae (CCSNe) such as magnetorotational supernovae (Winteler et al., 2012), collapsars (Siegel et al., 2019), and supernovae with mixing and fallback (Umeda & Nomoto, 2003).
The chemistry of the first generation of low mass stars to form in a galaxy is tightly linked to the mass range of the first population of massive stars (Pop III) that formed and terminally evolved in them. Placco et al. (2016) used the abundance pattern of the most metal-poor MW halo stars along with nucleosynthesis models from Heger & Woosley (2010) to constrain the mass range of the Pop III stars responsible for the initial chemical enrichment of the Galaxy. Similar analysis in UFD galaxies are hampered by the small number of stars for which detailed chemical abundances can be determined in these systems.
On the other hand, UFD galaxies have been used to study the effect of environment on the initial stellar mass function (IMF). The long relaxation times of this type of galaxy means that the low mass stellar IMF can be measured directly from the number of stars below the main-sequence turn-off present in the galaxy today (Geha et al., 2013). The low luminosity of these systems, however, makes it difficult to obtain the photometric observations needed for this measurement. For those UFD galaxies where the measurements have been made (Boo I, CVn II, ComBer, Her, Leo IV, UMa I), evidence of variations of the IMF with environment have been found. For example Gennaro et al. (2018) measured the IMF for a sample of six UFDs and found that their sub-solar stellar IMFs were generally more bottom-light than the IMF for MW disk stars, though with a large scatter within the sample. In another study Geha et al. (2013) measured the IMF for Hercules and Leo IV and also found bottom light IMFs for these galaxies. For other types of galaxies, some correlations have been detected between IMFs and galaxy properties, with the largest galaxies having bottom-heavy IMFs and smaller galaxies having more bottom-light IMFs (Geha et al., 2013). This variation is also supported by the results from Kalirai et al. (2013), who measured the IMF of the Small Magellanic Cloud and found a shallower slope than what is determined in the MW.
It is important to note that even though the low mass stellar populations of today’s UFD galaxies provides a direct way to measure the IMF of these systems, this does not provide any information on the IMF of the higher stellar mass population previously present in the galaxy. However, here the chemistry of the metal-poor stars may provide some clues. The chemical abundances of the most metal-poor stars in the UFD galaxies constitute a record of the nucleosynthesis happening in the first generation of massive stars formed in these systems. Hence, the chemical abundance pattern can provide constraints on the mass range of the first stars to form in the UFD galaxy.
In this paper we analyse the UFD galaxy Grus II (Gru II). Gru II was identified as a candidate MW satellite galaxy in the Dark Energy Survey (DES) at a distance of 53 kpc (Drlica-Wagner et al., 2015). Spectroscopic follow-up of the system was presented by Simon et al. (2020), who was unable to resolve a velocity dispersion or detect a metallicity spread, indicative of dwarf galaxies, for the system. However, based on the large physical size ( pc) and low metallicity (), Simon et al. (2020) classify the system as a likely dwarf galaxy. We present here a detailed chemical abundance analysis of the three brightest member stars at the top of the giant branch of Gru II. The paper is organized as follows: Observations and analysis of the stars are described in Sections 2 and 3, Section 4 presents our results which are discussed in Section 5, and Section 6 provides a summary.
| Object Name | R.A. | Dec. | Date | Member | ||||||||
|---|---|---|---|---|---|---|---|---|---|---|---|---|
| (J2000) | (J2000) | (mag) | (mag) | (mag) | (mag) | (MJD) | (sec) | @4100Å | @5500Å | km s-1 | ||
| DES J220423.91-463702.5 | 22:04:23.90 | 46:37:02.48 | 17.524 | 16.741 | 16.456 | 16.289 | 57605 | 7x1800 | 12 | 32 | 106.90.6 | Yes |
| DES J220409.98-462102.2 | 22:04:09.98 | 46:21:02.21 | 18.157 | 17.477 | 17.227 | 17.086 | 57607 | 3x3000 | 9 | 17 | 106.60.6 | Yes |
| DES J220352.01-462446.5 | 22:03:51.90 | 46:24:46.40 | 19.396 | 18.860 | 18.678 | 18.568 | 57983 | 2x1800 | 9∗ | 12∗ | 106.51.1 | Yes |
| 58430 | 3x1800+824 | 9∗ | 12∗ | 106.40.7 | ||||||||
| DES J220318.62-464116.4 | 22:03:18.62 | 46:41:16.44 | 18.726 | 58433 | 600+1800 | 5 | 7 | 76.3 0.7 | No | |||
| DES J220253.88-463522.6 | 22:02:53.88 | 46:35:22.56 | 18.703 | 58341 | 1800 | 3 | 5 | 40.00.9 | No |
Note. — ∗ Signal-to-noise ratio (SNR) of the combined spectrum per pixel.
2 Observations
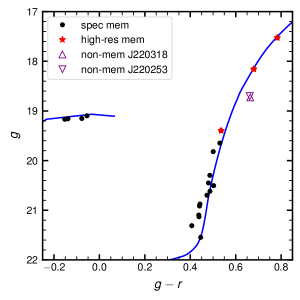
A total sample of five stars were observed with the MIKE spectrograph (Bernstein et al., 2003) at the Magellan-Clay Telescope at Las Campanas Observatory. Table 1 lists the targets, observing dates, and exposure times. The two brightest stars DES J220423.91-463702.5 and DES J220409.98-462102.2 (hereafter referred to as J220423 and J220409) were observed during a run in August 2016. The first spectrum of DES J220352.01-462446.5 (J220352) was observed in August 2017 and the second in November 2018 along with spectra of DES J220318.62-464116.4 (J220318) and DES J220253.88-463522.6 (J220253). Three of the stars (J220423, J220409, and J220352) were selected as spectroscopically confirmed members from medium-resolution velocity and metallicity measurements (Simon et al., 2020). The brightest star, J220423, was first identified as a member from an observing run with the Anglo-Australia Telescope (AAT) in July 2016. While the AAT observing run was mostly for targeting the Tucana III stream (see details in Li et al., 2018), a small fraction of time was also spent on bright candidate members in Gru II and Tucana IV during nights with cirrus cloud coverage, to identify bright member stars for MIKE observations. The membership of J220423 was subsequently confirmed with Magellan/IMACS spectroscopy (Simon et al., 2020). The remaining two stars, J220318 and J220253, were selected as member candidates from Pace & Li (2019), although with relatively low membership probabilities ( and , respectively). Radial velocities derived from short MIKE exposures establish these as non-members (see Table 1). Figure 1 shows a color-magnitude diagram of Gru II member stars; star symbols mark the five stars observed, filled symbols are members while open symbols are not members.


The spectra of the stars were obtained using a 0.7 arcsec slit with 2x2 pixel binning resulting in a spectral resolution of R= 41,000 in the blue and 32,000 in the red. The spectra cover 3310Å5000Å in the blue channel and 4830Å9160Å in the red. The data were reduced using the latest version of the CarPy MIKE pipeline (Kelson et al., 2000; Kelson, 2003). For stars with multiple spectra taken on the same run (J220409, J220423, and J220318) these were co-added (summed) during reduction while the spectra from multiple runs (J220352) were co-added after reduction. Following reduction the spectra were normalized and shifted to rest wavelength. Final reduced and normalized spectra around the Mg I b lines, the Ba II 6141Å line, and the Eu II 4129Å line are shown in Figure 2. Signal to noise ratios (SNR) per pixel of the final reduced spectra at 4100Å and 5500Å are listed in Table 1. Heliocentric radial velocities of the stars were determined by cross-correlation (Tonry & Davis, 1979) of the target spectra with a spectrum of the radial-velocity standard star HD122563 ( km s-1; Chubak et al. (2012)) obtained with the same instrument setup as the target stars. Depending on the SNR of the target spectra, 30 to 50 individual orders were used for the cross-correlation. The mean value of the resulting velocities along with the standard deviation are listed in Table 1. Our values are different from the velocities determined for the stars by Simon et al. (2020), who find km s-1, km s-1, and km s-1 for J220423, J220409, and J220352, respectively. However, J220423 and J220409 were both observed at high airmass, 1.8 and 1.6 respectively, which can cause offsets in the radial velocities (Ji et al., 2020), and J220352 is likely in a binary system (Simon et al., 2020).
| ID | log | ||||
|---|---|---|---|---|---|
| (K) | (K) | (cgs) | (km s-1) | (dex) | |
| DES J220423 | 4556 | ||||
| DES J220409 | 4740 | ||||
| DES J220352 | 5121 |
Note. — ∗ Used to determine log , , , and for abundance analysis.
3 Stellar Parameter Determination and Abundance Analysis
Stellar parameter determination and abundance analysis was done following the techniques described in Hansen et al. (2017) and Marshall et al. (2019), using the 2017 version of MOOG (Sneden, 1973) and making the assumption of local thermodynamic equilibrium (LTE) and including Rayleigh scattering treatment as described by Sobeck et al. (2011)222https://github.com/alexji/moog17scat. The stellar parameters for the three stars were determined spectroscopically from equivalent width (EW) measurements of Fe I and Fe II lines. We measure the EW by fitting Gaussian profiles to the absorption lines in the continuum-normalized spectra. Uncertainties on the EWs were computed using from Cayrel (1988), where SNR is the signal to noise per pixel and is the pixel size. First estimates of effective temperatures were determined from excitation equilibrium of Fe I lines. These were then placed on a photometric scale using the relation from Frebel et al. (2013). Using the corrected temperatures, surface gravities () were determined from ionization equilibrium between the Fe I and Fe II lines. Finally microturbulent velocities () were determined by removing any trend in line abundances with reduced EW for the Fe I lines. Final stellar parameters along with estimated uncertainties are presented in Table 2 and lines used for the parameter determination of each star are listed in Table 3. All three stars are giants. For comparison Table 2 also lists the photometric temperatures for our stars which are in good agreement with the corrected spectroscopic temperatures. The photometric temperatures were derived by converting the and colors listed in Table 1 from DES DR1(Abbott et al., 2018) to the corresponding and colors (Drlica-Wagner et al., 2018, R. Lupton 2005333http://www.sdss3.org/dr8/algorithms/sdssUBVRITransform.php), and using the , , , and color temperature relations from Casagrande et al. (2010). Listed in Table 2 is the average photometric temperature and the standard deviation. Our derived metallicities are in good agreement with the metallicities derived from the Calcium Triplet lines by Simon et al. (2020), who find , , and for J220423, J220409, and J220352, respectively.
Abundances were derived from EW measurements and spectral synthesis. EWs are used for strong non-blended lines while spectral synthesis is used for weaker and or blended lines and for lines affected by isotopic and or hyperfine splitting. Measured EWs used for abundance determination are given in Table 4. All abundances were derived using -enhanced () 1D LTE ATLAS9 model atmospheres (Castelli & Kurucz, 2003) and the solar photosphere abundances from Asplund et al. (2009). As can be seen in Table 5, our stars are not enhanced in all elements, hence using non--enhanced atmosphere models might be a better fit for our stars. However, Nagasawa et al. (2018) showed that for low SNR spectra the difference in abundances was not more than 0.05 dex between using non--enhanced and -enhanced atmosphere models to derive abundances for their low stars of similar metallicity, which was much smaller than their total adopted uncertainty. We expect that the systematic differences in abundances caused by using -enhanced models in the work presented here to be similarly negligible compared to our abundance uncertainties. Hence, for more direct comparison with literature results we have used -enhanced atmosphere models. Line lists were generated using the linemake package444https://github.com/vmplacco/linemake (C. Sneden, private comm.), including molecular lines for CH, C2, and CN and isotopic shift and hyperfine structure information. Representative errors arising from stellar parameter uncertainties computed for J220423 are listed in Table 6. These were determined by deriving abundances for the star using different atmospheric models, each with one parameter varied by its uncertainty as given in Table 2. The uncertainties were then added in quadrature including covariance terms following McWilliam et al. (2013) and Johnson (2002) to provide the systematic uncertainty, , on . The covariances were computed using the following equation
| (1) |
To determine , , and , 20 model atmospheres with effective temperatures drawn from a Gaussian distribution with a mean of 4585 K and standard deviation of 150 K were computed. and was then varied in turn until we obtained ionization equilibrium between the Fe I and Fe II lines for , and no trend in line abundances with reduced EW of Fe I lines for , while the direct change in was used for . In the case of , 20 model atmospheres with microturbulences drawn from a Gaussian distribution with a mean of 2.25 km s-1 and of 0.3 km s-1 were computed and the gravity was then again varied to obtain ionization equilibrium between the Fe I and Fe II lines. The final covariances resulting from this process are =49, =13, =20, and =-0.02.
| Stellar ID | Species | EW | |||||
|---|---|---|---|---|---|---|---|
| (Å) | (eV) | (mÅ) | (mÅ) | ||||
| J220409 | Fe I | 3876.04 | 1.010 | 2.89 | 80.1 | 13.4 | 5.01 |
| J220409 | Fe I | 4001.66 | 2.174 | 1.90 | 51.4 | 13.3 | 4.91 |
| J220409 | Fe I | 4009.71 | 2.221 | 1.25 | 64.6 | 12.1 | 4.52 |
| J220409 | Fe I | 4084.49 | 3.329 | 0.54 | 55.7 | 12.8 | 4.97 |
| J220409 | Fe I | 4132.90 | 2.840 | 0.92 | 41.6 | 10.7 | 4.54 |
| J220409 | Fe I | 4147.67 | 1.484 | 2.07 | 84.6 | 13.7 | 4.78 |
| J220409 | Fe I | 4152.17 | 0.957 | 3.16 | 53.2 | 10.8 | 4.72 |
| J220409 | Fe I | 4153.90 | 3.397 | 0.28 | 37.6 | 9.2 | 4.48 |
| J220409 | Fe I | 4156.80 | 2.830 | 0.81 | 46.2 | 11.5 | 4.49 |
| ⋮ | ⋮ | ⋮ | ⋮ | ⋮ | ⋮ | ⋮ | |
| J220409 | Fe II | 4508.29 | 2.860 | 2.25 | 48.2 | 13.9 | 4.67 |
| J220409 | Fe II | 4515.34 | 2.840 | 2.36 | 52.3 | 14.7 | 4.81 |
| J220409 | Fe II | 4520.22 | 2.810 | 2.60 | 41.6 | 13.9 | 4.85 |
| J220409 | Fe II | 4522.63 | 2.840 | 1.99 | 93.7 | 18.6 | 5.12 |
| J220409 | Fe II | 4541.52 | 2.860 | 2.79 | 38.1 | 15.4 | 5.04 |
Note. — The complete version of Table 3 is available online only. A short version is shown here to illustrate its form and content.
| Stellar ID | Species | EW | |||||
|---|---|---|---|---|---|---|---|
| (Å) | (eV) | (mÅ) | (mÅ) | ||||
| J220409 | Mg I | 3986.75 | 4.343 | 1.44 | 21.7 | 9.7 | 5.38 |
| J220409 | Mg I | 4057.51 | 4.343 | 1.20 | 40.1 | 10.4 | 5.49 |
| J220409 | Mg I | 4167.27 | 4.343 | 1.00 | 50.2 | 12.7 | 5.44 |
| J220409 | Mg I | 4571.10 | 0.000 | 5.69 | 87.1 | 16.8 | 5.46 |
| J220409 | Mg I | 4702.99 | 4.343 | 0.67 | 75.4 | 15.0 | 5.41 |
| J220409 | Ca I | 4283.01 | 1.884 | 0.22 | 52.5 | 12.2 | 3.68 |
| J220409 | Ca I | 4318.65 | 1.897 | 0.21 | 62.0 | 13.3 | 3.83 |
| J220409 | Ca I | 4425.44 | 1.878 | 0.39 | 28.6 | 11.3 | 3.43 |
| J220409 | Ca I | 4455.89 | 1.897 | 0.51 | 27.2 | 10.9 | 3.54 |
| J220409 | Ca I | 5594.46 | 2.521 | 0.05 | 38.8 | 13.3 | 3.97 |
Note. — The complete version of Table 4 is available online only. A short version is shown here to illustrate its form and content.
4 Results
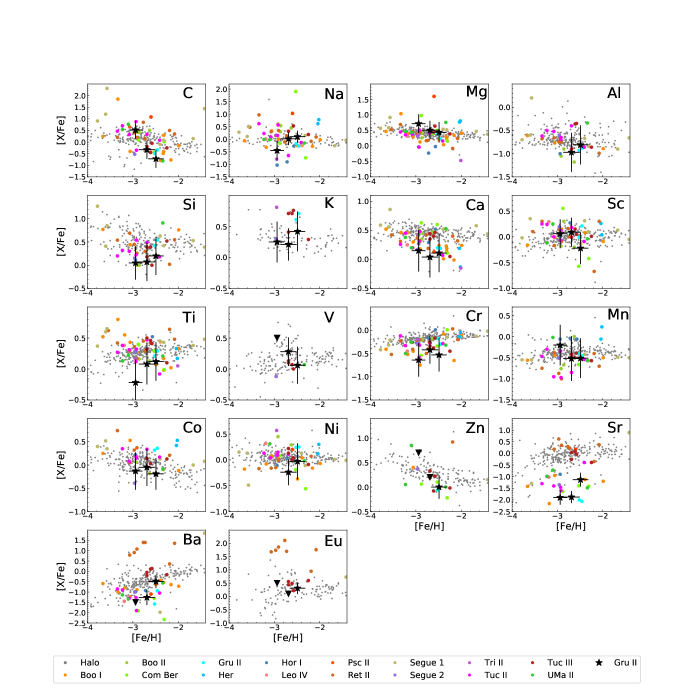
Abundances or upper limits have been derived for 31 elements from C to Er in the three spectroscopically confirmed members of Gru II. All abundances and upper limits are presented in Table 5 listing the (X), , and abundances along with the number of lines used to derive the abundance, standard deviation () and the total uncertainty on and calculated including covariance terms as described above. For elements were the abundances are derived from only one or two lines we use an estimated when calculating the total uncertainty. In Figure 3 we compare these abundances to results from high-resolution studies of other UFD galaxies and metal-poor MW halo stars (Roederer & Kirby, 2014). Only abundance detections have been included in the comparison sample. The UFD galaxies are: Boötes I (Feltzing et al., 2009; Frebel et al., 2016; Gilmore et al., 2013; Ishigaki et al., 2014; Norris et al., 2010), Boötes II (Ji et al., 2016b), Coma Berenices (Frebel et al., 2010), Grus I (Ji et al., 2019a), Hercules (Koch et al., 2008), Horologium I (Nagasawa et al., 2018), Leo IV (Simon et al., 2010), Pisces II (Spite et al., 2018), Reticulum II (Ji et al., 2016c), Segue 1 (Frebel et al., 2014; Norris et al., 2010), Segue 2 (Roederer et al., 2014), Triangulum II (Ji et al., 2019a), Tucana II (Ji et al., 2016d; Chiti et al., 2018), Tucana III (Hansen et al., 2017; Marshall et al., 2019), and Ursa Major II (Frebel et al., 2010).
4.1 Carbon and Odd Z Elements
Carbon abundances were determined from synthesis of the CH -band at 4313 Å assuming a standard oxygen enhancement for metal-poor stars of as a direct oxygen measurement could not be made. Na abundances were derived from the 5889Å and 5895Å lines via synthesis in J220409 and J220423, and EW analysis in J220352. Abundances for Al could only be determined for J220409 and J220423 and were determined via synthesis of the 3944Å and 3961Å lines. The 7664Å and 7698Å lines were used to derive the K abundances using EWs in J220423 and synthesis in J220409 and J220352. Finally a mixture of the Sc lines at 4226Å, 4320Å, 4400Å, 4415Å, 4670Å, 5526Å, and 5658Å was synthesized to derive Sc abundances in the stars. As can be seen in Figure 3 some spread is detected in the C abundances for the three stars, however, effects of stellar evolution are known to alter the surface C abundance of low mass stars. Following Placco et al. (2014) we find carbon corrections of C = for J220423, for J220409, and for J220352, reducing the spread in the birth carbon abundance of the stars. Taking these corrections into account, none of the stars qualify as Carbon Enhanced Metal-Poor (CEMP) stars (; Aoki et al. (2007)). In Figure 3 we plot the original C abundances for easy reference to the literature values. It should be noted that many of the stars in the Figure are giants thus their original C abundance may be somewhat different from the measured C abundances plotted. For Na, Al, and Sc we find abundances of the three Gru II stars that are similar to other UFD and metal-poor halo stars (see Figure 3). K abundances have only been derived for stars in a few UFD galaxies but the majority of these seem to cluster around while the stars in Gru II exhibit lower K abundances around , closer to the abundances found in the halo comparison sample (Roederer & Kirby, 2014).
| J220409 | J220423 | J220351 | |||||||||||||||||||
|---|---|---|---|---|---|---|---|---|---|---|---|---|---|---|---|---|---|---|---|---|---|
| Element | (X) | N | (X) | N | (X) | N | |||||||||||||||
| (dex) | (dex) | (dex) | (dex) | (dex) | (dex) | (dex) | (dex) | (dex) | (dex) | (dex) | (dex) | (dex) | (dex) | (dex) | (dex) | (dex) | (dex) | ||||
| C | 5.41 | 0.20 | 3.02 | 0.47 | 0.33 | 0.31 | 5.22 | 0.20 | 3.21 | 0.47 | 0.72 | 0.32 | 6.01 | 0.20 | 2.44 | 0.47 | 0.52 | 0.30 | |||
| N | 7.83 | 0.69 | 2.00 | 7.34 | 0.49 | 2.00 | 6.89 | 0.94 | 2.00 | ||||||||||||
| NaI | 3.57 | 2 | 0.20 | 2.67 | 0.30 | 0.02 | 0.27 | 3.85 | 2 | 0.20 | 2.39 | 0.30 | 0.10 | 0.28 | 2.85 | 2 | 0.32 | 3.39 | 0.39 | 0.45 | 0.36 |
| MgI | 5.44 | 5 | 0.17 | 2.18 | 0.27 | 0.51 | 0.25 | 5.55 | 5 | 0.21 | 2.05 | 0.30 | 0.44 | 0.29 | 5.38 | 2 | 0.20 | 2.22 | 0.29 | 0.72 | 0.26 |
| AlI | 2.79 | 2 | 0.20 | 3.66 | 0.50 | 0.97 | 0.32 | 3.15 | 2 | 0.20 | 3.30 | 0.46 | 0.81 | 0.26 | |||||||
| SiI | 4.89 | 1 | 0.20 | 2.62 | 0.43 | 0.07 | 0.28 | 5.22 | 1 | 0.20 | 2.29 | 0.43 | 0.20 | 0.38 | 4.62 | 2 | 0.20 | 2.89 | 0.43 | 0.05 | 0.26 |
| KI | 2.55 | 2 | 0.20 | 2.48 | 0.30 | 0.21 | 0.27 | 2.96 | 2 | 0.20 | 2.07 | 0.30 | 0.42 | 0.28 | 2.34 | 1 | 0.20 | 2.69 | 0.30 | 0.25 | 0.26 |
| CaI | 3.69 | 13 | 0.26 | 2.65 | 0.32 | 0.04 | 0.33 | 3.96 | 13 | 0.24 | 2.38 | 0.30 | 0.11 | 0.32 | 3.55 | 5 | 0.27 | 2.79 | 0.33 | 0.15 | 0.33 |
| ScII | 0.55 | 6 | 0.09 | 2.60 | 0.24 | 0.09 | 0.23 | 0.44 | 5 | 0.16 | 2.71 | 0.27 | 0.22 | 0.28 | 0.27 | 2 | 0.20 | 2.88 | 0.30 | 0.06 | 0.28 |
| TiI | 2.33 | 4 | 0.23 | 2.62 | 0.38 | 0.07 | 0.29 | 2.48 | 8 | 0.20 | 2.47 | 0.36 | 0.02 | 0.27 | |||||||
| TiII | 2.34 | 11 | 0.25 | 2.61 | 0.29 | 0.08 | 0.33 | 2.58 | 19 | 0.22 | 2.37 | 0.26 | 0.12 | 0.32 | 1.79 | 7 | 0.29 | 3.16 | 0.32 | 0.22 | 0.36 |
| VII | 1.52 | 2 | 0.20 | 2.41 | 0.26 | 0.28 | 0.30 | 1.50 | 1 | 0.20 | 2.43 | 0.26 | 0.06 | 0.31 | 1.73 | 2.44 | 0.50 | ||||
| CrI | 2.53 | 4 | 0.10 | 3.11 | 0.27 | 0.42 | 0.21 | 2.62 | 7 | 0.22 | 3.02 | 0.34 | 0.53 | 0.29 | 2.06 | 2 | 0.23 | 3.58 | 0.34 | 0.64 | 0.28 |
| MnI | 2.22 | 3 | 0.30 | 3.21 | 0.56 | 0.52 | 0.39 | 2.43 | 7 | 0.17 | 3.00 | 0.50 | 0.51 | 0.31 | 2.29 | 1 | 0.20 | 3.14 | 0.52 | 0.20 | 0.31 |
| FeI | 4.82 | 94 | 0.17 | 2.69 | 0.34 | 5.01 | 116 | 0.18 | 2.49 | 0.34 | 4.57 | 32 | 0.15 | 2.94 | 0.33 | ||||||
| FeII | 4.81 | 10 | 0.21 | 2.76 | 0.25 | 5.01 | 14 | 0.16 | 2.49 | 0.20 | 4.56 | 10 | 0.25 | 2.95 | 0.28 | ||||||
| CoI | 2.25 | 1 | 0.20 | 2.74 | 0.39 | 0.05 | 0.27 | 2.31 | 2 | 0.20 | 2.68 | 0.39 | 0.19 | 0.28 | 1.92 | 1 | 0.20 | 3.07 | 0.39 | 0.13 | 0.26 |
| NiI | 3.29 | 2 | 0.20 | 2.93 | 0.21 | 0.24 | 0.29 | 3.70 | 7 | 0.26 | 2.52 | 0.32 | 0.03 | 0.34 | |||||||
| CuI | 1.40 | 2.79 | 0.10 | 1.40 | 2.79 | 0.30 | 2.05 | 2.14 | 0.80 | ||||||||||||
| ZnI | 2.07 | 2.49 | 0.20 | 2.07 | 2 | 0.20 | 2.49 | 0.29 | 0.00 | 0.30 | 2.32 | 2.24 | 0.70 | ||||||||
| SrII | 1.70 | 2 | 0.20 | 4.57 | 0.29 | 1.88 | 0.31 | 0.75 | 2 | 0.20 | 3.62 | 0.29 | 1.13 | 0.32 | 1.97 | 1 | 0.20 | 4.84 | 0.29 | 1.90 | 0.31 |
| YII | 0.78 | 2.99 | 0.30 | 1.18 | 1 | 0.20 | 3.39 | 0.23 | 0.90 | 0.33 | 0.73 | 2.94 | 0.00 | ||||||||
| ZrII | 0.61 | 3.19 | 0.50 | 0.41 | 1 | 0.20 | 2.99 | 0.30 | 0.50 | 0.29 | 0.36 | 2.94 | 0.00 | ||||||||
| BaII | 1.77 | 3 | 0.19 | 3.95 | 0.38 | 1.26 | 0.26 | 0.80 | 3 | 0.06 | 2.98 | 0.33 | 0.49 | 0.19 | 2.26 | 4.44 | 1.50 | ||||
| LaII | 1.59 | 2.69 | 0.00 | 1.21 | 2 | 0.20 | 2.31 | 0.53 | 0.18 | 0.33 | 1.04 | 2.14 | 0.80 | ||||||||
| CeII | 0.91 | 2.49 | 0.20 | 0.61 | 2.19 | 0.30 | 0.56 | 2.14 | 0.80 | ||||||||||||
| PrII | 1.17 | 1.89 | 0.80 | 1.48 | 3 | 0.03 | 2.20 | 0.26 | 0.29 | 0.20 | |||||||||||
| NdII | 0.57 | 1.99 | 0.70 | 0.99 | 4 | 0.07 | 2.41 | 0.24 | 0.08 | 0.23 | 0.58 | 2.04 | 0.90 | ||||||||
| SmII | 1.03 | 1.99 | 0.50 | 0.88 | 1.84 | 1.10 | |||||||||||||||
| EuII | 2.07 | 2.59 | 0.10 | 1.66 | 3 | 0.10 | 2.18 | 0.21 | 0.31 | 0.25 | 1.92 | 1.44 | 0.50 | ||||||||
| GdII | 0.92 | 1.99 | 0.70 | 0.62 | 1.69 | 0.80 | |||||||||||||||
| DyII | 0.59 | 1.69 | 1.00 | 0.69 | 1.79 | 0.70 | |||||||||||||||
| ErII | 1.27 | 1.19 | 0.50 | 1.07 | 1.99 | 0.50 | |||||||||||||||
| Element | Teff | ||||
|---|---|---|---|---|---|
| (dex) | (dex) | (dex) | (dex) | (dex) | |
| CH | 0.27 | 0.12 | 0.04 | 0.04 | 0.43 |
| Na I | 0.15 | 0.03 | 0.10 | 0.00 | 0.22 |
| Mg I | 0.14 | 0.04 | 0.07 | 0.01 | 0.21 |
| Al I | 0.22 | 0.13 | 0.07 | 0.14 | 0.45 |
| Si I | 0.25 | 0.05 | 0.15 | 0.02 | 0.38 |
| K I | 0.17 | 0.02 | 0.06 | 0.01 | 0.22 |
| Ca I | 0.13 | 0.03 | 0.05 | 0.01 | 0.18 |
| Sc I | 0.08 | 0.04 | 0.17 | 0.00 | 0.22 |
| Ti I | 0.25 | 0.03 | 0.05 | 0.01 | 0.30 |
| Ti II | 0.04 | 0.09 | 0.06 | 0.01 | 0.14 |
| V II | 0.05 | 0.10 | 0.02 | 0.02 | 0.16 |
| Cr I | 0.22 | 0.02 | 0.02 | 0.01 | 0.25 |
| Mn I | 0.30 | 0.05 | 0.10 | 0.12 | 0.47 |
| Fe I | 0.21 | 0.03 | 0.10 | 0.02 | 0.29 |
| Fe II | 0.02 | 0.10 | 0.05 | 0.01 | 0.13 |
| Co I | 0.25 | 0.03 | 0.07 | 0.04 | 0.33 |
| Ni I | 0.16 | 0.01 | 0.02 | 0.01 | 0.18 |
| Zn I | 0.10 | 0.10 | 0.00 | 0.00 | 0.21 |
| Sr II | 0.02 | 0.02 | 0.20 | 0.05 | 0.21 |
| Y II | 0.07 | 0.03 | 0.03 | 0.00 | 0.11 |
| Zr II | 0.09 | 0.13 | 0.04 | 0.00 | 0.23 |
| Ba II | 0.13 | 0.16 | 0.08 | 0.05 | 0.33 |
| La II | 0.20 | 0.22 | 0.11 | 0.10 | 0.49 |
| Pr II | 0.16 | 0.07 | 0.03 | 0.04 | 0.26 |
| Nd II | 0.12 | 0.08 | 0.00 | 0.04 | 0.22 |
| Eu II | 0.09 | 0.08 | 0.01 | 0.02 | 0.18 |
4.2 and Iron-Peak Elements
EW analysis was used to derived Mg and Ti abundances in all three stars. Ca abundances were also derived from EW analysis in J220409 and J220423 while spectral synthesis of the Ca lines at 4426Å, 4434Å, 4454Å, 6122Å, and 6162Å was used to determine the Ca abundance in J220352. Cr and Ni abundances were determined using EW analysis in J220423, while synthesis of the Cr lines at 4252Å, 4274Å, 4289Å, 4646Å, and 5206Å and Ni lines at 3807Å, 5476Å, and 6644Å was used in J220409 and J220352. For the remaining elements in this group, Si, V, Mn, Co, Cu, and Zn, abundances or upper limits were determined via spectral synthesis in all three stars using the following lines: Si, 3905Å and 4102Å; V, 3952Å and 4005Å; Mn, 4030Å, 4033Å, 4034Å, 4041Å, 4754Å, 4823Å, and 4762Å; Co, 4118Å and 4121Å; Cu, 5105Å; and Zn, 4722Å and 4810Å. All three stars are enhanced in Mg, similar to other metal-poor stars in the halo and UFDs. However the derived abundances for Si, Ca, and Ti, which are also usually enhanced in metal-poor stars, are low in all three Gru II stars compared to the halo and UFD galaxy sample. Mg, Si, Ca, and Ti are primarily created in massive (M M⊙) stars, with Si, Ca, and Ti being synthesized during the explosive nucleosynthesis in the CCSN phase and Mg being created during the hydrostatic burning phases of the stars (Woosley & Weaver, 1995). A high ratio of hydrostatic to explosive -elements as observed in these stars can be produced in high mass, M⊙ CCSN (Heger & Woosley, 2010). The three Gru II stars also exhibit low Cr abundances, a feature in common with stars in other UFD galaxies and also found for the most metal-poor MW halo stars (McWilliam et al., 1995). The abundances derived for V, Mn, Co, Ni, and Zn in the Gru II stars follow the abundance trends observed in other UFDs and metal-poor halo stars (see Figure 3).
4.3 Neutron-Capture Elements
Abundances for all neutron-capture elements were derived from spectral synthesis. It was only possible to derive abundances for Sr in all three stars using the 4077Å and 4215Å lines. Ba abundances for J220904 and J220423 and the upper limit in J220352 were derived from the 5853Å, 6141Å, and 6496Å lines. The most metal-rich of the three stars J220423 exhibits a small enhancement in some of the heavy neutron-capture elements (), enabling the derivation of abundances for Y (4398Å), Zr (4149Å), La (3995Å and 4086Å), Pr (4179Å, 4222Å, and 4408Å), Nd (4109Å, 4177Å, 4462Å, and 4825Å), and Eu (3907Å, 4129Å, and 4205Å) for this star. Eu upper limits derived from the 4129Å line are given for J220904 and J220352 also. The Sr and Ba abundances derived for J220423 are sub-solar but higher than what is found in the other two stars analysed, suggesting that an additional source of neutron-capture elements has enriched this star. J220423 has , compatible with an -process origin of the neutron-capture element excess (Sneden et al., 2008). The two non-enhanced stars J220409 and J220352 both exhibit extremely low Sr (and Ba) abundances similar to neutron-capture element abundances detected in other UFDs (Ji et al., 2019a), supporting the dwarf galaxy classification of Gru II (see Figure 3).
5 Discussion
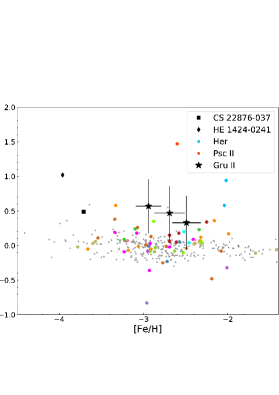
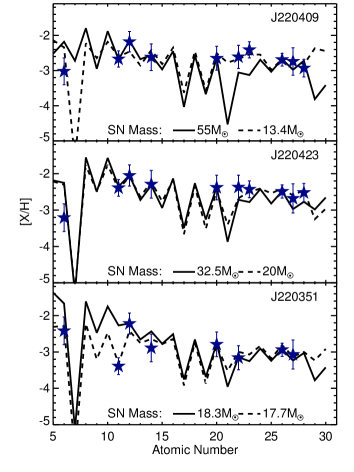
For the majority of the elements, the abundances derived for Gru II follow the trends detected in other UFD galaxies and in the MW halo, with a few notable outliers. In Figure 4 we plot the ratio as a function of metallicity for the three Gru II stars along with the UFD galaxies and halo stars from Figure 3. The three stars in Gru II clearly stand out, displaying somewhat higher ratios than the majority of the comparison sample stars. This -element signature was first discovered in the MW halo star CS 22876-037 (black square in Figure 4) for which Norris et al. (2000) reported abundances of and . A more extreme version of this abundance signature was later observed in another MW halo star, namely HE 1424-0241 (black diamond in Figure 4), where Cohen et al. (2007) reported abundances of and 555No uncertainty was reported on the Ca abundance as it was determined from just one absorption feature.. Both stars display a high dominance of hydrostatic versus explosive -elements. From the CCSNe models of Woosley & Weaver (1995), Norris et al. (2000) conclude that CS 22876-037 was likely enriched by a zero metallicity 30M⊙ CCSN. Using the online fitting code STARFIT 666http://starfit.org/ which performs a fit of SNe models to abundances data (see Heger & Woosley, 2010, and subsequent online update in 2012 for more details), we fit SN models to the C, Na, Mg, Ca, Ti, Fe, Co, and Ni abundances of the three Gru II stars. Carbon values corrected for stellar evolution were used for the fit. Abundances of Sc and Cr have been excluded as these elements are generally underproduced in these models (Heger & Woosley, 2010). The result is shown in Figure 5 were dashed lines represents the best fit using all elements and solid lines represents fits using only the Mg, Ca, and Fe abundances, demonstrating that higher mass models are preferred when only considering the Mg, Ca and Fe abundances detected in these stars. This agrees with the results from Norris et al. (2000) which suggest that stars with this chemical signature were likely enriched by a population of very high-mass stars. It is notable that in Figure 4, stars in two other systems also stand out, namely Her (blue points) and Psc II (orange-red point). The high in the star in Psc II is driven by a very high Mg abundance (see Figure 3). Furthermore, this star also exhibits a high C abundance and is classified as a CEMP-no star (Spite et al., 2018). The source of carbon in CEMP-no stars is still debated, but rotation and mixing in the progenitor stars is likely to play a significant role. This has also been shown to influence the production of other light elements such as Mg (Maeder et al., 2015). Hence it is not clear if ratios in CEMP-no and non-carbon enhanced stars, like the Gru II stars, should be discussed in the same context. In Her, an -element abundance signature similar to that detected in Gru II is seen in both stars analysed by Koch et al. (2008), who found and for the two stars. Hence, like the stars in Gru II, the stars in Her were also likely enriched by a population of high-mass stars. Koch et al. (2008) suggest that this is either the result of an IMF of Her skewed towards higher mass stars or stochastic chemical evolution in this galaxy. In the following, we discuss these two and alternative scenarios to explain the abundance signature of Gru II.
5.1 Top Heavy Initial Mass Function
Some correlations have been detected between IMFs and galaxy properties, with the largest galaxies having bottom-heavy IMFs and smaller galaxies having more bottom-light IMFs (Geha et al., 2013, although Gennaro et al. (2018) find a more complicated picture). As previously described, UFD are ideal laboratories for studying the low mass stellar IMF. Geha et al. (2013) determined the IMF for Her based on Hubble Space Telescope imaging and detected a slope of . This is a somewhat shallower slope than the Salpeter (; Salpeter, 1955) or Kroupa (; Kroupa, 2001) IMF detected for more massive systems. On the other hand, this result is in good agreement with the high abundance signature of the galaxy, and hence an overall chemical enrichment dominated by high mass stars. Again, it should be noted that the result of Geha et al. (2013) is based on the low mass (MM⊙) stellar population observable in Her today and does not necessarily directly translate to the IMF of higher mass stellar populations previously present in the galaxy. With only three stars analysed in Gru II it is difficult to conclude if the overall chemical enrichment of the galaxy is dominated by high-mass stars. However, the very consistent -element signature detected in these three stars, requiring nucleosynthesis in 20M⊙ stars to produce, is compatible with a top-heavy IMF for the Population III stars, leading to a different chemical signature in this galaxy than that seen in other UFD galaxies. It should be noted that Geha et al. (2013) also measured the IMF for Leo IV and found a slope of similar to Her. Chemical abundances from high resolution data have only been presented for one star in Leo IV (Simon et al., 2010). This star shows roughly equal, small Mg and Ca enhancements with , thus not similar to the -elements signature found in Her and Gru II.
5.2 Stochastic Chemical Enrichment
Another possible explanation for the chemically peculiar stars in Gru II is that the chemical enrichment and star formation in systems like Gru II are stochastic and inhomogeneous. It can be seen in Figure 4 that other UFD galaxy stars exhibit a similar -element signature as the three Gru II and two Her stars, including the -process enhanced galaxies Ret II and Tuc III (Ji et al., 2016c; Marshall et al., 2019). In these systems, however, the high stars are outliers and the majority of the stars exhibit enhancements in the elements similar to metal-poor halo stars. Since the study of Koch et al. (2008), François et al. (2016) have derived Mg and Ca abundances for an additional four stars in Her from medium resolution spectra (data not included in Figure 3 and 4). The stars in this sample are more metal-poor () and only one of the four stars show an -elements signature () similar to the Koch et al. (2008) stars. Including these stars, the chemical signature of Her more resembles that of the other UFD galaxies, suggesting that stochastic and inhomogeneous chemical enrichment of Her is more likely the explanation for the varying abundance patterns detected in Her. For the abundance signature to be the result of stochastic chemical enrichment of a given galaxy, only a few chemical enrichment events can have polluted the galaxy overall. The more enrichment events a system encounters, the more washed-out the signature of any individual event becomes. Koch et al. (2008) performed a stochastic sampling following McWilliam & Searle (1999) and found that the abundance ratios of their two Her stars could only reasonably be obtained in a system with fewer than 11 SNe. They note that this is somewhat at odds with the iron abundances of their stars of , which likely requires on the order of 100 SNe to obtain (Koch et al., 2008). The halo stars exhibiting the -element signature are found at very low metallicity (), making it more likely that the gas from which these formed was enriched by just one SN. The three Gru II stars have metallicities between , thus it is not unlikely that the gas from which these stars formed was enriched by a low number of supernovae. Further determination of -abundances in a larger sample of Gru II stars covering a larger range in metallicity would help to map out the chemical enrichment of this galaxy.
5.3 Other Alternatives
An alternative explanation for the low abundances detected in the Gru II stars could be an early onset of type Ia SNe. The general chemical evolution scenario predicts an enhancement in elements at low metallicity as a result of enrichment by CCSNe followed by a downturn or ‘knee’ in at the onset of type Ia SNe (Tinsley, 1979). An early enrichment by type Ia SNe was speculated to be the reason for the small -element abundances detected in Hor I (Nagasawa et al., 2018). However, the three stars analysed here show a ‘normal’ enhancement in Mg and only low Si, Ca, and Ti abundances. An injection of Fe into the systems would lower all the abundance ratios, thus we do not consider this a likely explanation for the -element abundance pattern detected in Gru II. Some UFD galaxies, including Hor I, have also been found to be likely satellites of the Large Magellanic Clouds (LMC) rather than MW satellites (Kallivayalil et al., 2018). It is not yet clear if a different birth environment like the LMC could result in the different chemical abundance patterns seen in some of the LMC associated UFD galaxies (Nagasawa et al., 2018). However, as a counter-argument, Simon et al. (2020) find it unlikely that Gru II is associated with the LMC.
5.4 Source of Neutron-Capture Elements
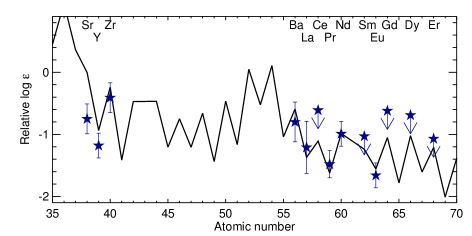
Gru II is the third UFD galaxy in which an enhancement in -process elements has been detected, with Ret II and Tuc III being the other two. The stars in Tuc III and Ret II exhibit a more uniform enhancement in -process elements, with all five stars analysed in Tuc III showing a mild -process enhancement (), and seven of the nine stars in Ret II being extremely enhanced (). In Figure 6 the neutron-capture element abundances in J220423 are compared to the scaled solar system -process residuals from Arlandini et al. (1999). The scaling factor is calculated from the average difference between the J220423 and solar abundances for Ba, La, Pr, Nd, and Eu. The neutron-capture abundance pattern in J220423 matches the scaled solar system -process abundance pattern for elements from Ba to Eu. A similar match has also been found for -process enhanced stars in other ultra-faint and classical dwarf galaxies (Hansen et al., 2017; Ji et al., 2016c; Marshall et al., 2019), suggesting that similar nucleosynthesis events enriched these galaxies. Currently three astrophysical sites for heavy -process element production are proposed; NSM (Lattimer & Schramm, 1974), magnetorotational SN (Jet-SN) (Winteler et al., 2012), and collapsars (Siegel et al., 2019). Observationally only the NSM has been confirmed to produce -process elements (Drout et al., 2017). Also, more recent models for the Jet-SNe do not find that this site is capable of producing the heavy -process elements (Mösta et al., 2018).
For Ret II, Ji et al. (2016a) argued that the most likely source of -process elements in this galaxy is a NSM, due to the small size of the galaxy and the very large -process element enrichment. It should be noted that collapsars, which could be very efficient -process production sites (Siegel et al., 2019), were only introduced as a possible -process element production site after the Ji et al. (2016a) study. With the somewhat milder enhancement of Tuc III it was speculated that Tuc III may have been more massive in the past, thus having more gas to dilute the ejecta from the -process nucleosynthesis event compared to Ret II (Hansen et al., 2017; Marshall et al., 2019). This scenario also agrees with the extended tails detected for Tuc III (Li et al., 2018). Alternatively, the gas in Tuc III could also have been polluted by an outside event and thus only received a fraction of the -process ejecta.
When exploring the possible sources for the -process elements detected in Gru II we can consider the possible neutron-capture element production from the progenitors of the -element signature seen in Gru II. For the stars in Her also exhibiting the high signature, Koch et al. (2008) determined upper limits of . In fact, Koch et al. (2013) detected a general deficiency of Ba in a sample of 20 stars in Her. Thus the neutron-capture element enhancement of one of the Gru II stars does not seem to be coupled with the high-mass CCSNe associated with the -element signature detected for some stars in Her and all three stars analysed in Gru II. In fact, this type of CCSN is likely inefficient in producing neutron-capture elements.
The possible top-heavy nature of the IMF of Gru II, as suggested by the -element abundances of the stars, would result in an increased number of SNe. This in principle increases the chance of all three proposed -process nucleosynthesis sites to occur and does not provide any evidence of which one is most likely to have occurred. Following Ji et al. (2019b) and using the solar -process abundances from Sneden et al. (2008), we calculate the lanthanide fraction for J220423 and find . This value is very similar to the lanthanide fractions of Tuc III () and Ret II () (Ji et al., 2019b), and somewhat higher than the value found for GW170817 of . With only one NSM detected to date it is unclear if the lanthanide fraction derived from GW170817 represents the general lanthanide fraction distribution for NSMs; it is therefore difficult to conclude with this number that a NSM is not the source of -process elements in Gru II. In fact, the fact that J220409 and J220352, the most metal-poor stars of the three, show no Eu enhancement suggest some delay time from the enrichment of the system with elements to -process element enrichment, pointing at a NSM as the origin of the -process elements in Gru II. It is also possible that the -process event enriching the gas from which J220423 formed happened in a neighboring system, in which case the lanthanide fraction may be the only clue to the origin of these elements.
6 Summary
In this paper we have derived abundances for the three brightest member stars at the top of the giant branch of the UFD galaxy Gru II. High ratios were determined for all stars. This abundance signature can be produced via nucleosynthesis in high-mass (M⊙) CCSNe (Woosley & Weaver, 1995; Heger & Woosley, 2010), suggesting that Gru II was mainly enriched by a population of very high-mass stars and has a top-heavy IMF. The same chemical signature was also detected in the UFD galaxy Her (Koch et al., 2008), where the low mass stellar population has been found to have a top-heavy IMF (Geha et al., 2013). Alternatively the chemical signature of Gru II can also be the result of stochastic chemical enrichment of the galaxy. To further explore this issue, abundances for a larger sample of stars in Gru II covering a wider metallicity range is needed.
The abundances of Gru II also revealed an enhancement in -process elements in the most metal-rich of the three stars analysed. This star displays the well-known match to the scaled solar system -process abundance pattern, similar to what has been found previously for other -process enhanced stars in ultra-faint and classical dwarf galaxies and the MW halo (Sneden et al., 2008; Ji et al., 2016c; Hansen et al., 2017). The progenitor of the -process enhancement of Gru II does not seem to be directly coupled with the -element signature. However, the possible top-heavy nature of the IMF of Gru II would result in a larger population of high-mass stars in Gru II and thus also a higher possibility of various types of SNe, leading to -process element production. We calculate a lanthanide fraction of , similar to the fractions found in the other two UFD galaxies with -process enhanced stars, Ret II and Tuc III, and higher than the value derived for GW170817 (Ji et al., 2019b), thus not directly supporting a NSM origin for the -process elements. The possible delay in the -process enhancement compared to the -enhancement of the galaxy, however, does support a NSM as the source of the -process material in this galaxy.
The relationship between the IMF of UFDs and their chemical abundances is relatively unexplored, mainly due to the limited measurements of IMFs of UFD galaxies in combination with the small number of stars in these systems for which abundances can be measured. Expanding this data set will help to better understand the chemical evolution of these systems and the nucleosynthesis of the first stars.
References
- Abbott et al. (2018) Abbott, T. M. C., Abdalla, F. B., Allam, S., et al. 2018, ApJS, 239, 18
- Aoki et al. (2007) Aoki, W., Beers, T. C., Christlieb, N., et al. 2007, ApJ, 655, 492
- Arlandini et al. (1999) Arlandini, C., Käppeler, F., Wisshak, K., et al. 1999, ApJ, 525, 886
- Asplund et al. (2009) Asplund, M., Grevesse, N., Sauval, A. J., et al. 2009, ARA&A, 47, 481
- Barklem et al. (2005) Barklem, P. S., Christlieb, N., Beers, T. C., et al. 2005, A&A, 439, 129
- Belokurov et al. (2007) Belokurov, V., Zucker, D. B., Evans, N. W., et al. 2007, ApJ, 654, 897
- Bernstein et al. (2003) Bernstein, R., Shectman, S. A., Gunnels, S. M., et al. 2003, Proc. SPIE, 1694
- Casagrande et al. (2010) Casagrande, L., Ramírez, I., Meléndez, J., et al. 2010, A&A, 512, A54
- Castelli & Kurucz (2003) Castelli, F., & Kurucz, R. L. 2003, Modelling of Stellar Atmospheres, A20
- Cayrel (1988) Cayrel, R. 1988, The Impact of Very High S/N Spectroscopy on Stellar Physics, 345
- Chiti et al. (2018) Chiti, A., Frebel, A., Ji, A. P., et al. 2018, ApJ, 857, 74
- Chubak et al. (2012) Chubak, C., Marcy, G., Fischer, D. A., et al. 2012, arXiv e-prints, arXiv:1207.6212
- Cohen et al. (2007) Cohen, J. G., McWilliam, A., Christlieb, N., et al. 2007, ApJ, 659, L161
- Dotter et al. (2008) Dotter, A., Chaboyer, B., Jevremović, D., et al. 2008, ApJS, 178, 89
- Drlica-Wagner et al. (2015) Drlica-Wagner, A., Bechtol, K., Rykoff, E. S., et al. 2015, ApJ, 813, 109
- Drlica-Wagner et al. (2018) Drlica-Wagner, A., Sevilla-Noarbe, I., Rykoff, E. S., et al. 2018, ApJS, 235, 33
- Drout et al. (2017) Drout, M. R., Piro, A. L., Shappee, B. J., et al. 2017, Science, 358, 1570
- Feltzing et al. (2009) Feltzing, S., Eriksson, K., Kleyna, J., et al. 2009, A&A, 508, L1
- François et al. (2016) François, P., Monaco, L., Bonifacio, P., et al. 2016, A&A, 588, A7
- Frebel et al. (2016) Frebel, A., Norris, J. E., Gilmore, G., et al. 2016, ApJ, 826, 110
- Frebel & Norris (2015) Frebel, A., & Norris, J. E. 2015, ARA&A, 53, 631
- Frebel et al. (2014) Frebel, A., Simon, J. D., & Kirby, E. N. 2014, ApJ, 786, 74
- Frebel et al. (2013) Frebel, A., Casey, A. R., Jacobson, H. R., et al. 2013, ApJ, 769, 57
- Frebel et al. (2010) Frebel, A., Simon, J. D., Geha, M., et al. 2010, ApJ, 708, 560
- Geha et al. (2013) Geha, M., Brown, T. M., Tumlinson, J., et al. 2013, ApJ, 771, 29
- Gennaro et al. (2018) Gennaro, M., Tchernyshyov, K., Brown, T. M., et al. 2018, ApJ, 855, 20
- Gilmore et al. (2013) Gilmore, G., Norris, J. E., Monaco, L., et al. 2013, ApJ, 763, 61
- Hansen et al. (2017) Hansen, T. T., Simon, J. D., Marshall, J. L., et al. 2017, ApJ, 838, 44
- Hansen et al. (2018) Hansen, T. T., Holmbeck, E. M., Beers, T. C., et al. 2018, ApJ, 858, 92
- Heger & Woosley (2010) Heger, A., & Woosley, S. E. 2010, ApJ, 724, 341
- Ishigaki et al. (2014) Ishigaki, M. N., Aoki, W., Arimoto, N., et al. 2014, A&A, 562, A146
- Ji et al. (2020) Ji, A. P., Li, T. S., Simon, J. D., et al. 2020, ApJ, 889, 27
- Ji et al. (2019a) Ji, A. P., Drout, M. R., & Hansen, T. T. 2019, ApJ, 882, 40
- Ji et al. (2019b) Ji, A. P., Simon, J. D., Frebel, A., et al. 2019, ApJ, 870, 83
- Ji et al. (2016a) Ji, A. P., Frebel, A., Chiti, A., et al. 2016, Nature, 531, 610
- Ji et al. (2016b) Ji, A. P., Frebel, A., Ezzeddine, R., et al. 2016, ApJ, 832, L3
- Ji et al. (2016c) Ji, A. P., Frebel, A., Simon, J. D., et al. 2016, ApJ, 830, 93
- Ji et al. (2016d) Ji, A. P., Frebel, A., Simon, J. D., et al. 2016, ApJ, 817, 41
- Johnson (2002) Johnson, J. A. 2002, ApJS, 139, 219
- Kalirai et al. (2013) Kalirai, J. S., Anderson, J., Dotter, A., et al. 2013, ApJ, 763, 110
- Kallivayalil et al. (2018) Kallivayalil, N., Sales, L. V., Zivick, P., et al. 2018, ApJ, 867, 19
- Kelson (2003) Kelson, D. D. 2003, PASP, 115, 688
- Kelson et al. (2000) Kelson, D. D., Illingworth, G. D., van Dokkum, P. G., et al. 2000, ApJ, 531, 159
- Koch et al. (2013) Koch, A., Feltzing, S., Adén, D., et al. 2013, A&A, 554, A5
- Koch et al. (2008) Koch, A., McWilliam, A., Grebel, E. K., et al. 2008, ApJ, 688, L13
- Kroupa (2001) Kroupa, P. 2001, MNRAS, 322, 231
- Lattimer & Schramm (1974) Lattimer, J. M., & Schramm, D. N. 1974, ApJ, 192, L145
- Li et al. (2018) Li, T. S., Simon, J. D., Kuehn, K., et al. 2018, ApJ, 866, 22
- Maeder et al. (2015) Maeder, A., Meynet, G., & Chiappini, C. 2015, A&A, 576, A56
- Marshall et al. (2019) Marshall, J. L., Hansen, T., Simon, J. D., et al. 2019, ApJ, 882, 177
- McWilliam et al. (2013) McWilliam, A., Wallerstein, G., & Mottini, M. 2013, ApJ, 778, 149
- McWilliam & Searle (1999) McWilliam, A., & Searle, L. 1999, Ap&SS, 265, 133
- McWilliam et al. (1995) McWilliam, A., Preston, G. W., Sneden, C., et al. 1995, AJ, 109, 2757
- Mösta et al. (2018) Mösta, P., Roberts, L. F., Halevi, G., et al. 2018, ApJ, 864, 171
- Nagasawa et al. (2018) Nagasawa, D. Q., Marshall, J. L., Li, T. S., et al. 2018, ApJ, 852, 99
- Norris et al. (2000) Norris, J. E., Beers, T. C., & Ryan, S. G. 2000, ApJ, 540, 456
- Norris et al. (2010) Norris, J. E., Wyse, R. F. G., Gilmore, G., et al. 2010, ApJ, 723, 1632
- Pace & Li (2019) Pace, A. B., & Li, T. S. 2019, ApJ, 875, 77
- Placco et al. (2016) Placco, V. M., Frebel, A., Beers, T. C., et al. 2016, ApJ, 833, 21
- Placco et al. (2014) Placco, V. M., Frebel, A., Beers, T. C., et al. 2014, ApJ, 797, 21
- Roederer et al. (2016) Roederer, I. U., Mateo, M., Bailey, J. I., et al. 2016, AJ, 151, 82
- Roederer & Kirby (2014) Roederer, I. U., & Kirby, E. N. 2014, MNRAS, 440, 2665
- Roederer et al. (2014) Roederer, I. U., Preston, G. W., Thompson, I. B., et al. 2014, AJ, 147, 136
- Salpeter (1955) Salpeter, E. E. 1955, ApJ, 121, 161
- Siegel et al. (2019) Siegel, D. M., Barnes, J., & Metzger, B. D. 2019, Nature, 569, 241
- Simon et al. (2020) Simon, J. D., Li, T. S., Erkal, D., et al. 2020, ApJ, 892, 137
- Simon (2019) Simon, J. D. 2019, ARA&A, 57, 375
- Simon et al. (2010) Simon, J. D., Frebel, A., McWilliam, A., et al. 2010, ApJ, 716, 446
- Sneden et al. (2008) Sneden, C., Cowan, J. J., & Gallino, R. 2008, ARA&A, 46, 241
- Sneden (1973) Sneden, C. A. 1973, Ph.D. Thesis
- Sobeck et al. (2011) Sobeck, J. S., Kraft, R. P., Sneden, C., et al. 2011, AJ, 141, 175
- Spite et al. (2018) Spite, M., Spite, F., François, P., et al. 2018, A&A, 617, A56
- Tinsley (1979) Tinsley, B. M. 1979, ApJ, 229, 1046
- Tody (1986) Tody, D. 1986, Proc. SPIE, 733
- Tody (1993) Tody, D. 1993, Astronomical Data Analysis Software and Systems II, 173
- Tonry & Davis (1979) Tonry, J., & Davis, M. 1979, AJ, 84, 1511
- Umeda & Nomoto (2003) Umeda, H., & Nomoto, K. 2003, Nature, 422, 871
- Winteler et al. (2012) Winteler, C., Käppeli, R., Perego, A., et al. 2012, ApJ, 750, L22
- Woosley & Weaver (1995) Woosley, S. E., & Weaver, T. A. 1995, ApJS, 101, 181