Abstract
The formation of low-mass () stars in molecular clouds involves accretion disks and jets, which are of broad astrophysical interest. Accreting stars represent the closest examples of these phenomena. Star and planet formation are also intimately connected, setting the starting point for planetary systems like our own. The ultraviolet (UV) spectral range is particularly suited to study star formation, because virtually all relevant processes radiate at temperatures associated with UV emission processes or have strong observational signatures in the UV. In this review, we describe how UV observations provide unique diagnostics for the accretion process, the physical properties of the protoplanetary disk, and jets and outflows.
keywords:
star formation, ultraviolet, low-mass starsxx \issuenum1 \articlenumber5 \historyReceived: date; Accepted: date; Published: date \TitleThe UV Perspective of Low-Mass Star Formation \AuthorP. C. Schneider1,†⋆\orcidA, H. M. Günther2\orcidB, K. France3 \orcidC \AuthorNamesChristian Schneider \corresCorrespondence: astro@pcschneider.eu (P. C. S.) \firstnoteCurrent address: Hamburger Sternwarte, Gojenbergsweg 112, 21029 Hamburg, Germany
1 Introduction
Stars form in molecular clouds. When these clouds fragment, localized cloud regions collapse into groups of protostars. Stars with final masses between and , broadly the progenitors of Sun-like stars, start as cores deeply embedded in a dusty envelope, where they can be seen only in the sub-mm and far-IR spectral window (so-called class 0 sources). The collapse into a central condensation is not spherically symmetric due to angular momentum conservation. Instead, an accretion disk forms while the remaining envelope still hides the inner core from view in all but the mid/far-IR (class I sources). These young objects also typically drive powerful jets that propagate through the envelope, pierce the cloud, and are often the earliest signs of a forming star. After some time, the envelope dissipates and the stars become visible in the optical. This marks the transition to class II sources, also called classical T Tauri stars (CTTSs). The period of time between disk formation and the end of the CTTS phase is highly interesting as it is the time when planet formation is thought to take place. Afterwards, the circumstellar disk disperses, planet formation halts, and accretion ceases, typically within a few Myrs. Stars in this stage are called class III sources or weak-line T Tauri stars (WTTSs). They move along Hayashi tracks towards the main sequence where they will stay most of their lifetime. If we want to understand star and planet formation, including the Sun and the solar system, “we must unravel all the mysteries of [CTTSs]” (Imhoff, 1977). Of the different evolutionary steps, the CTTS stage is the earliest evolutionary step where UV observations can provide detailed information about the physical conditions in the disk, mass accretion onto the forming protostar, and outflow activity central to the star-formation process.
1.1 A Short History of CTTSs
CTTSs were initially identified as a new class of objects due their optical variability. Very early on, it was realized that they also show signs of enhanced chromospheric activity, i.e., “emission lines resembling those of the solar chromosphere” (Joy, 1945). These emission lines are superposed on a photospheric spectrum similar to main sequence stars of late spectral type. Initially, the source of emission in excess of a normal photosphere was speculated to be circumstellar or chromospheric in origin (Greenstein, 1950).
The discovery that CTTSs are above and to the right of the main sequence in an HR-diagram demonstrated in conjunction with theoretical work (Henyey et al., 1955), that these objects must be young and, thus, the progenitors of the large main sequence population (Ambartsumian, 1954; Walker, 1956). This notion is corroborated by the presence of strong Li absorption, which requires the Li abundance of the Sun (e.g. Magazzu et al., 1992). Because Li is depleted quickly in stellar interiors, the amount of surface lithium decreases with time in convective stars. Therefore, strong Li absorption can only be found in young stars and thus CTTS must be young (e.g. review by Pinsonneault, 1997).
Meanwhile the number of peculiarities found in CTTSs grew, but their established youth alone was insufficient to explain those peculiarities and the “mysteries” of CTTSs remained. Many features, like the origin of the “chromospheric emission” remained unexplained, until the early 1980s when a large variety of models were proposed to explain features of CTTSs including envelopes, outflows, infall, and dust disks.
Specifically, the “ultraviolet excess” (measured around 3700 Å) and the “blue continuum”, which go along with a weakening of photosperic absorption lines due to veiling (Kuhi, 1974; Strom et al., 1975), were shown to correlate with the strength of H (Kuhi, 1966, 1968). Such a correlation indicates a common origin of both features as observed for chromospheric emission on the Sun. Thus, it was natural to ascribe the excess continuum emission at short wavelengths to a Balmer continuum, i.e., emission following the capture of a free electron by an ionized hydrogen atom. While that finding pinpoints neither the physical origin nor location of the emitting material, it paved the way for explanations involving a suitably tuned chromosphere for producing the observed (Balmer & Ca II H+K) line fluxes in CTTSs. Quantitative models of deep lying chromospheres by Cram (1979) using ad hoc temperature profiles, so-called deep chromosphere models, were able to reproduce the fluxes except for H.
These static chromospheric models, however, had difficulties in explaining the kinematic line profiles observed in CTTSs (Dumont et al., 1973) and additional emitting regions were required (Brown et al., 1984; Calvet et al., 1984) to explain the suite of line properties and overall flux characteristic. In fact, the existence of infalling or outflowing material was already postulated by Walker (1963) in 1963. The emission lines observed in CTTSs often show P Cygni profiles that were initially interpreted in terms of a hot ( K) outflow (Kuhi, 1964)—somewhat contradictory to the general infall during the cloud contraction phase (Larson, 1973). Interestingly, the mass-loss rates that go along with this shell expanding at around 300 km s-1 were estimated to a few times yr-1, similar to modern day mass loss estimates (though not in the form of a spherical mass-loss).
The outflow explanation, however, was not entirely satisfactory, although the presence of P Cygni profiles was thought to conclusively demonstrate the existence of mass-loss in CTTSs. Notwithstanding the question why CTTSs should be surrounded by a shell of hot gas, the inverse P Cygni profiles expected for mass-infall are mainly seen in YY Ori stars, a class of objects that share many similarities with CTTSs. The notion that mass accretion onto the central star also plays a key role in CTTSs was proposed when it was discovered that the line profiles can cycle between the inverse P Cygni profile of “typical” CTTSs and the inverse P Cygni profile of YY Ori objects within a few days (Walker, 1972; Strom et al., 1975) and it was suggested that a flattened disk, by analogy with the solar system, exists around CTTSs. In fact, the IR excess of CTTSs was soon to be found with the advent of IR instruments and correctly ascribed to relatively cold ( K) dust; the alternative of an optically thin gaseous envelope would produce booming Balmer continuum emission that is not observed (Cohen and Kuhi, 1979). This dust, or rather the flared protoplanetary disk around the star, is of exceptional importance for the study of CTTSs. In this article, however, we treat the disk just as a reservoir of material close to the central star and refer the interested reader to recent reviews for more details on protoplanetary disks (Dullemond and Monnier, 2010; Williams and Cieza, 2011).
The disk hypothesis has the great property of leaving a large fraction of the stellar photosphere with its absorption lines visible, provided that the “ultraviolet excess” emission is roughly comparable in luminosity. Walker (1972) postulated a shock forming at the interface between material falling onto the star and the stellar photosphere as the source of the continuum emission and the disk as the source of the Balmer line emission—the first mention of the CTTS accretion paradigm, which is still largely accepted. Notably, it is still believed that the Balmer lines do not originate in the same region as the continuum emission although the disk itself is not considered the dominant emission region anymore. The disk accretion scenario was subsequently put on solid theoretical grounds by Lynden-Bell and Pringle (1974) and Shakura and Sunyaev (1973). The accretion scenario was then specifically applied to CTTSs for explaining the line profiles including blue-shifted absorption (Ulrich, 1976). Ulrich (1976) already noted that soft X-ray emission from the post-shock plasma is expected.
1.2 The First FUV Observations of Young, Accreting Stars
With protoplanetary disks, accretion, and outflows in the form of winds and jets recognized as significant processes for CTTSs, essentially all major features of CTTS systems were identified Bertout (2007) and required observational support/constraints with the “…ultraviolet spectral region [holding] promise in helping to resolve many of the issues connected with the T Tauri stars.” (Imhoff and Giampapa, 1980). This statement still holds as demonstrated, e.g., by the inception of a Hubble Ultraviolet Legacy program using HST Director’s Discretionary time, the “UV Legacy Library of Young Stars as Essential Standards” (ULLYSES) survey, which is anticipated to dedicate 500 HST orbits to study low-mass star formation in the ultraviolet.
Three features make the UV spectral range particularly interesting to study CTTS: (a) Emission from hot plasma related to the accretion shock should emit most of its energy in the FUV range (already mentioned in (Appenzeller and Wolf, 1979)), (b) disk features seen as fluorescently excited H2 and CO emission (Herczeg et al., 2002; Schindhelm et al., 2012) and in absorption against the star (France et al., 2011), and (c) bright atomic emission lines from the hot post-shock region of protostellar jets and fluorescent emission from wide-angle outflows (Schneider et al., 2013).
https://www.overleaf.com/project/5e42c54e77c525000110cf18
The first FUV (1550, 1800 Å) to NUV (2200, 2500, 3300 Å) photometric data of CTTSs were obtained by the ultraviolet experiment onboard the Astronomical Netherlands Satellite (ANS, van Duinen et al. (1975)). Targeting seven of the “most prominent” CTTSs, three were detected de Boer (1977). In the discovery paper, de Boer (1977) specifically discuss the FUV properties of V 380 Ori, which showed excess emission that they associate with the Balmer continuum produced by dense gas. Interestingly, these authors already state that dereddening FUV fluxes of CTTSs is subject to comparably large uncertainties, still one of the unsolved uncertainties when studying CTTSs (see discussion in France et al. (2017)).
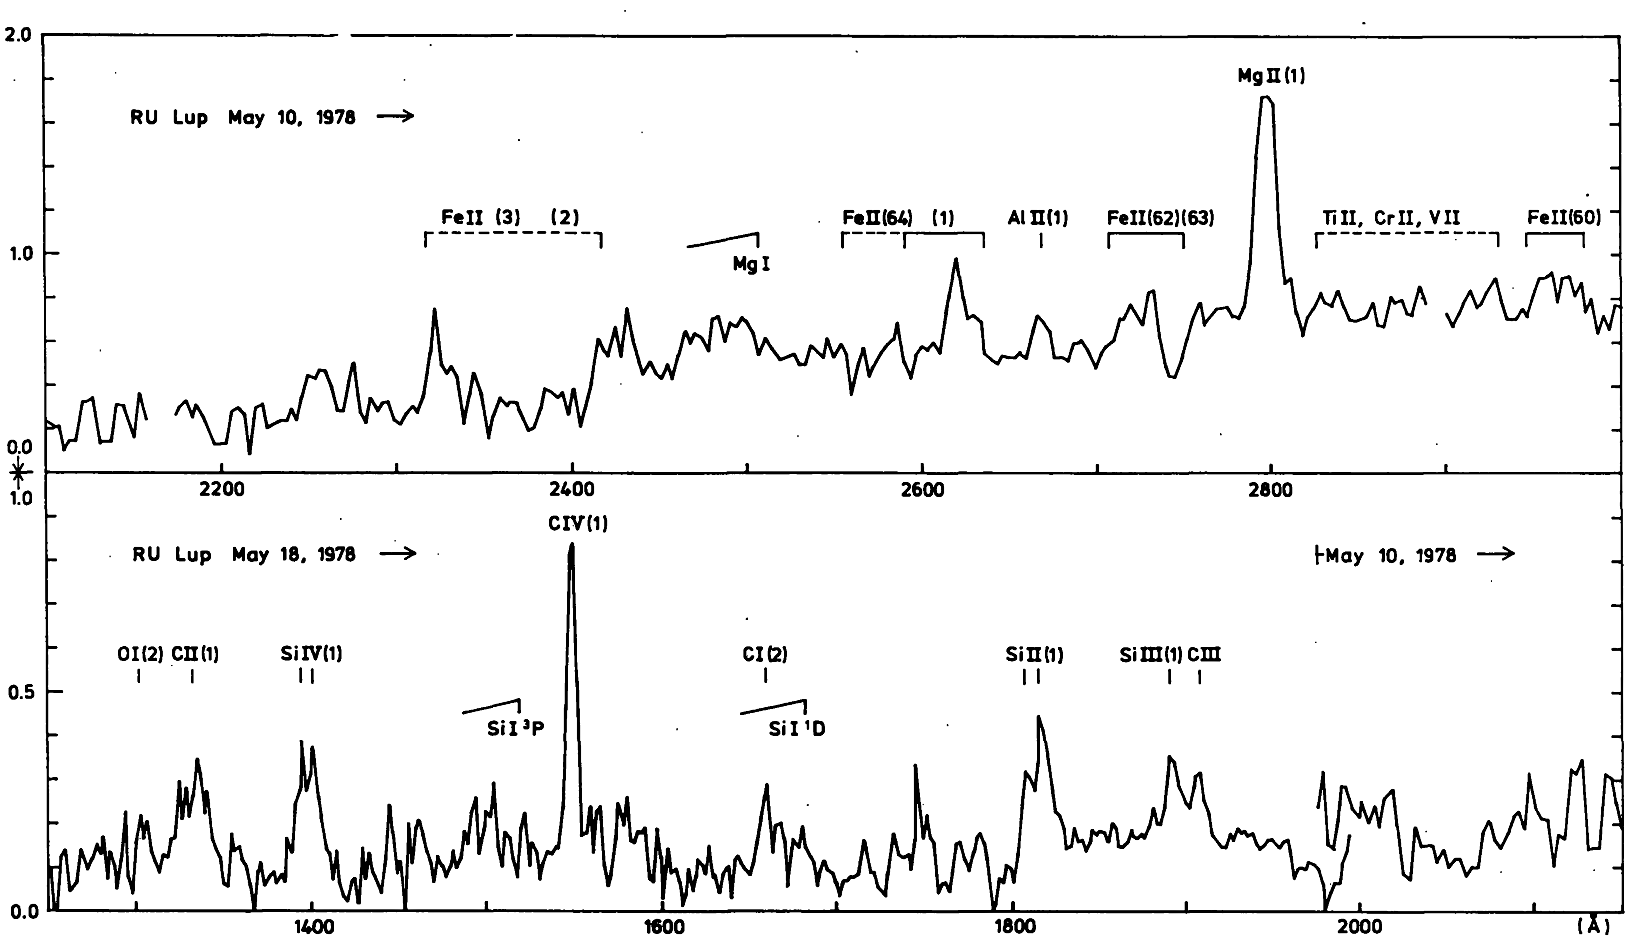
A big step forward for FUV studies of CTTSs was the launch of the IUE satellite Boggess et al. (1978), which provided the opportunity to measure individual lines in larger samples of CTTSs. Figure 1 shows an IUE spectrum of the CTTS RU Lup Gahm et al. (1979), still representative for most CTTSs FUV spectra. The spectrum is dominated by strong emission lines from ionized species with the presence of C iv, Si iv, and Mg ii and Gahm et al. (1979) suggested regions with “around” the star, a notion that essentially holds today as most of the hot lines are thought to arise from material somehow influenced by accretion.
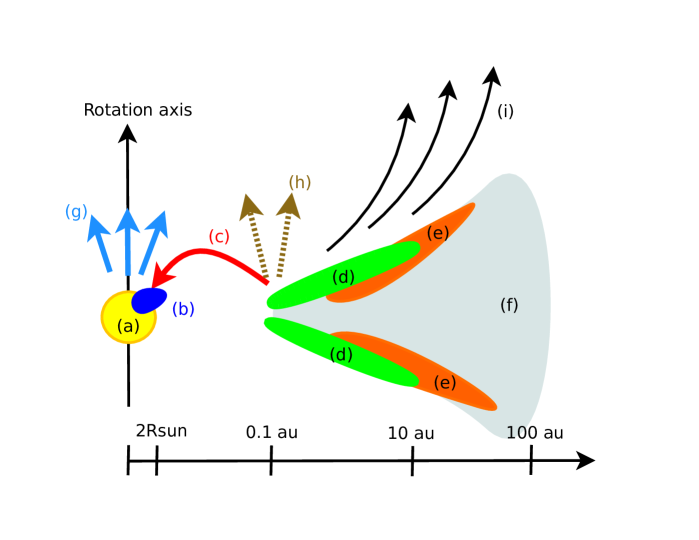
Figure 2 provides a sketch of the most relevant FUV emission regions in CTTSs. In the next sections, we successively describe how FUV studies continue to provide key information for the physical processes in CTTSs. We begin with the intrinsic FUV emission of the star due to enhanced magnetic activity, move then successively outwards, i.e., we then discuss the emission thought to arise from accretion, the disk features, and emission from outflows and jets. We close with a quick prospectus on future UV disk studies.
2 Stellar UV emission of CTTSs from magnetic activity
Young stars are rapid rotators with typical rotation periods of a few days Bouvier et al. (1986, 1993); Herbst et al. (2007); Bouvier et al. (2014), because the stars retain some of the angular momentum from their natal cloud during the contraction phase. In addition, T Tauri stars possess largely convective interiors while moving from the birth line towards the zero age main sequence (ZAMS) so that they are able to generate kiloGauss magnetic fields (Gregory et al., 2010). As a result, T Tauri stars show all signs of enhanced magnetic activity in the form of strong chromospheric and coronal emission compared to their main sequence siblings (Houdebine et al., 1996; Feigelson and Montmerle, 1999).
In non-accreting stars, chromospheric activity causes emission in excess to that expected from the stellar photosphere and particularly WTTSs are highly magnetically active Walter (1987). This enhanced magnetic activity is due to extended outer, rarefied layers of the atmosphere with temperatures between about and K. Above the photosphere, one finds the chromosphere () and a transition region (TR, K) connecting the chromosphere with the corona ( K). As a rule of thumb, chromospheric and TR emission is most prominent in the UV range while the corona emits mostly in the X-ray regime.
For the study of genuine star formation related processes, e.g., accretion, the enhanced magnetic activity of T Tauri stars is a nuisance, because the chromospheric and TR emission from magnetic activity must be carefully separated/subtracted. WTTSs are excellent templates for the emission caused by magnetic activity, because they lack accretion and gas-rich disks, but share internal structure and rotation with the CTTSs. Using a magnetically inactive dwarf as a template for the UV emission instead of a WTTS may result in the erroneous conclusion that a particular star is accreting at a significant rate ( yr-1, Ingleby et al. (2011)).
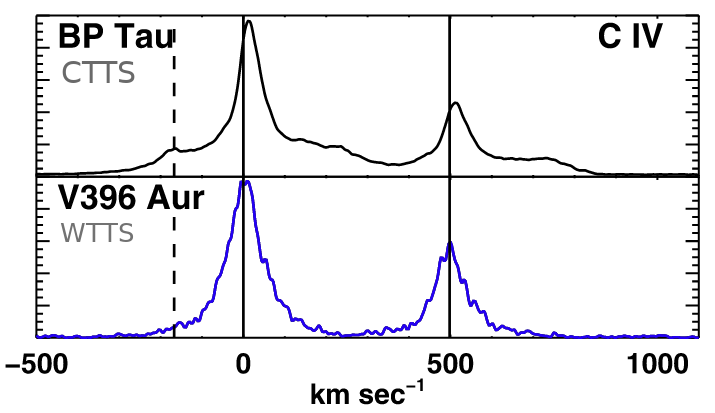
It is therefore not surprising that many large observing programs studying CTTSs included a number of WTTSs as templates to distinguish emission from magnetic activity and, e.g., accretion (Costa et al., 2000, and Fig. 3). Any emission in excess of the chromospheric to coronal flux of WTTSs is, as a starting hypothesis, thought to be attributable to star formation processes such as accretion, disks, or jets. (In fact, no theory exists that covers self-consistently all FUV emission components of CTTSs.) Therefore, we define the term “excess emission” in the context of this article as the emission not seen in a comparable WTTSs although we note that WTTSs show some spread in their UV properties Findeisen et al. (2011).
3 Accretion
CTTSs possess strong stellar magnetic fields in the kG range (Johns-Krull, 2007), compared to just a few G average surface fields on solar mass main-sequence stars. The strong magnetic fields truncate the disk at a few stellar radii so that accretion proceeds along magnetic field lines connecting the star and the inner disk Koenigl (1991). This leads to a strong shock, where the infalling material impacts the stellar atmosphere (see Fig. 2). Since typical free-fall velocities are around 300 km s-1, the post shock temperature is in the MK range and the plasma cools predominately through X-ray emission, which is then partly reprocessed into UV and optical radiation (Calvet and Gullbring, 1998; Schneider et al., 2017). The accretion hot spot covers on the order of 1 % of the stellar surface, so that the densities in the accretion funnel should be around cm-3 to provide the accretion rates in the observed yr-1 range Calvet and Gullbring (1998). This accretion-driven high-energy emission represents the main ionizing agent at the surface of the protoplanetary disk, where the material is transported inwards Hartmann et al. (2016). There is general consensus that the main features of this picture are correct, but key processes remain uncertain—especially when it comes to attributing FUV emission to individual processes.
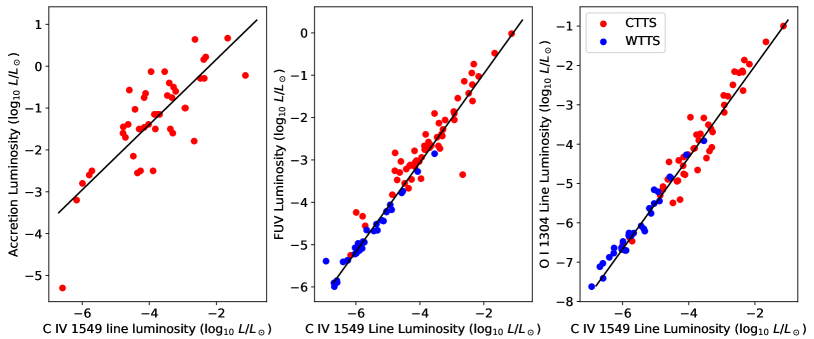
At FUV wavelengths, the main diagnostics of accretion are enhanced fluxes in hot ion lines like C iv (Fig. 3). Three properties demonstrate that accretion indeed is the root cause of the excess in these lines:
- 1.
- 2.
-
3.
The lines are broader in CTTSs than in WTTSs Valenti et al. (1993).
In particular Johns-Krull et al. (2000) find that the “emission line luminosity in the high ionization lines present …correlates well with the mass accretion rate.”. However, these authors also noted that the existence of the correlation depends critically on the source of their extinction values. A significant correlation results only for a certain set of extinction values and this strong dependence on the often uncertain UV extinction is still relevant today.
Later, the relation between FUV fluxes in hot ion lines and accretion was confirmed by Yang et al. (see Fig. 5, 2012) with a large set of 91 stars with data from HST ACS, STIS, and GHRS lending further support to the notion that accretion is indeed responsible for the bright emission in hot ion lines. Interestingly, the ratio between fractional line luminosities of different ions, e.g., C iv and O i , is the same in CTTSs as in WTTSs although the respective peak line formation temperatures are very different ( vs 5) and although CTTS line fluxes are one to two orders of magnitudes higher than those of comparable WTTSs (cf. Fig. 5 right and Yang et al., 2012).
Pinpointing the origin of the hot ion lines is challenging and currently an open issue; different scenarios for the accretion column have been proposed (cf. Fig. 4). Most of the accretion funnel has only K Muzerolle et al. (1998); Kwan and Fischer (2011), therefore only two regions may generate the accretion contribution to the hot ion emission. The material of the funnel immediately above the shock (the radiative precursor) or postshock material are the only likely sources of the hot ion line excess (Ardila et al., 2013).
The relative importance of pre- and post-shock regions depends mainly on shock velocity and density Lamzin (1998). Both components should have red-shifted velocities: Material in the funnel should have velocities of a few 100 km s-1 while the shocked material will be at velocities of just tens of km s-1 and the expected line profile is rather narrow (e.g., for the typical km s-1, km s-1). However, in the Goddard High Resolution Spectrograph (GHRS) spectra () of eight CTTS presented by Ardila et al. (2002), one finds broad emission lines from hot ions (C iv, Si iv, etc.) with a range of centroid velocities (from blue-shifted to centrally peaked to red-shifted). Also higher excitation lines like O vi show a great variety of line profiles, again including peaks that are blue- and red-shifted from the stellar rest velocity Günther and Schmitt (2008). Later studies using STIS Herczeg et al. (2005) as well as COS data Ardila et al. (2013) confirm these trends revealing sometimes complex line profiles that may be modified through absorption or emission by outflowing material. When the Si iv line profile can be measured under the H2 emission, the C iv line shapes agree relatively well. However, the line ratios between the blue and red members of the doublets agree with the ratio expected from optical thin emission only (generally) for C iv and not for Si iv, which is puzzling given that the radiative precursor should be optically thin to both, Si iv and C iv Lamzin (1998) (although this implicitly assumes that the lines are predominately collisionally excited). Furthermore, the C iv line shape agrees with that of Si iii], which is thought to come from the radiative precursor Lamzin (2000).
In a comprehensive analysis of FUV lines from CTTSs using HST COS data, Ardila et al. (2013) demonstrate that most hot ion lines, in particular Si iv, C iv, and N v, share one kinematic profile and can be decomposed into a narrow and broad component. The ratio between these two components depends on the accretion with the narrow component’s contribution increasing with accretion rate.
It is interesting to note that the conversion from FUV line fluxes to stellar accretion rate is based on empirical correlations between the FUV line fluxes and other, perhaps more traditional, accretion tracers like H equivalent width (EW) or veiling measurements (Johns-Krull et al., 2000). Application of the Calvet and Gullbring (1998) shock models by Ingleby et al. (2013) to the NUV to optical spectrum of CTTSs revealed that the same accretion column (specified by their energy flux) cannot simultaneously reproduce the UV and optical ranges of the spectrum; these authors require the existence of multiple accretion columns with different F-values, i.e., different densities for the same infall velocity. With this prescription, the emission of the different funnels peaks at different wavelengths and a more precise (but not necessarily accurate) description of the excess flux is achieved, which also modifies the derived accretion rate by roughly a factor of two (Ingleby et al. (2013), Robinson and Espaillat (2019)). Such a scenario (multiple accretion columns with different densities) is appealing, because it may explain (a) that UV line ratios indicate rather low densities in the emitting region (cm-3) based on ratios between the He ii and C iv lines Ardila et al. (2013) as well as semi-forbidden lines that should be optically thin Gomez de Castro and Lamzin (1999). In addition, (b), this could explain the varying ratio between the narrow and broad components, because part of the post-shock material may be buried in the photosphere and a varying ratio of the pre- and post-shock plasma is seen depending on the exact accretion geometry Ardila et al. (2013). A detailed description of the accretion process is beyond the scope of this review, however, we think that there are not necessarily different accretion funnels, but rather one column with a density stratification (see sketch in Fig. 4) and we note that structured accretion streams may also explain some of the X-ray diagnostics (e.g. Matsakos et al., 2013; Colombo et al., 2016; Schneider et al., 2018). In this picture, the individual funnels with different densities are replaced by a single column, but with a continuum of densities so that the description of the excess emission as a sum of different density columns is just a simplification of the true column structure and the accretion column may also possess some structure along the flow direction. In summary, our picture of the accretion funnel evolved over the last two decades from a single monolithic column to a structure that is stratified in density along the radius with an additional density modulation along the infall direction. As of 2020, however, there is no quantitative model that simultaneously reproduces the optical/NUV/FUV features of accretion emission (although individual aspects can be reproduced in simulations). We need both simultaneous observations from the X-ray to the optical range as well as theoretical work to self-consistently describe the accretion process of CTTSs.
4 Protoplanetary Disks
Circumstellar accretion disks are essential components of CTTS systems. They are typically studied at infrared to mm-wavelengths as those are the wavelengths where most of the energy received from the central star is re-radiated Williams and Cieza (2011). These so-called protoplanetary disks are not only the sites of ongoing planet formation, but are also highly structured and dynamic objects with features like warps, (dust) gaps, and spirals (e.g. Andrews et al. (2018)). It is currently debated if these features can be ordered into a sequence in time; in particular, if so-called transitional disks (TDs), which harbor significant (dust) gaps, are more evolved disks compared to full gas and dust disks.
Protoplanetary disks are thought to consist mainly of gas with just about one percent of the mass in dust like the ISM. The local physical properties like temperature and density depend, to first order, mainly on radius and height within the disk (see sketch in Fig. 2). One would like to study both the disk gas and dust since gas controls its dynamics while the dust is highly relevant for the formation of planetary cores. Observationally, the dust is more readily accessible compared to the gas, because of its continuum emission at sub-mm wavelength while observing protoplanetary disk gas requires more challenging spectroscopic line measurements.
The dominant species of protoplanetary disks, molecular hydrogen, is difficult to observe directly, because the electric dipole transitions between rotational and vibrational states are forbidden as H2 has no net dipole moment. H2 can undergo quadrupole rotational transitions that produce weak emission lines in the mid-IR due to low oscillator strengths. The large spacing between even the lowest energy levels makes it, however, difficult to excite the molecules via collisions in cold gas of the disk midplane. Therefore, the IR-H2 lines are weak and most sample surveys find a relatively low detection rate with accordingly tight constraints on the amount of warm (K) molecular hydrogen in the disks Bary et al. (2008); Bitner et al. (2008). Carbon monoxide (CO) is often used as a tracer for the disk’s gas content, especially with the advent of ALMA. However, the interpretation of the CO emission is challenging since CO may freeze-out on dust grains and detailed models are required to convert the measured emission line fluxes into gas disk masses Miotello et al. (2014). Therefore, complementary diagnostics of the disk’s gas are highly desired.
On first sight, it may appear surprising that gas disk diagnostics reside in the FUV because equilibrium temperatures in the disk are very low (tens to hundreds of K) compared to the peak formation temperatures of prominent atomic emission lines (like C iv at K). Nevertheless, FUV observations of (i) fluorscently excited molecular emission lines, (ii) the 1600 Å bump, and (iii) disk absorption features provide unique information on disk chemistry and dispersal.
4.1 Fluorescently Excited Molecular Emission Lines
In contrast to the weak IR-H2 lines, the FUV transitions of H2 have large oscillator strengths. These lines result from electronic Lyman- and Werner-band transitions, which break symmetries in the molecular structure and enable dipole-allowed transitions. The UV-H2 features originate from a population of vibrationally excited gas “pumped" from the ground electronic state into the low-lying excited electronic states by Ly photons, the strongest stellar emission line in the FUV Schindhelm et al. (2012). Depending on the pumping wavelength, molecular hydrogen is excited into the Lyman (, Abgrall et al. (1993a)) or Werner (, Abgrall et al. (1993b)) electronic bands. Each excited state emits a characteristic spectrum, called progression, with known ratios between the individual lines for each progression. The dipole-allowed transitions have large Einstein coefficients (s-1) so that these electronic states will decay instantaneously in a fluorescent cascade down to one of many different rovibrational levels in the ground electronic state (, Herczeg et al. (2002)).
In protoplanetary disks, the UV-H2 emission originates in the inner regions ( au) Herczeg et al. (2002, 2004); France et al. (2012); Hoadley et al. (2015) where gas temperatures can reach the 1500 K threshold required for Ly fluorescence to take place Ádámkovics et al. (2016). A large number of fluorescent UV-H2 emission lines are observed in the 1050–1700Å wavelength range Herczeg et al. (2002); France et al. (2012) accessible by HST observations (see Fig. 6). The UV-H2 fluxes correlate with hot ion line fluxes like C iv, which suggests that one mechanism controls the FUV spectrum (Johns-Krull et al., 2000)—and accretion appears as the most probable candidate, because higher accretion rates imply more Ly with a resulting higher excitation rate of the UV-H2 lines. The existence of UV-H2 as well as CO strongly suggest that both the CO and H2 in the inner disk are shielded by very little neutral hydrogen (Schindhelm et al., 2012; France et al., 2012a).
Herczeg et al. (2002) measured 146 UV-H2 emission lines from TW Hya with HST-STIS and find that the features are coincident with the star in velocity space and not spatially extended beyond the 0.05" resolution of the instrument, as would be expected for emission from an outflow. These observations indicate that the emitting H2 is located in the inner regions of the protoplanetary disk (within AU at the distance of 56 pc to TW Hya). Nevertheless, some contribution from an outflow may be present as the H2 line centroids are generally slightly blue-shifted Herczeg et al. (2005) and do not typically show the double-peaked profiles expected from a pure disk emission model Hoadley et al. (2015), see also sect. 5.
In CTTSs, one observes a number of H2 absorption features against the wings of the stellar Ly line. The relative depths of these H2 absorption features depend on the respective absorbing column density . The relative population of these states depends on the total column density and the excitation temperature (assuming a single, thermal population of absorbing molecular hydrogen France et al. (2012b)). Measuring numerous absorption features for 22 CTTSs, Hoadley et al. (2017) find that (a) the low energy states follow the pattern expected for K while the high-energy states of H2 show higher occupancies than expected. These authors speculate that the non-thermal populations arise in a diffuse molecular disk atmosphere where level populations are driven out of thermal equilibrium by Ly photon pumping.
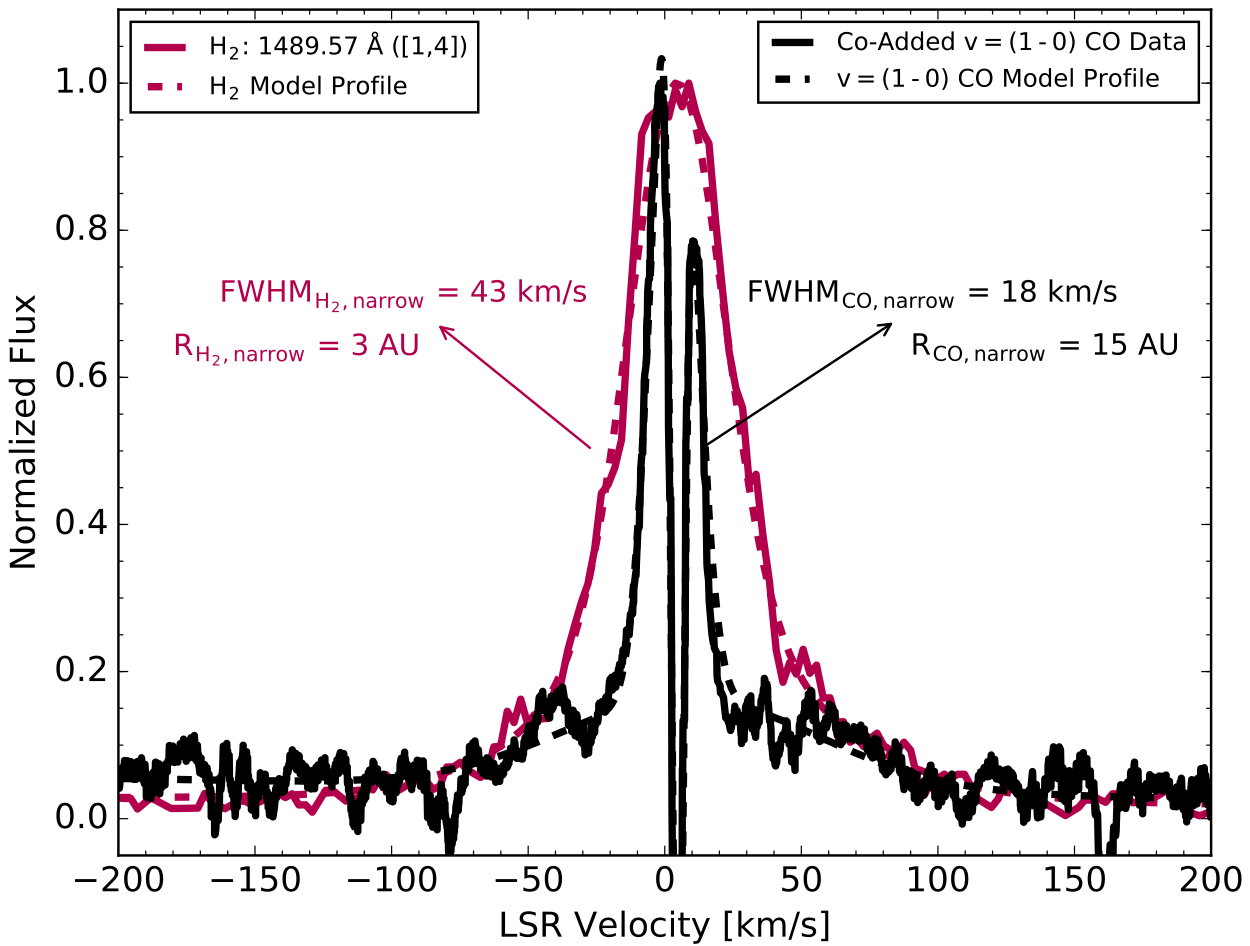
Kinematic modelling is another powerful technique to derive spatial information from the UV-H2 emission lines as the spectral resolution of the UV instruments onboard HST is sufficient given the velocities expected in the inner disk region Schneider et al. (2015); Hoadley et al. (2015). Assuming that the emission at each radius has a Keplerian profile, the radial profile of the molecular hydrogen emission can be reconstructed, see Fig. 6. The emission is confined to au for most sources with a characteristic emission radius of just about 1 au, which agrees with the upper limits imposed by the spatial analysis of STIS data Herczeg et al. (2006). The UV-H2 emission can be also used to study the evolution of disk gas with system age as described in more detail in sect. 4.5.
The second most abundant species in protoplanetary disks, CO, also emits in the FUV. Photo-excited CO gas traces cooler disk regions compared to H2 (UV-CO; K). Its emission originates from several ro-vibrational bands of the (Fourth Positive) electronic transition system. Similar to the UV-H2, the UV-CO emission is pumped by stellar (accretion driven) Ly and partly by C iv photons. Schindhelm et al. (2012) detect UV-CO emission from K gas in roughly half of the FUV disk spectra, i.e., a different population than the warmer CO gas ( K) well studied in the strong fundamental band rovibrational emission lines at 4.7-5 m Salyk et al. (2009, 2011); Brown et al. (2013). These differences may be attributed to the FUV CO population residing more distant from the star than either the IR-CO or UV-H2 emitting gas (Schindhelm et al., 2012). Compared to UV-H2, the signal of the UV-CO lines is weaker and kinematic modelling subject to larger uncertainties. Generally, however, the UV-CO emission correlates with the stellar Ly emission, i.e., mainly with accretion rate. The second strongest parameter controlling the the UV-CO emission may be the dust and gas opacity of the inner disk, or in other words, observations of UV-CO emission is more indicative of the dispersal of cooler gas than UV-H2 emission.
4.2 The ”1600 Å Bump”
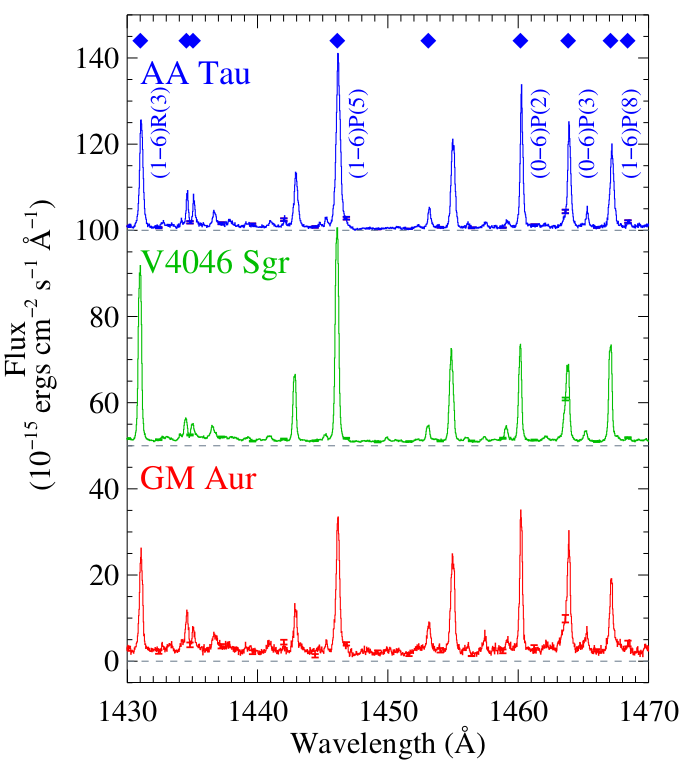
The FUV continuum emission of CTTSs is comparably weak, because both, the stellar and the accretion continuum, decline towards shorter wavelengths; in contrast, the accretion continuum is readily detected in the NUV (Ingleby et al., 2013). Therefore, good continuum measurements require high S/N and the discovery of a broad (50–200 Å) emission feature, roughly centered on 1600 Å in the FUV continuum of CTTSs was somewhat surprising (see Fig. 7 and refs Bergin et al., 2003; Herczeg et al., 2004; Ingleby et al., 2009). In fact, the dominant bump formation is still not entirely clear, but most likely results from line and continuum emission from vibrationally excited H2.
France et al. (2017) detect the 1600 Å-Bump in 19 out of 37 CTTSs surveyed. The detection rate is 100 % in transition disks compared to about one third in primordial or non-transition disk sources. Because the integrated flux of the 1600 Å-Bump is a significant fraction of the entire H2 and continuum flux, France et al. (2017) suggest that the bump draws its energy from the Ly radiation field. Specifically, these authors suggest that the Ly-driven dissociation of water in the inner disk generates a population of highly non-thermal H2 and emission from this population then produces the 1600 Å-Bump, i.e., efficient water dissociation by Ly photons during the later stages of disk dispersal France et al. (2017). This scenario is supported by the lack of a correlation between 1600 Å-Bump and stellar X-ray luminosity Espaillat et al. (2019). Another cause for large 1600 Å-Bump luminosities may be high photo-electron densities (presumably driven by stellar X-rays; Bergin et al. (2003); Ingleby et al. (2009)).
4.3 Disk Absorption
For moderately inclined disks (), the line of sight towards the central star passes through the upper disk regions. The observed spectrum then contains absorption features from the disk. In the FUV, the two most abundant species in protoplanetary disks, H2 and CO, have strong absorption bands, which allow the measurements of column densities and rovibrational temperatures. The absorption profile depends on (1) an (assumed) turbulent velocity (typically small, km-1), (2) a column density, and (3) a rotational temperature.
While FUV-CO absorption is an established technique in many fields of astronomy, e.g., for the study of the interstellar medium (ISM, see Burgh et al. (2007) and references therein) or planets Feldman et al. (2000), its use for protoplanetary disks was first proven in 2011 by France et al. (2011), who measure absorption by the ground vibrational state (–0) of CO against the backlight of the FUV accretion continuum of the central star. In their analysis of 34 T Tauri stars, McJunkin et al. (2013) find CO absorption in about one quarter of the sources. For these sources, the FUV-CO absorption velocities are compatible with the radial velocity of the target star within the instrumental velocity calibration uncertainty of about 15-20 km s-1. The data imply rotational temperatures around 500 K, which may be reached out to radii of 0.2–2 au assuming thermal equilibrium with the stellar radiation field. Compared to the IR-CO emission, the temperatures of the UV-CO absorption are lower, perhaps because FUV-CO absorption traces a gas population at larger disk radii than the IR data. When combined with estimates for the conditions required for a thermal equilibrium between the rotational states and the radiation field from disk models Woitke et al. (2011), McJunkin et al. (2013) suggest that the CO absorbing gas resides in disk layer at a height of and 0.7, i.e., the flared upper disk atmosphere.
In the FUV spectra of CTTSs, H2 absorption is seen both, against the continuum and against the Ly line. For estimating an CO/H2-ratio, however, one should compare the respective absorption features seen against the continuum (see discussion in France et al., 2014). In the best characterized CO and H2 absorption system, RW Aur, the CO/H2 ratio is found to be , which is compatible with the value for the ISM. Since the CO/H2 is of fundamental importance for disk chemistry and disk mass estimates, future studies using FUV absorption will provide unique information not attainable with, e.g., ALMA observations and disk modeling. Therefore, future mission concepts like NASA’s LUVOIR specifically aim at high-sensitivity, high-resolution absorption line spectroscopy through moderately inclined disks (France et al., 2017).
4.4 Disk Chemistry and the UV SED
The strength and shape of the FUV radiation field has a strong influence on the chemical abundances of the disk, both at planet-forming radii ( au; Bergin et al., 2003; Walsh et al., 2012) and at larger radii (au) where the majority of the disk mass resides Bergin et al. (2007). The stellar FUV continuum controls the dissociation of the most abundant disk molecules (H2 and CO; Shull and Beckwith (1982); van Dishoeck and Black (1988)). The propagation of the FUV continuum is mainly regulated by dust grains van Zadelhoff et al. (2003); the processes of grain-growth and settling likely allow these photons to penetrate deeper into the disk as the protoplanetary environment evolves Vasyunin et al. (2011).
Bergin et al. (2003) first emphasized the importance of accretion-generated H i Ly to the disk chemistry, and more recently it has been shown that the FUV spectral energy distribution of all CTTSs is overwhelmingly dominated ( 80%) by Ly emission Schindhelm et al. (2012); France et al. (2014). Unlike the FUV continuum emission, the radiative transfer of Ly photons is controlled mainly by resonant scattering in the upper, atomic disk atmosphere Bethell and Bergin (2011). Subsequent detailed disk modeling has demonstrated the importance of properly accounting for Ly radiation from the central star, finding significant ( order of magnitude) depletions in the abundances of C2H4, CH4, HCN, NH3, and SO2 when Ly is included Fogel et al. (2011). Interestingly, some species with large photo-absorption cross-sections in the region around Ly, such as H2O, do not show significant depletion, because the enhanced dissociation rate is balanced by Ly-driven photodesorption of water molecules from dust grains. It is clear now that Ly is a mandatory component of FUV radiation fields used for chemical modeling. Historically, the large CTTS spectral atlases do not cover Ly Yang et al. (2012), or are dominated by geocoronal emission, such as archival IUE data. Reconstructing the Ly radiation field impinging the inner disk region requires measurements of a large number of UV-H2 lines (see Fig. 9); the largest such atlas of high-resolution FUV spectra of CTTSs is provided by France et al. (2014) with high-level data available for download.
Deriving accurate FUV fluxes is challenging, because extinction estimates are typically based on the comparison between a stellar template (augmented by a suitable accretion spectrum for CTTSs) and observed colors or flux-calibrated spectra plus an assumed shape of the extinction curve. It is known that the extinction values derived from optical and NIR data can differ, but this effect is mild compared to the extrapolation into the FUV where the correction factors are large. Specifically, it was found that the intrinsic, de-reddended UV-H2 luminosity is correlated with the assumed extinction values, which is not physically expected and suggests that the large extinction corrections, or rather errors in them, dominate over the intrinsic variations between the systems (France et al., 2017). In an attempt to remedy this situation, McJunkin et al. (2016) performed detailed modelling of the UV-H2 lines including self-absorption and use the known branching ratios to recover the shape of the FUV extinction curve. Although the line of sight towards the UV-H2 emitting region in the inner disk may be subject to a different extinction than the central star, McJunkin et al. (2016) find a number of sources for which this and more traditional methods agree, but they also find systems for which both methods strongly disagree and more investigation on the subject of FUV extinction curves relevant for CTTSs is needed.
4.5 Disk dispersal
Primordial gas disks are known to dissipate on timescales of Myr, at which point mass accretion onto the central star halts Fedele et al. (2010). At some time in the evolution of protoplanetary disks thermal winds carry away more mass than is transported inwards, which leads to the dispersal of the disk from the inside-out Alexander et al. (2006). Inner gas disks may survive longer than the typical Myr lifetime of inner dust disks (e.g., Salyk et al. (2009); France et al. (2012a)). The detailed physical process that clears the inner disk are not yet established. Among the proposed mechanisms are photoevaporation Alexander et al. (2006); Gorti and Hollenbach (2009) and dynamical clearing by exoplanetary systems Dodson-Robinson and Salyk (2011), possibly aided by the magnetorotational instability Chiang and Murray-Clay (2007).
Models that simultaneously treat FUV, EUV, and X-ray irradiation from the central star have shown that the FUV illumination can control the total evaporation rate (and hence the disk lifetime) by driving the heating at intermediate (au) and large radii (au, Gorti and Hollenbach (2009)). FUV radiation also controls the gas temperature at the base of the evaporative flows through the generation of photoelectrons released by FUV-illuminated dust grains. Grain-growth and dust settling during the first stages of the planet formation process enable deeper penetration of the FUV radiation.
UV photons not only regulate disk dispersal, but are also powerful diagnostics thereof. For example, UV-H2 emission is sensitive to gas surface densities lower than g cm-2 France et al. (2012), making them an extremely useful probe of remnant gas during the late stages of disk dispersal. Hoadley et al. (2015) study the radial distribution of the UV-H2 using kinematic modelling of the H2 profiles. In particular, these authors compare the radial distributions of full and transitional disks (Fig. 10) finding that the distribution in transitional disks is shifted towards larger radii. The H2 and CO gas populations decline with dust disk dissipation Banzatti and Pontoppidan (2015); Hoadley et al. (2017), but the H2 depletion lags behind the CO for disks with large inner dust cavities Arulanantham et al. (2018).
5 Jets and outflows
CTTSs, and their younger siblings, the class 0 and I sources, drive outflows and jets (collimated ouflows, see Frank et al. (2014) for a recent review). The origin of the various outflow components is not clear and different parts of the young stellar system may contribute with varying fractions depending on the actual tracer (Fig. 2). Specifically, the star itself may drive a stellar wind Zanni and Ferreira (2013), the region (magnetically) connecting the star and the disk may eject a so-called X-wind Shu et al. (1994), and the disk itself may launch a disk wind Blandford and Payne (1982).
Outflows and jets are traditionally studied in forbidden emission lines tracing thin ( in units of cm-3) plasma with temperatures around K and spectacular jet images exist, which show beautiful phenomena such as bow shocks, wiggling, and precession (e.g., Raga et al. (2015)). The jet emission is usually concentrated in so-called knots where the jet material has been shock heated and is now seen in emission lines. These knots move along the jet axis away from the driving source. Cooler jet components are seen as molecular emission lines, which can be studied at radio-frequencies even for highly embedded sources Loinard et al. (2013); Güdel et al. (2018). In recent years, the observing window for jet studies opened significantly and now spans from the highest photon energies in the X-ray regime (Pravdo et al., 2001; Güdel et al., 2008; Schneider et al., 2011) down to m-wavelength radiation (Ainsworth et al., 2014).
Despite this large arsenal of observing opportunities, FUV observations of jets are highly powerful, because they allow us to measure (a) the molecular content through H2 emission lines ( K) and (b) kinematically resolve the hot jet in high excitation lines like C iv ( K) with very high angular resolution below 0.1 arcsec (Schneider et al., 2013). Often, there is indirect evidence for an outflow component in, e.g., C iv. Dupree et al. (2005) suggest that a hot ( K) wind exists in TW Hya based on a roughly P Cygni-like asymmetry observed in hot lines like C iii, C iv, and O vi. The absorption extends out to blue-shifted velocities of up to 400 km s-1 and Dupree et al. (2005) estimate that a mass-loss rate of roughly 10 % of the accretion rate may be sufficient to cause the observed absorption signals. This interpretation, however, heavily relies on the assumption that the intrinsic line profiles are symmetric and that the asymmetry is indeed caused by absorption. Johns-Krull (2007) dispute this assumption and show that other features in the line profiles that would be expected in a hot wind scenario are not present. They suggest that there is no indication for absorption by a hot wind in TW Hya, only for absorption in low ionization lines by a comparably cold wind is seen.
While these arguments address a hot stellar wind, jet emission in C iv is directly observed and there is often also indirect evidence for such a hot jet, e.g., strong emission seen in IUE data but not in smaller aperture HST data or the hot lines exhibit a similar kinematic morphology as forbidden lines that trace the jet rather than accretion. Studies using long-slit data were initiated based on these indirect indications.
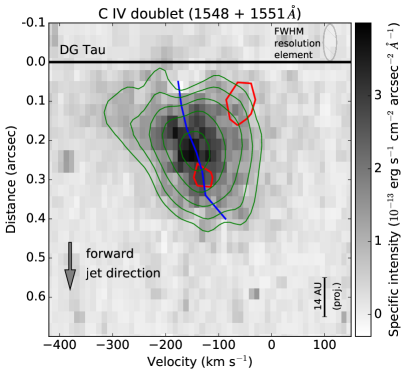
It was found that the jet’s C iv emission is typically observed to be offset from the star along the forward facing (approaching) jet by tens of au (see Fig. 11). Since C iv and X-ray emission spatially overlap, it is natural to assume that they probe the same jet component Schneider et al. (2013). The mass-loss associated with the C iv emission is somewhere between total mass-loss and the mass-loss related to the X-ray emission Skinner et al. (2018).
Both, the X-ray and the C iv were not predicted by models and there is no consensus on their origin. There are, however, a number of observational constraints that set these jet features apart from the well known optical jet. First, the C iv and X-ray emission are stationary so that heating by the same shocks that cause the optical knots is unlikely (Schneider and Schmitt, 2008). Second, adiabatic cooling would have lowered the temperature of outflowing material with any reasonable initial temperature (K) below C iv emitting temperatures so that local heating is required to power the C iv and X-ray emission at the measured distance of tens of au. Third, the velocity of the C iv emission is comparable to that of the bulk of the optical jet but spatially offset indicating a different heating mechanism than shocks. Schneider et al. (2013) speculate that magnetic heating similar to processes in the stellar coronae may be responsible for the C iv and X-ray emission. In addition, a velocity just slightly higher than the optical jet suggests that this outflow originates in the inner disk region, i.e., extends the jet’s onion-like velocity structure to the innermost regions very close to the star where stellar and disk magnetic fields interact. C iv from protostellar jets may therefore be a powerful probe of the magnetic field in a accretion funnel region.
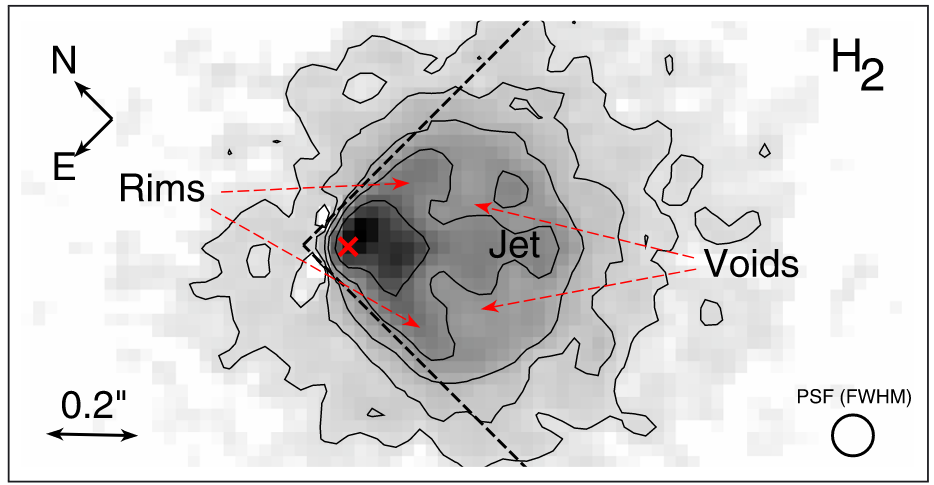
In addition to the very hot jet, FUV observations also trace the jet’s molecular hydrogen emission (Walter et al., 2003; Schneider et al., 2013). This UV-H2 emission is caused by the very same processes that cause UV-H2 disk emission (cf. sect. 4.1), i.e., fluorescent emission pumped by Ly photons. The wide-angle structure seen in UV-H2 (Fig. 11 right) appears stationary and agrees very well with the spatial morphology of the H2 emission seen in the NIR with AO-equipped IFUs Agra-Amboage et al. (2014). The molecular outflow appears stationary in time contrasting the moving knots seen in optical data of protostellar jets. Thus, the UV- likely arises in a wind region heated by ambipolar diffusion with subsequent pumping by stellar Ly photons and likely traces probably the outermost regions of the MHD wind Schneider et al. (2013).
6 Variability
In the previous sections, we described how FUV emission can originate from chromospheric activity, from accretion, and from outflows or jets. All of these sources are variable, just on different time scales. Given the general sparsity of FUV observations (since space-based instrumentation is required) and the fact that, compared with other wavebands, relatively low column densities of intervening material absorb nearly all intrinsic signal, variability in the FUV band is not well-studied.
One characteristic time scale in stars is the rotation period. Active regions or accretion spots rotate in and out of view. This accounts partially for observed changes in the accretion rate with time Costigan et al. (2014). Early IUE monitoring of DI Cep and BP Tau shows that this holds true in the UV. FUV line fluxes in DI Cep associated with the accretion hot spot change over the course of a rotational cycle and additionally line and continuum fluxes change as the accretion rate changes when comparing spectra taken more than a decade apart. These changes are correlated with the band magnitude Gómez de Castro and Fernández (1996). Similarly, in BP Tau emission lines that are formed through recombination, i.e. in the accretion shock, such as O i and He ii vary with stellar phase, while lines that can be formed both in the accretion shock and in the transition region, such as the C iv doublet at 1548 and 1550 Å, show less pronounced phase variation Gómez de Castro and Franqueira (1997); Ismailov et al. (2010). In a more recent observation of GM Aur model fits allow to disentangle accretion rate and spot area, indicating that, at least on this star, it is in fact the density of the accretion stream, that changes, not the size of the shock Ingleby et al. (2015).
It is worth noting that the shock is also invoked as the source of soft X-ray emission Lamzin et al. (2004); Kastner et al. (2002); Brickhouse et al. (2010), yet X-ray and FUV flux appear uncorrelated Espaillat et al. (2019). This might be related to another key finding, namely that accretion rates derived from X-rays fall short of those derived from UV/optical tracers by an order of magnitude (Curran et al., 2011). Conceptually, the FUV and the soft X-rays should be the best tracers for the accretion rate, because both the FUV and the X-ray emission is produced very close to the accretion shock where the energy budget is dominated by the kinetic energy of the infalling mass. The X-ray emission is formed right after the material passes through the shock front. Models successfully reproduce line ratios in the spectrum Lamzin et al. (2004); Günther et al. (2007), although they do not describe the full temperature range of the shock accurately Brickhouse et al. (2010). The FUV emission is formed at the bottom of the accretion column and in the gas around it Calvet and Gullbring (1998); Robinson and Espaillat (2019) and yet, X-ray and FUV variability seem uncorrelated or even anti-correlated Schneider et al. (2018). This finding clearly points to a fundamental problem in our current understanding of the accretion shock.
What is the impact of this variability on the FUV emission from the disk? Section 4.2 discusses the 1600 Å bump, which is most likely due to emission from excited H2, i.e. it originates in the disk. In a sample of five CTTSs observed five times each with HST/STIS, the flux of this feature correlates with the accretion luminosity determined from the UV continuum Espaillat et al. (2019), but not with the X-ray flux. This is consistent with the idea that the H2 is excited by the stellar Ly emission.
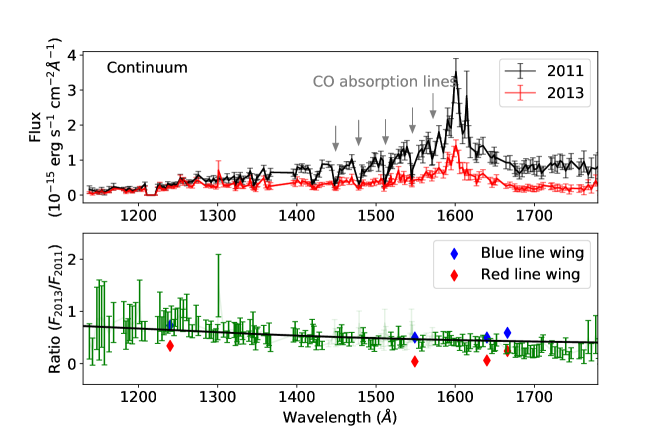
Another disk related feature that has a great impact on the FUV appearance of CTTSs are long-lasting dimming events such as the one observed for AA Tau (Bouvier et al., 2013). During such dimming events, the optical brightness of the system decreases by a few magnitudes for months to years, i.e., they are significantly dimmer for a longer time-period than typically observed. While the precise cause for the dimming is not clear, it is likely caused by changes in the inner disk structure, precisely the disk region traced by UV-H2 emission (see sect. 4.1). Therefore, comparison of the UV-H2 emission before and during a dimming event provides key information on the disk regions that take part in the dimming event. Schneider et al. (2015) find that the observed UV-H2 line profiles lack emission from regions within 2 au from the star while emission originating at larger radii is unaffected (also Hoadley et al., 2015). Furthermore, Schneider et al. (2015) find that the flux ratio between the dim and bright state cannot be explained by simply adding extra absorption for both, the continuum and the red line wings of hot ion lines (see Fig. 12). These authors suggest that scattering is the most plausible explanation, because other scenarios require uncomfortable fine-tuning, e.g., anomalous dust requires not only a very peculiar dust size distribution, but also an exchange of a precise fraction of dust obscuring the system during the bright state with a special dust column. Lastly, the blue line wings of hot ion lines are only weakly affected by the dimming suggesting that they have strong outflow/jet contributions already in the bright state. Such dimming events therefore provide unique information as the central star is hidden behind a natural coronograph. Unfortunately, these dimming events are rare and unpredictable so that following each new discovery would be highly valuable.
Young stars also exhibit much longer lasting and more consequential outbursts, where the disk structure changes dramatically and the accretion rate increases by several orders of magnitude. The longest and brightest of these outbursts are called “FU Ori outbursts”, and it can take decades or centuries until the accretion rate settles back to the previous, stable state (see review in Reipurth and Aspin (2010)). In FU Ori outbursts, the system is totally dominated by the accretion luminosity. The UV spectrum looks very different from a CTTS: It appears to be a superposition of a hot (9000 K), geometrically thick inner disk and a cooler outer component (5000 K), dominated by a dense forest of absorption lines from disk outflows Kenyon et al. (1989); Kravtsova et al. (2007).
In outflows and jets, we see temporal variability in the mass launching. In the jets, distinct emission regions, called “knots”, can be seen, which are either blobs of mass launched from the star over periods of years or shock fronts traveling along the slower moving material of the jet. One of the best examples of this in the FUV is the jet of HD 163296, a Herbig Ae star. This star shares many characteristics with CTTSs, but because it is more massive, and thus brighter, the accretion and jet features can be observed with comparably higher signal-to-noise ratios. Repeated observations of Ly emission in the jets shows that knots observed at one period faint away and new knots emerge from the source of the jet Devine et al. (2000); Günther et al. (2013). Similar observations have been made for CTTSs in other bands (e.g. in DG Tau four knots have been tracked for two decades in the optical, X-ray and radio Rodríguez et al. (2012)), so it is likely that a time-series of Ly images would show the flow of the knots along the jets in CTTSs, too, if they were observed with a sufficiently sensitive instrument.
7 Conclusions and Outlook
Young stars are strong UV emitters compared to their older siblings. This emission is mostly due to processes that are intrinsic to star formation, namely, protostellar mass accretion, enhanced stellar activity, and emission from surrounding disks and outflows. In addition, the UV radiation field controls the conditions in the planet forming region of protoplanetary disks and is thought to drive or contribute to the eventual dispersal of the disks. Therefore, UV observations are critical to painting the complete picture of star- and planet-formation.
In this review, we have discussed, first, that the chromospheric and transition region emission is particularly strong in CTTSs due to enhanced magnetic activity as young stars are generally fast rotators. Second, we showed that the accretion processes releases most of the energy in the UV range as continuum and Ly emission. Accretion also causes strong emission lines from hot ions (e.g. C iv), which provide detailed accretion kinematics not available in other wavelength ranges. Their study suggests that accretion funnels are not homogeneous structures but rather stratified in density so that optical depth effects are important and probably only a fraction of the accretion funnel is seen depending on inclination angle. Third, UV observations provide important, complementary diagnostics for the structure and evolution of protoplanetary disks and, fourth, jets and outflows are also seen in the UV regime where new observations revealed jet components not seen in traditional jet tracers, namely a hot, stationary jet component close to the central star. Fifth, young stars are highly variable and monitoring campaigns combining X-ray, UV, and optical data are beginning to disentangle how the individual features are causally related. Despite all this success, there is no theory that can self-consistently explain all features. The coming years will see increasingly sophisticated models, incorporating, e.g., a more detailed treatment of the radiative effects of the accretion funnel including the reprocessing of the primary X-ray photons.
While most of the contributions to the system’s FUV emission have now been identified, there are still potentially large uncertainties that need to be addressed by future observations. First, scattering may be important in more obscured sources or sources seen under high inclination angles Schneider et al. (2015); it is currently unknown how much scattering contributes to the observed UV spectrum of a CTTS. This is important, because the de-reddening corrections that apply to the central star may not apply to other FUV emission components. High sensitivity two-dimensional imaging spectroscopy (e.g., an IFU or MSA-enabled instrument) would allow us to simultaneously measure the inner disk region as a function of wavelength, spatial location, and velocity; allowing us to quantify the relative importance of scattering and the temporal variability of different disk components individually. Second, jets can contribute to the FUV emission and, because their emission is located close to the star, their emission can be mistaken as stellar; note that there are not necessarily kinematic signatures like highly blue-shifted emission as the blue- and red-shifted jet lobe may both emit resulting in a net velocity shift close to zero. Future high resolution imaging spectroscopy observations are needed to constrain the importance of scattering and jet emission in “typical” samples of CTTSs.
The next major step for understanding the UV emission of CTTSs will be the Hubble Space Telescope’s ULLYSES program. The ULLYSES program will dedicate 500 orbits to the study of low-mass star formation in the UV. ULLYSES will include a spectral atlas of 60 new sources and a dedicated, multi-wavelength monitoring program for high-priority targets. On intermediate time scales, however, neither ESA nor NASA are committed to build a space mission with dedicated UV instrumentation within the next decade. The Russian Spektr-UV mission may be the next dedicated UV mission and is currently scheduled to launch in the mid-2020s. With a 1.7 m mirror, it will be somewhat comparable to HST; also in it’s spectroscopic and imaging capabilities (low- and high-resolution UV spectroscopy). The next opportunity to launch a large space mission with sensitive UV spectroscopic capabilities may be the LUVOIR mission concept (France et al., 2017; The LUVOIR Team, 2018), to be launched in the late 2030s. In fact, LUVOIR’s science goals specifically include the questions of low-mass star formation that we discussed in the review.
writing–review and editing, P.C.S., H.M.G, K.F.; visualization, P.C.S.
This research was funded by DLR grant number 50 OR 1907. K.F. acknowledges support for this work from HST GO programs 14604, 14703, and 15070. The authors also express their gratitude to N. Arulanantham for providing information on the H2 emission properties of CTTSs.
The authors declare no conflict of interest.
no
References
yes
References
- Imhoff (1977) Imhoff, C.L. An historical perspective. In search of the T tauri stars. Astronomy Quarterly 1977, 1, 213–238. doi:\changeurlcolorblack10.1016/S0364-9229(77)80009-2.
- Joy (1945) Joy, A.H. T Tauri Variable Stars. ApJ 1945, 102, 168. doi:\changeurlcolorblack10.1086/144749.
- Greenstein (1950) Greenstein, J.L. A Possible Energy Source for T Tauri Stars. PASP 1950, 62, 156. doi:\changeurlcolorblack10.1086/126264.
- Henyey et al. (1955) Henyey, L.G.; Lelevier, R.; Levée, R.D. The Early Phases of Stellar Evolution. PASP 1955, 67, 154. doi:\changeurlcolorblack10.1086/126791.
- Ambartsumian (1954) Ambartsumian, V.A. On the Origin of Stars. Liege International Astrophysical Colloquia, 1954, Vol. 5, p. 293.
- Walker (1956) Walker, M.F. Studies of extremely young clusters. I. NGC 2264. ApJ 1956, 124, 668–668.
- Magazzu et al. (1992) Magazzu, A.; Rebolo, R.; Pavlenko, I.V. Lithium Abundances in Classical and Weak T Tauri Stars. ApJ 1992, 392, 159. doi:\changeurlcolorblack10.1086/171414.
- Pinsonneault (1997) Pinsonneault, M. Mixing in Stars. ARA&A 1997, 35, 557–605. doi:\changeurlcolorblack10.1146/annurev.astro.35.1.557.
- Kuhi (1974) Kuhi, L.V. Spectral energy distributions of T Tauri stars. A&As 1974, 15, 47–89.
- Strom et al. (1975) Strom, S.E.; Strom, K.M.; Grasdalen, G.L. Young stellar objects and dark interstellar clouds. ARA&A 1975, 13, 187–216. doi:\changeurlcolorblack10.1146/annurev.aa.13.090175.001155.
- Kuhi (1966) Kuhi, L.V. Ultraviolet Continuous Emission in T Tauri Stars. PASP 1966, 78, 430. doi:\changeurlcolorblack10.1086/128380.
- Kuhi (1968) Kuhi, L.V. Optical Observations of Very Young Stars. Interstellar Ionized hydrogen Proceedings of the Symposium on HII; Terzian, Y., Ed., 1968, p. 13.
- Cram (1979) Cram, L.E. Atmospheres of T Tau stars : the photosphere and low chromosphere. ApJ 1979, 234, 949–957. doi:\changeurlcolorblack10.1086/157578.
- Dumont et al. (1973) Dumont, S.; Heidmann, N.; Kuhi, L.V.; Thomas, R.N. Chromospheres of T Tauri-type stars. A&A 1973, 29, 199.
- Brown et al. (1984) Brown, A.; de M. Ferraz, M.C.; Jordan, C. The chromosphere and corona of T Tauri. MNRAS 1984, 207, 831–859. doi:\changeurlcolorblack10.1093/mnras/207.4.831.
- Calvet et al. (1984) Calvet, N.; Basri, G.; Kuhi, L.V. The chromospheric hypothesis for the T Tauri phenomenon. ApJ 1984, 277, 725–737. doi:\changeurlcolorblack10.1086/161744.
- Walker (1963) Walker, M.F. A Possible Interpretation of the Ultraviolet Excess Stars. AJ 1963, 68, 298. doi:\changeurlcolorblack10.1086/109056.
- Kuhi (1964) Kuhi, L.V. Mass Loss from T Tauri Stars. ApJ 1964, 140, 1409. doi:\changeurlcolorblack10.1086/148047.
- Larson (1973) Larson, R.B. Processes in Collapsing Interstellar Clouds. ARA&A 1973, 11, 219. doi:\changeurlcolorblack10.1146/annurev.aa.11.090173.001251.
- Walker (1972) Walker, M.F. Studies of Extremely Young Clusters.VI. Spectroscopic Observations of the Ultraviolet-Excess Stars in the Orion Nebula Cluster and NGC 2264. ApJ 1972, 175, 89. doi:\changeurlcolorblack10.1086/151540.
- Cohen and Kuhi (1979) Cohen, M.; Kuhi, L.V. Observational studies of pre-main-sequence evolution. ApJs 1979, 41, 743–843. doi:\changeurlcolorblack10.1086/190641.
- Dullemond and Monnier (2010) Dullemond, C.P.; Monnier, J.D. The Inner Regions of Protoplanetary Disks. ARA&A 2010, 48, 205–239, [arXiv:astro-ph.SR/1006.3485]. doi:\changeurlcolorblack10.1146/annurev-astro-081309-130932.
- Williams and Cieza (2011) Williams, J.P.; Cieza, L.A. Protoplanetary Disks and Their Evolution. ARA&A 2011, 49, 67–117, [arXiv:astro-ph.GA/1103.0556]. doi:\changeurlcolorblack10.1146/annurev-astro-081710-102548.
- Lynden-Bell and Pringle (1974) Lynden-Bell, D.; Pringle, J.E. The evolution of viscous discs and the origin of the nebular variables. MNRAS 1974, 168, 603–637. doi:\changeurlcolorblack10.1093/mnras/168.3.603.
- Shakura and Sunyaev (1973) Shakura, N.I.; Sunyaev, R.A. Reprint of 1973A&A….24..337S. Black holes in binary systems. Observational appearance. A&A 1973, 500, 33–51.
- Ulrich (1976) Ulrich, R.K. An infall model for the T Tauri phenomenon. ApJ 1976, 210, 377–391. doi:\changeurlcolorblack10.1086/154840.
- Bertout (2007) Bertout, C. The accretion disk paradigm for young stars. Star-Disk Interaction in Young Stars; Bouvier, J.; Appenzeller, I., Eds., 2007, Vol. 243, IAU Symposium, pp. 1–12. doi:\changeurlcolorblack10.1017/S1743921307009362.
- Imhoff and Giampapa (1980) Imhoff, C.L.; Giampapa, M.S. The ultraviolet spectrum of the T Tau star RW Aur. ApJl 1980, 239, L115–L119. doi:\changeurlcolorblack10.1086/183305.
- Appenzeller and Wolf (1979) Appenzeller, I.; Wolf, B. The satellite-UV spectrum of S CrA. A&A 1979, 75, 164–169.
- Herczeg et al. (2002) Herczeg, G.J.; Linsky, J.L.; Valenti, J.A.; Johns-Krull, C.M.; Wood, B.E. The Far-Ultraviolet Spectrum of TW Hydrae. I. Observations of H2 Fluorescence. ApJ 2002, 572, 310–325, [arXiv:astro-ph/astro-ph/0201319]. doi:\changeurlcolorblack10.1086/339731.
- Schindhelm et al. (2012) Schindhelm, E.; France, K.; Herczeg, G.J.; Bergin, E.; Yang, H.; Brown, A.; Brown, J.M.; Linsky, J.L.; Valenti, J. Ly Dominance of the Classical T Tauri Far-ultraviolet Radiation Field. ApJl 2012, 756, L23, [arXiv:astro-ph.SR/1208.2271]. doi:\changeurlcolorblack10.1088/2041-8205/756/1/L23.
- France et al. (2011) France, K.; Schindhelm, E.; Burgh, E.B.; Herczeg, G.J.; Harper, G.M.; Brown, A.; Green, J.C.; Linsky, J.L.; Yang, H.; Abgrall, H.; Ardila, D.R.; Bergin, E.; Bethell, T.; Brown, J.M.; Calvet, N.; Espaillat, C.; Gregory, S.G.; Hillenbrand , L.A.; Hussain, G.; Ingleby, L.; Johns-Krull, C.M.; Roueff, E.; Valenti, J.A.; Walter, F.M. The Far-ultraviolet “Continuum” in Protoplanetary Disk Systems. II. Carbon Monoxide Fourth Positive Emission and Absorption. ApJ 2011, 734, 31, [arXiv:astro-ph.EP/1104.0670]. doi:\changeurlcolorblack10.1088/0004-637X/734/1/31.
- Schneider et al. (2013) Schneider, P.C.; Eislöffel, J.; Güdel, M.; Günther, H.M.; Herczeg, G.; Robrade, J.; Schmitt, J.H.M.M. HST FUV C iv observations of the hot DG Tauri jet. A&A 2013, 550, L1, [arXiv:astro-ph.SR/1212.6363]. doi:\changeurlcolorblack10.1051/0004-6361/201118592.
- van Duinen et al. (1975) van Duinen, R.J.; Aalders, J.W.G.; Wesselius, P.R.; Wildeman, K.J.; Wu, C.C.; Luinge, W.; Snel, D. The ultraviolet experiment onboard the Astronomical Netherlands Satellite - ANS. A&A 1975, 39, 159–163.
- de Boer (1977) de Boer, K.S. Far-UV observations of T Tau-like stars. A&A 1977, 61, 605–608.
- France et al. (2017) France, K.; Roueff, E.; Abgrall, H. The 1600 Å Emission Bump in Protoplanetary Disks: A Spectral Signature of H2O Dissociation. ApJ 2017, 844, 169, [arXiv:astro-ph.SR/1706.09940]. doi:\changeurlcolorblack10.3847/1538-4357/aa7cee.
- Boggess et al. (1978) Boggess, A.; Carr, F.A.; Evans, D.C.; Fischel, D.; Freeman, H.R.; Fuechsel, C.F.; Klinglesmith, D.A.; Krueger, V.L.; Longanecker, G.W.; Moore, J.V. The IUE spacecraft and instrumentation. Nature 1978, 275, 372–377. doi:\changeurlcolorblack10.1038/275372a0.
- Gahm et al. (1979) Gahm, G.F.; Fredga, K.; Liseau, R.; Dravins, D. The far-UV spectrum of the T Tauri star RU Lupi. A&A 1979, 73, L4–L6.
- Bouvier et al. (1986) Bouvier, J.; Bertout, C.; Benz, W.; Mayor, M. Rotation in T Tauri stars. I. Obervations and immediate analysis. A&A 1986, 165, 110–119.
- Bouvier et al. (1993) Bouvier, J.; Cabrit, S.; Fernandez, M.; Martin, E.L.; Matthews, J.M. COYOTES I : the photometric variability and rotational evolution of T Tauri stars. A&A 1993, 272, 176–206.
- Herbst et al. (2007) Herbst, W.; Eislöffel, J.; Mundt, R.; Scholz, A. The Rotation of Young Low-Mass Stars and Brown Dwarfs. Protostars and Planets V; Reipurth, B.; Jewitt, D.; Keil, K., Eds., 2007, p. 297, [arXiv:astro-ph/astro-ph/0603673].
- Bouvier et al. (2014) Bouvier, J.; Matt, S.P.; Mohanty, S.; Scholz, A.; Stassun, K.G.; Zanni, C. Angular Momentum Evolution of Young Low-Mass Stars and Brown Dwarfs: Observations and Theory. Protostars and Planets VI; Beuther, H.; Klessen, R.S.; Dullemond, C.P.; Henning, T., Eds., 2014, p. 433, [arXiv:astro-ph.SR/1309.7851]. doi:\changeurlcolorblack10.2458/azu_uapress_9780816531240-ch019.
- Gregory et al. (2010) Gregory, S.G.; Jardine, M.; Gray, C.G.; Donati, J.F. The magnetic fields of forming solar-like stars. Reports on Progress in Physics 2010, 73, 126901, [arXiv:astro-ph.SR/1008.1883]. doi:\changeurlcolorblack10.1088/0034-4885/73/12/126901.
- Houdebine et al. (1996) Houdebine, E.R.; Mathioudakis, M.; Doyle, J.G.; Foing, B.H. Observation and modelling of main sequence star chromospheres. V. Ultraviolet excess emission in active M dwarfs. A&A 1996, 305, 209.
- Feigelson and Montmerle (1999) Feigelson, E.D.; Montmerle, T. High-Energy Processes in Young Stellar Objects. ARA&A 1999, 37, 363–408. doi:\changeurlcolorblack10.1146/annurev.astro.37.1.363.
- Walter (1987) Walter, F.M. The naked T Tauri stars : the low-mass pre-main sequence unveiled. PASP 1987, 99, 31–37. doi:\changeurlcolorblack10.1086/131952.
- Ingleby et al. (2011) Ingleby, L.; Calvet, N.; Bergin, E.; Herczeg, G.; Brown, A.; Alexander, R.; Edwards, S.; Espaillat, C.; France, K.; Gregory, S.G.; Hillenbrand, L.; Roueff, E.; Valenti, J.; Walter, F.; Johns-Krull, C.; Brown, J.; Linsky, J.; McClure, M.; Ardila, D.; Abgrall, H.; Bethell, T.; Hussain, G.; Yang, H. Near-ultraviolet Excess in Slowly Accreting T Tauri Stars: Limits Imposed by Chromospheric Emission. ApJ 2011, 743, 105, [arXiv:astro-ph.SR/1110.6312]. doi:\changeurlcolorblack10.1088/0004-637X/743/2/105.
- Costa et al. (2000) Costa, V.M.; Lago, M.T.V.T.; Norci, L.; Meurs, E.J.A. T Tauri stars: The UV/X-ray connection. A&A 2000, 354, 621–635.
- Findeisen et al. (2011) Findeisen, K.; Hillenbrand, L.; Soderblom, D. Stellar Activity in the Broadband Ultraviolet. AJ 2011, 142, 23, [arXiv:astro-ph.SR/1105.1377]. doi:\changeurlcolorblack10.1088/0004-6256/142/1/23.
- Johns-Krull (2007) Johns-Krull, C.M. The Magnetic Fields of Classical T Tauri Stars. ApJ 2007, 664, 975–985, [arXiv:astro-ph/0704.2923]. doi:\changeurlcolorblack10.1086/519017.
- Koenigl (1991) Koenigl, A. Disk Accretion onto Magnetic T Tauri Stars. ApJl 1991, 370, L39. doi:\changeurlcolorblack10.1086/185972.
- Calvet and Gullbring (1998) Calvet, N.; Gullbring, E. The Structure and Emission of the Accretion Shock in T Tauri Stars. ApJ 1998, 509, 802–818. doi:\changeurlcolorblack10.1086/306527.
- Schneider et al. (2017) Schneider, P.C.; Günther, H.M.; Robrade, J. Stellar X-ray accretion signatures. Astronomische Nachrichten 2017, 338, 201–206. doi:\changeurlcolorblack10.1002/asna.201713331.
- Hartmann et al. (2016) Hartmann, L.; Herczeg, G.; Calvet, N. Accretion onto Pre-Main-Sequence Stars. ARA&A 2016, 54, 135–180. doi:\changeurlcolorblack10.1146/annurev-astro-081915-023347.
- Simon et al. (1990) Simon, T.; Vrba, F.J.; Herbst, W. The Ultraviolet and Visible Light Variability of BP Tauri: Possible Clues for the Origin of T Tauri Star Activity. AJ 1990, 100, 1957. doi:\changeurlcolorblack10.1086/115651.
- Gómez de Castro and Fernández (1996) Gómez de Castro, A.I.; Fernández, M. Ultraviolet spectroscopy of the hotspot in the classical T Tauri star DI Cep: observational indications of magnetically channelled accretion. MNRAS 1996, 283, 55–65. doi:\changeurlcolorblack10.1093/mnras/283.1.55.
- Gómez de Castro and Franqueira (1997) Gómez de Castro, A.I.; Franqueira, M. Accretion and UV Variability in BP Tauri. ApJ 1997, 482, 465–469. doi:\changeurlcolorblack10.1086/304149.
- Johns-Krull et al. (2000) Johns-Krull, C.M.; Valenti, J.A.; Linsky, J.L. An IUE Atlas of Pre-Main-Sequence Stars. II. Far-Ultraviolet Accretion Diagnostics in T Tauri Stars. ApJ 2000, 539, 815–833. doi:\changeurlcolorblack10.1086/309259.
- Calvet et al. (1996) Calvet, N.; Hartmann, L.; Hewett, R.; Valenti, J.A.; Basri, G.; Walter, F. C IV in classical T Tauri stars. Cool Stars, Stellar Systems, and the Sun; Pallavicini, R.; Dupree, A.K., Eds., 1996, Vol. 109, Astronomical Society of the Pacific Conference Series, p. 419.
- Valenti et al. (1993) Valenti, J.A.; Basri, G.; Walter, F.; Hartmann, L.; Calvet, N. GHRS Profiles of Hot UV Lines in T Tauri Stars. American Astronomical Society Meeting Abstracts, 1993, Vol. 183, p. 40.07.
- Yang et al. (2012) Yang, H.; Herczeg, G.J.; Linsky, J.L.; Brown, A.; Johns-Krull, C.M.; Ingleby, L.; Calvet, N.; Bergin, E.; Valenti, J.A. A Far-ultraviolet Atlas of Low-resolution Hubble Space Telescope Spectra of T Tauri Stars. ApJ 2012, 744, 121, [arXiv:astro-ph.SR/1205.4789]. doi:\changeurlcolorblack10.1088/0004-637X/744/2/121.
- Muzerolle et al. (1998) Muzerolle, J.; Calvet, N.; Hartmann, L. Magnetospheric Accretion Models for the Hydrogen Emission Lines of T Tauri Stars. ApJ 1998, 492, 743–753. doi:\changeurlcolorblack10.1086/305069.
- Kwan and Fischer (2011) Kwan, J.; Fischer, W. Origins of the H, He I and Ca II line emission in classical T Tauri stars. MNRAS 2011, 411, 2383–2425, [arXiv:astro-ph.SR/1010.3265]. doi:\changeurlcolorblack10.1111/j.1365-2966.2010.17863.x.
- Ardila et al. (2013) Ardila, D.R.; Herczeg, G.J.; Gregory, S.G.; Ingleby, L.; France, K.; Brown, A.; Edwards, S.; Johns-Krull, C.; Linsky, J.L.; Yang, H.; Valenti, J.A.; Abgrall, H.; Alexander, R.D.; Bergin, E.; Bethell, T.; Brown, J.M.; Calvet, N.; Espaillat, C.; Hillenbrand, L.A.; Hussain, G.; Roueff, E.; Schindhelm, E.R.; Walter, F.M. Hot Gas Lines in T Tauri Stars. ApJs 2013, 207, 1, [arXiv:astro-ph.SR/1304.3746]. doi:\changeurlcolorblack10.1088/0067-0049/207/1/1.
- Lamzin (1998) Lamzin, S.A. The structure of shock waves in the case of accretion onto low-mass young stars. Astronomy Reports 1998, 42, 322–335, [arXiv:astro-ph.SR/1303.4066].
- Ardila et al. (2002) Ardila, D.R.; Basri, G.; Walter, F.M.; Valenti, J.A.; Johns-Krull, C.M. Observations of T Tauri Stars using Hubble Space Telescope GHRS. I. Far-Ultraviolet Emission Lines. ApJ 2002, 566, 1100–1123, [arXiv:astro-ph/astro-ph/0110436]. doi:\changeurlcolorblack10.1086/338223.
- Günther and Schmitt (2008) Günther, H.M.; Schmitt, J.H.M.M. Where are the hot ion lines in classical T Tauri stars formed? A&A 2008, 481, 735–745, [arXiv:astro-ph/0801.2273]. doi:\changeurlcolorblack10.1051/0004-6361:20078674.
- Herczeg et al. (2005) Herczeg, G.J.; Walter, F.M.; Linsky, J.L.; Gahm, G.F.; Ardila, D.R.; Brown, A.; Johns-Krull, C.M.; Simon, M.; Valenti, J.A. The Loopy Ultraviolet Line Profiles of RU Lupi: Accretion, Outflows, and Fluorescence. AJ 2005, 129, 2777–2791, [arXiv:astro-ph/astro-ph/0504654]. doi:\changeurlcolorblack10.1086/430075.
- Lamzin (2000) Lamzin, S.A. Intercombinational Line Profiles in the UV Spectra of T Tauri Stars and Analysis of the Accretion Zone. Astronomy Reports 2000, 44, 323–333. doi:\changeurlcolorblack10.1134/1.163855.
- Ingleby et al. (2013) Ingleby, L.; Calvet, N.; Herczeg, G.; Blaty, A.; Walter, F.; Ardila, D.; Alexand er, R.; Edwards, S.; Espaillat, C.; Gregory, S.G.; Hillenbrand, L.; Brown, A. Accretion Rates for T Tauri Stars Using Nearly Simultaneous Ultraviolet and Optical Spectra. ApJ 2013, 767, 112, [arXiv:astro-ph.SR/1303.0769]. doi:\changeurlcolorblack10.1088/0004-637X/767/2/112.
- Robinson and Espaillat (2019) Robinson, C.E.; Espaillat, C.C. Multiepoch Ultraviolet HST Observations of Accreting Low-mass Stars. ApJ 2019, 874, 129, [arXiv:astro-ph.SR/1903.01987]. doi:\changeurlcolorblack10.3847/1538-4357/ab0d8d.
- Gomez de Castro and Lamzin (1999) Gomez de Castro, A.I.; Lamzin, S.A. Accretion shocks in T Tauri stars: diagnosis via semiforbidden ultraviolet line ratios. MNRAS 1999, 304, L41–L45. doi:\changeurlcolorblack10.1046/j.1365-8711.1999.02545.x.
- Matsakos et al. (2013) Matsakos, T.; Chièze, J.P.; Stehlé, C.; González, M.; Ibgui, L.; de Sá, L.; Lanz, T.; Orlando, S.; Bonito, R.; Argiroffi, C.; Reale, F.; Peres, G. YSO accretion shocks: magnetic, chromospheric or stochastic flow effects can suppress fluctuations of X-ray emission. A&A 2013, 557, A69, [arXiv:astro-ph.SR/1307.5389]. doi:\changeurlcolorblack10.1051/0004-6361/201321820.
- Colombo et al. (2016) Colombo, S.; Orlando, S.; Peres, G.; Argiroffi, C.; Reale, F. Impacts of fragmented accretion streams onto classical T Tauri stars: UV and X-ray emission lines. A&A 2016, 594, A93, [arXiv:astro-ph.SR/1607.03009]. doi:\changeurlcolorblack10.1051/0004-6361/201628858.
- Schneider et al. (2018) Schneider, P.C.; Günther, H.M.; Robrade, J.; Schmitt, J.H.M.M.; Güdel, M. Multiepoch, multiwavelength study of accretion onto T Tauri. X-ray versus optical and UV accretion tracers. A&A 2018, 618, A55, [arXiv:astro-ph.SR/1806.06788]. doi:\changeurlcolorblack10.1051/0004-6361/201731613.
- Andrews et al. (2018) Andrews, S.M.; Huang, J.; Pérez, L.M.; Isella, A.; Dullemond, C.P.; Kurtovic, N.T.; Guzmán, V.V.; Carpenter, J.M.; Wilner, D.J.; Zhang, S.; Zhu, Z.; Birnstiel, T.; Bai, X.N.; Benisty, M.; Hughes, A.M.; Öberg, K.I.; Ricci, L. ALMA Observations of the Epoch of Planet Formation. The Messenger 2018, 174, 19–23. doi:\changeurlcolorblack10.18727/0722-6691/5108.
- Bary et al. (2008) Bary, J.S.; Weintraub, D.A.; Shukla, S.J.; Leisenring, J.M.; Kastner, J.H. Quiescent H2 Emission From Pre-Main-Sequence Stars in Chamaeleon I. ApJ 2008, 678, 1088–1098, [arXiv:astro-ph/0801.2765]. doi:\changeurlcolorblack10.1086/529517.
- Bitner et al. (2008) Bitner, M.A.; Richter, M.J.; Lacy, J.H.; Herczeg, G.J.; Greathouse, T.K.; Jaffe, D.T.; Salyk, C.; Blake, G.A.; Hollenbach, D.J.; Doppmann, G.W.; Najita, J.R.; Currie, T. The TEXES Survey for H2 Emission from Protoplanetary Disks. ApJ 2008, 688, 1326–1344, [arXiv:astro-ph/0808.1099]. doi:\changeurlcolorblack10.1086/592317.
- Miotello et al. (2014) Miotello, A.; Bruderer, S.; van Dishoeck, E.F. Protoplanetary disk masses from CO isotopologue line emission. A&A 2014, 572, A96, [arXiv:astro-ph.SR/1410.2093]. doi:\changeurlcolorblack10.1051/0004-6361/201424712.
- Abgrall et al. (1993a) Abgrall, H.; Roueff, E.; Launay, F.; Roncin, J.Y.; Subtil, J.L. Table of Lyman band system of molecular hydrogen. A&As 1993, 101, 273–321.
- Abgrall et al. (1993b) Abgrall, H.; Roueff, E.; Launay, F.; Roncin, J.Y.; Subtil, J.L. Table of the Werner band system of molecular hydrogen. A&As 1993, 101, 323–362.
- Herczeg et al. (2004) Herczeg, G.J.; Wood, B.E.; Linsky, J.L.; Valenti, J.A.; Johns-Krull, C.M. The Far-Ultraviolet Spectra of TW Hydrae. II. Models of H2 Fluorescence in a Disk. ApJ 2004, 607, 369–383, [arXiv:astro-ph/astro-ph/0402238]. doi:\changeurlcolorblack10.1086/383340.
- France et al. (2012) France, K.; Schindhelm, E.; Herczeg, G.J.; Brown, A.; Abgrall, H.; Alexand er, R.D.; Bergin, E.A.; Brown, J.M.; Linsky, J.L.; Roueff, E.; Yang, H. A Hubble Space Telescope Survey of H2 Emission in the Circumstellar Environments of Young Stars. ApJ 2012, 756, 171, [arXiv:astro-ph.SR/1207.4789]. doi:\changeurlcolorblack10.1088/0004-637X/756/2/171.
- Hoadley et al. (2015) Hoadley, K.; France, K.; Alexander, R.D.; McJunkin, M.; Schneider, P.C. The Evolution of Inner Disk Gas in Transition Disks. ApJ 2015, 812, 41, [arXiv:astro-ph.SR/1509.02172]. doi:\changeurlcolorblack10.1088/0004-637X/812/1/41.
- Ádámkovics et al. (2016) Ádámkovics, M.; Najita, J.R.; Glassgold, A.E. FUV Irradiated Disk Atmospheres: Ly and the Origin of Hot H2 Emission. ApJ 2016, 817, 82, [arXiv:astro-ph.SR/1512.04425]. doi:\changeurlcolorblack10.3847/0004-637X/817/1/82.
- France et al. (2012a) France, K.; Beasley, M.; Ardila, D.R.; Bergin, E.A.; Brown, A.; Burgh, E.B.; Calvet, N.; Chiang, E.; Cook, T.A.; Désert, J.M.; Ebbets, D.; Froning, C.S.; Green, J.C.; Hillenbrand , L.A.; Johns-Krull, C.M.; Koskinen, T.T.; Linsky, J.L.; Redfield, S.; Roberge, A.; Schindhelm, E.R.; Scowen, P.A.; Stapelfeldt, K.R.; Tumlinson, J. From Protoplanetary Disks to Extrasolar Planets: Understanding the Life Cycle of Circumstellar Gas with Ultraviolet Spectroscopy. arXiv e-prints 2012, p. arXiv:1208.2270, [arXiv:astro-ph.SR/1208.2270].
- France et al. (2012b) France, K.; Burgh, E.B.; Herczeg, G.J.; Schindhelm, E.; Yang, H.; Abgrall, H.; Roueff, E.; Brown, A.; Brown, J.M.; Linsky, J.L. CO and H2 Absorption in the AA Tauri Circumstellar Disk. ApJ 2012, 744, 22, [arXiv:astro-ph.SR/1109.1831]. doi:\changeurlcolorblack10.1088/0004-637X/744/1/22.
- Hoadley et al. (2017) Hoadley, K.; France, K.; Arulanantham, N.; Loyd, R.O.P.; Kruczek, N. Signatures of Hot Molecular Hydrogen Absorption from Protoplanetary Disks. I. Non-thermal Populations. ApJ 2017, 846, 6, [arXiv:astro-ph.SR/1707.03449]. doi:\changeurlcolorblack10.3847/1538-4357/aa7fc1.
- Schneider et al. (2015) Schneider, P.C.; France, K.; Günther, H.M.; Herczeg, G.; Robrade, J.; Bouvier, J.; McJunkin, M.; Schmitt, J.H.M.M. X-ray to NIR emission from AA Tauri during the dim state. Occultation of the inner disk and gas-to-dust ratio of the absorber. A&A 2015, 584, A51, [arXiv:astro-ph.SR/1509.05007]. doi:\changeurlcolorblack10.1051/0004-6361/201425583.
- Herczeg et al. (2006) Herczeg, G.J.; Linsky, J.L.; Walter, F.M.; Gahm, G.F.; Johns-Krull, C.M. The Origins of Fluorescent H2 Emission From T Tauri Stars. ApJs 2006, 165, 256–282, [arXiv:astro-ph/astro-ph/0602404]. doi:\changeurlcolorblack10.1086/503558.
- Salyk et al. (2009) Salyk, C.; Blake, G.A.; Boogert, A.C.A.; Brown, J.M. High-resolution 5 m Spectroscopy of Transitional Disks. ApJ 2009, 699, 330–347. doi:\changeurlcolorblack10.1088/0004-637X/699/1/330.
- Salyk et al. (2011) Salyk, C.; Blake, G.A.; Boogert, A.C.A.; Brown, J.M. CO Rovibrational Emission as a Probe of Inner Disk Structure. ApJ 2011, 743, 112, [arXiv:astro-ph.GA/1109.4579]. doi:\changeurlcolorblack10.1088/0004-637X/743/2/112.
- Brown et al. (2013) Brown, J.M.; Pontoppidan, K.M.; van Dishoeck, E.F.; Herczeg, G.J.; Blake, G.A.; Smette, A. VLT-CRIRES Survey of Rovibrational CO Emission from Protoplanetary Disks. ApJ 2013, 770, 94, [arXiv:astro-ph.SR/1304.4961]. doi:\changeurlcolorblack10.1088/0004-637X/770/2/94.
- Bergin et al. (2003) Bergin, E.; Calvet, N.; D’Alessio, P.; Herczeg, G.J. The Effects of UV Continuum and Ly Radiation on the Chemical Equilibrium of T Tauri Disks. ApJl 2003, 591, L159–L162, [arXiv:astro-ph/astro-ph/0305565]. doi:\changeurlcolorblack10.1086/377148.
- Ingleby et al. (2009) Ingleby, L.; Calvet, N.; Bergin, E.; Yerasi, A.; Espaillat, C.; Herczeg, G.; Roueff, E.; Abgrall, H.; Hernández, J.; Briceño, C.; Pascucci, I.; Miller, J.; Fogel, J.; Hartmann, L.; Meyer, M.; Carpenter, J.; Crockett, N.; McClure, M. Far-Ultraviolet H2 Emission from Circumstellar Disks. ApJl 2009, 703, L137–L141, [arXiv:astro-ph.SR/0909.0688]. doi:\changeurlcolorblack10.1088/0004-637X/703/2/L137.
- Espaillat et al. (2019) Espaillat, C.C.; Robinson, C.; Grant, S.; Reynolds, M. Using Multiwavelength Variability to Explore the Connection among X-Ray Emission, the Far-ultraviolet H2 Bump, and Accretion in T Tauri Stars. ApJ 2019, 876, 121, [arXiv:astro-ph.SR/1904.05458]. doi:\changeurlcolorblack10.3847/1538-4357/ab16e6.
- Burgh et al. (2007) Burgh, E.B.; France, K.; McCandliss, S.R. Direct Measurement of the Ratio of Carbon Monoxide to Molecular Hydrogen in the Diffuse Interstellar Medium. ApJ 2007, 658, 446–454, [arXiv:astro-ph/astro-ph/0611853]. doi:\changeurlcolorblack10.1086/511259.
- Feldman et al. (2000) Feldman, P.D.; Burgh, E.B.; Durrance, S.T.; Davidsen, A.F. Far-Ultraviolet Spectroscopy of Venus and Mars at 4 Å Resolution with the Hopkins Ultraviolet Telescope on Astro-2. ApJ 2000, 538, 395–400, [arXiv:astro-ph/astro-ph/0004024]. doi:\changeurlcolorblack10.1086/309125.
- McJunkin et al. (2013) McJunkin, M.; France, K.; Burgh, E.B.; Herczeg, G.J.; Schindhelm, E.; Brown, J.M.; Brown, A. Probing the Inner Regions of Protoplanetary Disks with CO Absorption Line Spectroscopy. ApJ 2013, 766, 12, [arXiv:astro-ph.SR/1302.0738]. doi:\changeurlcolorblack10.1088/0004-637X/766/1/12.
- Woitke et al. (2011) Woitke, P.; Riaz, B.; Duchêne, G.; Pascucci, I.; Lyo, A.R.; Dent, W.R.F.; Phillips, N.; Thi, W.F.; Ménard, F.; Herczeg, G.J.; Bergin, E.; Brown, A.; Mora, A.; Kamp, I.; Aresu, G.; Brittain, S.; de Gregorio-Monsalvo, I.; Sand ell, G. The unusual protoplanetary disk around the T Tauri star ET Chamaeleontis. A&A 2011, 534, A44, [arXiv:astro-ph.EP/1103.5309]. doi:\changeurlcolorblack10.1051/0004-6361/201116684.
- France et al. (2014) France, K.; Schindhelm, E.; Bergin, E.A.; Roueff, E.; Abgrall, H. High-resolution Ultraviolet Radiation Fields of Classical T Tauri Stars. ApJ 2014, 784, 127, [arXiv:astro-ph.SR/1402.6341]. doi:\changeurlcolorblack10.1088/0004-637X/784/2/127.
- France et al. (2017) France, K.; Fleming, B.; West, G.; McCand liss, S.R.; Bolcar, M.R.; Harris, W.; Moustakas, L.; O’Meara, J.M.; Pascucci, I.; Rigby, J.; Schiminovich, D.; Tumlinson, J. The LUVOIR Ultraviolet Multi-Object Spectrograph (LUMOS): instrument definition and design. SPIE Proceedings, 2017, Vol. 10397, Society of Photo-Optical Instrumentation Engineers (SPIE) Conference Series, p. 1039713, [arXiv:astro-ph.IM/1709.06141]. doi:\changeurlcolorblack10.1117/12.2272025.
- Walsh et al. (2012) Walsh, C.; Nomura, H.; Millar, T.J.; Aikawa, Y. Chemical Processes in Protoplanetary Disks. II. On the Importance of Photochemistry and X-Ray Ionization. ApJ 2012, 747, 114, [arXiv:astro-ph.GA/1201.2613]. doi:\changeurlcolorblack10.1088/0004-637X/747/2/114.
- Bergin et al. (2007) Bergin, E.A.; Aikawa, Y.; Blake, G.A.; van Dishoeck, E.F. The Chemical Evolution of Protoplanetary Disks. Protostars and Planets V; Reipurth, B.; Jewitt, D.; Keil, K., Eds., 2007, p. 751, [arXiv:astro-ph/astro-ph/0603358].
- Shull and Beckwith (1982) Shull, J.M.; Beckwith, S. Interstellar molecular hydrogen. ARA&A 1982, 20, 163–190. doi:\changeurlcolorblack10.1146/annurev.aa.20.090182.001115.
- van Dishoeck and Black (1988) van Dishoeck, E.F.; Black, J.H. The Photodissociation and Chemistry of Interstellar CO. ApJ 1988, 334, 771. doi:\changeurlcolorblack10.1086/166877.
- van Zadelhoff et al. (2003) van Zadelhoff, G.J.; Aikawa, Y.; Hogerheijde, M.R.; van Dishoeck, E.F. Axi-symmetric models of ultraviolet radiative transfer with applications to circumstellar disk chemistry. A&A 2003, 397, 789–802, [arXiv:astro-ph/astro-ph/0211014]. doi:\changeurlcolorblack10.1051/0004-6361:20021592.
- Vasyunin et al. (2011) Vasyunin, A.I.; Wiebe, D.S.; Birnstiel, T.; Zhukovska, S.; Henning, T.; Dullemond, C.P. Impact of Grain Evolution on the Chemical Structure of Protoplanetary Disks. ApJ 2011, 727, 76, [arXiv:astro-ph.GA/1011.4420]. doi:\changeurlcolorblack10.1088/0004-637X/727/2/76.
- Bethell and Bergin (2011) Bethell, T.J.; Bergin, E.A. The Propagation of Ly in Evolving Protoplanetary Disks. ApJ 2011, 739, 78, [arXiv:astro-ph.SR/1107.3514]. doi:\changeurlcolorblack10.1088/0004-637X/739/2/78.
- Fogel et al. (2011) Fogel, J.K.J.; Bethell, T.J.; Bergin, E.A.; Calvet, N.; Semenov, D. Chemistry of a Protoplanetary Disk with Grain Settling and Ly Radiation. ApJ 2011, 726, 29, [arXiv:astro-ph.SR/1011.0446]. doi:\changeurlcolorblack10.1088/0004-637X/726/1/29.
- McJunkin et al. (2016) McJunkin, M.; France, K.; Schindhelm, E.; Herczeg, G.; Schneider, P.C.; Brown, A. Empirically Estimated Far-UV Extinction Curves for Classical T Tauri Stars. ApJ 2016, 828, 69. doi:\changeurlcolorblack10.3847/0004-637X/828/2/69.
- Fedele et al. (2010) Fedele, D.; van den Ancker, M.E.; Henning, T.; Jayawardhana, R.; Oliveira, J.M. Timescale of mass accretion in pre-main-sequence stars. A&A 2010, 510, A72, [arXiv:astro-ph.SR/0911.3320]. doi:\changeurlcolorblack10.1051/0004-6361/200912810.
- Alexander et al. (2006) Alexander, R.D.; Clarke, C.J.; Pringle, J.E. Photoevaporation of protoplanetary discs - I. Hydrodynamic models. MNRAS 2006, 369, 216–228, [arXiv:astro-ph/astro-ph/0603253]. doi:\changeurlcolorblack10.1111/j.1365-2966.2006.10293.x.
- Gorti and Hollenbach (2009) Gorti, U.; Hollenbach, D. Photoevaporation of Circumstellar Disks By Far-Ultraviolet, Extreme-Ultraviolet and X-Ray Radiation from the Central Star. ApJ 2009, 690, 1539–1552, [arXiv:astro-ph/0809.1494]. doi:\changeurlcolorblack10.1088/0004-637X/690/2/1539.
- Dodson-Robinson and Salyk (2011) Dodson-Robinson, S.E.; Salyk, C. Transitional Disks as Signposts of Young, Multiplanet Systems. ApJ 2011, 738, 131, [arXiv:astro-ph.EP/1106.4824]. doi:\changeurlcolorblack10.1088/0004-637X/738/2/131.
- Chiang and Murray-Clay (2007) Chiang, E.; Murray-Clay, R. Inside-out evacuation of transitional protoplanetary discs by the magneto-rotational instability. Nature Physics 2007, 3, 604–608, [arXiv:astro-ph/0706.1241]. doi:\changeurlcolorblack10.1038/nphys661.
- Banzatti and Pontoppidan (2015) Banzatti, A.; Pontoppidan, K.M. An Empirical Sequence of Disk Gap Opening Revealed by Rovibrational CO. ApJ 2015, 809, 167, [arXiv:astro-ph.EP/1507.06650]. doi:\changeurlcolorblack10.1088/0004-637X/809/2/167.
- Arulanantham et al. (2018) Arulanantham, N.; France, K.; Hoadley, K.; Manara, C.F.; Schneider, P.C.; Alcalá, J.M.; Banzatti, A.; Günther, H.M.; Miotello, A.; van der Marel, N.; van Dishoeck, E.F.; Walsh, C.; Williams, J.P. A UV-to-NIR Study of Molecular Gas in the Dust Cavity around RY Lupi. ApJ 2018, 855, 98, [arXiv:astro-ph.SR/1802.05275]. doi:\changeurlcolorblack10.3847/1538-4357/aaaf65.
- Frank et al. (2014) Frank, A.; Ray, T.P.; Cabrit, S.; Hartigan, P.; Arce, H.G.; Bacciotti, F.; Bally, J.; Benisty, M.; Eislöffel, J.; Güdel, M.; Lebedev, S.; Nisini, B.; Raga, A. Jets and Outflows from Star to Cloud: Observations Confront Theory. Protostars and Planets VI; Beuther, H.; Klessen, R.S.; Dullemond, C.P.; Henning, T., Eds., 2014, p. 451, [arXiv:astro-ph.SR/1402.3553]. doi:\changeurlcolorblack10.2458/azu_uapress_9780816531240-ch020.
- Zanni and Ferreira (2013) Zanni, C.; Ferreira, J. MHD simulations of accretion onto a dipolar magnetosphere. II. Magnetospheric ejections and stellar spin-down. A&A 2013, 550, A99, [arXiv:astro-ph.SR/1211.4844]. doi:\changeurlcolorblack10.1051/0004-6361/201220168.
- Shu et al. (1994) Shu, F.; Najita, J.; Ostriker, E.; Wilkin, F.; Ruden, S.; Lizano, S. Magnetocentrifugally Driven Flows from Young Stars and Disks. I. A Generalized Model. ApJ 1994, 429, 781. doi:\changeurlcolorblack10.1086/174363.
- Blandford and Payne (1982) Blandford, R.D.; Payne, D.G. Hydromagnetic flows from accretion disks and the production of radio jets. MNRAS 1982, 199, 883–903. doi:\changeurlcolorblack10.1093/mnras/199.4.883.
- Raga et al. (2015) Raga, A.C.; Reipurth, B.; Castellanos-Ramírez, A.; Chiang, H.F.; Bally, J. Collisionally Excited Filaments in Hubble Space Telescope H and H Images of HH 1/2. ApJl 2015, 798, L1, [arXiv:astro-ph.SR/1411.7972]. doi:\changeurlcolorblack10.1088/2041-8205/798/1/L1.
- Loinard et al. (2013) Loinard, L.; Zapata, L.A.; Rodriguez, L.F.; Pech, G.; Chandler, C.J.; Brogan, C.L.; Wilner, D.J.; Ho, P.T.P.; Parise, B.; Hartmann, L.W.; Zhu, Z.; Takahashi, S.; Trejo, A. ALMA and VLA observations of the outflows in IRAS 16293-2422. MNRAS 2013, 430, L10–L14, [arXiv:astro-ph.SR/1211.4744]. doi:\changeurlcolorblack10.1093/mnrasl/sls038.
- Güdel et al. (2018) Güdel, M.; Eibensteiner, C.; Dionatos, O.; Audard, M.; Forbrich, J.; Kraus, S.; Rab, C.; Schneider, C.; Skinner, S.; Vorobyov, E. ALMA detects a radial disk wind in DG Tauri. A&A 2018, 620, L1, [arXiv:astro-ph.SR/1810.12251]. doi:\changeurlcolorblack10.1051/0004-6361/201834271.
- Pravdo et al. (2001) Pravdo, S.H.; Feigelson, E.D.; Garmire, G.; Maeda, Y.; Tsuboi, Y.; Bally, J. Discovery of X-rays from the protostellar outflow object HH2. Nature 2001, 413, 708–711. doi:\changeurlcolorblack10.1038/35099508.
- Güdel et al. (2008) Güdel, M.; Skinner, S.L.; Audard, M.; Briggs, K.R.; Cabrit, S. Discovery of a bipolar X-ray jet from the T Tauri star DG Tauri. A&A 2008, 478, 797–807, [arXiv:astro-ph/0712.1330]. doi:\changeurlcolorblack10.1051/0004-6361:20078141.
- Schneider et al. (2011) Schneider, P.C.; Günther, H.M.; Schmitt, J.H.M.M. The X-ray puzzle of the L1551 IRS 5 jet. A&A 2011, 530, A123, [arXiv:astro-ph.SR/1105.1663]. doi:\changeurlcolorblack10.1051/0004-6361/201016305.
- Ainsworth et al. (2014) Ainsworth, R.E.; Scaife, A.M.M.; Ray, T.P.; Taylor, A.M.; Green, D.A.; Buckle, J.V. Tentative Evidence for Relativistic Electrons Generated by the Jet of the Young Sun-like Star DG Tau. ApJl 2014, 792, L18, [arXiv:astro-ph.SR/1408.1892]. doi:\changeurlcolorblack10.1088/2041-8205/792/1/L18.
- Dupree et al. (2005) Dupree, A.K.; Brickhouse, N.S.; Smith, G.H.; Strader, J. A Hot Wind from the Classical T Tauri Stars: TW Hydrae and T Tauri. ApJl 2005, 625, L131–L134, [arXiv:astro-ph/astro-ph/0505037]. doi:\changeurlcolorblack10.1086/431323.
- Skinner et al. (2018) Skinner, S.L.; Schneider, P.C.; Audard, M.; Güdel, M. Resolving the Inner Arcsecond of the RY Tau Jet with HST. ApJ 2018, 855, 143, [arXiv:astro-ph.SR/1801.08568]. doi:\changeurlcolorblack10.3847/1538-4357/aaab58.
- Schneider and Schmitt (2008) Schneider, P.C.; Schmitt, J.H.M.M. The nature of the soft X-ray source in DG Tauri. A&A 2008, 488, L13–L16, [arXiv:astro-ph/0807.2156]. doi:\changeurlcolorblack10.1051/0004-6361:200810261.
- Walter et al. (2003) Walter, F.M.; Herczeg, G.; Brown, A.; Ardila, D.R.; Gahm, G.F.; Johns-Krull, C.M.; Lissauer, J.J.; Simon, M.; Valenti, J.A. Mapping the Circumstellar Environment of T Tauri with Fluorescent H2 Emission. AJ 2003, 126, 3076–3089, [arXiv:astro-ph/astro-ph/0309142]. doi:\changeurlcolorblack10.1086/379557.
- Schneider et al. (2013) Schneider, P.C.; Eislöffel, J.; Güdel, M.; Günther, H.M.; Herczeg, G.; Robrade, J.; Schmitt, J.H.M.M. HST far-ultraviolet imaging of DG Tauri. Fluorescent molecular hydrogen emission from the wide opening-angle outflow. A&A 2013, 557, A110, [arXiv:astro-ph.SR/1307.2846]. doi:\changeurlcolorblack10.1051/0004-6361/201321564.
- Agra-Amboage et al. (2014) Agra-Amboage, V.; Cabrit, S.; Dougados, C.; Kristensen, L.E.; Ibgui, L.; Reunanen, J. Origin of the wide-angle hot H2 in DG Tauri. New insight from SINFONI spectro-imaging. A&A 2014, 564, A11, [arXiv:astro-ph.SR/1402.1160]. doi:\changeurlcolorblack10.1051/0004-6361/201220488.
- Costigan et al. (2014) Costigan, G.; Vink, J.S.; Scholz, A.; Ray, T.; Testi, L. Temperaments of young stars: rapid mass accretion rate changes in T Tauri and Herbig Ae stars. MNRAS 2014, 440, 3444–3461, [arXiv:astro-ph.SR/1403.4088]. doi:\changeurlcolorblack10.1093/mnras/stu529.
- Gómez de Castro and Fernández (1996) Gómez de Castro, A.I.; Fernández, M. Ultraviolet spectroscopy of the hotspot in the classical T Tauri star DI Cep: observational indications of magnetically channelled accretion. MNRAS 1996, 283, 55–65. doi:\changeurlcolorblack10.1093/mnras/283.1.55.
- Gómez de Castro and Franqueira (1997) Gómez de Castro, A.I.; Franqueira, M. Accretion and UV Variability in BP Tauri. ApJ 1997, 482, 465–469. doi:\changeurlcolorblack10.1086/304149.
- Ismailov et al. (2010) Ismailov, N.Z.; Alimardanova, F.N.; Baheddinova, G.R.; Adygezalzade, H.N. Ultraviolet Spectrum Variability of BP Tau. Odessa Astronomical Publications 2010, 23, 46.
- Ingleby et al. (2015) Ingleby, L.; Espaillat, C.; Calvet, N.; Sitko, M.; Russell, R.; Champney, E. Using FUV to IR Variability to Probe the Star-Disk Connection in the Transitional Disk of GM Aur. ApJ 2015, 805, 149, [arXiv:astro-ph.SR/1504.00562]. doi:\changeurlcolorblack10.1088/0004-637X/805/2/149.
- Lamzin et al. (2004) Lamzin, S.A.; Kravtsova, A.S.; Romanova, M.M.; Batalha, C. Kinematics and Parameters of the Gas in the Vicinity of TW Hya. Astronomy Letters 2004, 30, 413–427. doi:\changeurlcolorblack10.1134/1.1764888.
- Kastner et al. (2002) Kastner, J.H.; Huenemoerder, D.P.; Schulz, N.S.; Canizares, C.R.; Weintraub, D.A. Evidence for Accretion: High-Resolution X-Ray Spectroscopy of the Classical T Tauri Star TW Hydrae. ApJ 2002, 567, 434–440, [arXiv:astro-ph/astro-ph/0111049]. doi:\changeurlcolorblack10.1086/338419.
- Brickhouse et al. (2010) Brickhouse, N.S.; Cranmer, S.R.; Dupree, A.K.; Luna, G.J.M.; Wolk, S. A Deep Chandra X-Ray Spectrum of the Accreting Young Star TW Hydrae. ApJ 2010, 710, 1835–1847, [arXiv:astro-ph.SR/1001.0750]. doi:\changeurlcolorblack10.1088/0004-637X/710/2/1835.
- Curran et al. (2011) Curran, R.L.; Argiroffi, C.; Sacco, G.G.; Orland o, S.; Peres, G.; Reale, F.; Maggio, A. Multiwavelength diagnostics of accretion in an X-ray selected sample of CTTSs. A&A 2011, 526, A104, [arXiv:astro-ph.SR/1011.5915]. doi:\changeurlcolorblack10.1051/0004-6361/201015522.
- Günther et al. (2007) Günther, H.M.; Schmitt, J.H.M.M.; Robrade, J.; Liefke, C. X-ray emission from classical T Tauri stars: accretion shocks and coronae? A&A 2007, 466, 1111–1121, [arXiv:astro-ph/astro-ph/0702579]. doi:\changeurlcolorblack10.1051/0004-6361:20065669.
- Bouvier et al. (2013) Bouvier, J.; Grankin, K.; Ellerbroek, L.E.; Bouy, H.; Barrado, D. AA Tauri’s sudden and long-lasting deepening: enhanced extinction by its circumstellar disk. A&A 2013, 557, A77, [arXiv:astro-ph.SR/1304.1487]. doi:\changeurlcolorblack10.1051/0004-6361/201321389.
- Reipurth and Aspin (2010) Reipurth, B.; Aspin, C. FUors and Early Stellar Evolution. Evolution of Cosmic Objects through their Physical Activity; Harutyunian, H.A.; Mickaelian, A.M.; Terzian, Y., Eds., 2010, pp. 19–38.
- Kenyon et al. (1989) Kenyon, S.J.; Hartmann, L.; Imhoff, C.L.; Cassatella, A. Ultraviolet Spectroscopy of Pre–Main-Sequence Accretion Disks. ApJ 1989, 344, 925. doi:\changeurlcolorblack10.1086/167860.
- Kravtsova et al. (2007) Kravtsova, A.S.; Lamzin, S.A.; Errico, L.; Vittone, A. Ultraviolet spectrum of FU Ori and a “Compromise” model of the FUor. Astronomy Letters 2007, 33, 755–765. doi:\changeurlcolorblack10.1134/S1063773707110060.
- Devine et al. (2000) Devine, D.; Grady, C.A.; Kimble, R.A.; Woodgate, B.; Bruhweiler, F.C.; Boggess, A.; Linsky, J.L.; Clampin, M. A Ly Bright Jet from a Herbig AE Star. ApJl 2000, 542, L115–L118. doi:\changeurlcolorblack10.1086/312939.
- Günther et al. (2013) Günther, H.M.; Schneider, P.C.; Li, Z.Y. The evolution of the jet from Herbig Ae star HD 163296 from 1999 to 2011. A&A 2013, 552, A142, [arXiv:astro-ph.SR/1302.3233]. doi:\changeurlcolorblack10.1051/0004-6361/201220772.
- Rodríguez et al. (2012) Rodríguez, L.F.; González, R.F.; Raga, A.C.; Cantó, J.; Riera, A.; Loinard, L.; Dzib, S.A.; Zapata, L.A. Radio continuum emission from knots in the DG Tauri jet. A&A 2012, 537, A123, [arXiv:astro-ph.GA/1111.1196]. doi:\changeurlcolorblack10.1051/0004-6361/201117991.
- France et al. (2017) France, K.; Fleming, B.; West, G.; McCand liss, S.R.; Bolcar, M.R.; Harris, W.; Moustakas, L.; O’Meara, J.M.; Pascucci, I.; Rigby, J.; Schiminovich, D.; Tumlinson, J. The LUVOIR Ultraviolet Multi-Object Spectrograph (LUMOS): instrument definition and design. SPIE Proceedings, 2017, Vol. 10397, Society of Photo-Optical Instrumentation Engineers (SPIE) Conference Series, p. 1039713, [arXiv:astro-ph.IM/1709.06141]. doi:\changeurlcolorblack10.1117/12.2272025.
- The LUVOIR Team (2018) The LUVOIR Team. The LUVOIR Mission Concept Study Interim Report. arXiv e-prints 2018, p. arXiv:1809.09668, [arXiv:astro-ph.IM/1809.09668].