ARES111ARES: Ariel Retrieval of Exoplanets School II: Characterising the Hot Jupiters WASP-127 b, WASP-79 b and WASP-62 b with HST
Abstract
This paper presents the atmospheric characterisation of three large, gaseous planets: WASP-127 b, WASP-79 b and WASP-62 b. We analysed spectroscopic data obtained with the G141 grism (1.088 - 1.68 m) of the Wide Field Camera 3 (WFC3) onboard the Hubble Space Telescope (HST) using the Iraclis pipeline and the TauREx3 retrieval code, both of which are publicly available. For WASP-127 b, which is the least dense planet discovered so far and is located in the short-period Neptune desert, our retrieval results found strong water absorption corresponding to an abundance of log(H2O) = -2.71, and absorption compatible with an iron hydride abundance of log(FeH)=, with an extended cloudy atmosphere.
We also detected water vapour in the atmospheres of WASP-79 b and WASP-62 b, with best-fit models indicating the presence of iron hydride, too.
We used the Atmospheric Detectability Index (ADI) as well as Bayesian log evidence to quantify the strength of the detection and compared our results to the hot Jupiter population study by Tsiaras et al. (2018).
While all the planets studied here are suitable targets for characterisation with upcoming facilities such as the James Webb Space Telescope (JWST) and Ariel, WASP-127 b is of particular interest due to its low density, and a thorough atmospheric study would develop our understanding of planet formation and migration.
1 Introduction
The currently-known exoplanet population displays a wide range of masses, radii, and orbits. Although many planets have been detected and it is thought that they are common in our Galaxy (Howard, 2013; Batalha et al., 2013; Cassan et al., 2012; Dressing & Charbonneau, 2013; Wright et al., 2012), our current knowledge of their atmospheric characteristics is still very limited. Examining the atmospheres of exoplanets further unveils their planetary properties, with their study made possible by various methods, including transit spectroscopy (e.g. Tinetti et al., 2007; Swain et al., 2008). Facilities such as the Hubble Space Telescope and the Spitzer Space Telescope, as well as some ground-based observatories, have provided constraints on these properties for a limited number of targets and, in some cases, have identified the key molecules present in their atmospheres while also detecting the presence of clouds and probing their thermal structure (e.g. Brogi et al., 2012; Majeau et al., 2012; Stevenson et al., 2014; Sing et al., 2016; Fu et al., 2017; Tsiaras et al., 2018; Hoeijmakers et al., 2018; Pinhas et al., 2019; Tsiaras et al., 2019; Ehrenreich et al., 2020; Edwards et al., 2020a).
This paper presents the analysis of data from Hubble’s public archive for the exoplanets WASP-127 b (Lam et al., 2017), WASP-79 b (Smalley et al., 2012) and WASP-62 b (Hellier et al., 2012). They are all inflated, with low eccentricities and short orbital periods around bright stars. Table 1 presents the stellar and planetary parameters for each of these targets.
WASP-127 b is an ideal target for spectroscopic studies, given its unusually low density (with a super-Jupiter radius and a sub-Saturn mass). It is located in the short-period Neptune desert, where it is expected that planets might not survive photo-evaporation (Owen & Lai, 2018; Mazeh et al., 2016). However, photo-evaporation is strongly case-dependent and this planet receives a relatively low extreme ultraviolet flux (Chen, G. et al., 2018). Potential explanations for its inflation include tidal heating, enhanced atmospheric opacity, Ohmic heating, and re-inflation by the host star during inward migration (Leconte et al., 2010; Batygin & Stevenson, 2010; Batygin et al., 2011; Rauscher & Menou, 2013; Lithwick & Wu, 2014). Both WASP-62 b and WASP-79 b are believed to have an evaporating atmosphere, with mass loss rates estimated at 11 gs-1 (Bourrier et al., 2015). WASP-79 b, which has a polar orbit, was originally detected through an aberration in the radial velocity due to the Rossiter McLaughlin effect (Addison et al., 2013).
All spectral data presented herein were acquired with the G141 grism (1.088 - 1.68 m) of the HST/WFC3 camera and details regarding each observation can be found in Table 2. In Section 2, we detail how the data were reduced with the Iraclis pipeline (Tsiaras et al., 2016b), following the approach described by Tsiaras et al. (2018), and summarised here. In Section 2.3, we describe the TauREx retrieval code used to analyse the reduced spectra (Waldmann et al., 2015a, b; Al-Refaie et al., 2019), along with the initial parameters and priors used. Our results can be found in Section 3, followed by a discussion on our findings and the implications they hold for future missions, including simulations of data from Ariel and JWST.
| Parameter | WASP-127 b | WASP-79 b | WASP-62 b |
|---|---|---|---|
| Stellar parameters | |||
| Spectral type | G5 | F5 | F7 |
| [K] | 575085 | 6600100 | 623080 |
| (cgs) | 3.9 | 4.060.15 | 4.450.10 |
| Fe/H | -0.180.06 | 0.03 | 0.04 |
| Planetary parameters | |||
| [days] | 4.178070152.10-6 | 3.6623874.10-6 | 4.4119534.10-6 |
| [BJDTDB - 2450000] | 8138.670144 | 7815.89868 | 5855.39195 |
| [∘] | 88.2 | 86.10.2 | 88.5 |
| 0.180.02 | 0.850.8 | 0.580.03 | |
| 1.370.04 | 1.530.04 | 1.34 | |
| [K] | 140024 | 1716.2 | 1475.3 |
| / | 0.09992 | 0.09609 | 0.1091 |
| / | 7.846 | 6.069 | 9.5253 |
| References | Palle et al. (2017) | Brown et al. (2017) | Brown et al. (2017) |
| Planet | Median epoch | Mean exposure time | Number of spectra | PI name | Proposal ID |
|---|---|---|---|---|---|
| (MJD) | (sec) | ||||
| WASP-127 b | 58217.51310 | 95.782 | 74 | Jessica Spake | 14619 |
| WASP-79 b | 57815.37216 | 138.381 | 64 | David Sing | 14767 |
| WASP-62 b | 57857.82823 | 138.381 | 61 | David Sing | 14767 |
2 Methodology
2.1 HST Observations
Data reduction and calibration were performed using Iraclis, software developed in Tsiaras et al. (2016b) and available on GitHub222https://github.com/ucl-exoplanets/Iraclis; it has been used to extract HST spectra in multiple studies, including Tsiaras et al. (2016c, 2018, 2019). We used the Mikulski Archive for Space Telescopes333https://archive.stsci.edu/hst/ to assess the spectroscopic observational data of WASP-127 b, WASP-79 b and WASP-62 b and information about the observations can be found in Table 2. The WASP-127 b proposal was led by Jessica Spake while David Sing was the PI for the observations of WASP-79 b and WASP-62 b. Although more data is available from additional instruments, we have restricted our study to HST/WFC3 data, in order to maintain consistency in comparing the analysis of the planets.
2.2 Data Analysis
The planets in this paper were analysed to be comparable to the thirty planets studied in Tsiaras et al. (2018). We followed the same methodology as summarised below; differences between our studies are stated explicitly.
Our analysis began with raw spatially scanned spectroscopic images, with data reduction and correction steps performed in the following order: zero-read subtraction; reference pixel correction; non-linearity correction; dark current subtraction; gain conversion; sky background subtraction; calibration; flat-field correction; bad pixels and cosmic ray correction.
Following the reduction process, the flux was extracted from the spatially scanned spectroscopic images to create the final transit light-curves per wavelength band. We considered one broadband (white) light-curve covering the whole wavelength range in which the G141 grism is sensitive (1.088 - 1.68 m) and spectral light-curves with a resolving power of 70 at 1.4 m. When extracting the spectral light-curves, Iraclis accounts for the geometric distortions induced by the tilt of the detector in the WFC3 infrared channel. The bands of the spectral light-curves are selected such that the SNR is approximately uniform across the planetary spectrum. We extracted our final light-curves from the differential, non-destructive reads. Prior to light curve fitting, we chose to discard the first HST orbit of each visit, as these exhibit much stronger hooks than subsequent orbits.
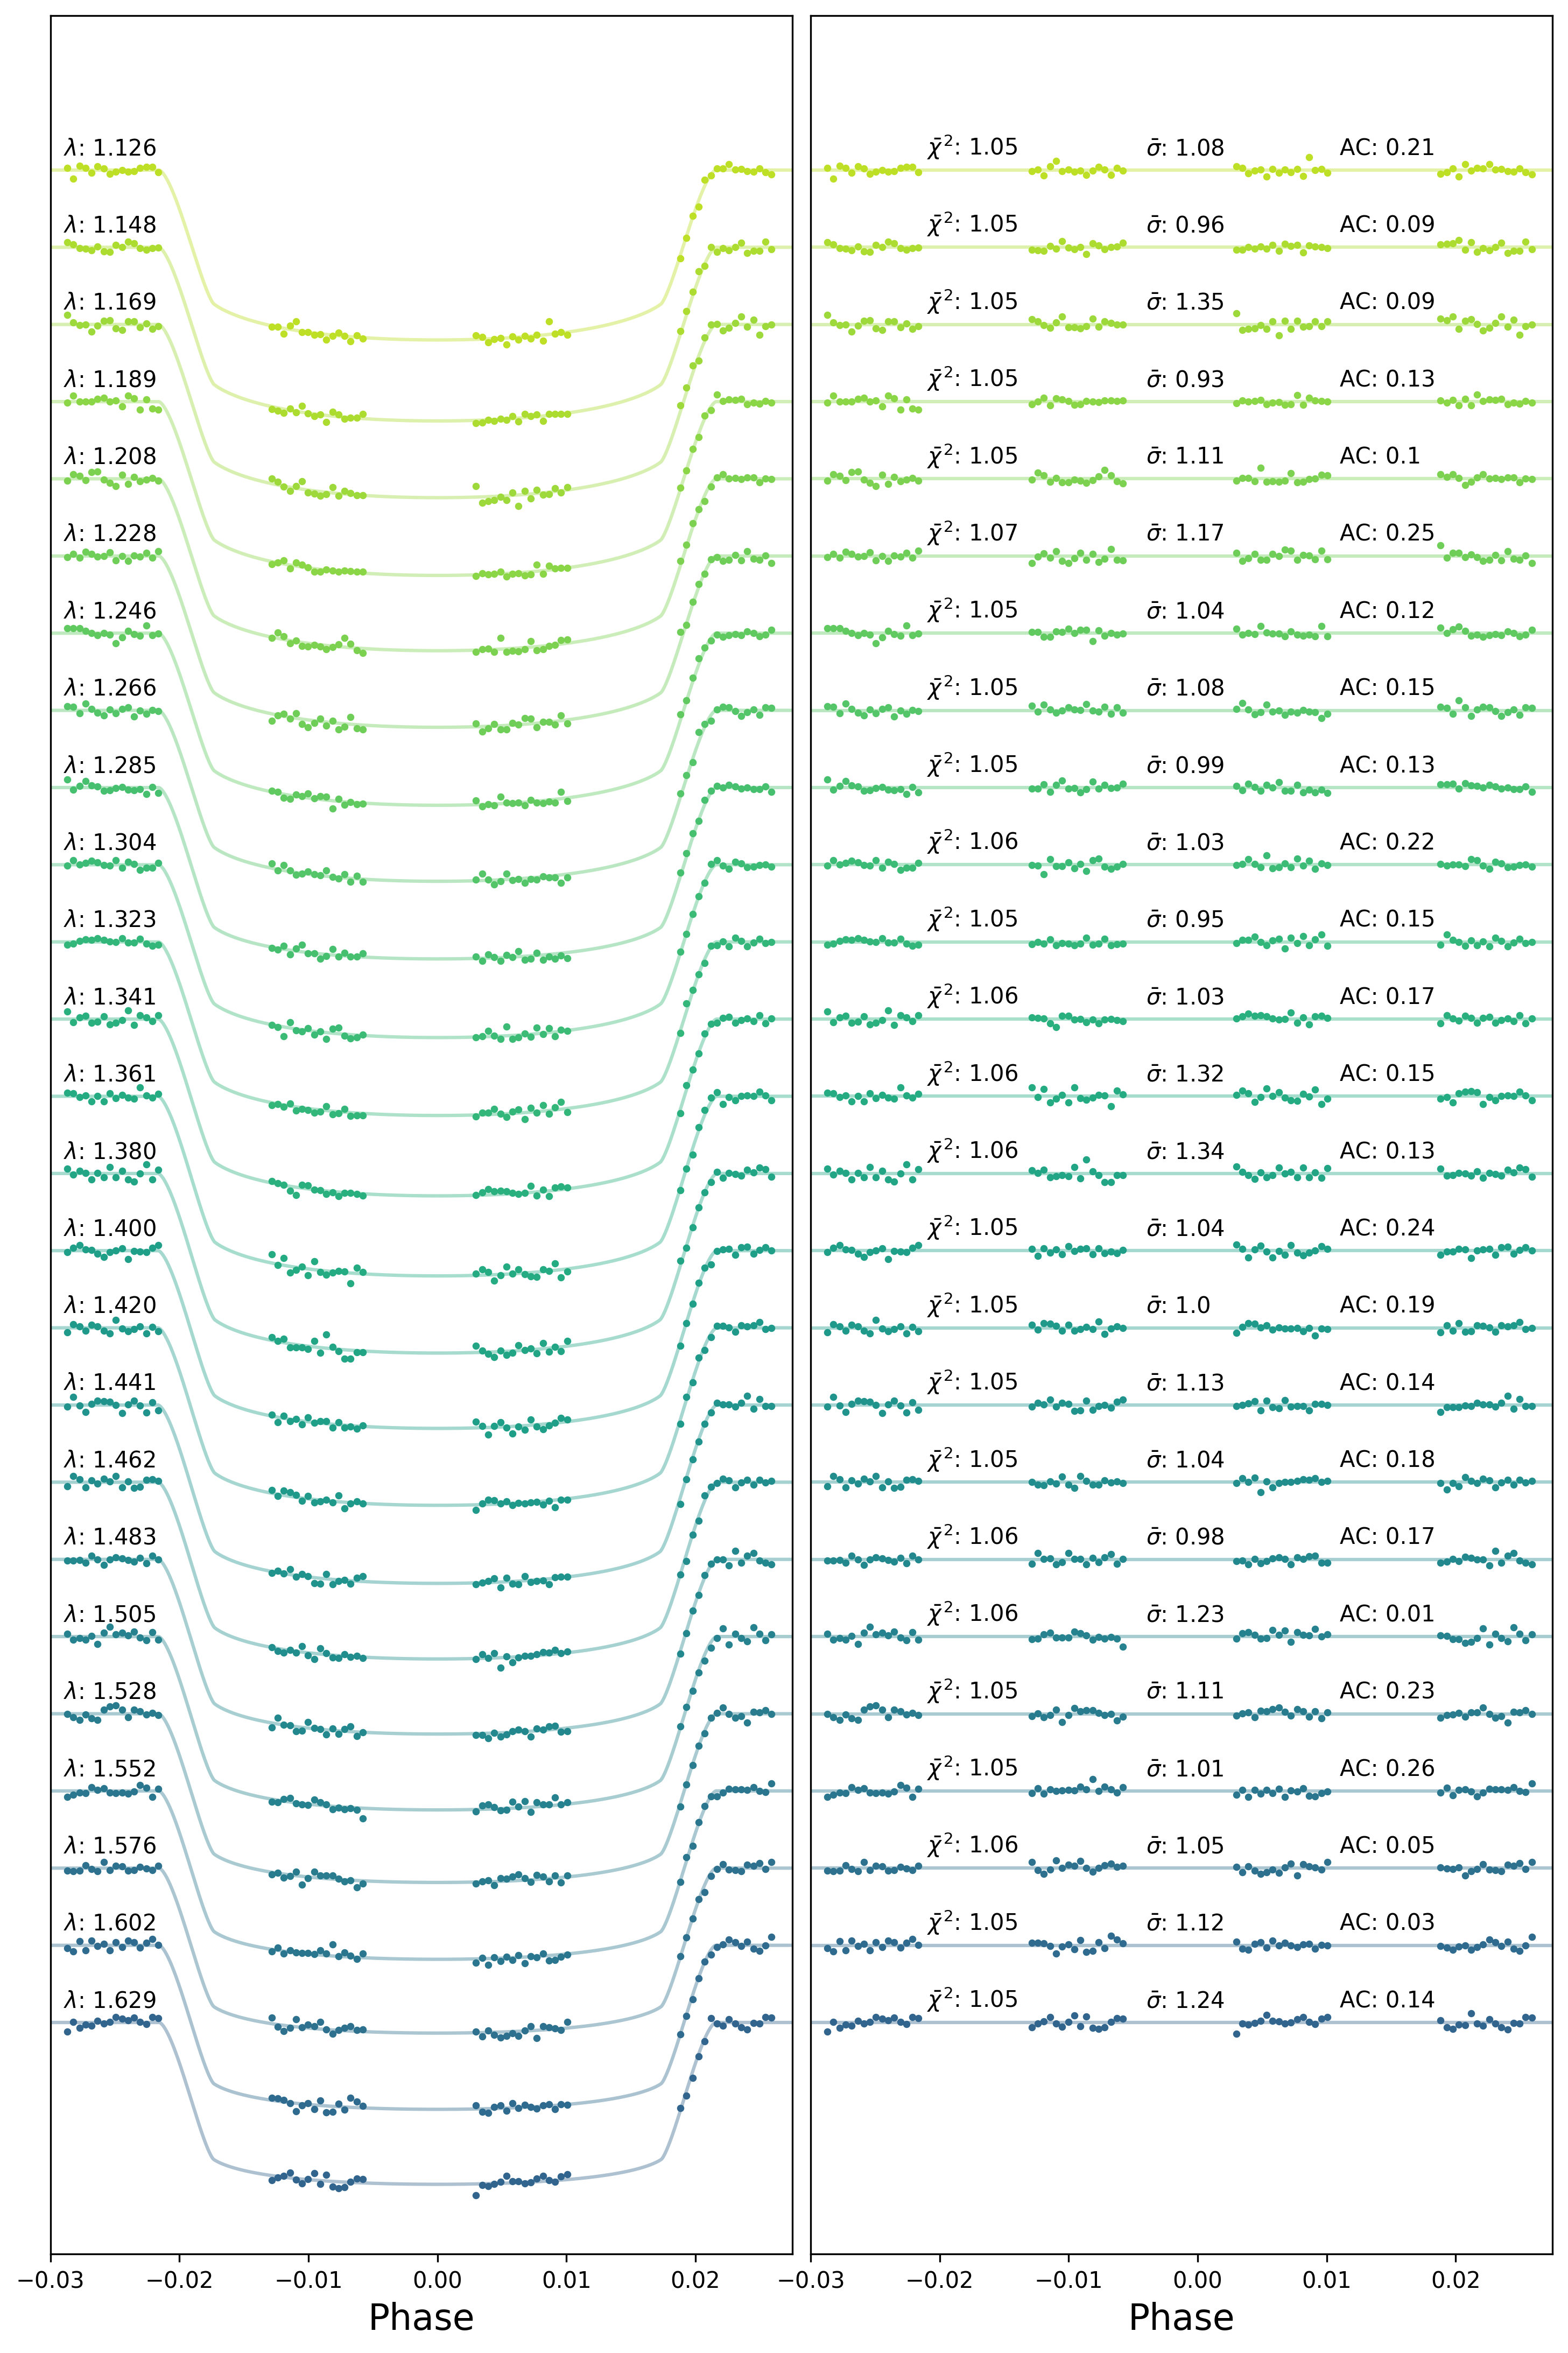
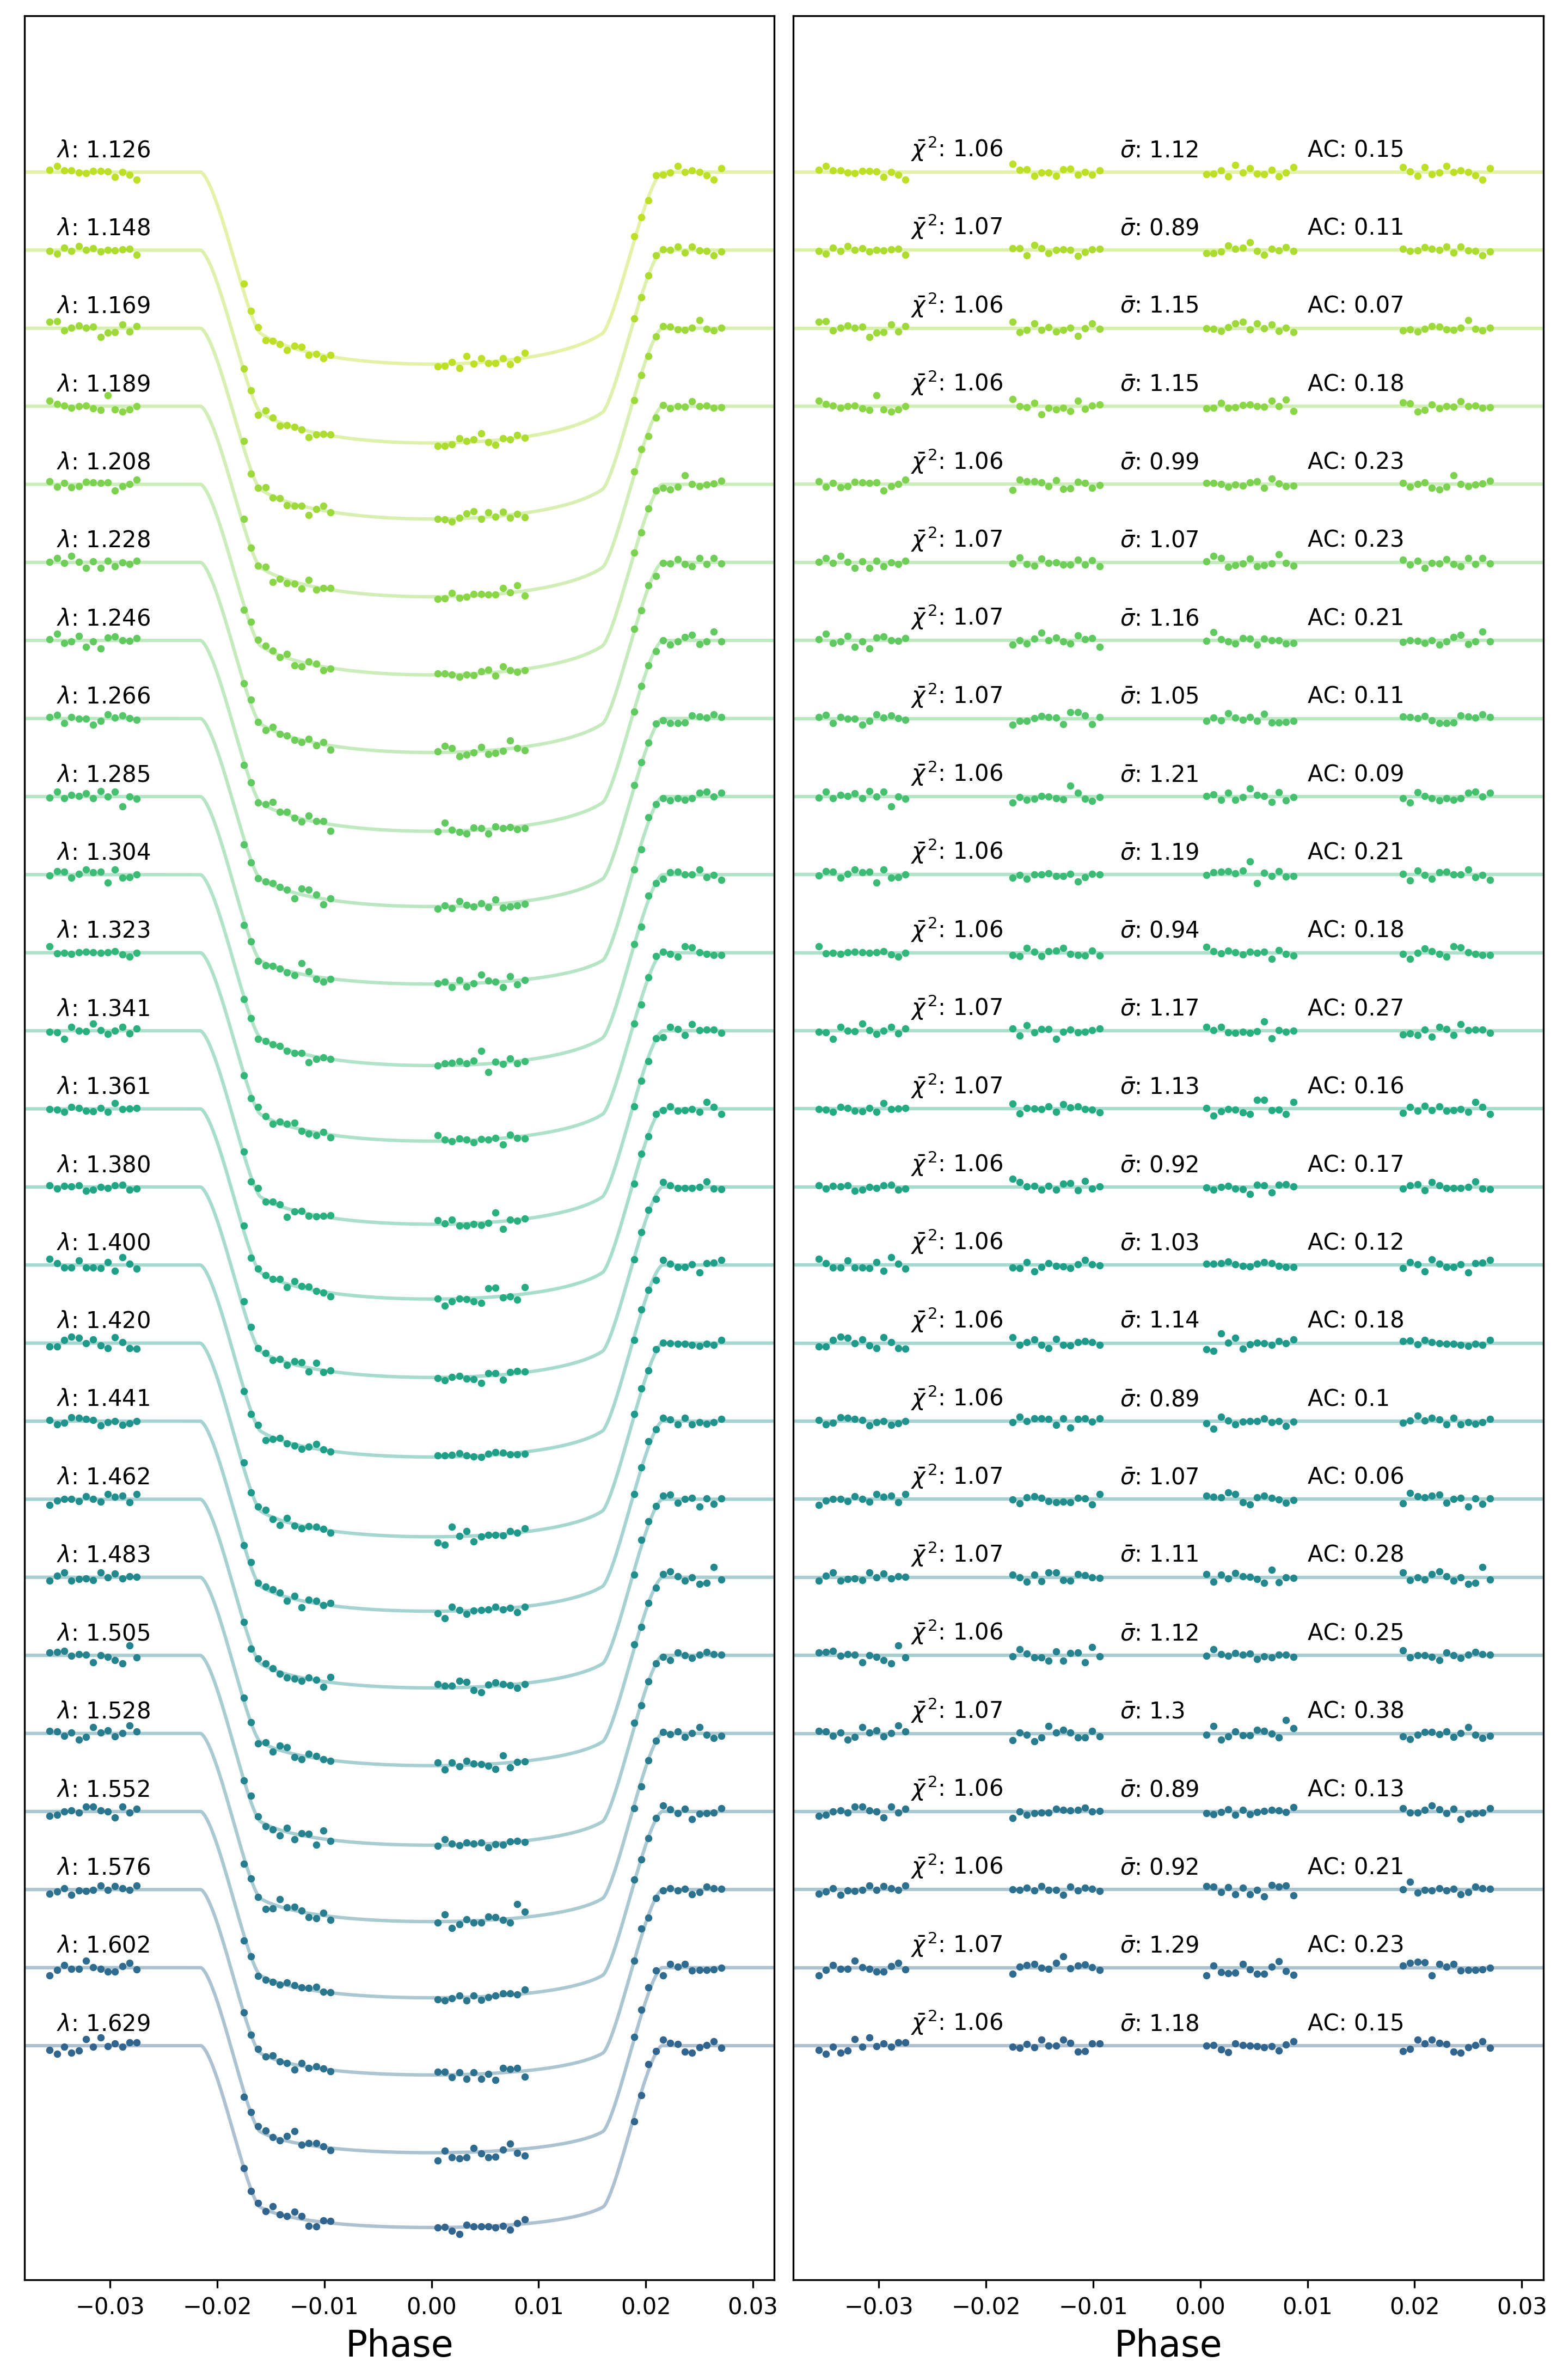
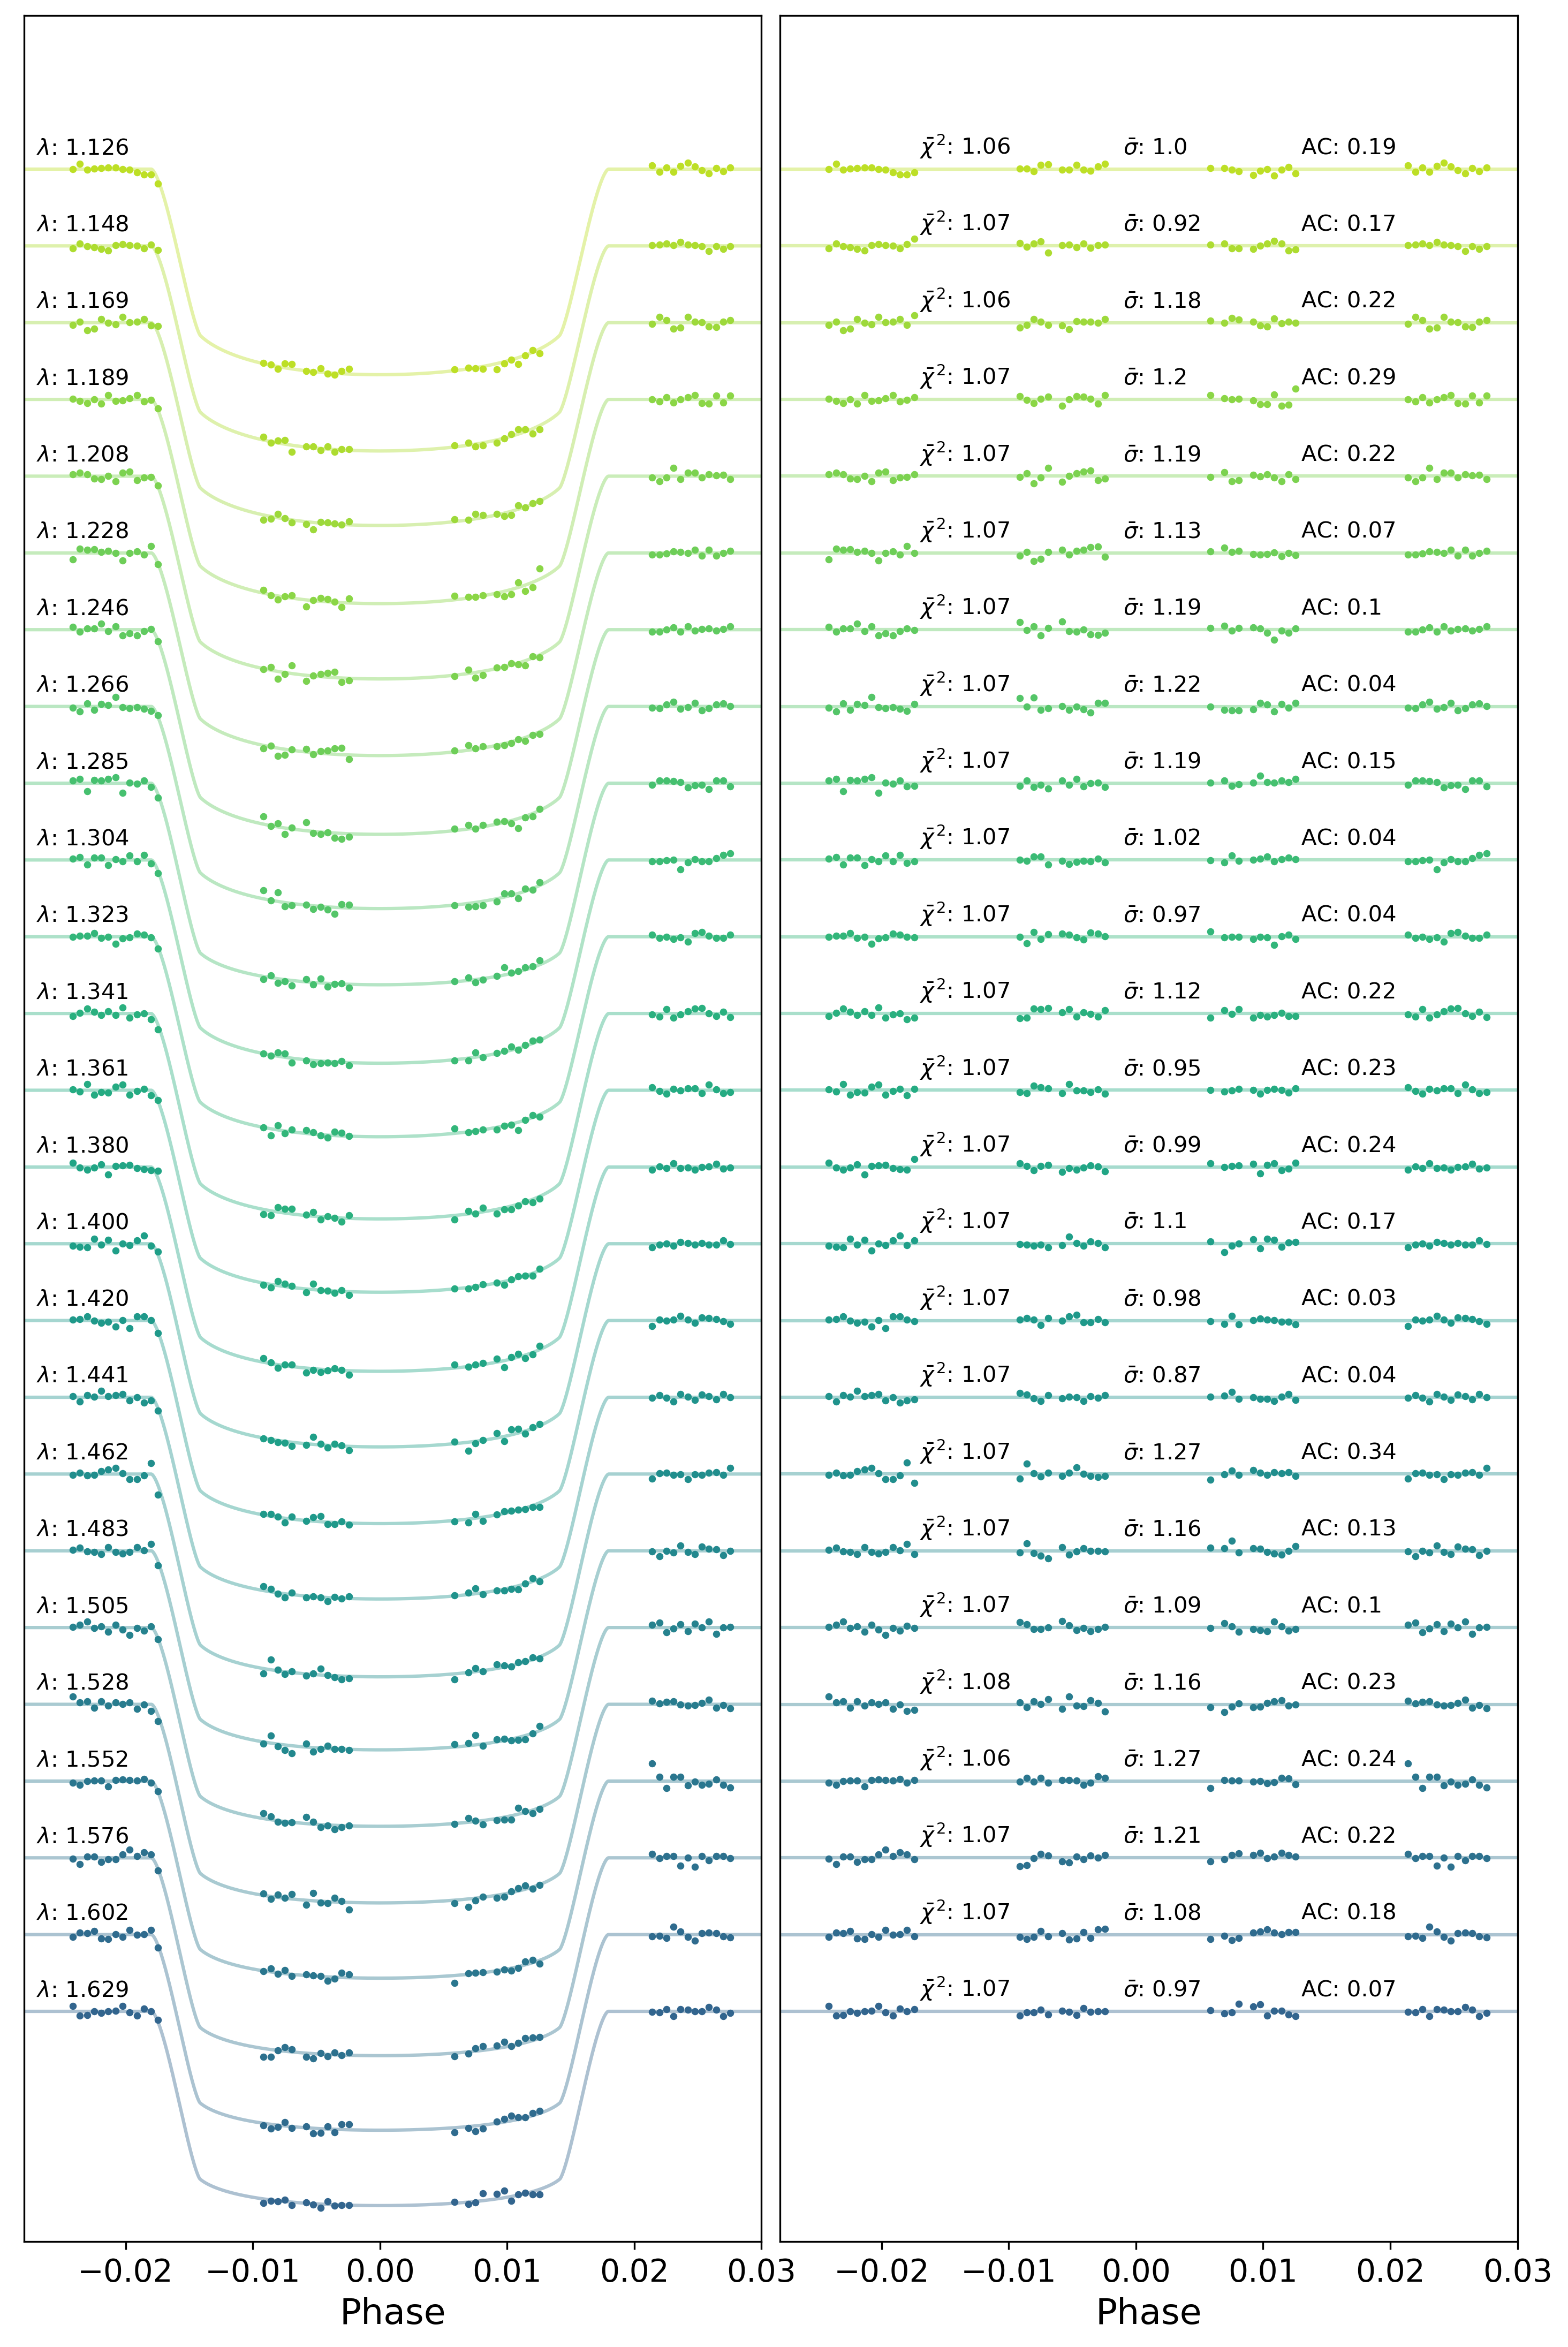
Our white light-curves were fit using literature values and the only free parameters, other than the coefficients for Hubble systematics, were the planet-to-star radius ratio and the transit mid time. This is motivated by the gaps in the observations, caused by Earth obscuration, which often means the ingress and egress of the transit is missed, limiting our ability to refine the semi-major axis to star radius ratio and the inclination planet’s orbit. The limb-darkening coefficients were selected from the quadratic formula by Claret (2000), using the stellar parameters in Table 1. Figure 1 shows the raw white light-curve, the detrended white light-curve, and the fitting residuals for WASP-127 b while Figure 2 shows the fits of spectral light-curves for each wavelength bin. Similar plots for WASP-79 b and WASP-62 b are shown in Figures 3 and 4.



2.3 Atmospheric characterisation
The reduced spectra obtained using Iraclis were thereafter fitted using the publicly available444https://github.com/ucl-exoplanets/TauREx3_public Bayesian atmospheric retrieval framework TauREx 3 (Al-Refaie et al., 2019). TauREx uses the nested sampling code Multinest (Feroz et al., 2009) to explore the likelihood space of atmospheric parameters and features highly accurate line lists from the ExoMol project (Tennyson et al., 2016), along with those from HITRAN and HITEMP (Rothman et al., 1987, 2010). In our retrieval analysis, we used 750 live points and an evidence tolerance of 0.5. Several molecular opacities have been tested to model the spectra of the observations; in this publication, we considered five trace gases: H2O (Polyansky et al., 2018), CH4 (Yurchenko & Tennyson, 2014), CO(Li et al., 2015), CO2 (Rothman et al., 2010), NH3 (Yurchenko et al., 2011) and FeH (Dulick et al., 2003). In the wavelength range covered by G141, water vapour is the dominant spectral feature, but these other molecules can present detectable signals, particularly FeH (Tennyson & Yurchenko, 2018). Clouds are fitted assuming a grey opacity model.
2.3.1 General setup
In this study we use the plane-parallel approximation to model the atmospheres, with pressures ranging from to Pa, uniformly sampled in log-space with 100 atmospheric layers. We included the Rayleigh scattering and the collision induced absorption (CIA) of H2–H2 and H2–He (Abel et al., 2011; Fletcher et al., 2018; Abel et al., 2012). A summary of the fitted retrieval parameters is given in Table 1. For consistency, the same parameter bounds have been applied for all three planets. Constant molecular abundance profiles were used, and allowed to vary freely between and in volume mixing ratio. The planetary radius was set to vary in our models between 0.5 and 1.5 , where the reference radius from the literature for each planet, as shown in Table 1. This is assumed to be equivalent to the radius at Pa pressure.
The cloud top pressure ranged from to Pa, in log-uniform scale. We consider a cloud top pressure of Pa to be a cloud-free atmosphere; the grey cloud model used for this study corresponds to a fully opaque layer below the cloud top pressure.
An isothermal atmosphere was assumed and the planetary temperature, , set to vary from 400 to 2500 K; this is to accommodate the wide range in equilibrium temperatures between our three planets, which are between 1400 K and 1750 K as shown in Table 1.
2.4 Atmospheric Detectability Index - ADI
For quantifying the detection significance of an atmosphere, we use the Atmospheric Detection Index (ADI) from Tsiaras et al. (2018), positively defined as the Bayes Factor between the nominal atmospheric model and the flat-line model (i.e. a model representing a fully cloudy atmosphere). For the flat line model, the only free parameters are the planet radius and temperature, along with the cloud pressure. The nominal model then includes Rayleigh scattering and the collision induced absorption of H2–H2 and H2–He, as well as molecular opacities. If an atmosphere is detected at 3 and 5 level, the corresponding ADI will be above 3 and 11, respectively. An ADI below 3 suggests the atmospheric detection is not significant, indicating the spectral feature amplitudes are insufficient given the uncertainty of the data.
To quantify the detection of particular species, we computed the Bayes factor, which is the ratio of the Bayesian evidences of different models. We follow the formalism by Kass & Raftery (1995) for model selection significance as well as translate the Bayes factor to the more traditional significance nomenclature following (Benneke & Seager, 2012).
2.5 Ephemeris Refinement
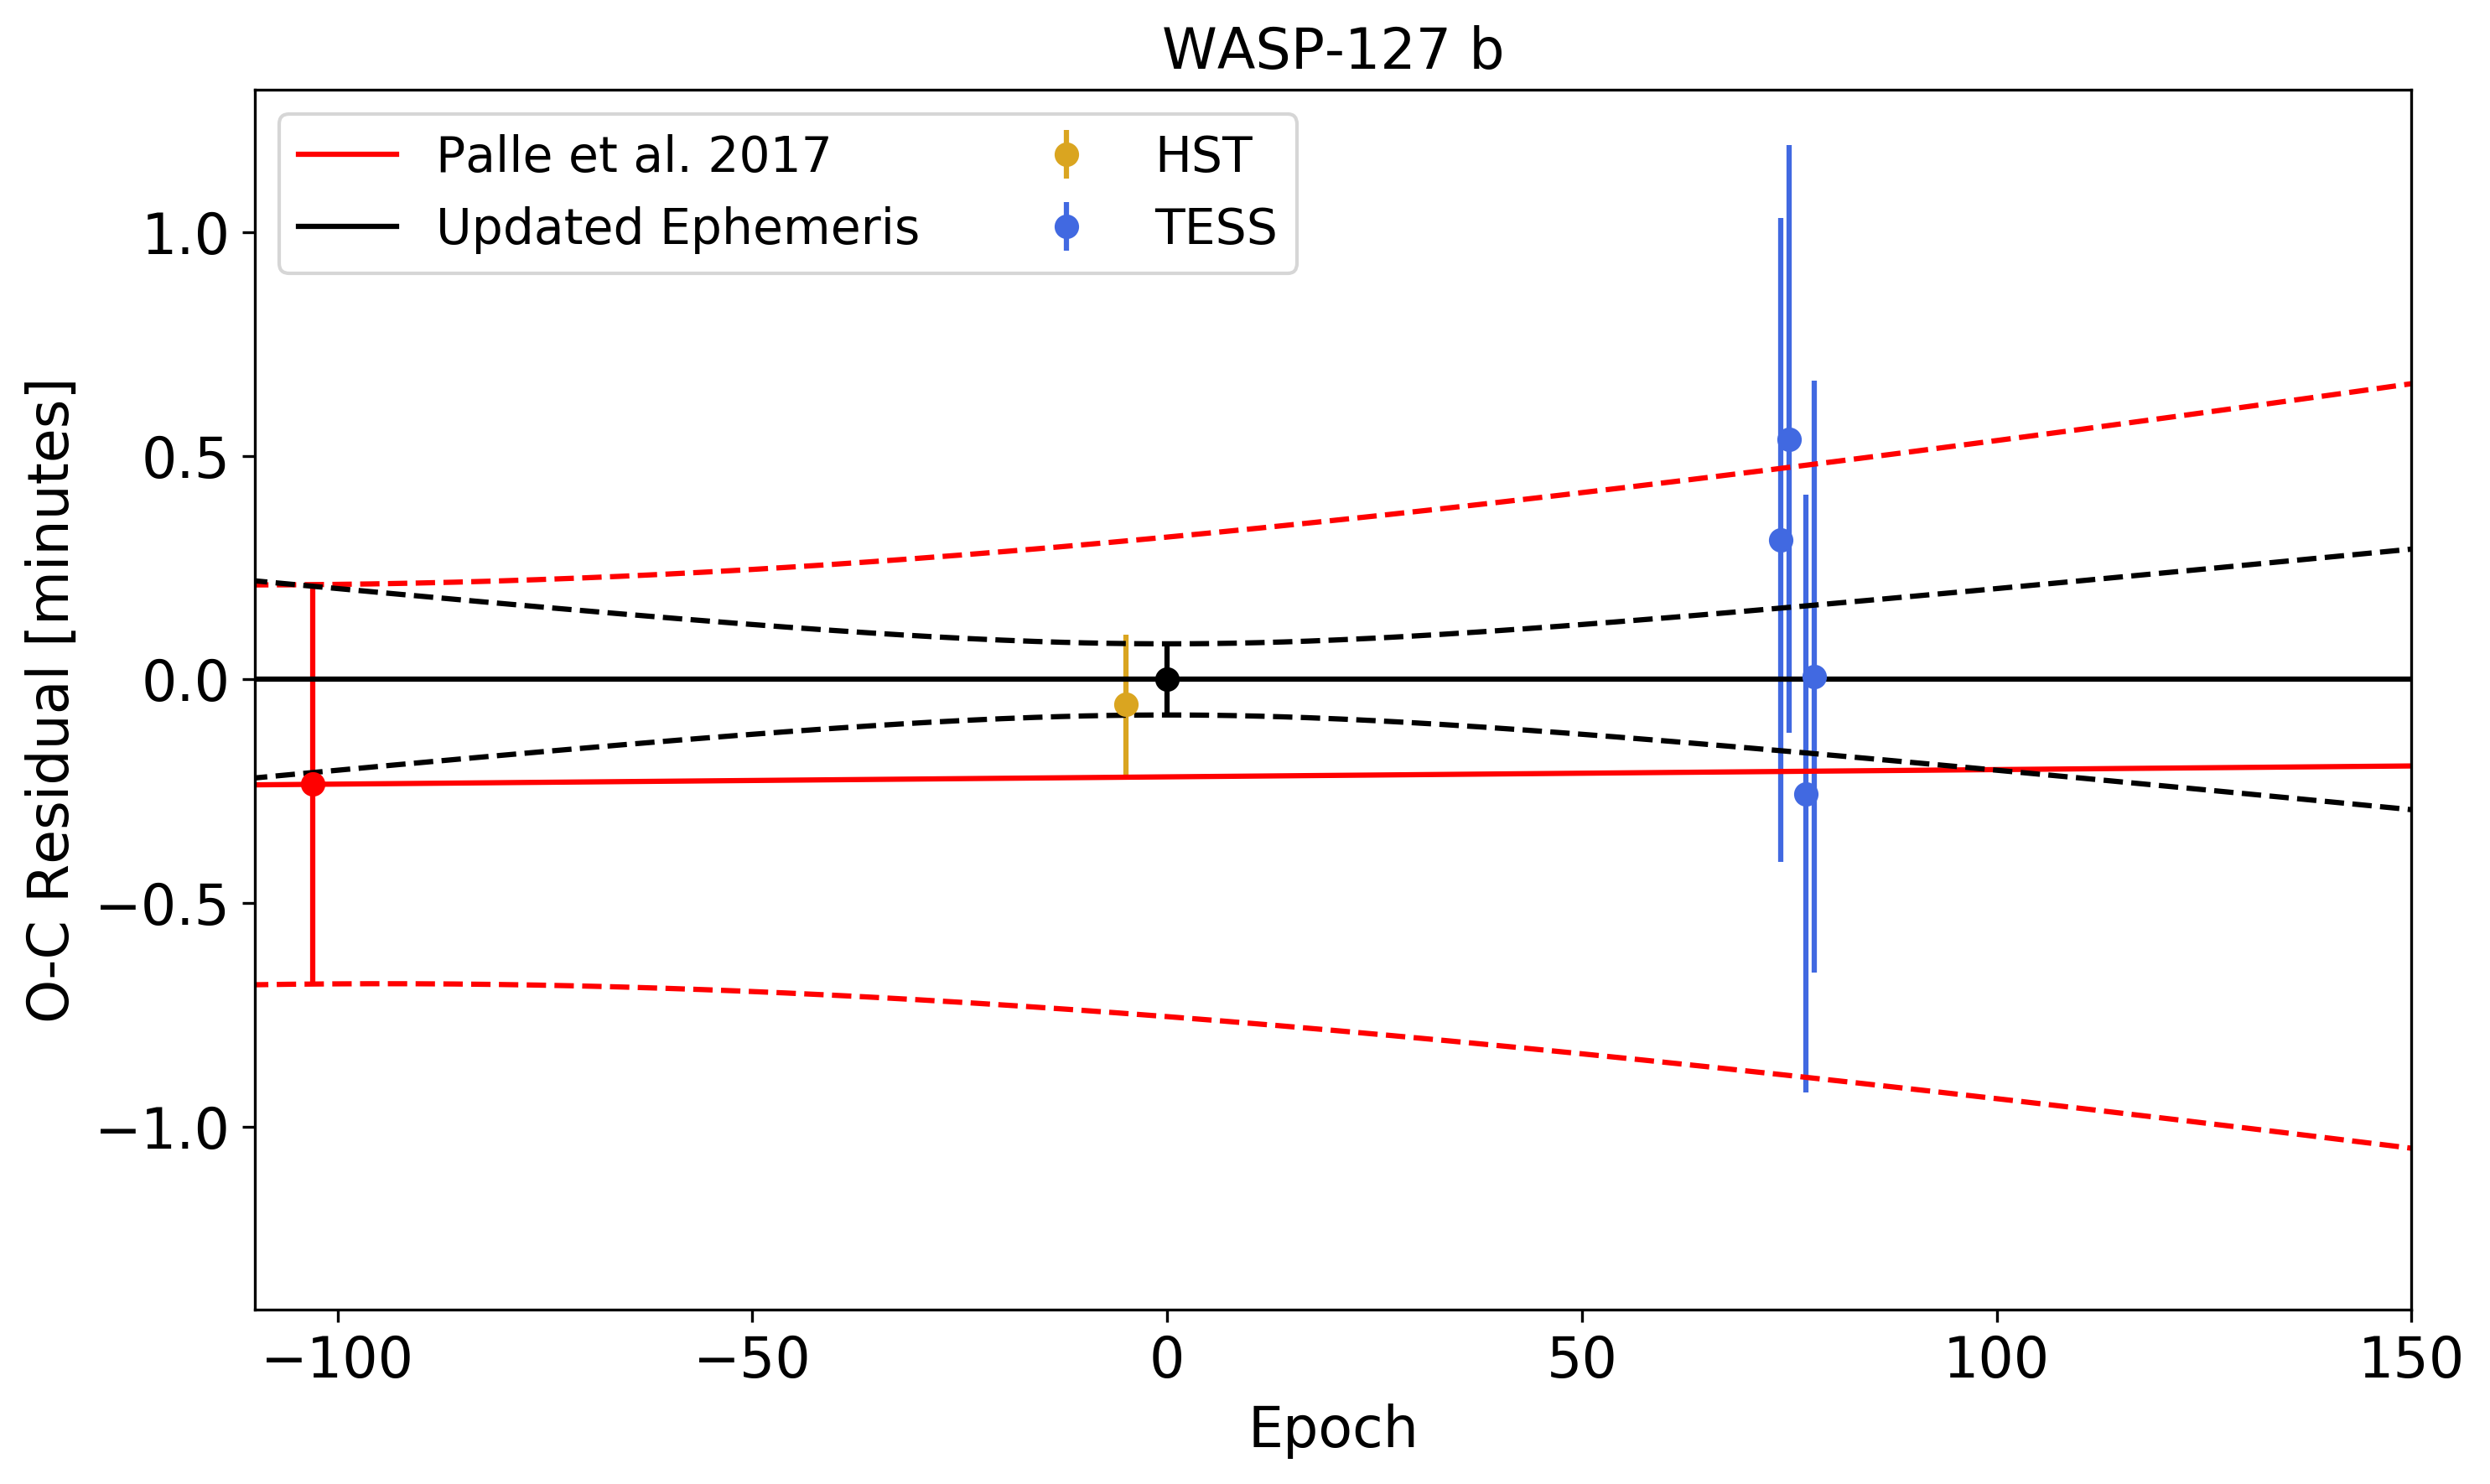
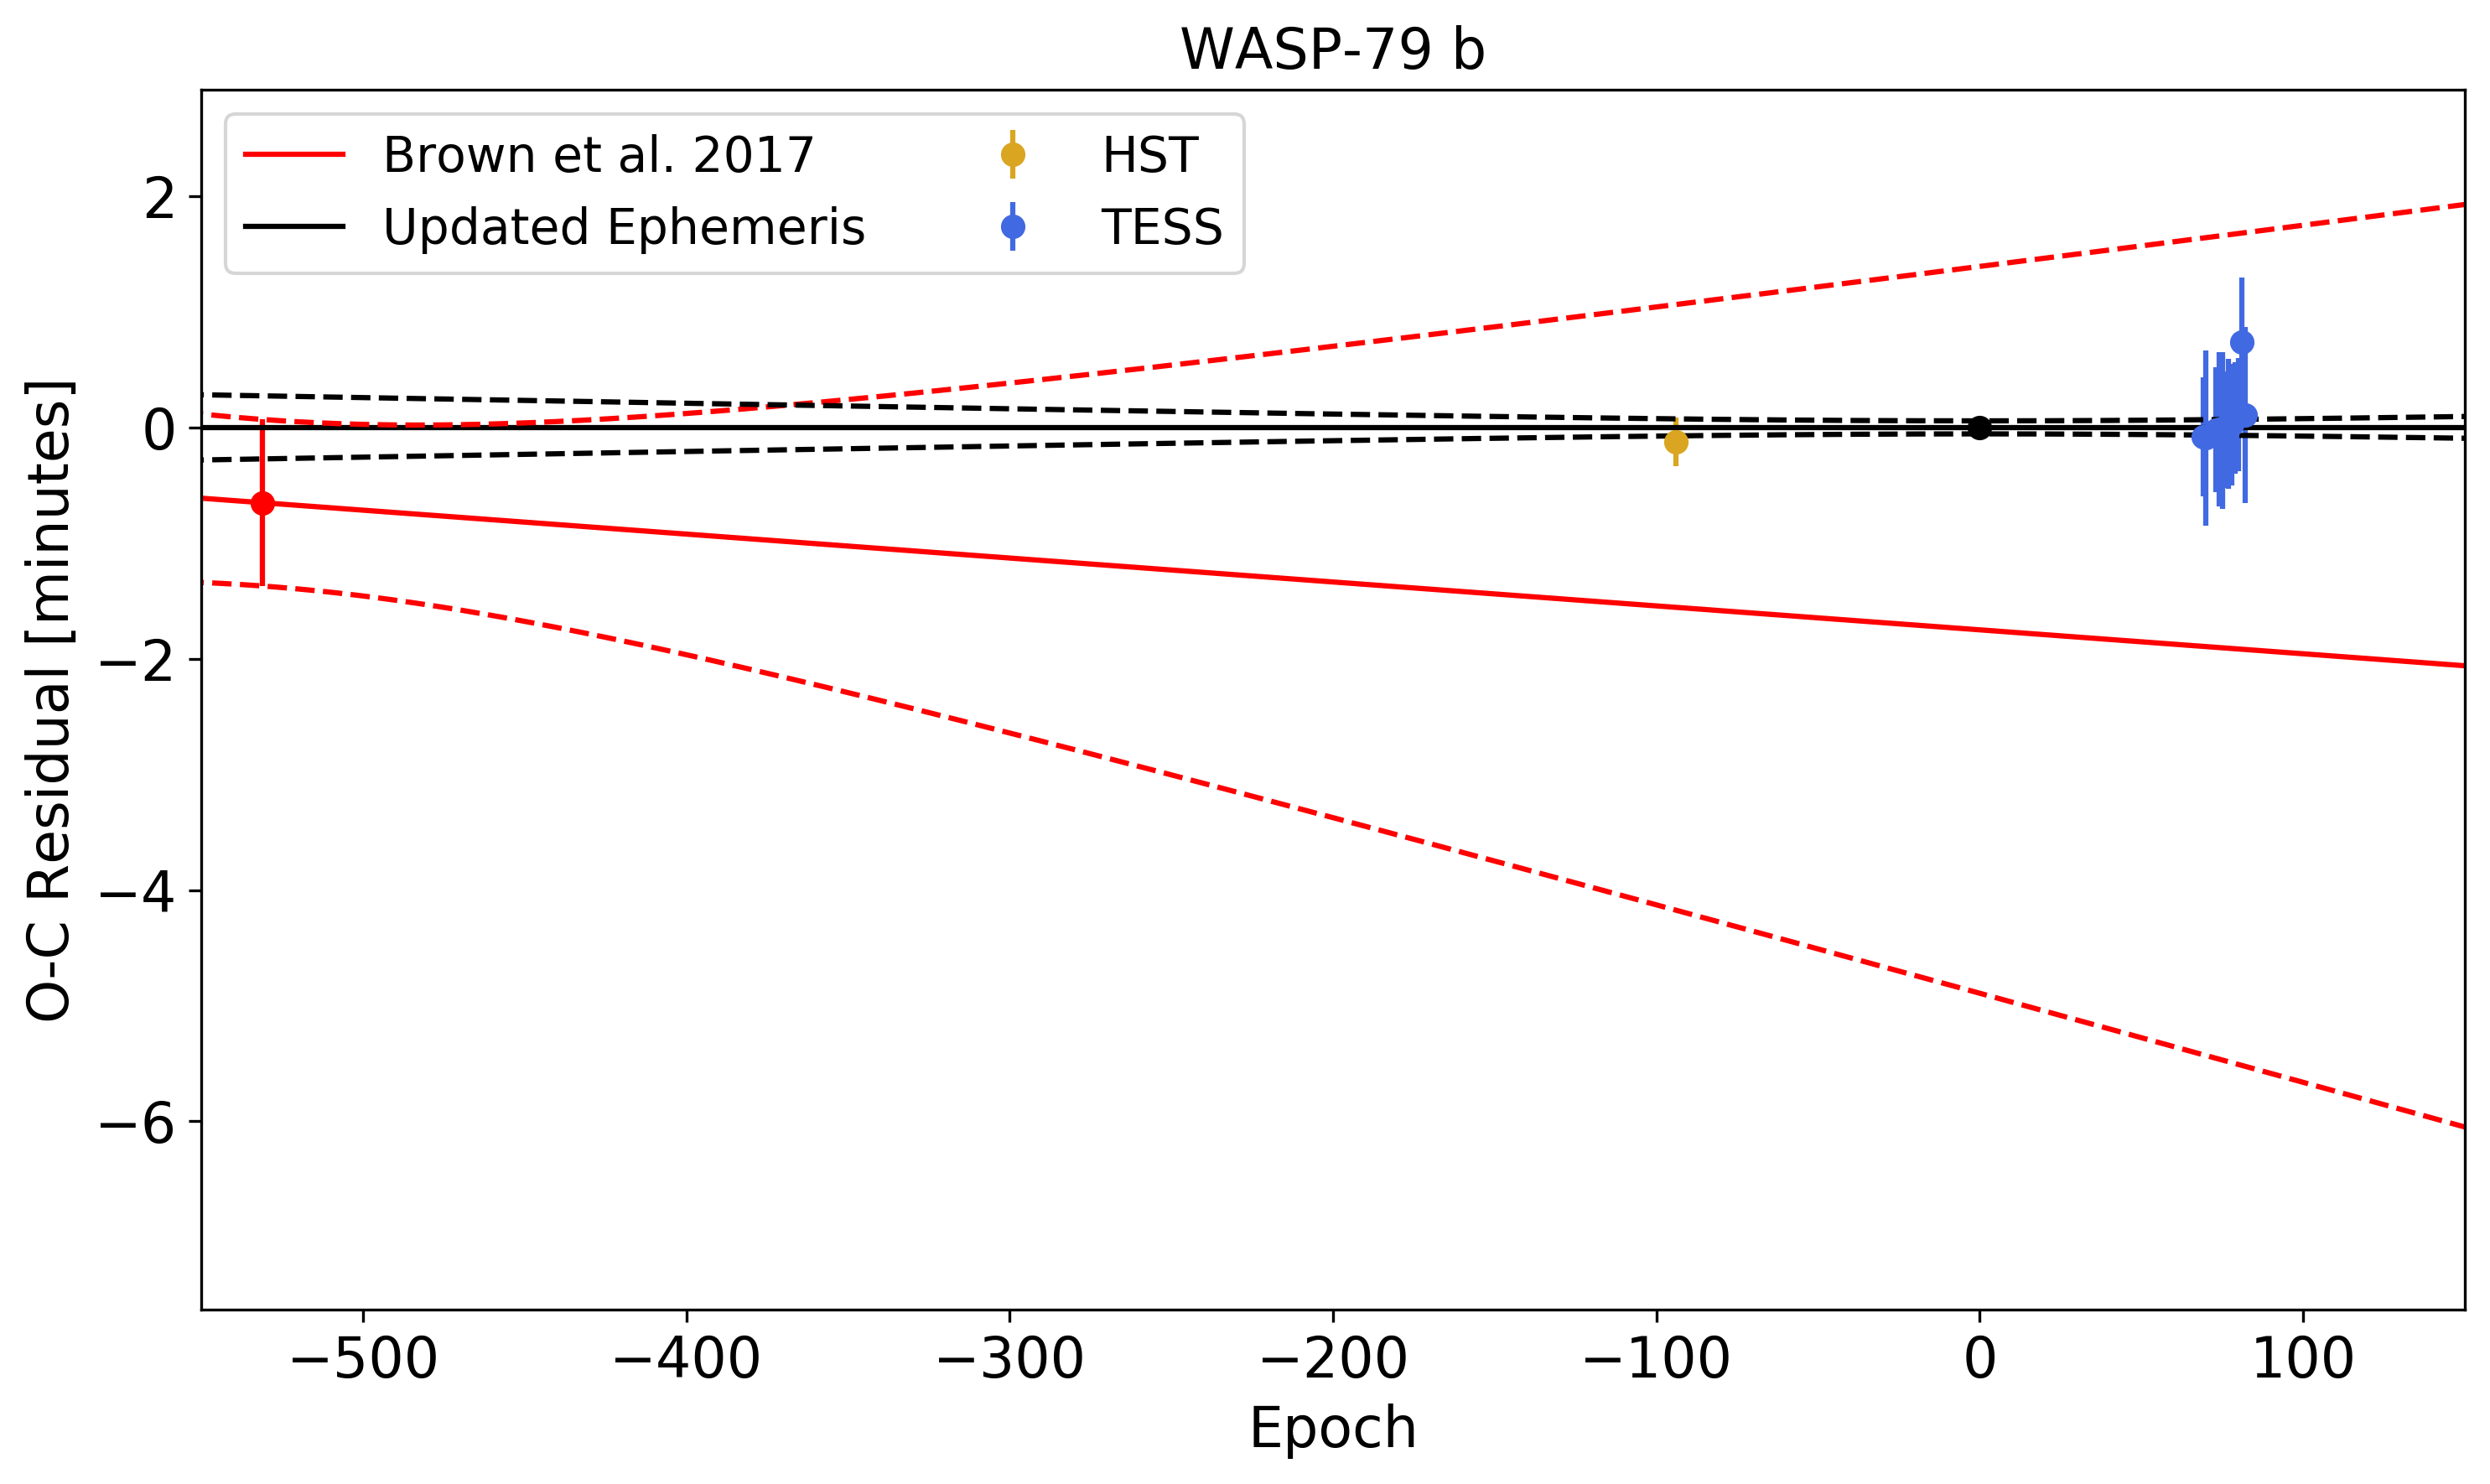
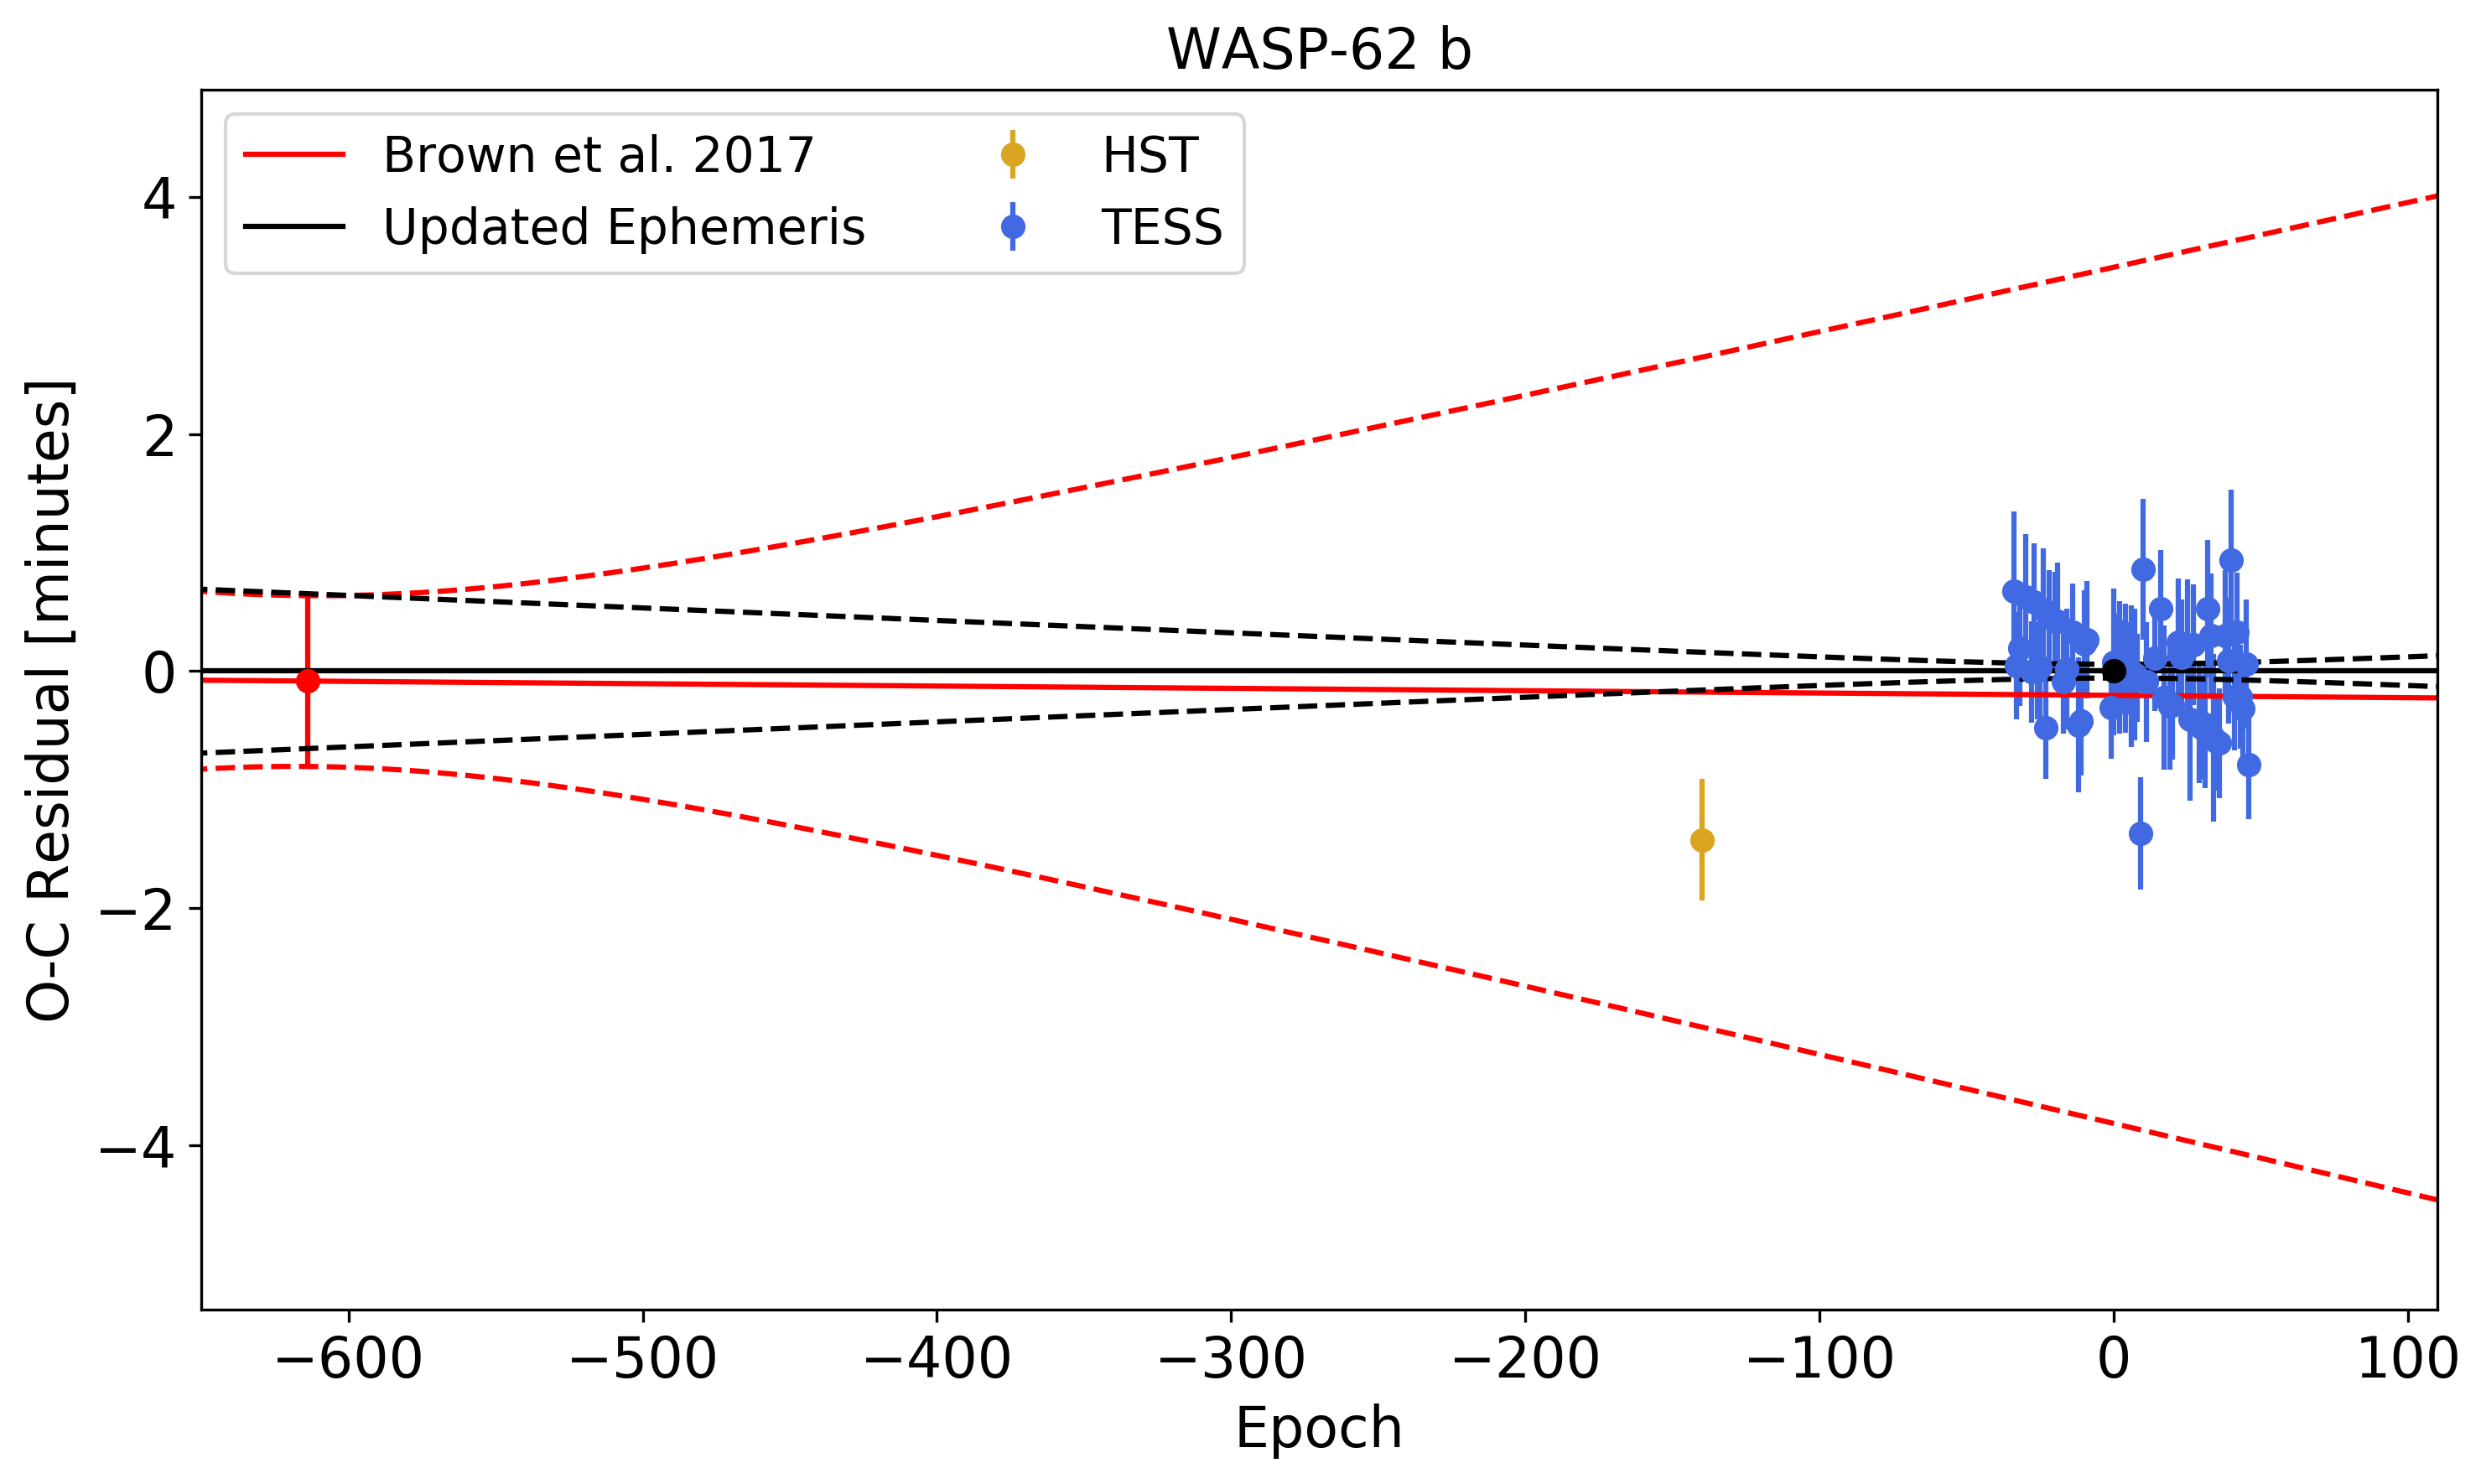
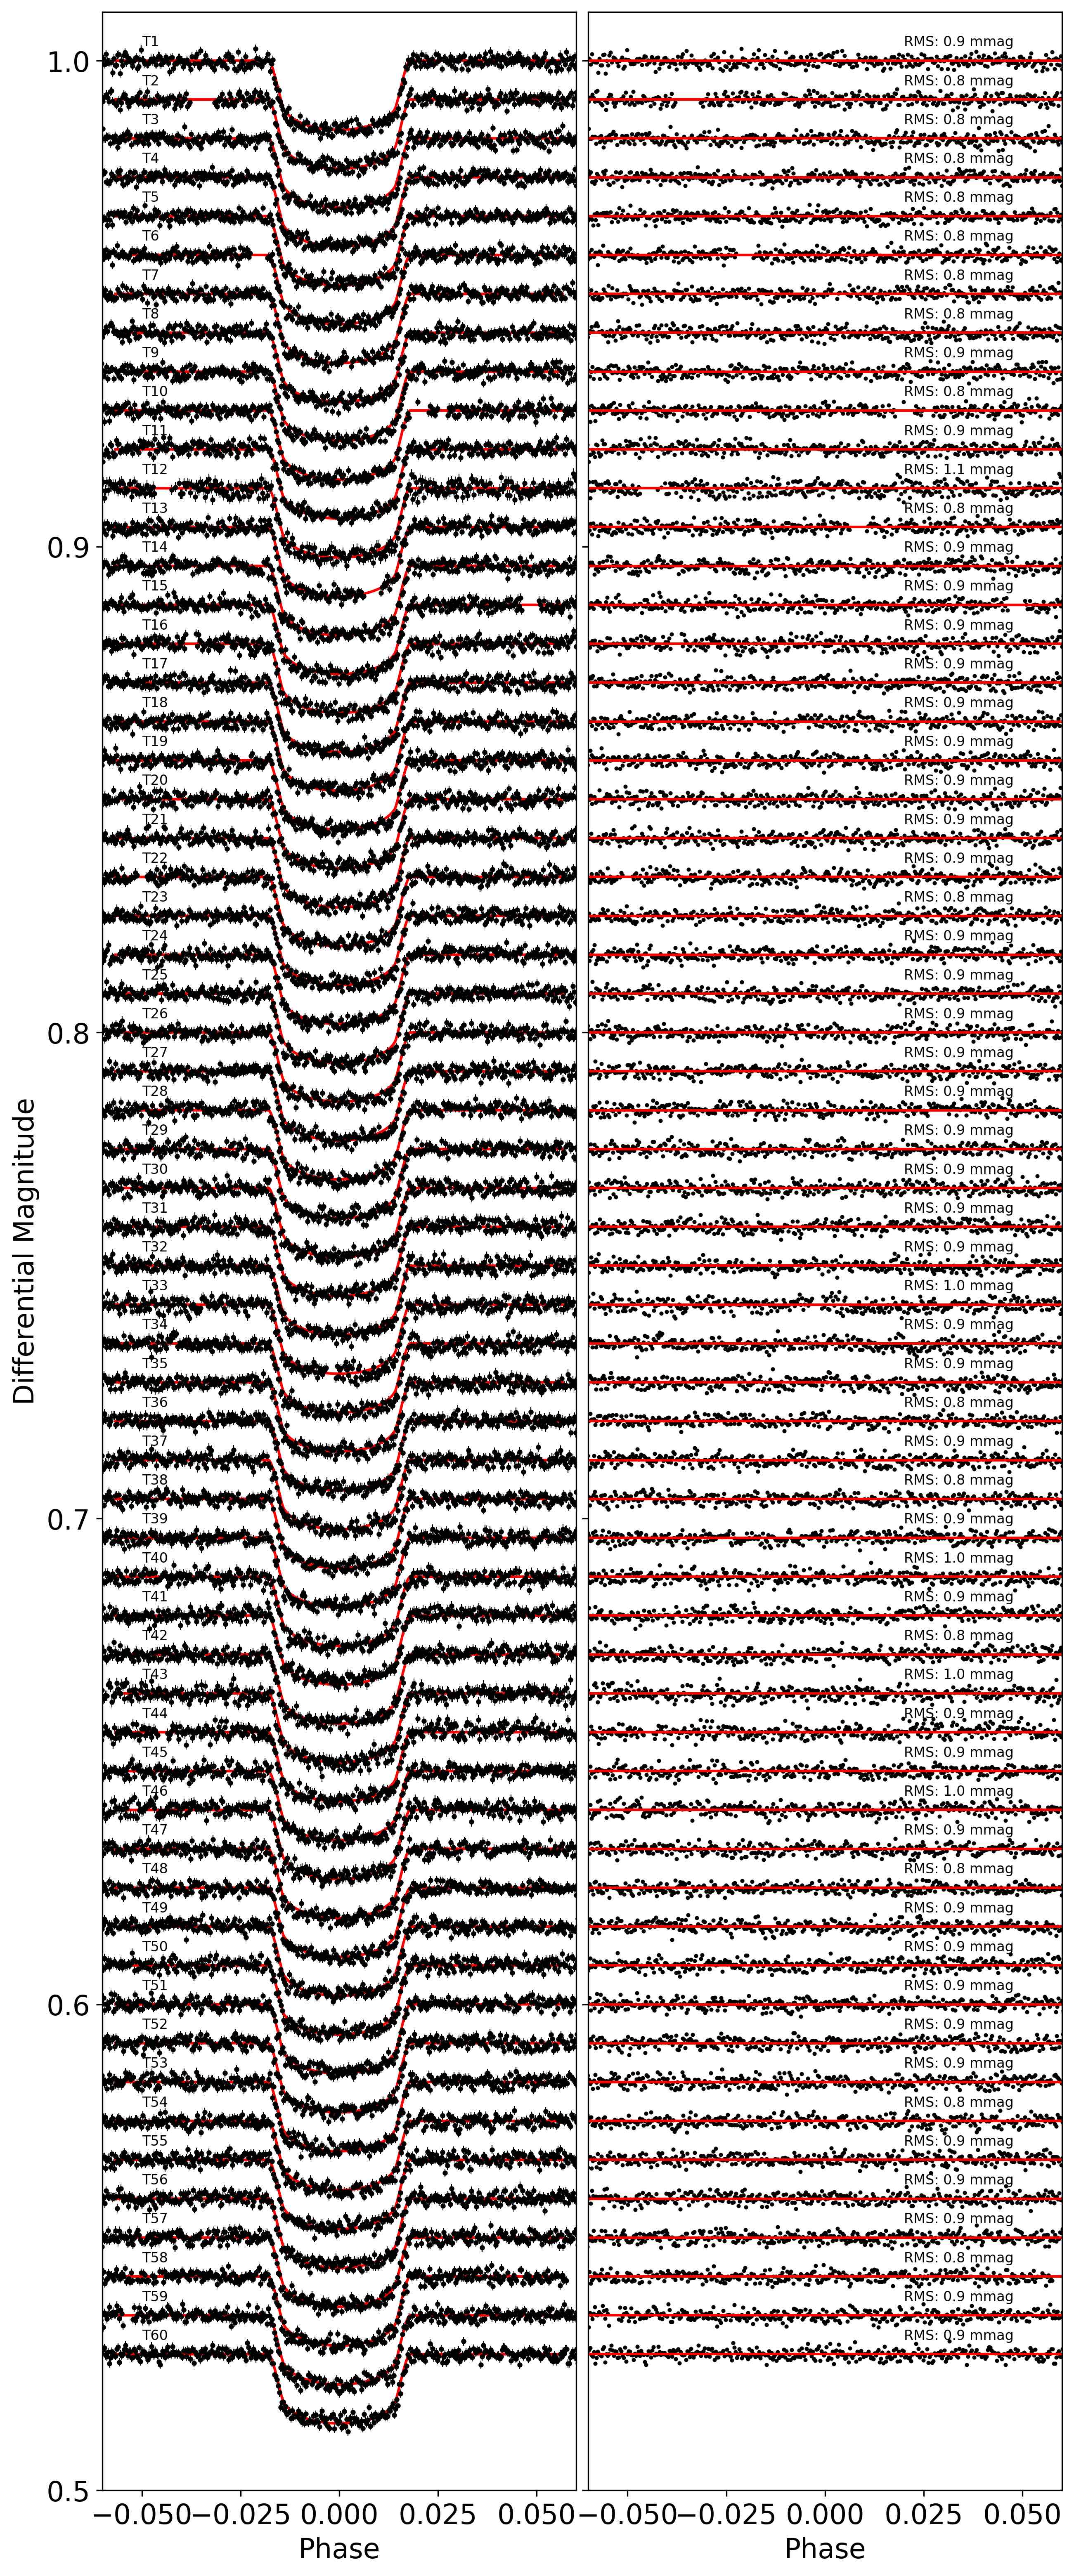
Accurate knowledge of exoplanet transit times is fundamental for atmospheric studies. To ensure the planets studied here can be observed in the future, we used our HST white light curve mid times, along with data from TESS (Ricker et al., 2014), to update the ephemeris of each planet. TESS data is publicly available through the MAST archive and we used the pipeline from Edwards et al. (2020b) to download, clean and fit the 2 minute cadence data. WASP-127 b had been studied in Sector 9; WASP-79 b in Sectors 4 and 5; and WASP-62 b in Sectors 1-4 and 6-13. After excluding bad data, we recovered 4, 12 and 60 transits for WASP-127 b, WASP-79 b and WASP 62b respectively. These were fitted individually with the planet-to-star radius ratio , reduced semi-major axis (), inclination () and transit mid time () as free parameters. Finally, we fitted a linear period (P) to these mid times and selected the updated transit mid time (T0) such that the co-variance between T0 and P was minimised. Mid times were converted to BJD using the tool from Eastman et al. (2010).
3 Results
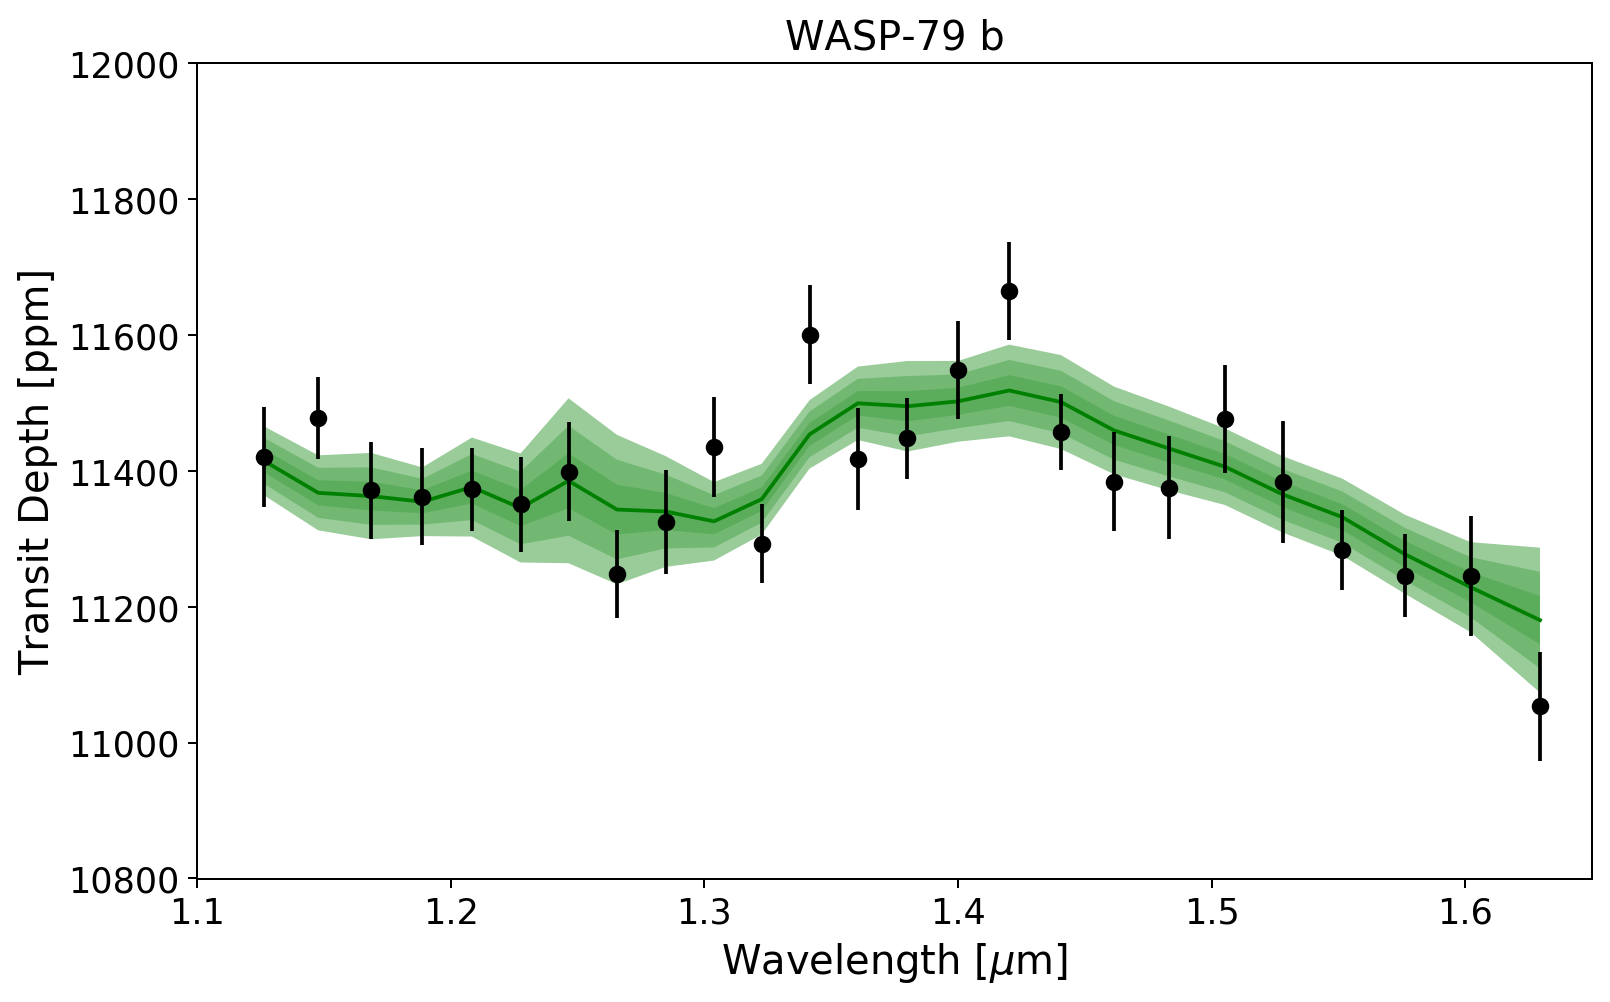
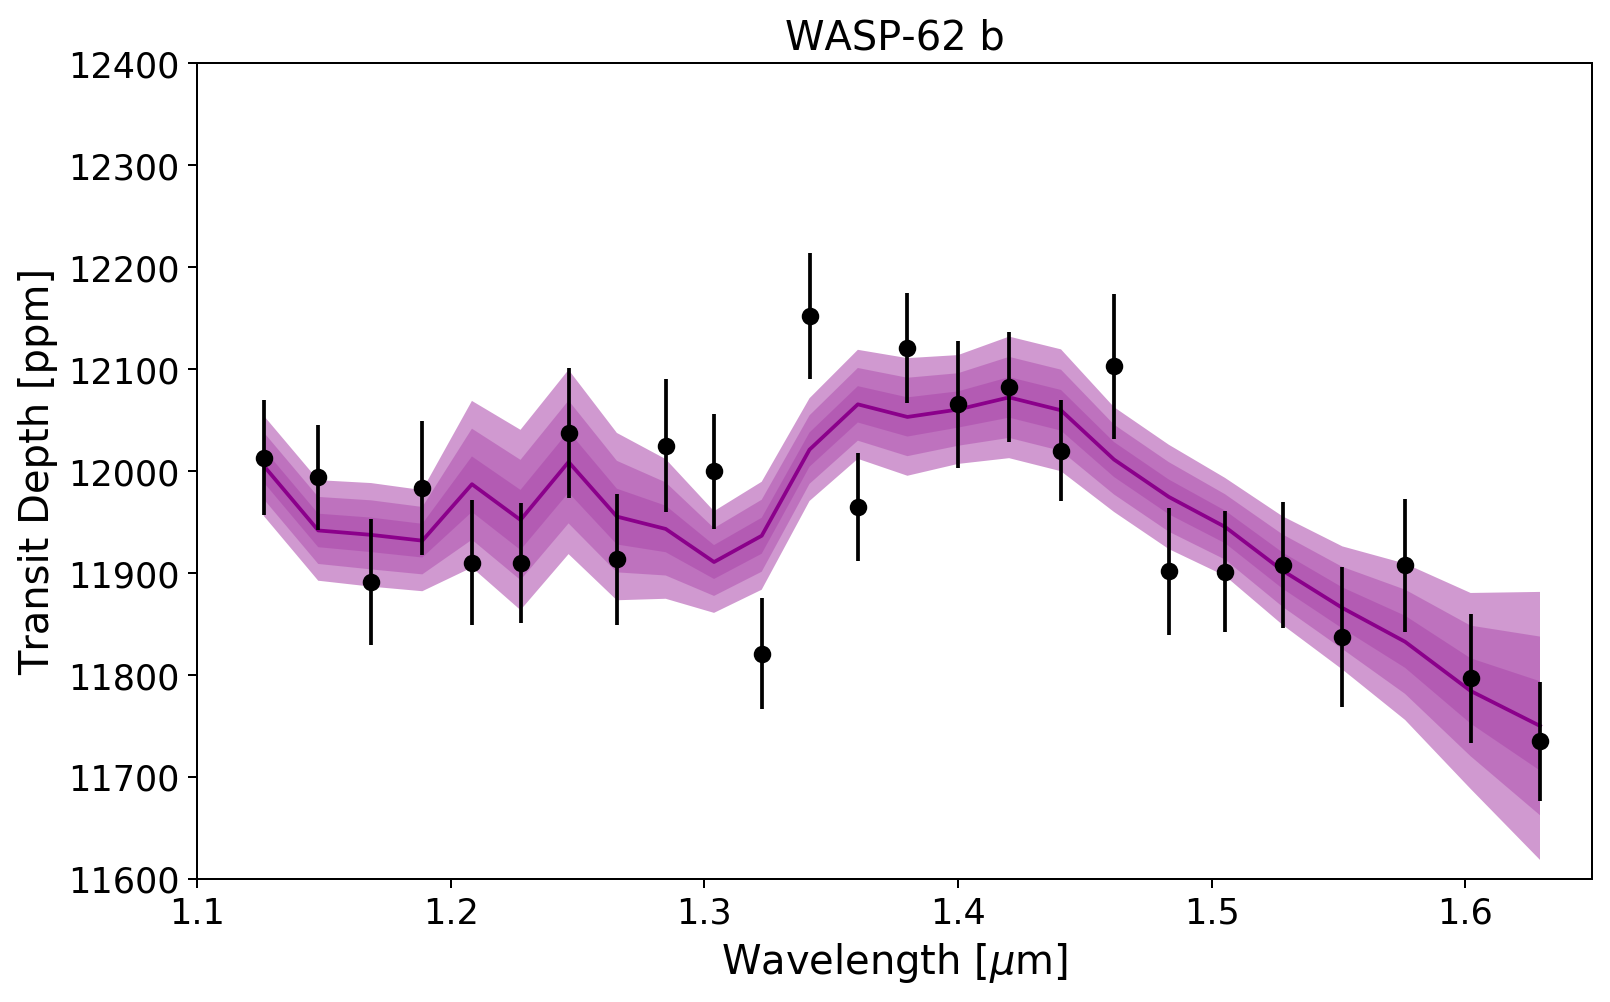
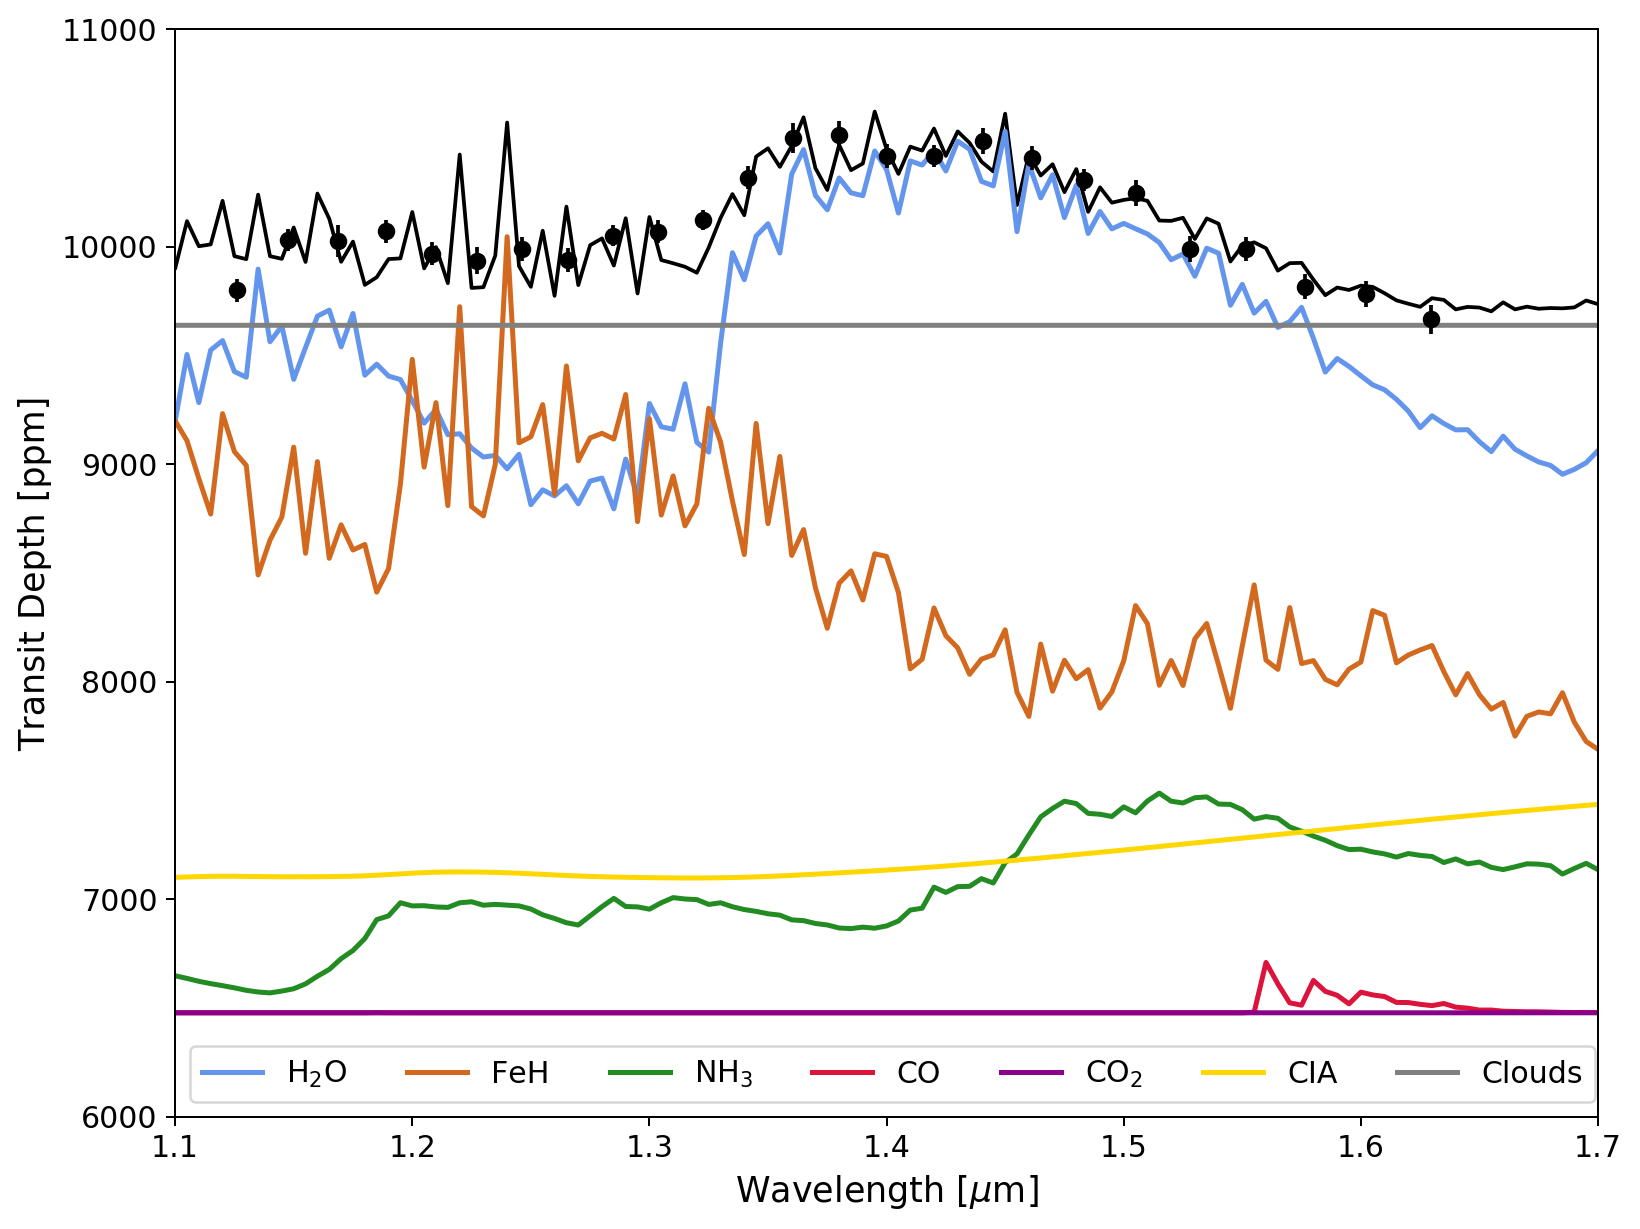
Each planet’s retrieval produced results consistent with the significant presence of water vapour, with opaque clouds in two of the three planets. While we did attempt to retrieve the carbon-based molecules, CO, CO2, and CH4, only their upper value could be constrained as they lack strong absorption features in the G141 wavelength range. In each case our best-fit solution also indicates the presence of FeH, with abundances of log(FeH) between -3.04 and -5.25.
The relatively high water abundances retrieved (10-2-10-3) for these three planets can be suggestive of metallicities in the super-solar regime (Madhusudhan, 2012; Pinhas et al., 2018; Charnay et al., 2018). However, there are known degeneracies between the the cloud pressure, Pa radius and water abundance retrieved from WFC3 data (Griffith, 2014; Heng & Kitzmann, 2017). Additionally, due to the restrictions of the WFC3 wavelength ranges, these observations are not generally sensitive to the main carbon bearing species and arguments of high metallicities are usually based on retrieved water abundances alone, assuming that half of the oxygen is in H2O as expected for a solar C/O ratio at high temperatures (Madhusudhan, 2012). Hence, observations covering longer wavelength ranges are needed to further constrain the C/O ratios of these planets, to fully understand their metallicity.
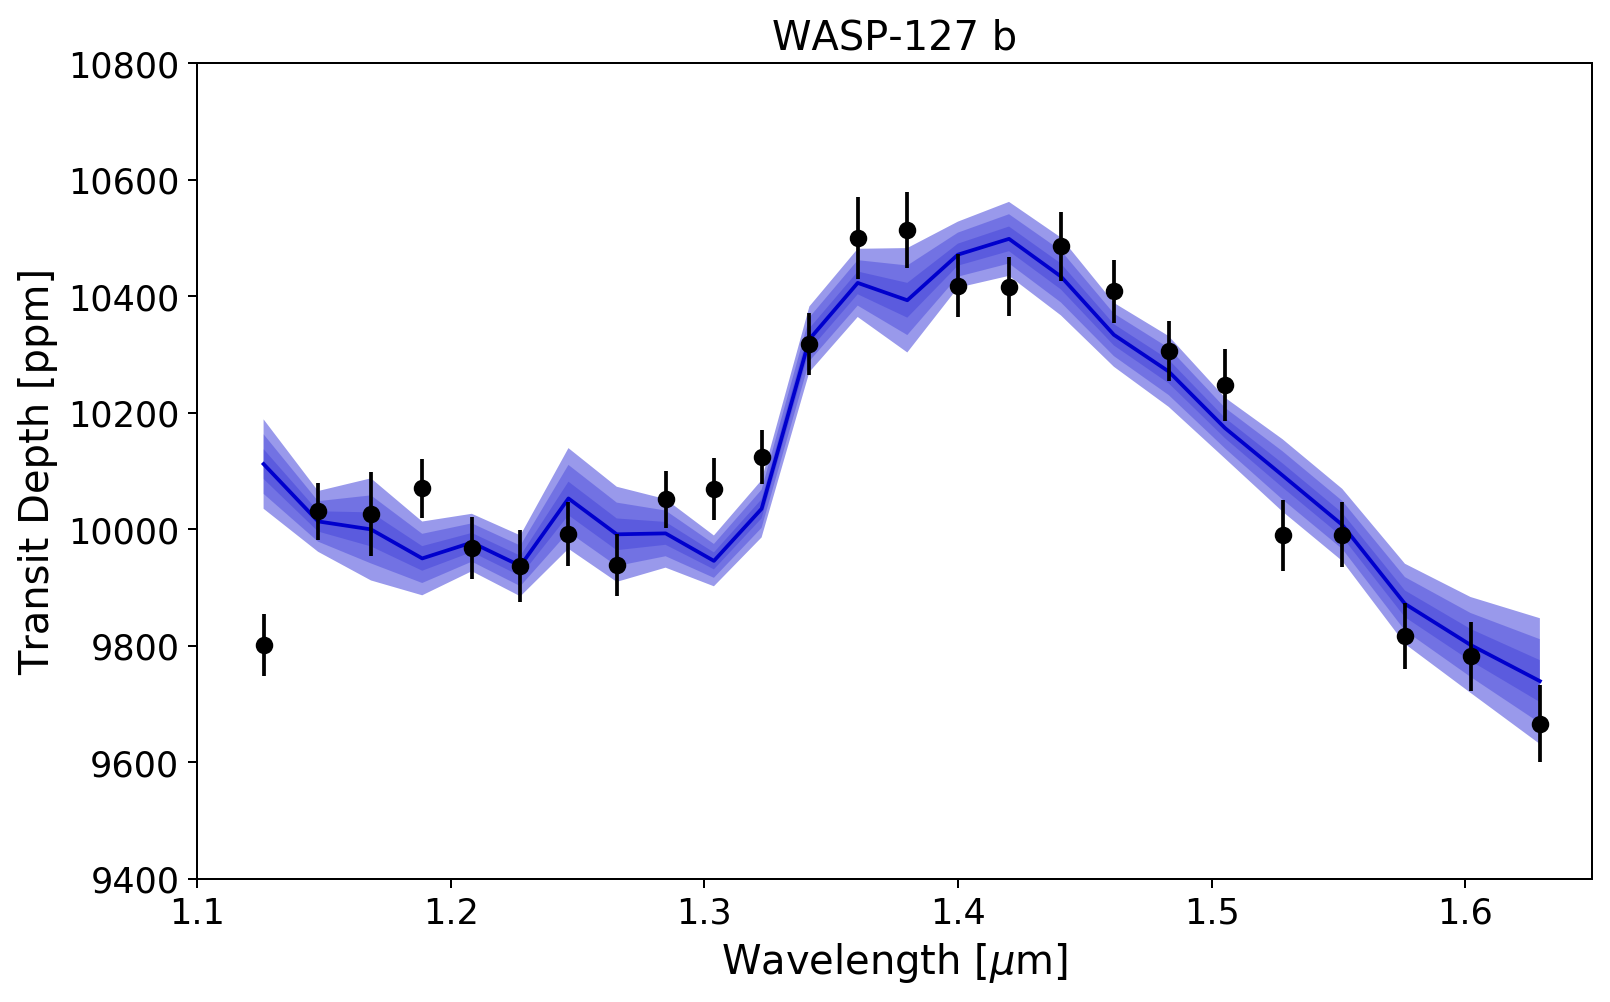
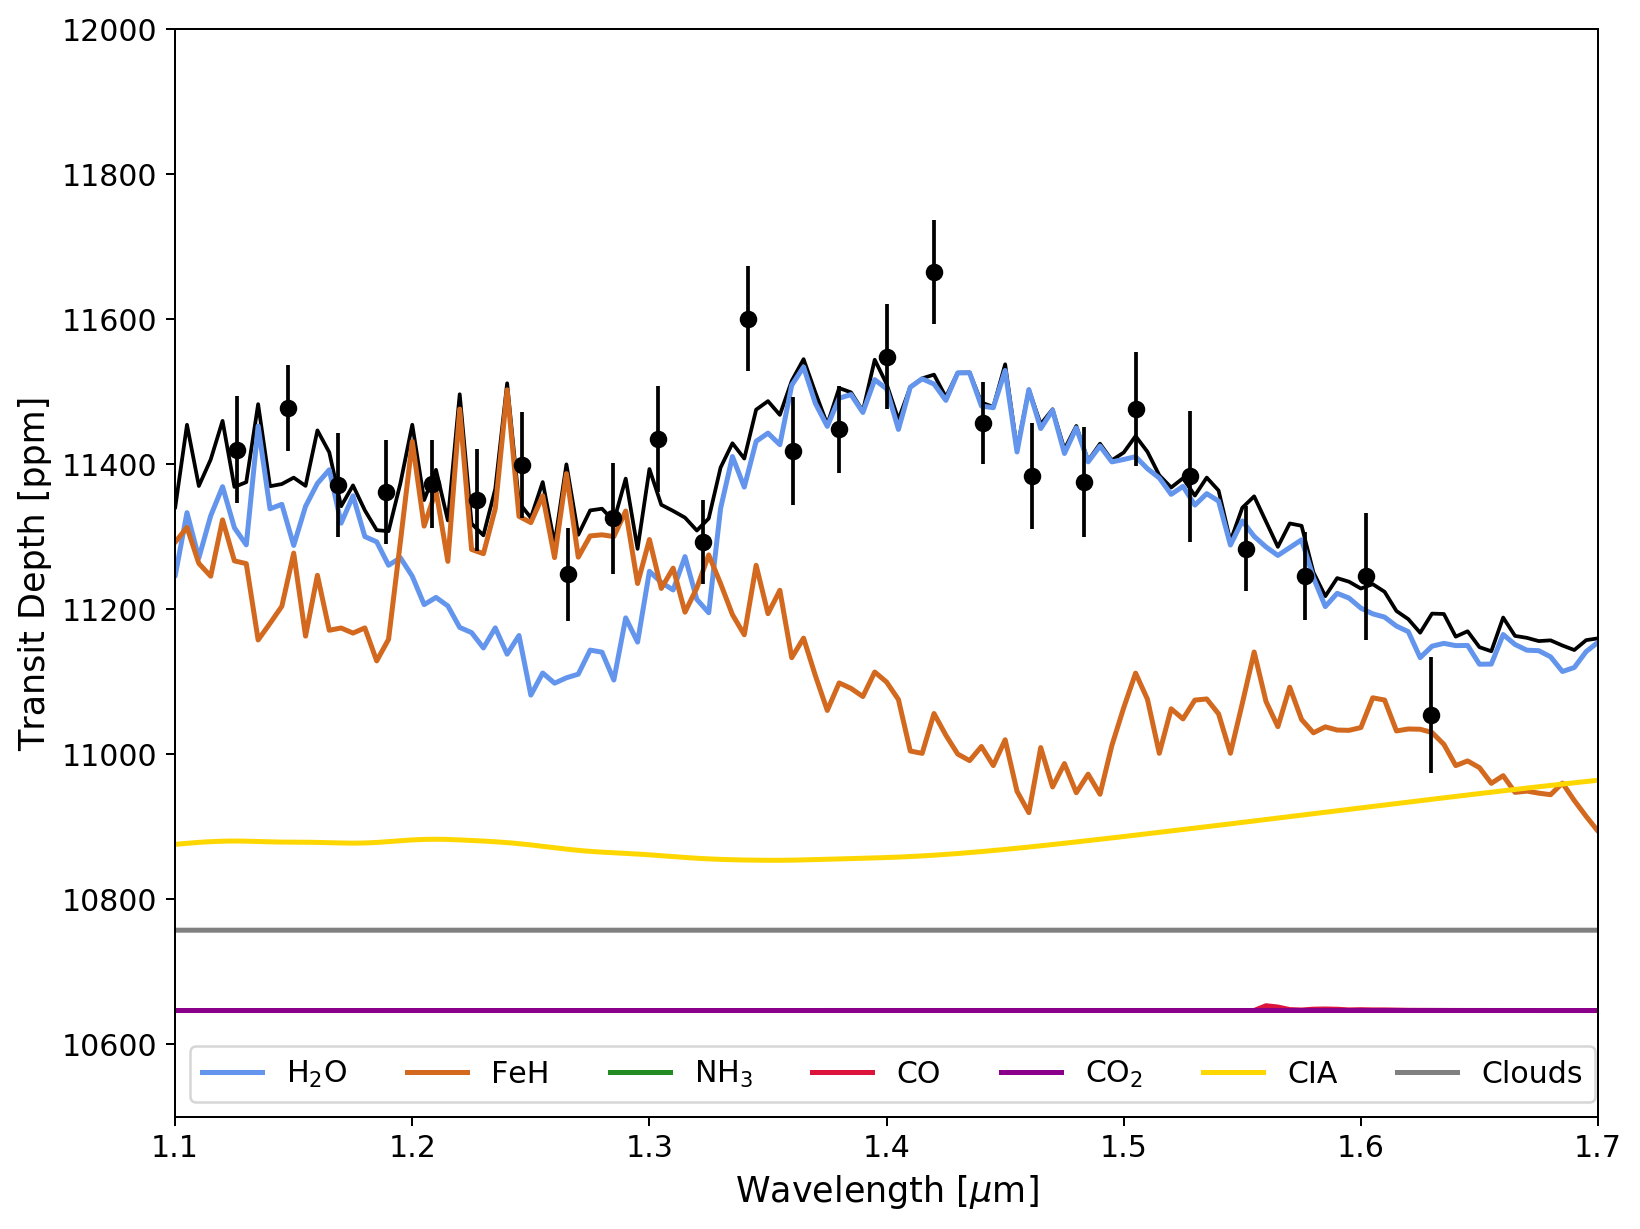
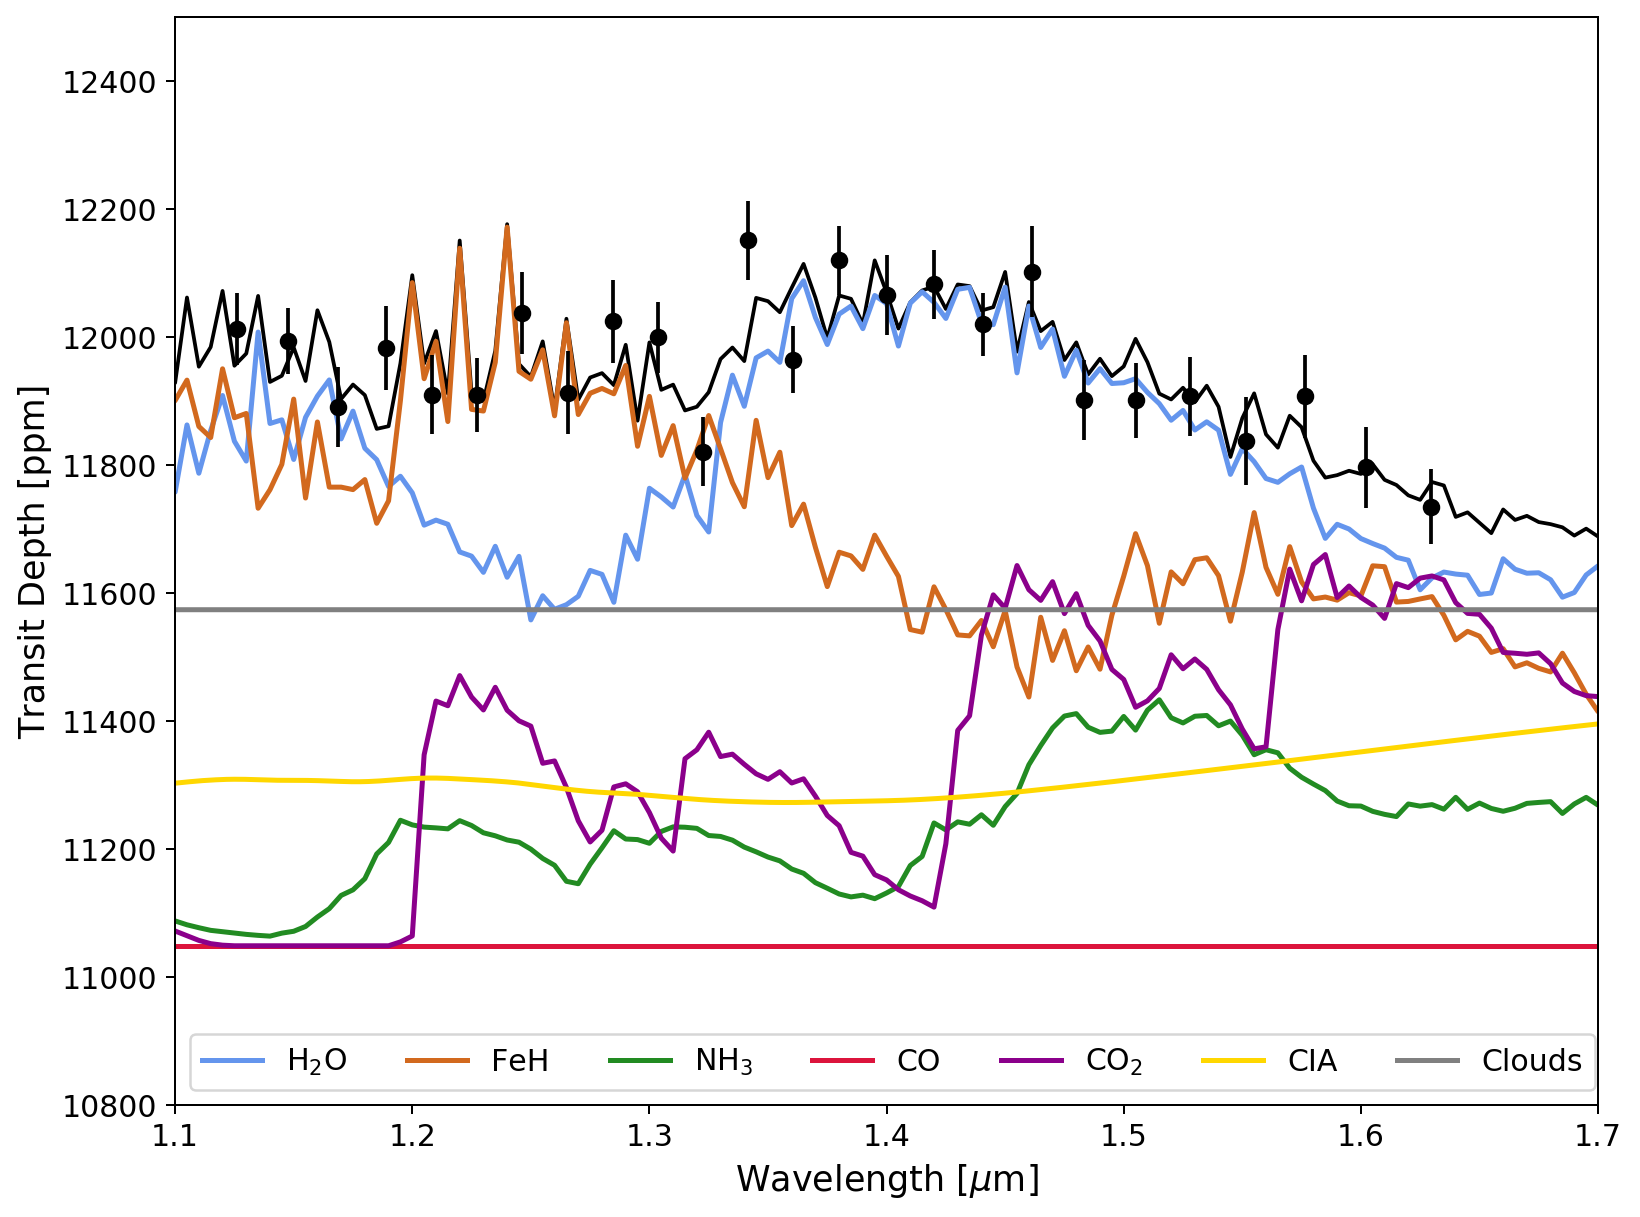
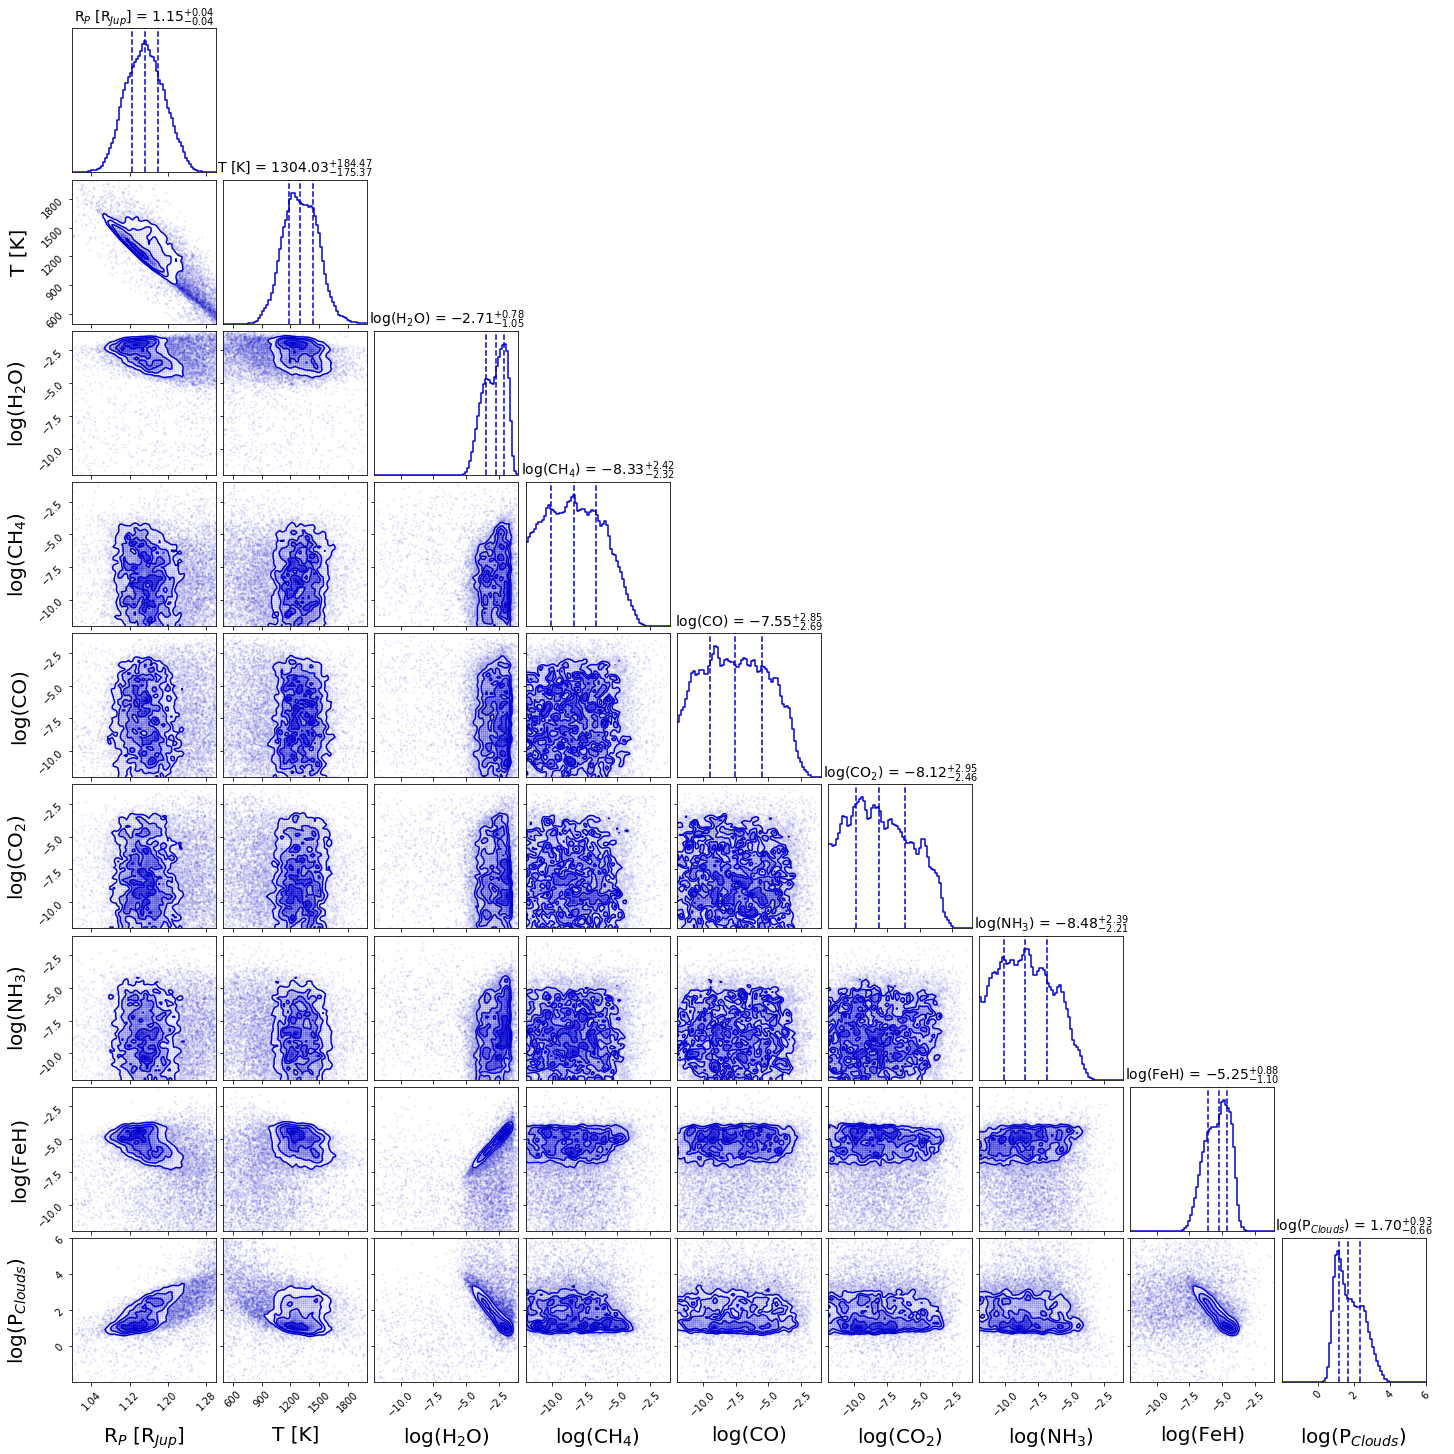
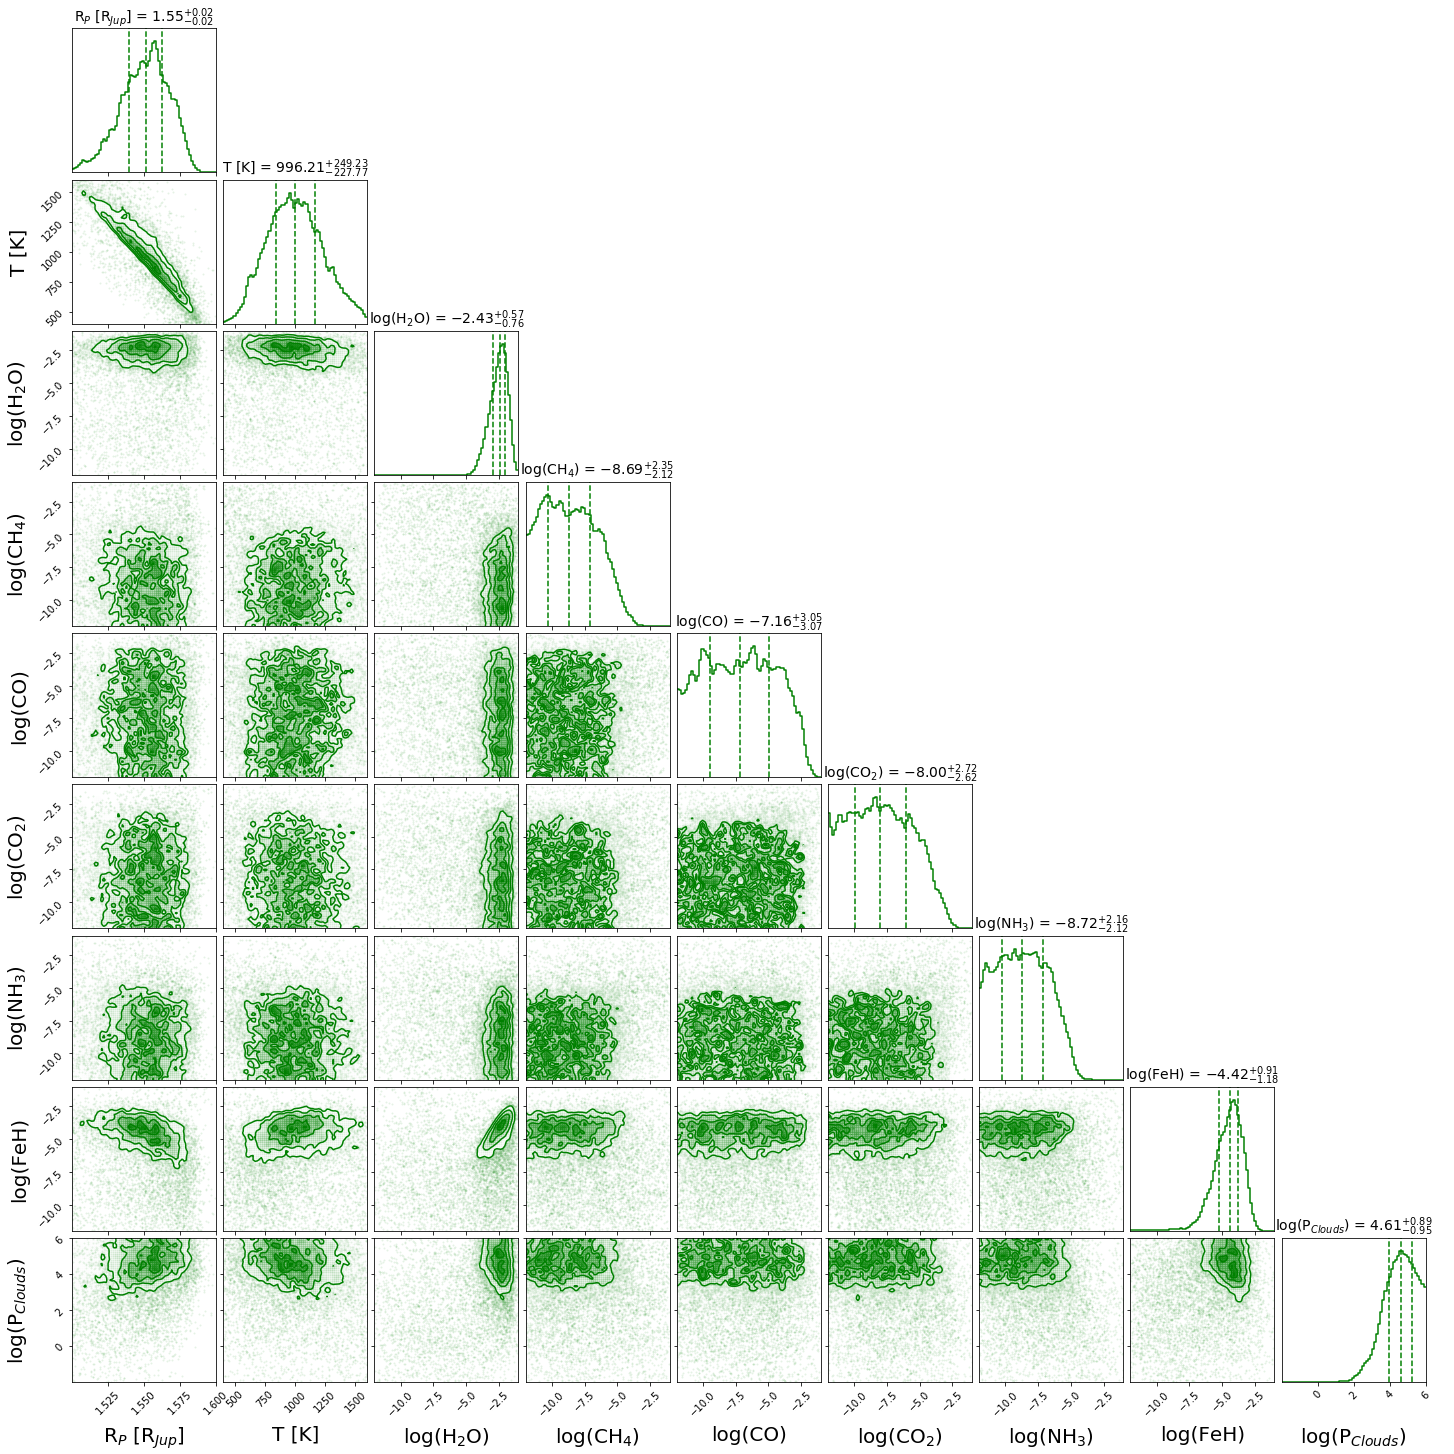
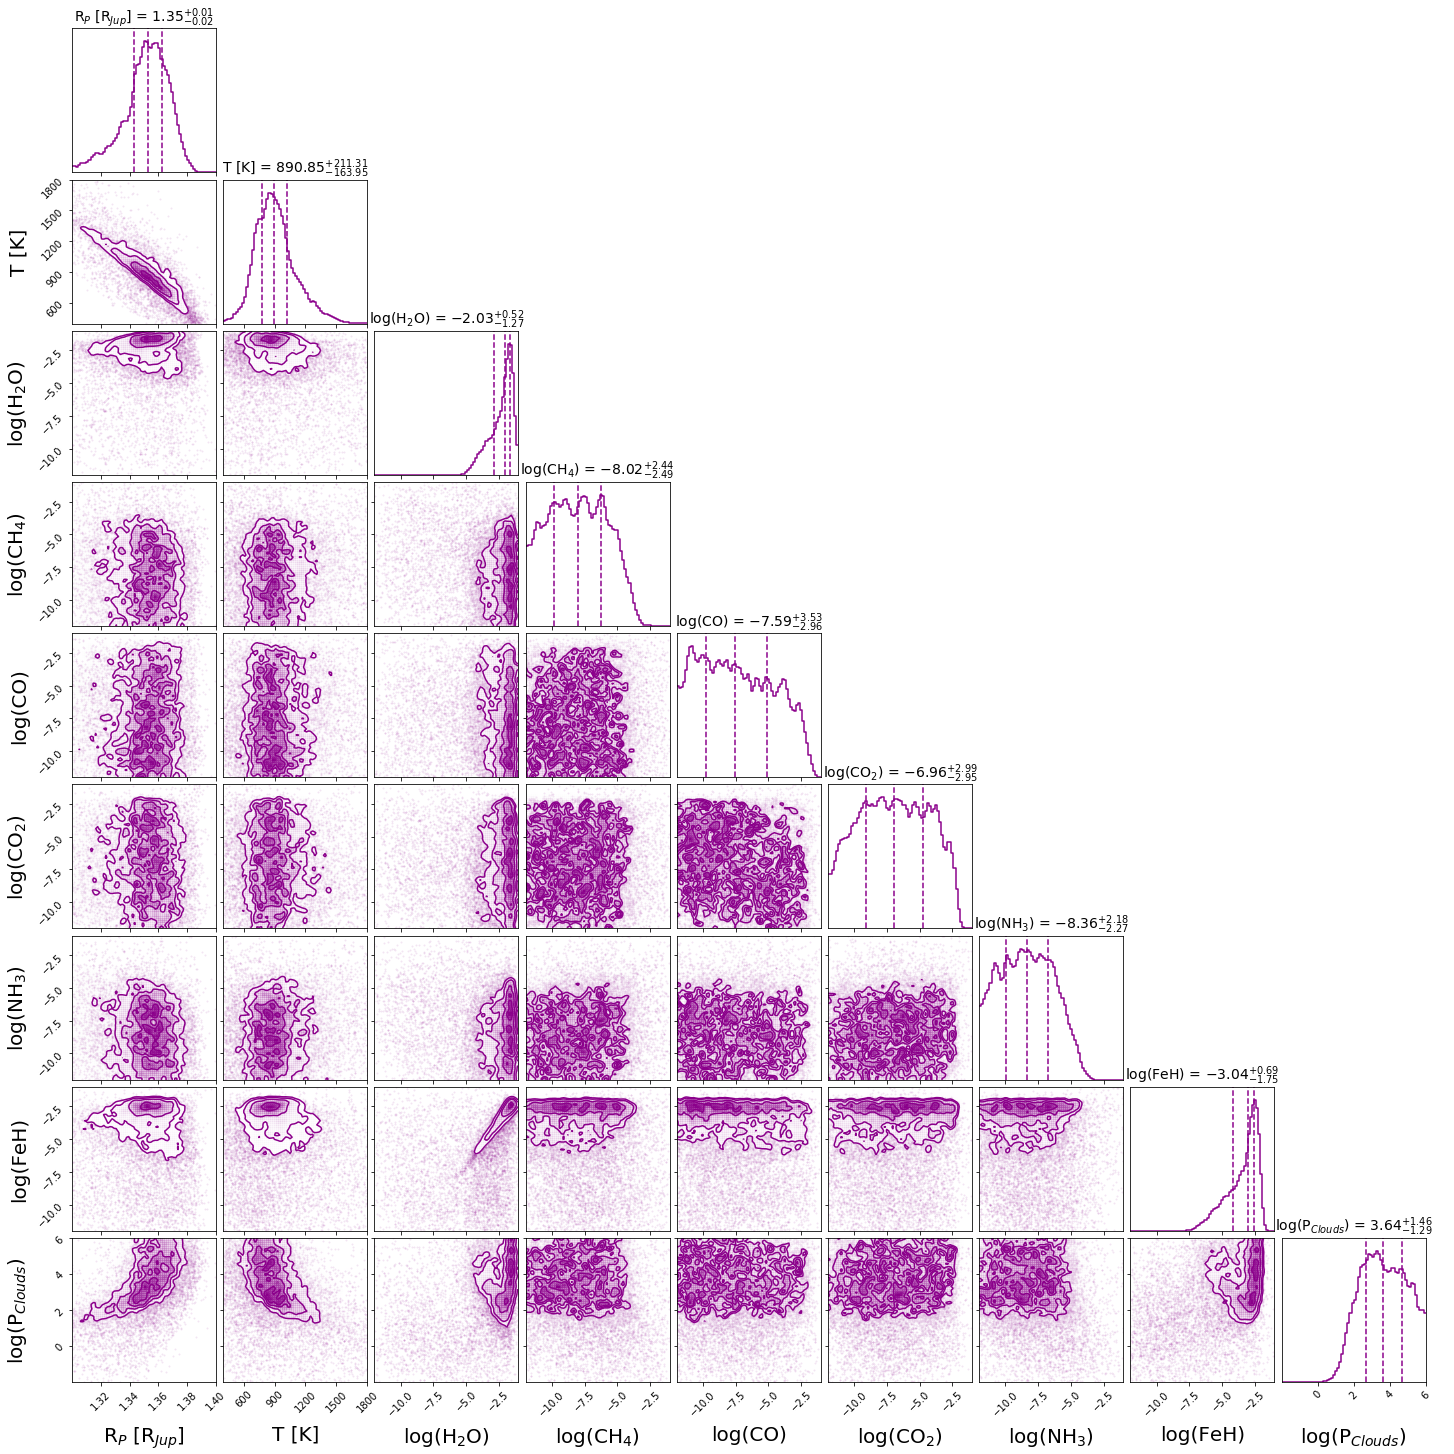
Our findings are shown in Table 3, with Figure 5 showcasing all three retrieved spectra with the corresponding contributions for each opacity source in Figure 6. For WASP-127 b, the posteriors are shown in Figure 7, with equivalent results for WASP-79 b in Figure 8 for WASP-62 b in Figure 9.
| Retrieved Parameters | Bounds | WASP-127 b | WASP-79 b | WASP-62 b |
|---|---|---|---|---|
| 1e-12 - 1e-1 | ||||
| 1e-12 - 1e-1 | ||||
| 1e-12 - 1e-1 | ||||
| 1e-12 - 1e-1 | ||||
| 1e-12 - 1e-1 | ||||
| 1e-12 - 1e-1 | ||||
| [K] | 400-2500 | |||
| 50% | ||||
| 1e-2 - 1e6 | ||||
| (derived) | ||||
| ADI | - | 167.9 | 17.1 | 16.2 |
| -level | - | |||
| Updated Ephemeris | ||||
| P [days] | - | 4.17806191.3x10-6 | 3.662393443.5x10-7 | 4.411940147.4x10-7 |
| T0 [BJDTDB-2450000] | - | 8238.9433675.5x10-5 | 8160.1869683.9x10-5 | 8476.0846024.0x10-5 |
3.1 WASP-127 b
As expected given the low density, we retrieved a statistically significant atmosphere around WASP-127 b with a strong detection of water and opaque clouds. The retrieved radius is 1.16 RJ at a pressure of 10 bar, which is smaller than stated in previous studies (1.37 RJ, Chen, G. et al. (2018)). However, our analysis is best fit with high altitude opaque clouds (log(Pclouds) = 1.85 Pa), which corresponds to approximately 1.37 RJ, thus explaining this difference between the retrieved radius and the radius in the literature.
In terms of chemistry, our best fit solution indicates significant amounts of water at log(H2O)= -2.71, and constraints on FeH. FeH produces the flat absorption between 1.2 and 1.3 m, whilst deepening the slope in the longer wavelengths (around 1.5 - 1.6 m). We also note a correlation between the amount of these two molecules, the radius and the cloud pressure. For less H2O and FeH, the model requires deeper clouds, but a higher base planet radius. In particular, the abundance of FeH can vary from to , depending the complementary contribution of clouds.
The posteriors for FeH are, however, always distinct; clouds cannot be used to completely replace the additional visible absorption provided by FeH. A lower metallicity, and larger radius, could be consistent with current data, but is not the best-fit solution. Given the posterior distribution, we don’t find a clear correlation between the radius and the water abundance.
3.2 WASP-79 b
For WASP-79 b, we get very similar results to those of WASP-127 b, with the exception of the cloud deck. Following our baseline approach, we find a large abundance of water at log(H2O)= -2.43 and well defined constraints on the abundance of FeH with log(FeH)= -4.42. The clouds, however, do not impact the model, and we only retrieve a lower limit on their top pressure (Pclouds > Pa). This means that either the planet possesses a clear atmosphere, or that the clouds are located below the visible pressure, at which the atmosphere is opaque due to molecular or collision induced absorption. We do not detect signatures of CH4, CO, or CO2. The retrieved temperature of 1000 K is lower than the calculated equilibrium temperature for this type of planet; this was also found in Sotzen et al. (2019) and is discussed further in Section 4.
3.3 WASP-62 b
The recovered spectrum of WASP-62 b was flatter than the two other planets. However, we found that the data was best explained by the presence of H2O and FeH and, for this retrieval, the recovered abundances are log(H2O)=-2.03 and log(FeH)=-3.04. These results stem from detections in the lower-wavelength spectrum, below 1.5 m, which guides the retrieval towards non-fully opaque sources, such as clouds and high-radius solutions. Again, the retrieved temperature is lower than the expected 1475 K equilibrium temperature, which is indicative of a large day-night temperature contrast and/or efficient cooling mechanisms. Our analysis indicates that clouds are likely to be present, but the quality of our data means that we cannot completely rule out a clear atmosphere.
The retrieved abundances are very high, but we note that the posteriors allow for a wide range of abundances and present interesting correlations; such as, the lower the abundance of H2O and FeH are, the higher in the atmosphere the clouds are located. There is also a negative correlation between the molecular abundances and the temperature and, from the posterior distributions, we see that the data is consistent with abundances of order of in H2O and FeH.
Finally, we note that given the low spectral variations in this spectrum, the retrieval may lack a scale height constraint, which would provide a relevant baseline in predicting the molecular abundances and temperature more accurately.
3.4 Ephemeris Refinement
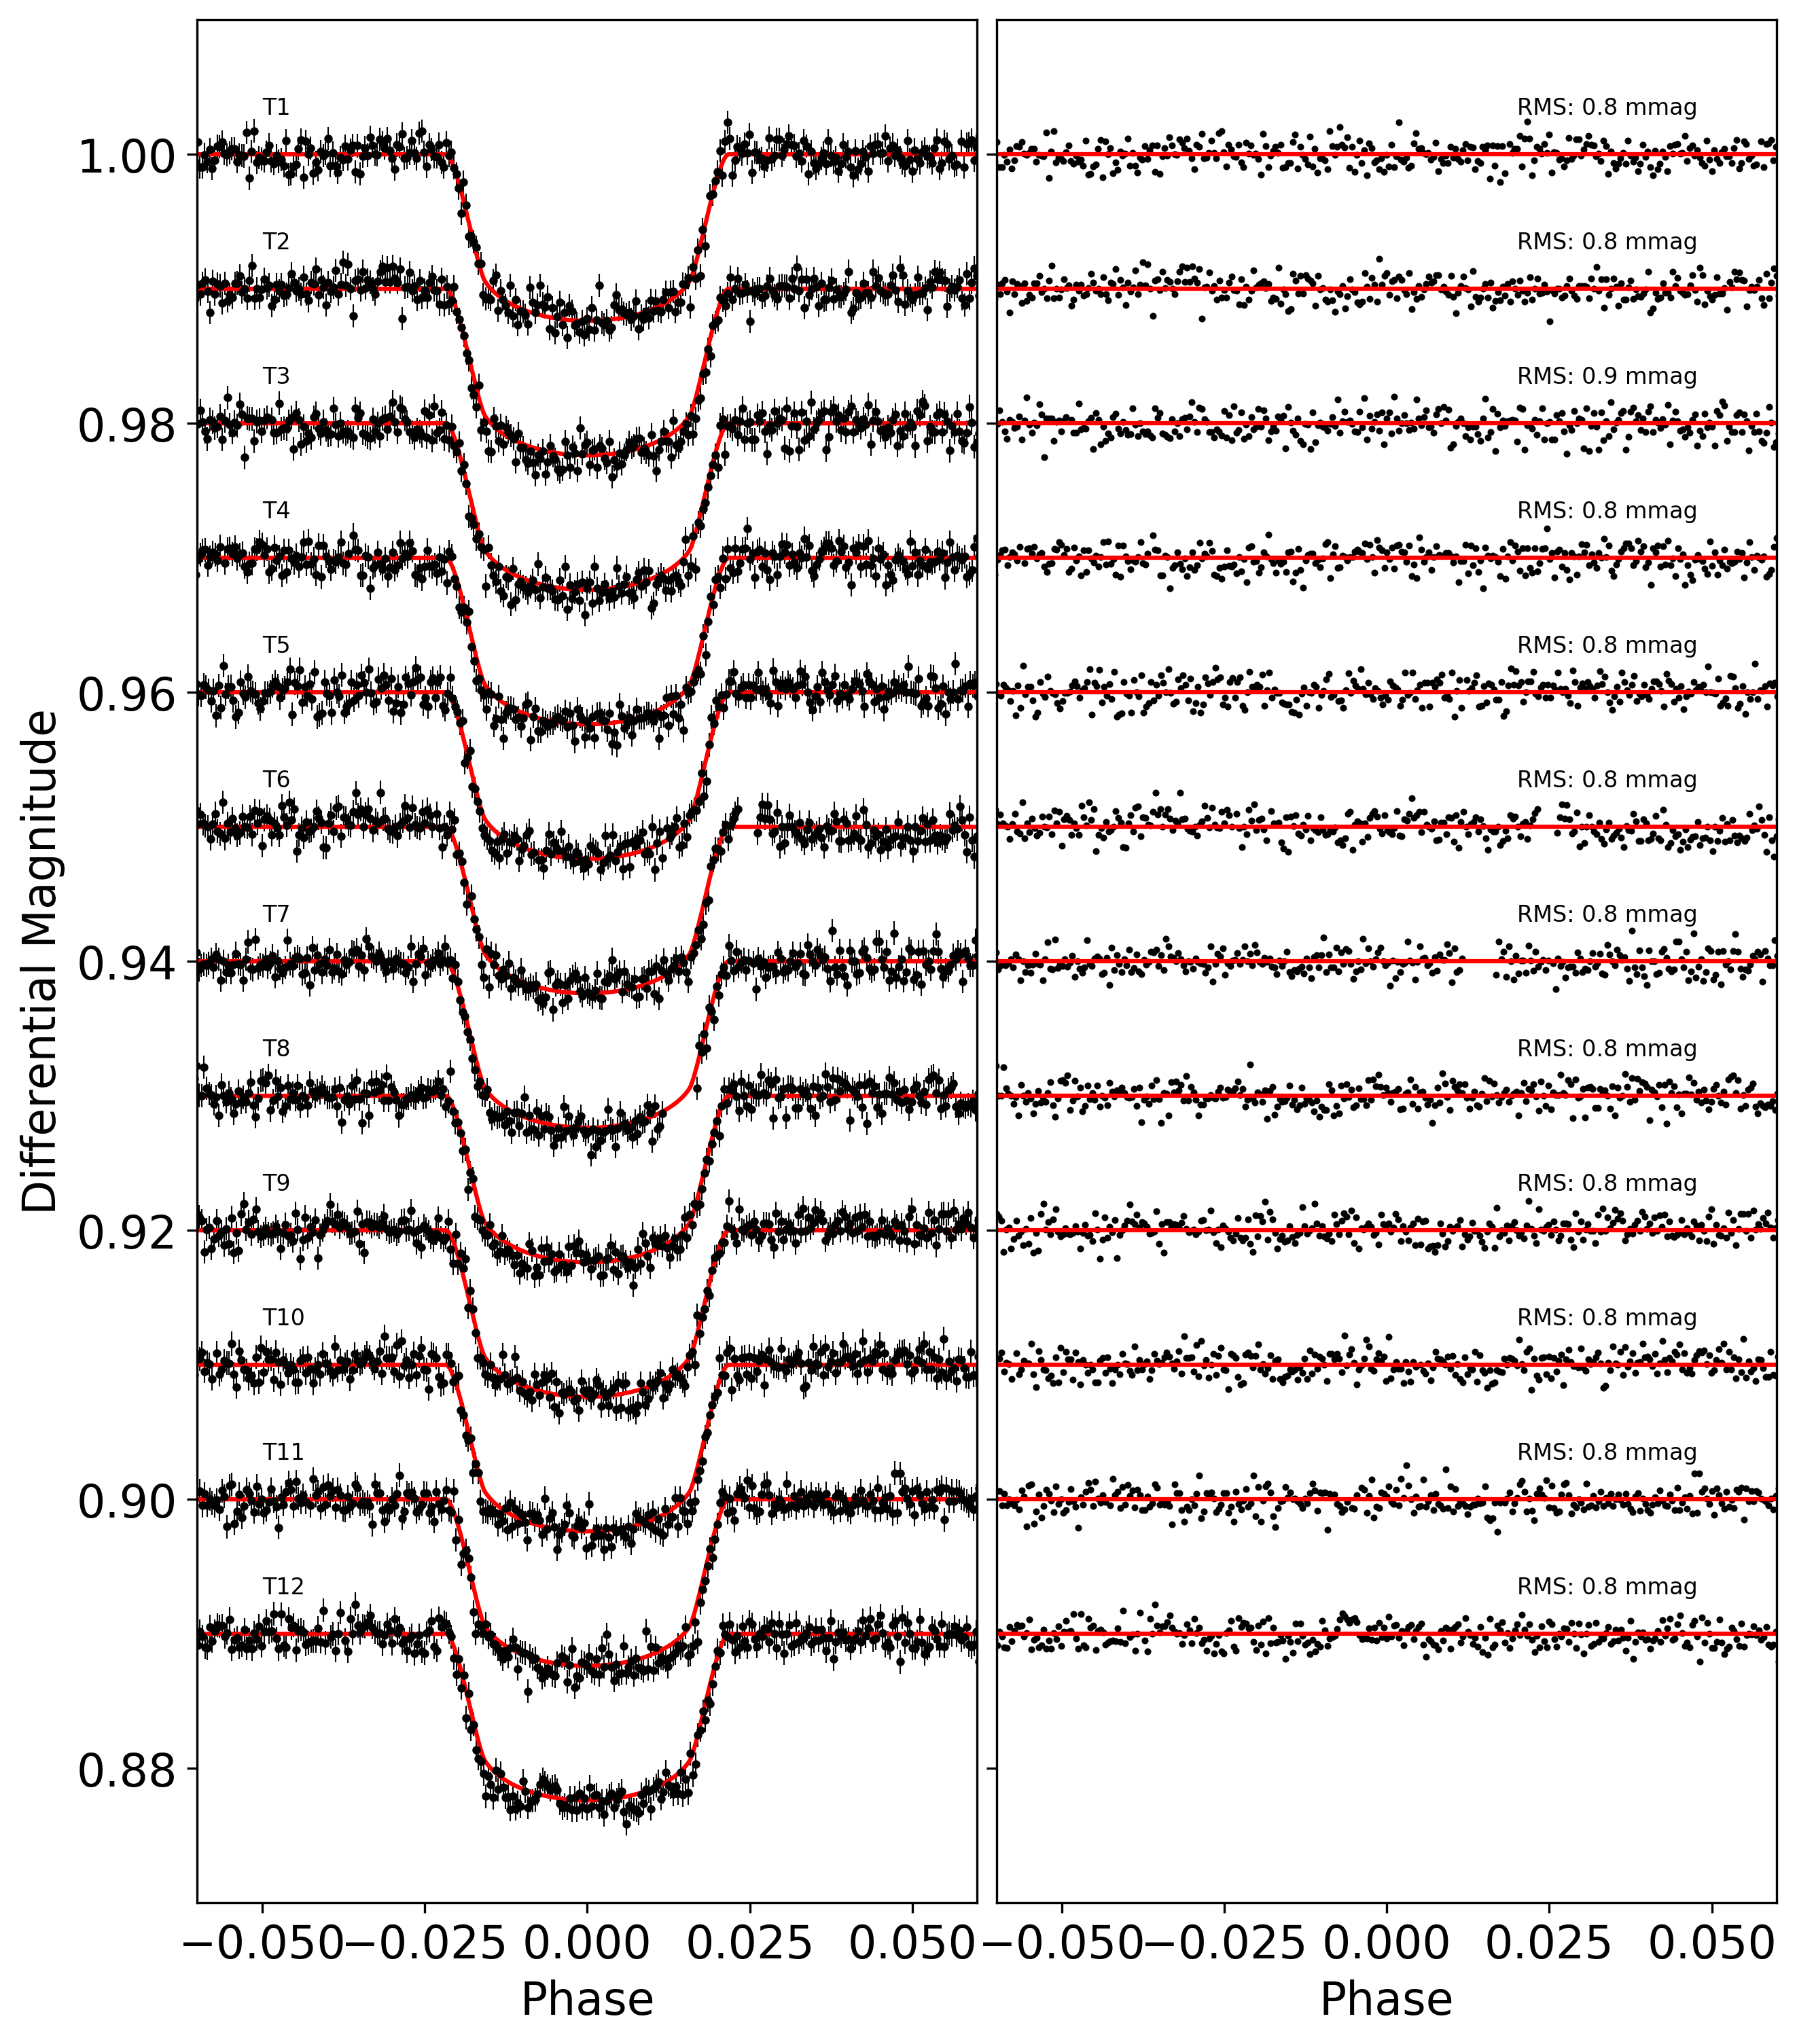
We found that the observed HST and TESS transits were consistent with literature ephemeris within 1. Nevertheless, we refined the period and reference mid transit time for each planet. The updated ephemeris is given in Table 3 while the fitting for the TESS data can be seen in the figures of the appendix. The transit depth and errors of the WFC3 for the 3 planets are presented in Table 4. The observed minus calculated plots are given in Figure 10 and all transit mid times used for the fitting are listed in two Tables in the Appendix. These have been uploaded to ExoClock555https://www.exoclock.space, an initiative to ensure transiting planets are regularly followed-up, keeping their ephemeris up-to-date for the ESA Ariel mission (Tinetti et al., 2018).
| Wavelength | WASP-127 b | WASP-79 b | WASP-62 b |
|---|---|---|---|
| 1.12625 | 9800 53 | 11420 74 | 12012 56 |
| 1.14775 | 10030 48 | 11477 59 | 11993 51 |
| 1.16860 | 10026 72 | 11371 71 | 11890 61 |
| 1.18880 | 10070 50 | 11362 71 | 11983 65 |
| 1.20835 | 9967 53 | 11372 61 | 11909 61 |
| 1.22750 | 9936 61 | 11350 70 | 11909 58 |
| 1.24645 | 9990 54 | 11398 72 | 12036 64 |
| 1.26550 | 9938 53 | 11248 64 | 11913 64 |
| 1.28475 | 10050 49 | 11325 76 | 12024 65 |
| 1.30380 | 10068 52 | 11434 73 | 11999 56 |
| 1.32260 | 10123 46 | 11292 58 | 11820 54 |
| 1.34145 | 10318 53 | 11600 72 | 12151 61 |
| 1.36050 | 10500 70 | 11417 74 | 11964 52 |
| 1.38005 | 10513 65 | 11448 59 | 12120 53 |
| 1.40000 | 10417 53 | 11548 72 | 12065 62 |
| 1.42015 | 10415 50 | 11664 71 | 12082 54 |
| 1.44060 | 10485 59 | 11457 56 | 12019 49 |
| 1.46150 | 10408 54 | 11384 73 | 12102 71 |
| 1.48310 | 10305 51 | 11375 75 | 11901 62 |
| 1.50530 | 10246 61 | 11476 78 | 11901 59 |
| 1.52800 | 9989 60 | 11383 89 | 11907 61 |
| 1.55155 | 9990 55 | 11283 58 | 11837 68 |
| 1.57625 | 9816 56 | 11245 61 | 11907 65 |
| 1.60210 | 9781 58 | 11245 87 | 11796 63 |
| 1.62945 | 9665 65 | 11053 80 | 11734 58 |
4 Discussion
Initially our baseline model did not include FeH, but these models struggled to fit the data, forcing solutions to lower temperatures and nonphysical values in order to account for the opacity sources at shorter wavelengths with a grey cloud deck. FeH has strong absorption features in the visible and near-infrared, and can be expected at the temperatures of these planets (Tennyson & Yurchenko, 2018; Madhusudhan et al., 2016); hence we propose it as the possible absorber to suit our spectral features and explore our justifications for FeH over molecules with similar spectral signatures, such as TiO or VO, in this discussion. FeH was not included in the analysis of Tsiaras et al. (2018) and thus, for the hotter planets in that study, retrievals with FeH may alter the retrieved atmospheric characteristics.
Theoretical equilibrium chemistry models predict FeH (Sharp & Burrows, 2007; Woitke et al., 2018) to be stable in the gas phase at the temperatures and pressures consistent with the planetary atmospheres considered here. FeH has previously been observed in L and M brown dwarfs at 1800 K (Visscher et al., 2010). In cooler T dwarfs, it has been shown to appear where brown dwarfs have temperatures below 1350 K (Burgasser et al., 2002), with some additional studies (Cushing et al., 2008) confirming FeH detection in dwarfs with temperatures of 1000 K. The latter of these detections is at temperatures comparable to the retrieved temperatures the planets here.
A recent study from Ehrenreich et al. (2020) found atomic iron (Fe) in the day-side of the planet WASP-76 b, and not in the terminator, concluding that Fe is condensing on the night-side, then falling into deeper layers of the atmosphere. Furthermore, the results in Pluriel et al. (2020) and Caldas et al. (2019) have investigated how the 3D structure of the atmosphere biases the abundances retrieved with typical retrieval codes, since there is a chemical dichotomy between the day- and night-side that is not considered in a 1D treatment of transit geometry.
We therefore identify three possible scenarios for the detection of FeH in these planets:
-
•
FeH is orginating from the day-side where the temperature is much higher, and leaks in the night-side before it is able to condense due to circulation processes (Heng et al., 2011).
-
•
Atmospheric retrieval studies involve temperature bias due to 3D effects, and we retrieve indeed a cooler temperature than expected; we discuss this in Section 4.1.
- •
| WASP-127 b (No Molecules Log Evidence: 1.73 - Model (1)) | ||||
| Setup | Log Evidence | Sigma | Retrieved Temperature [K] | Equilibrium Temperature [K] |
| (2) H2O, clouds | 161.87 | w.r.t. (1) | 1027 | 1400† |
| (3) H2O, CH4, CO, CO2, NH3, clouds | 161.27 | w.r.t. (2) | 1005 | |
| (4) H2O, FeH, clouds | 170.20 | w.r.t. (2) | 1305 | |
| (5) H2O, CH4, CO, CO2, NH3, FeH, clouds | 169.65 | 4.49 w.r.t. (3) | 1304 | |
| WASP-79b (No Molecules Log Evidence: 173.33 - Model (1)) | ||||
| Setup | Log Evidence | Sigma | Retrieved Temperature [K] | Equilibrium Temperature [K] |
| (2) H2O, clouds | 187.77 | 5.72 w.r.t. (1) | 627 | 1716‡ |
| (3) H2O, CH4, CO, CO2, NH3, clouds | 187.88 | w.r.t. (2) | 618 | |
| (4) H2O, FeH, clouds | 191.16 | 3.09 w.r.t. (2) | 948 | |
| (5) H2O, CH4, CO, CO2, NH3, FeH, clouds | 190.73 | 2.89 w.r.t. (3) | 996 | |
| WASP-62b (No Molecules Log Evidence: 176.35 - Model (1)) | ||||
| Setup | Log Evidence | Sigma | Retrieved Temperature [K] | Equilibrium Temperature [K] |
| (2) H2O,clouds | 187.22 | 5.03 w.r.t. (1) | 618 | 1475‡ |
| (3) H2O, CH4, CO, CO2, NH3, clouds | 186.66 | w.r.t. (2) | 566 | |
| (4) H2O, FeH, clouds | 192.59 | 3.72 w.r.t. (2) | 890 | |
| (5) H2O, CH4, CO, CO2, NH3, FeH, clouds | 192.31 | 3.80 w.r.t. (3) | 891 | |
| † Lam et al. (2017) ‡ Brown et al. (2017) | ||||
Table 5 contains the log evidence of several retrievals for each planet. In all cases, the addition of FeH increases the goodness of fit, while also raising the retrieved temperature. We note that all models included clouds. By comparing the log evidence of the models with only H2O and the models with H2O and FeH, we confirm for all planets that clouds are not a suitable opacity substitute for FeH.
The difference in log evidence for these models is 8.33, 3.39, and 5.37 for WASP-127 b, WASP-79 b and WASP-62 b respectively (4.48 , 3.09 and 3.72 detection of FeH, respectively). This indicates strong to decisive evidence in favour of models containing FeH (Kass & Raftery, 1995; Benneke & Seager, 2012; Changeat et al., 2019).
While we postulate that our evidence holds for FeH, it is possible that we detect another, yet unidentified opacity source with absorption characteristics similar to those of FeH over the WFC3 passband. For instance, similar absorption features can be produced with metal oxides such as TiO, VO and YO. However, we do not expect the presence of these molecules in these planets due to the planets’ low equilibrium temperatures. TiO and VO have condensation temperatures of over 2000K (Lodders, 2002; Hubeny et al., 2003; Fortney et al., 2008); the highest equilibrium temperature featured of these three planets is WASP-79b’s 1716K, as referenced in Table 1, thus rendering it less likely that the spectral features are due to TiO and VO compared to FeH. Ultimately, this further exemplifies the need for longer wavelength coverage with JWST or Ariel to confirm the nature of observed absorption in the future.
For each planet, we have calculated the ADI and found significant evidence of atmospheric features for all three. Given the water detection on all three planets, our results support the conclusions drawn by Tsiaras et al. (2018); inflated, hot Jupiter-like planets do not necessarily destroy water in their upper atmospheres.
4.1 Retrieved temperature
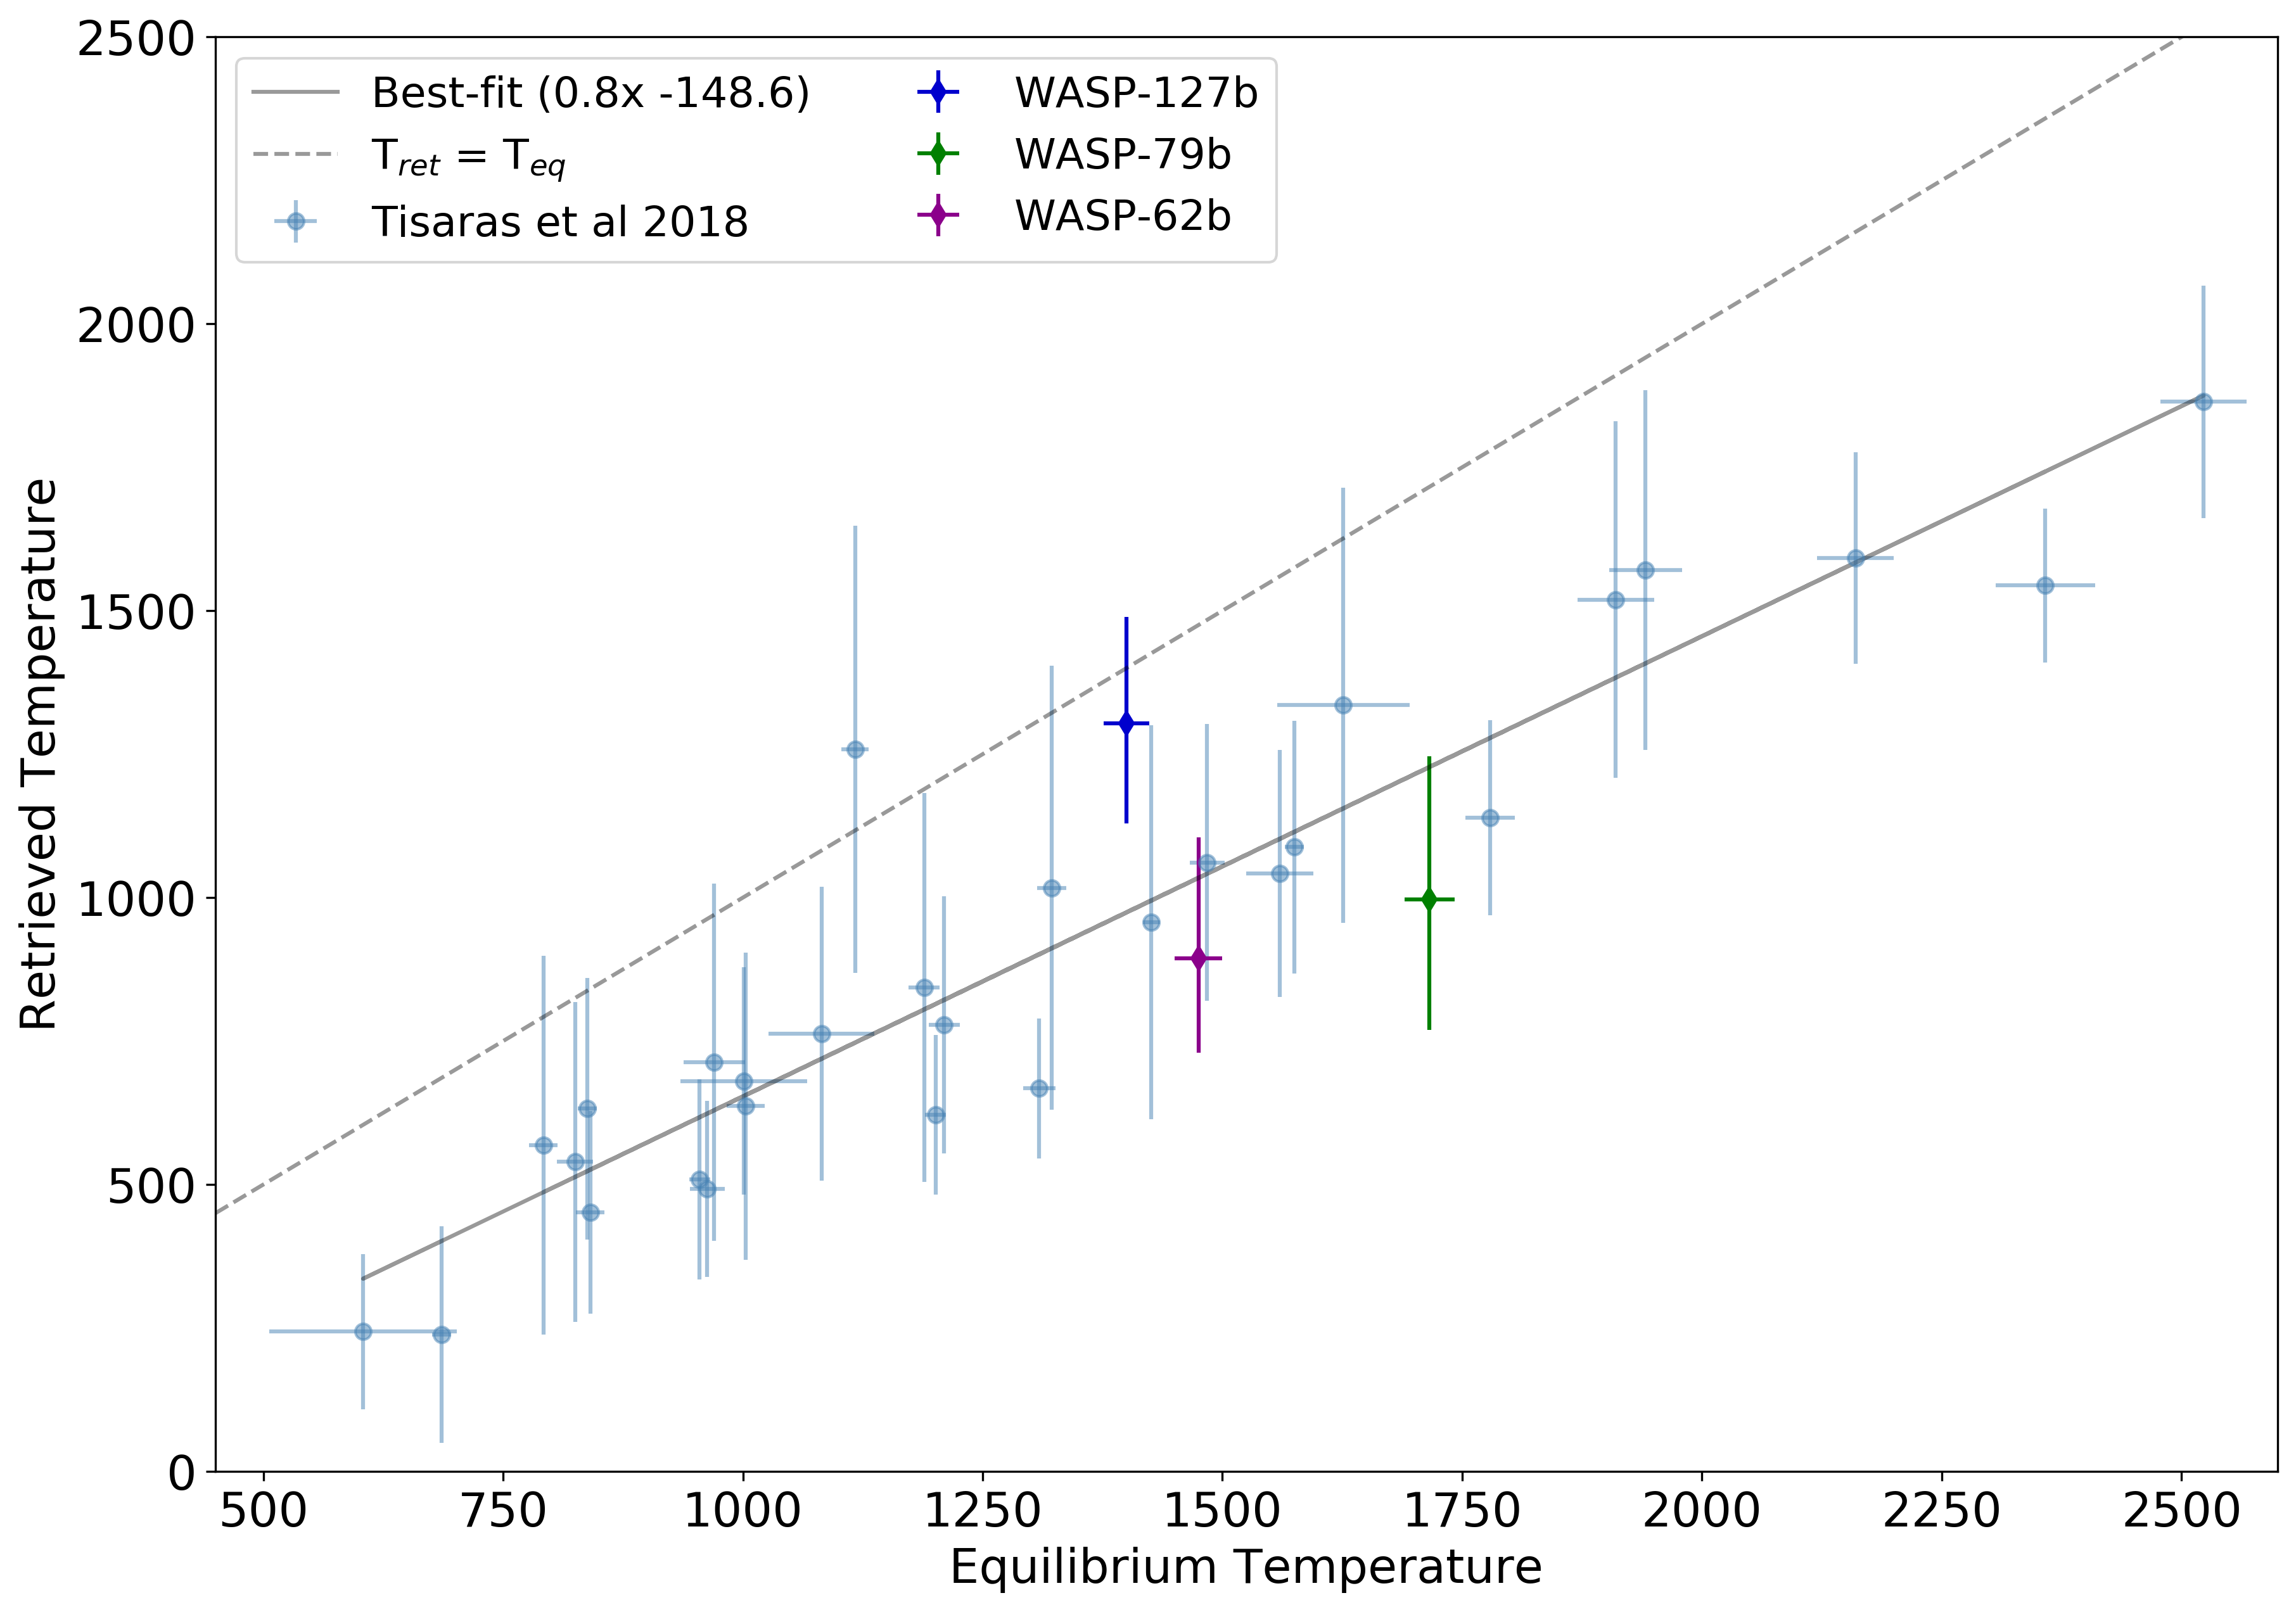
For the three planets considered, the temperature retrieved is notably lower than the equilibrium temperature. In Figure 11, we present a plot analysing the temperatures retrieved for other planets, particularly giving attention to the population paper we based our study on, Tsiaras et al. (2018). Indeed, retrieved temperatures are typically lower than the equilibrium ones, and we derived a best fit of this.
One of the key assumptions leading to this effect is that the equilibrium temperature is usually calculated for the planet day-side and considering a planetary albedo of zero. Considering an albedo greater than zero necessarily implies a loss of energy, and therefore a lower equilibrium temperature.
Furthermore, the region probed during transit eclipse observations is the terminator region: a mix between the day- and the night-side. The temperature difference observed may indicate a bias in the retrievals, which consider exclusively a 1D geometry of the atmospheres. This bias has been pointed out by several studies, especially Caldas et al. (2019); MacDonald et al. (2020) and Pluriel et al. (2020).
4.2 WASP-127 b
We used ExoREM (Exoplanet Radiative-convective Equilibrium Model; Baudino et al. (2015); Charnay et al. (2018)), a self-consistent simulation software for brown dwarfs and giant exoplanets, to calculate the mean temperature profile and the expected abundances of WASP-127 b assuming a solar composition.
The model suggests significant abundances of H2O, CO and Na; though, as stated previously, the WFC3 coverage means our data set is only sensitive to H2O.
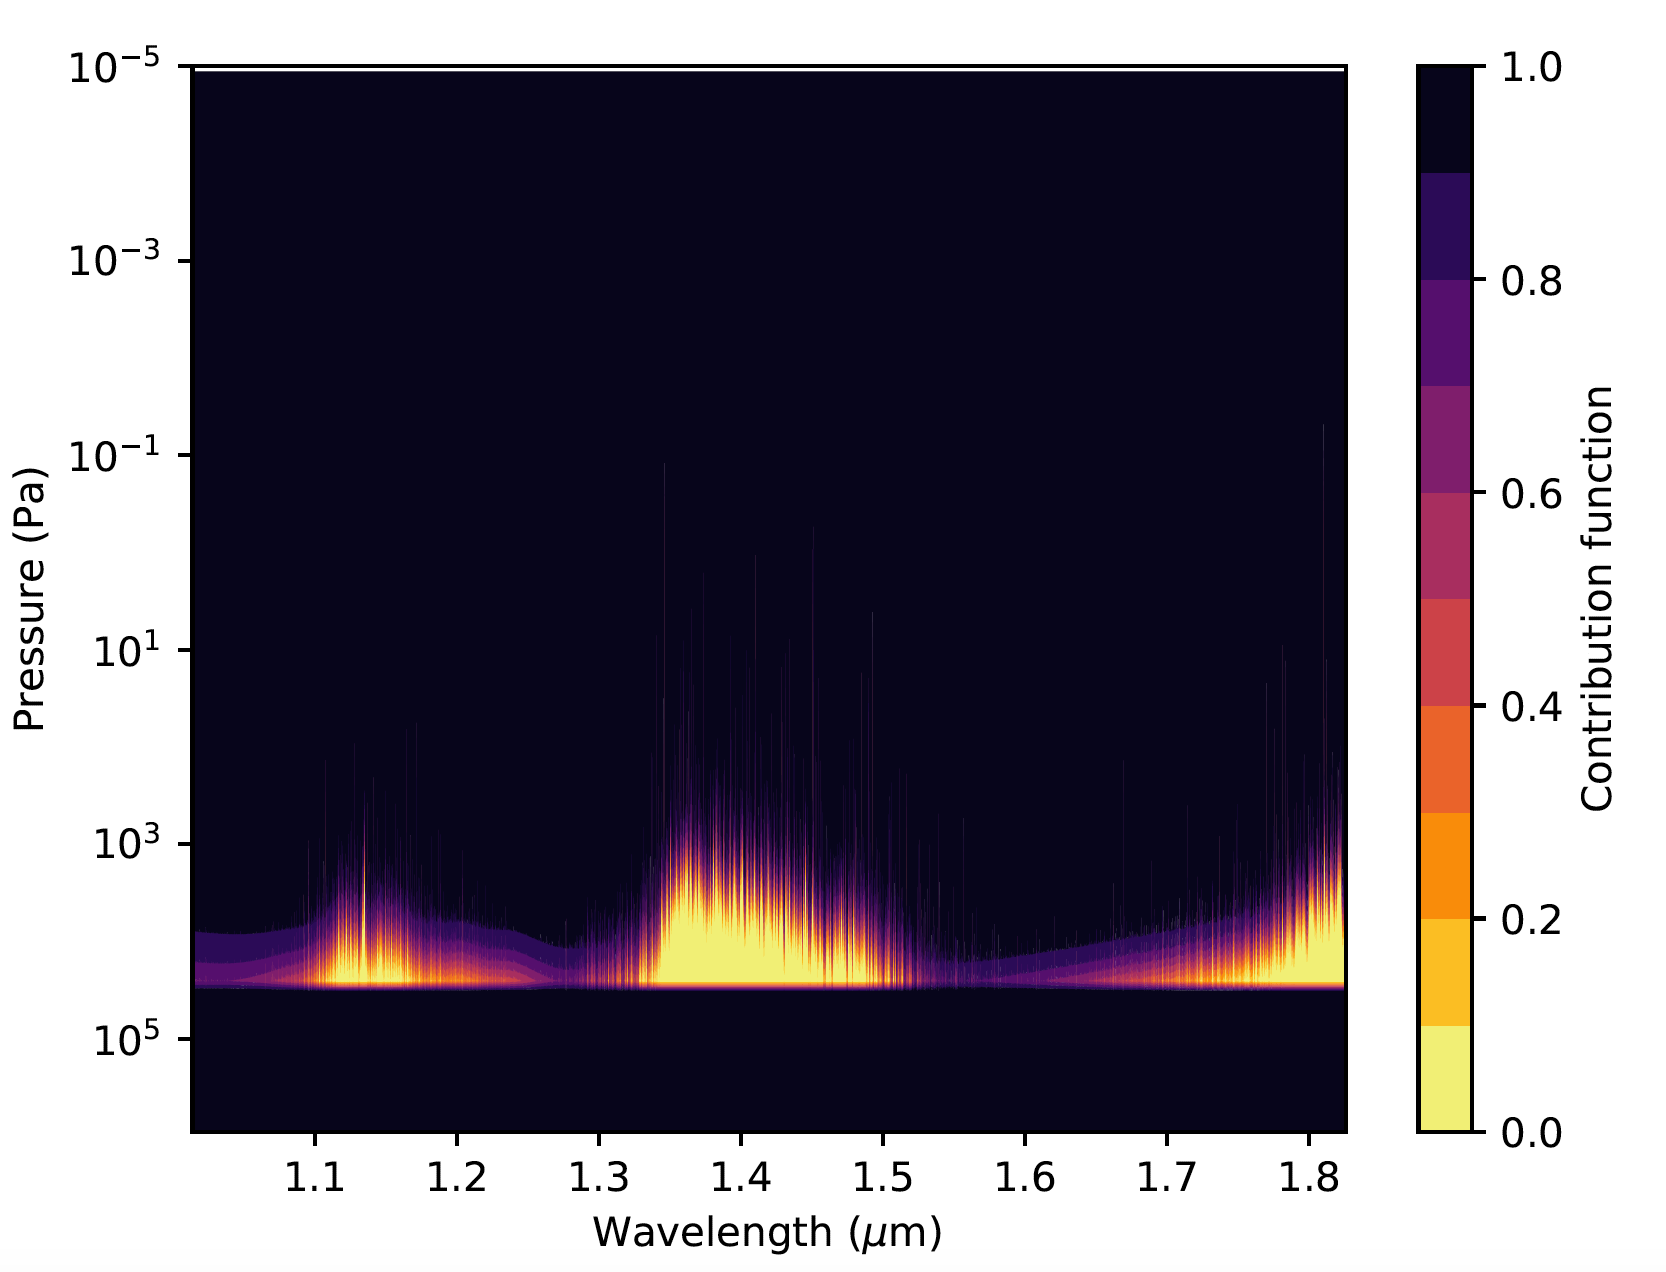
From Figure 12, we can see that our retrieval is sensitive at pressures between and Pa. Figure 13 indicates the retrieved abundances of WASP-127 b are compatible with a solar composition in this pressure range. The mean retrieved abundance of FeH is higher than expected values; however, the error spans three orders of magnitude, allowing for more physical solutions, as discussed at the beginning of this section.
As displayed in Figure 14, the retrieved temperature of WASP-127 b is compatible with the calculated mean temperature profile within our pressure sensitivity range. We can also see that the calculated temperature profile crosses the condensation curves of MnS and Cr between and Pa. We could therefore expect clouds composed of these species to form at these pressures.


Low and high resolution spectra of WASP-127 b have been collected with ground-based instruments. Palle et al. (2017) obtained low resolution spectroscopy with the Andalucia Faint Object Spectrograph and Camera (ALFOSC) spectrograph mounted on the Nordic Optical Telescope (NOT), covering the spectral range 0.45 - 0.85 . A slope was detected in the optical wavelength spectrum, interpreted as Rayleigh scattering and potentially Na. They also attribute the trend to TiO/VO with low significance. Chen, G. et al. (2018) observed with the OSIRIS spectrograph, mounted on the Gran Telescopio Canarias (GTC) telescope, covering the range 0.4 - 1.0 . They presented detection of alkali metals (Na, K and Li), and hints of clouds and water with a retrieved abundance of log(H2O)=-2.60. A recent study with Hubble STIS and WFC3, combined with Spitzer data from IRAC 1 and 2, also concluded that water was present in the atmosphere. Spake et al. (submitted) used an MCMC model to fit the data, resulting in a best-fit solution detecting H2O, CO2, Na and K; their water abundance of log(H2O)=-2.87 is similar to the value retrieved here.
Hence, our independent data reduction and analysis of the water content in the atmosphere of WASP-127 b is consistent with these studies. We do not attempt a joint retrieval with this data due to the potential incompatibility between the data sets from different instruments as highlighted in Yip et al. (2019). Given that the planet lies within the short-period Neptunian desert and has large atmospheric features, it will be an intriguing target for further characterisation.
4.3 WASP-79 b
Sotzen et al. (2019) utilised the same WFC3 data set, along with observations from ground-based facilities, TESS and Spitzer, to study the atmosphere of WASP-79 b. Their retrieval results indicates the presence of H2O, Na and FeH. Our retrieved water abundance is consistent with that from Sotzen et al. (2019); (–2.20 <log(H2O) <–1.55).
In our retrievals without FeH as an opacity source, our solution is driven to low temperatures; Sotzen et al. (2019) encountered a similar predicament when attempting to fit a chemical equilibrium model to the data. Here, by adding FeH as a retrieval parameter, our recovered temperature increases to 996 K, which more readily agrees with what is expected for the terminator region.
While the temperature is still cooler than expected, we note the degeneracy with the 10 bar radius. Our analysis of purely the HST/WFC3 data also favours the presence of H2O and FeH. Na does not have features within the WFC3 spectral range, and we do not attempt the addition of other data for the aforementioned reasons.
4.4 WASP-62 b
WASP-62 b has demonstrably similar bulk characteristics to HD 209458 b; both planets have roughly the same radius and effective temperature, although HD 209458 b is 20% more massive than WASP-62 b (Bonomo et al., 2017). Given their similarities, we may expect them to exhibit a similar atmospheric chemistry and structure. HD 209458b has been extensively analysed in the literature, with 3D simulations (Showman et al., 2009) and cloud analysis (Sing et al., 2016), making it ideal to interpret the results on WASP-62 b. We observe a cloud deck located at Pa. This cloud deck could be explained by the condensation of MgSiO3 in the atmosphere, as was the case with HD 209458 b (Sing et al., 2016).
Using the models of Showman et al. (2009) and Caldas et al. (2019), we may expect the temperature at the terminator to be close to 1350 K. This is somewhat hotter than the K retrieved in our standard setup (2.2). However, as seen in the posterior plot in Figure 9, there is a strong correlation between the temperature, the planet radius and the cloud pressure; so the data remains consistent with the expected temperature.
4.5 Future Characterisation
Upcoming ground and space-based telescopes such as the European Extremely Large Telescope (E-ELT, Brandl et al., 2018), the Thirty Meter Telescope (TMT, Skidmore et al., 2018), the Giant Magellan Telescope (GMT, Fanson et al., 2018), the James Webb Space Telescope (JWST, Greene et al., 2016)), Twinkle (Edwards et al., 2018) and Ariel (Tinetti et al., 2018) will characterise the atmospheres of a large population of exoplanets via transit and eclipse spectroscopy at visible and infrared wavelengths. These missions will move the exoplanet field from an era of detection into one of characterisation, allowing for the identification of the molecular species present and their chemical profile, insights into the atmospheric temperature profile and the detection and characterisation of clouds (e.g. Rocchetto et al., 2016; Rodler, 2018; Changeat et al., 2019).
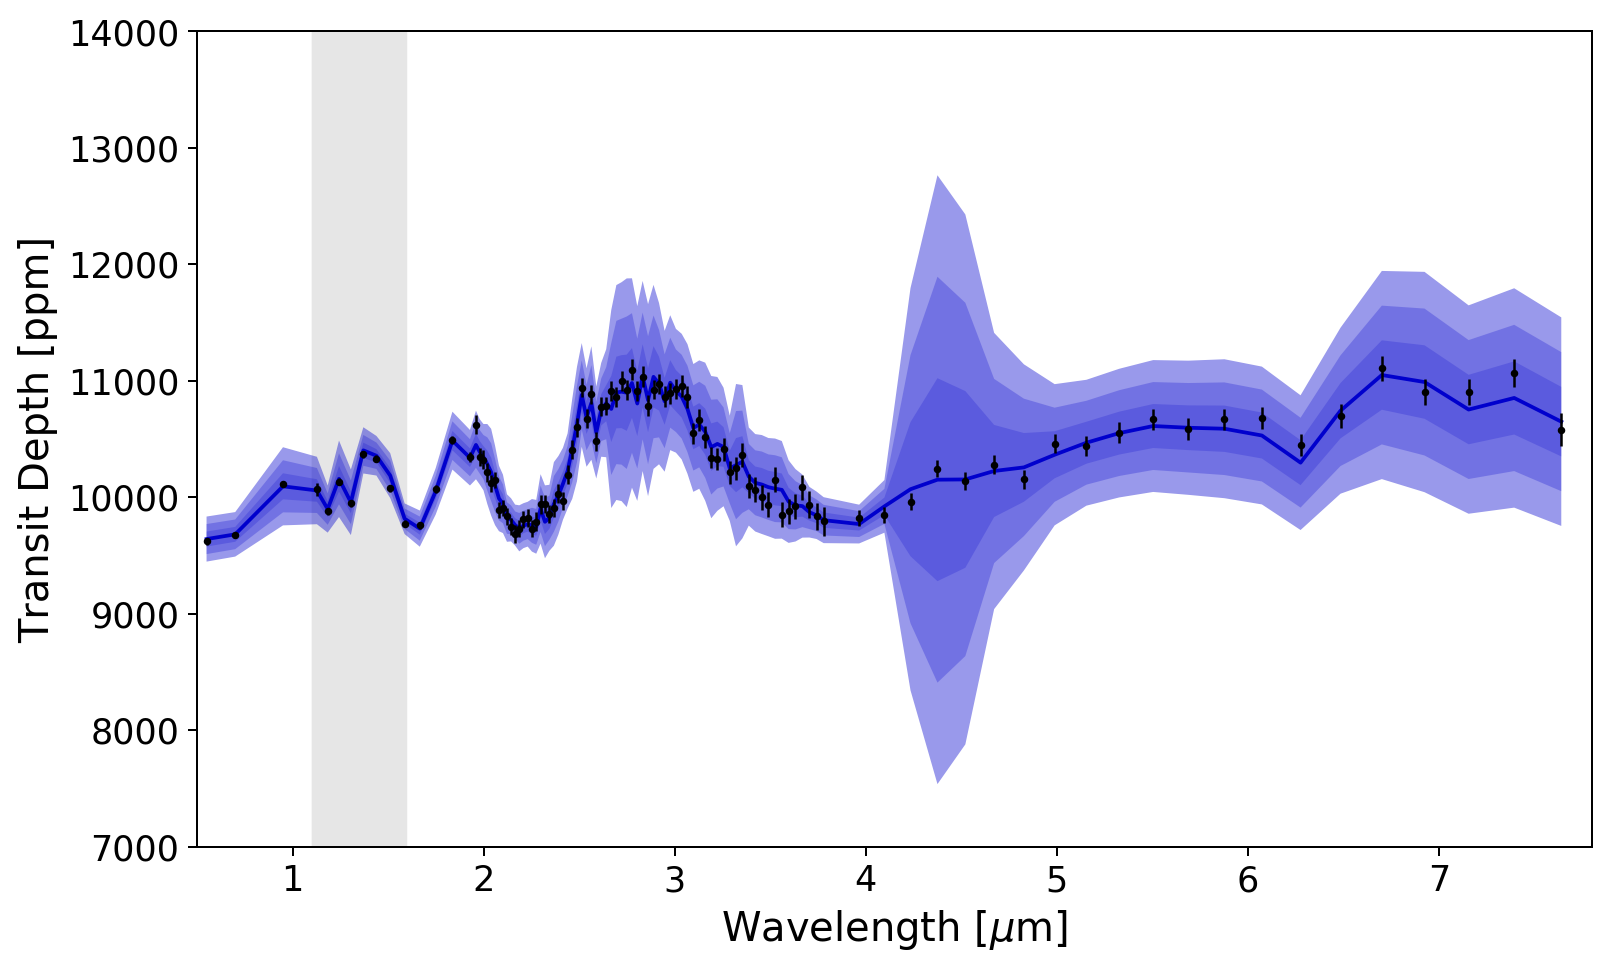
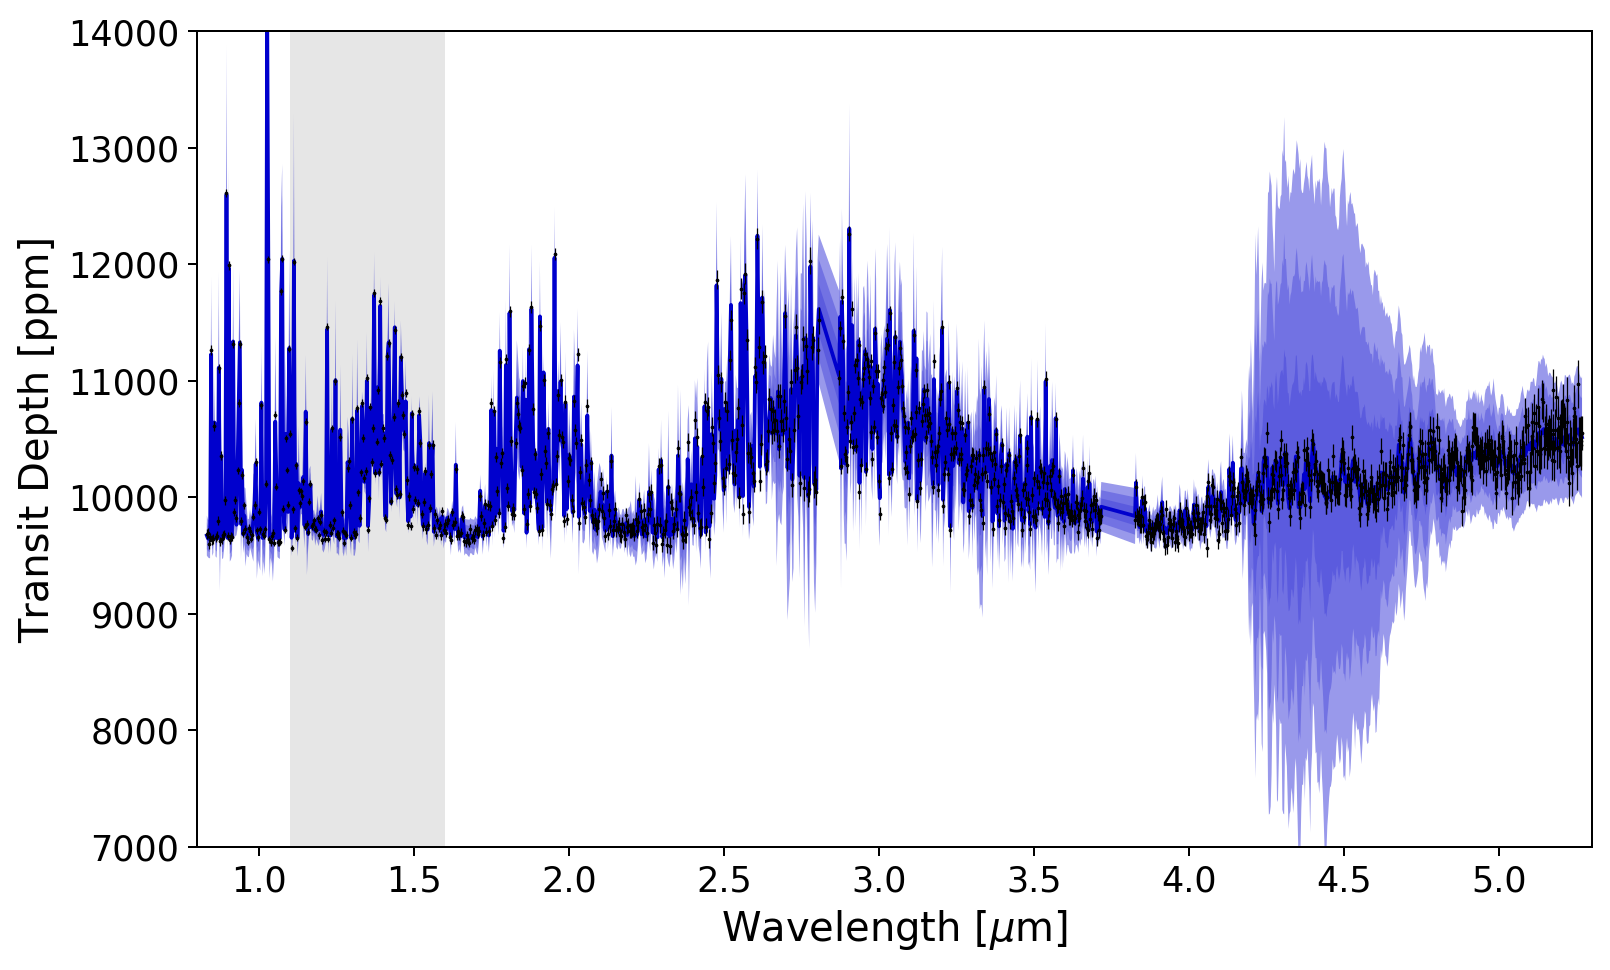
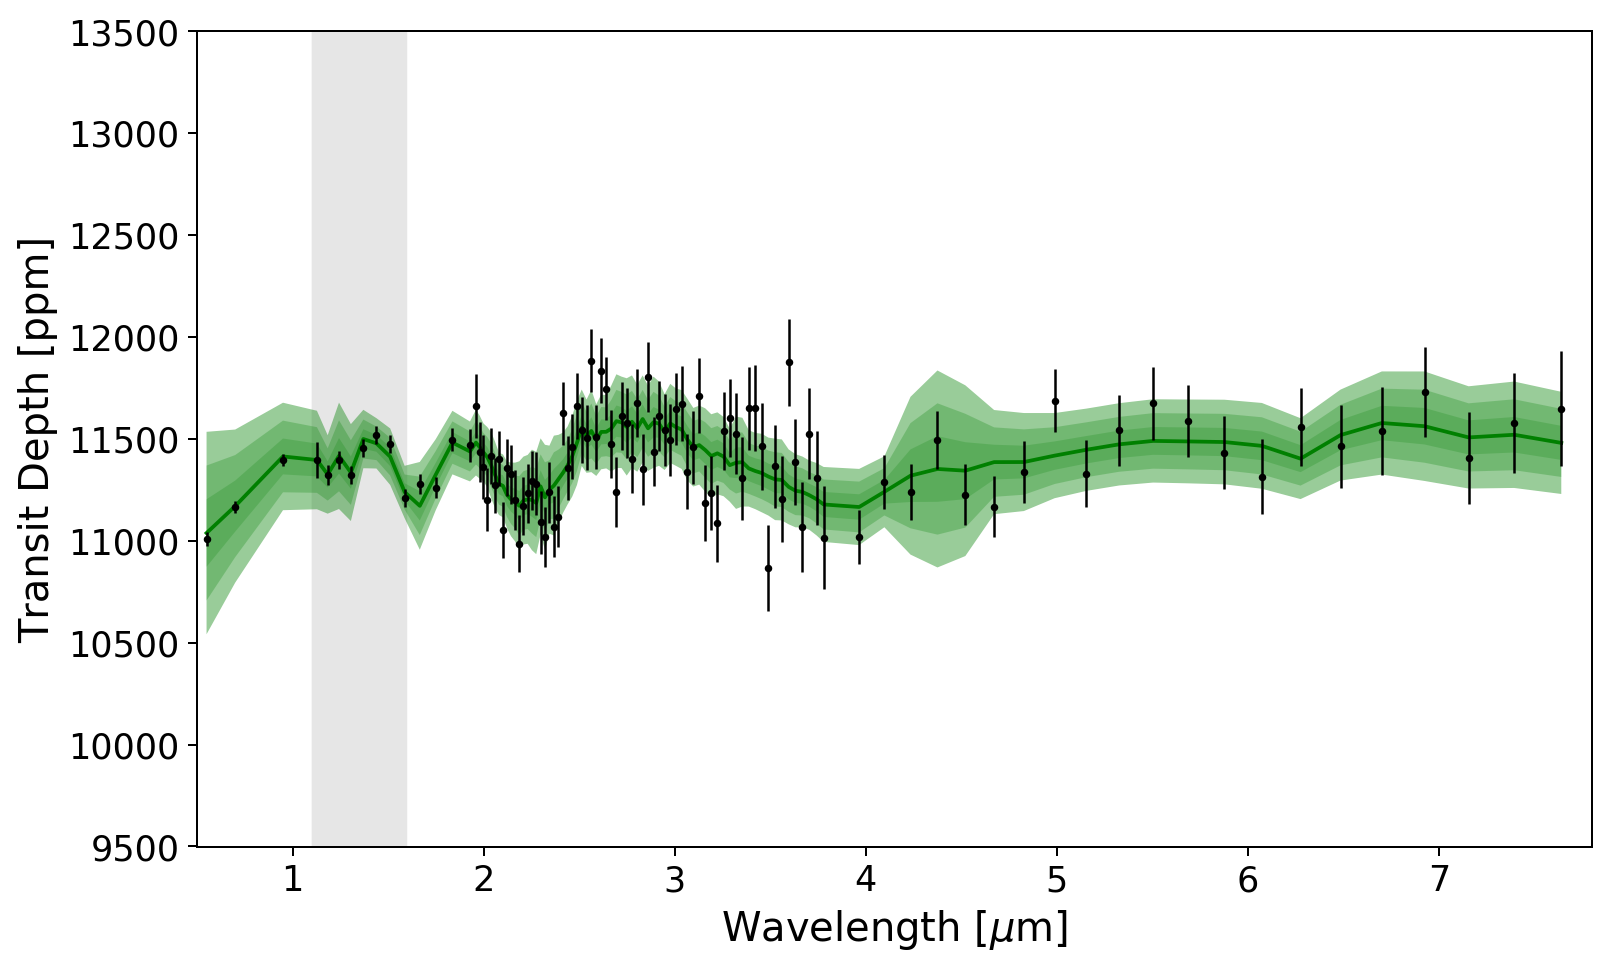
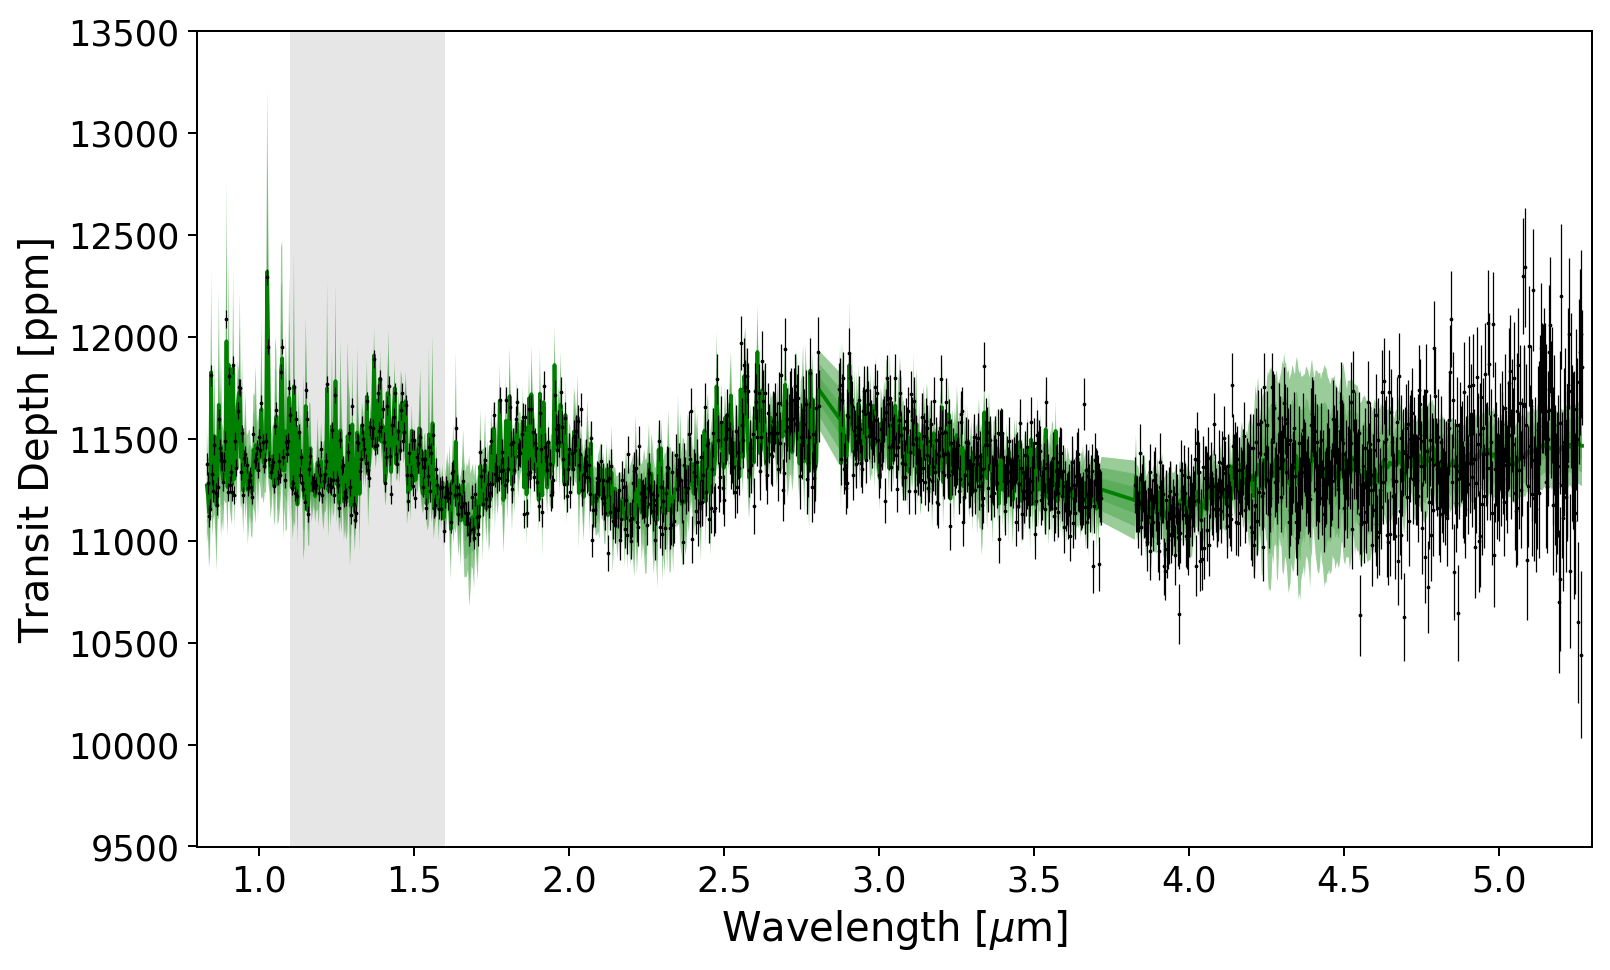
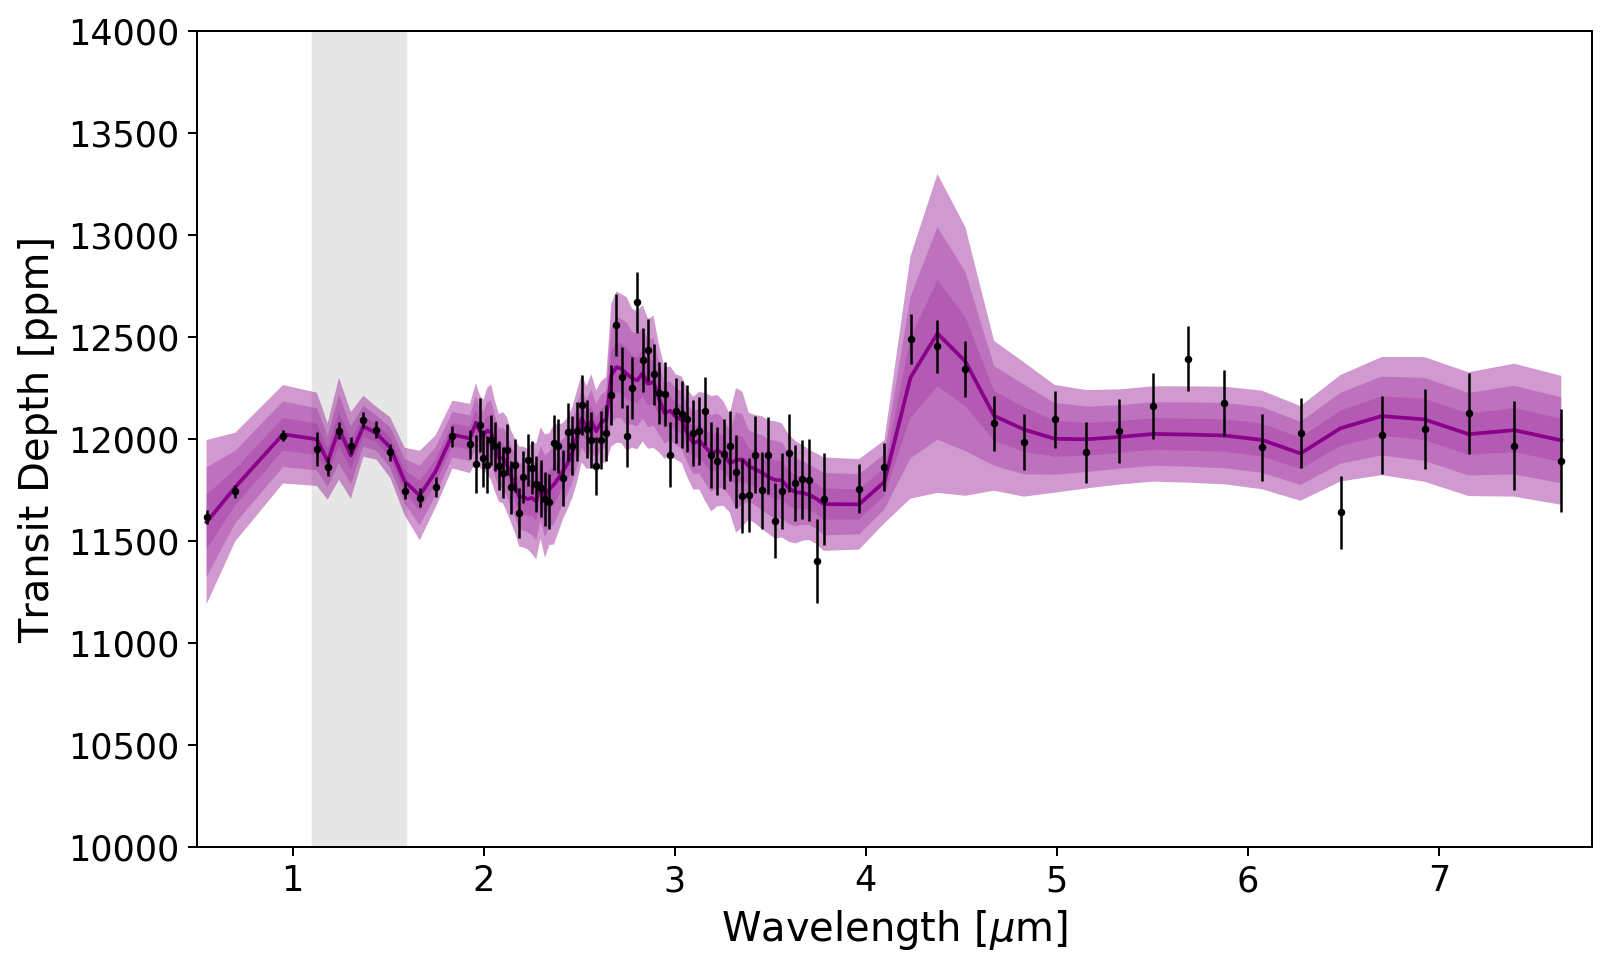
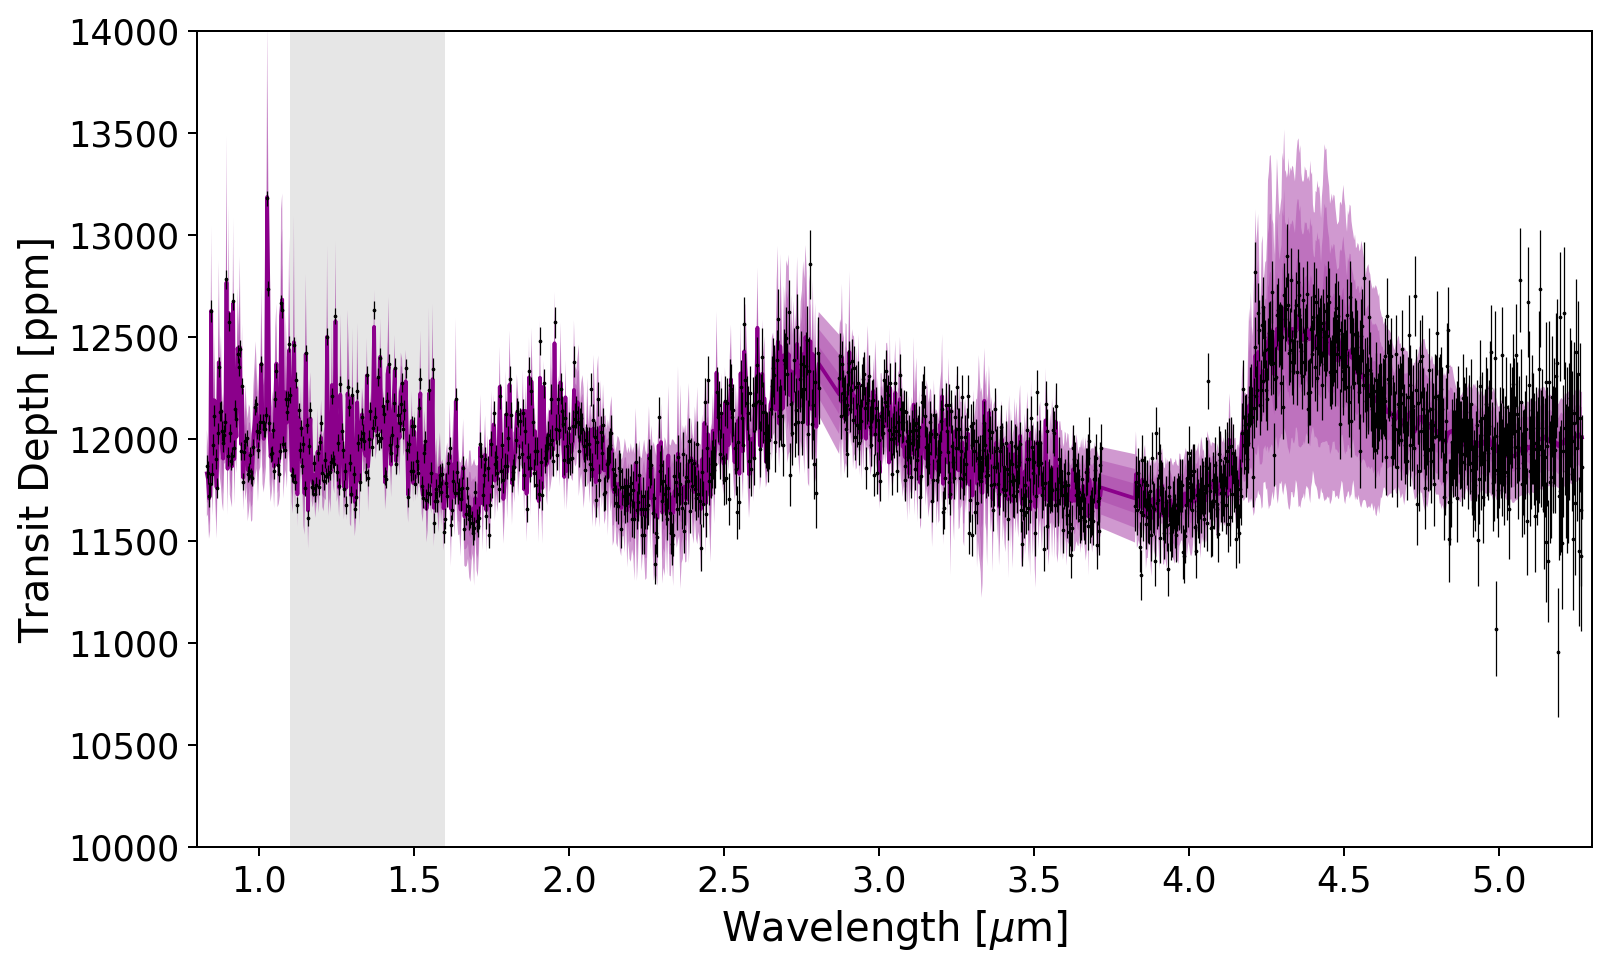
Ariel has been selected as ESA’s M4 mission adoption candidate for launch in 2028 and is designed for the characterisation of a large and diverse population of exoplanetary atmospheres to provide insights into planetary formation and evolution within our Galaxy. Ariel will provide simultaneous photometry and spectroscopy over 0.5 - 7.8 m. Each of the planets studied here is an excellent target for atmospheric studies with Ariel (Edwards et al., 2019) and we use ArielRad (Mugnai et al., 2020) to simulate observations of this forthcoming mission. For each of the planets we take the best-fit solution from the Hubble WFC3 analysis to model Ariel observations at the native resolution of its instruments. Figure 15 highlights the increased wavelength coverage and data quality that will be achieved with Ariel, allowing for a deeper understanding of each of these worlds. WASP-79 b is part of the JWST Early release Science (ERS) program and will be observed by JWST with several different instruments (Bean et al., 2018). Here we simulate JWST observations for these planets, assuming NIRISS GR700XD and NIRSpec G395H are used. Again, the increase in data quality is easily discernible and, although it is not a dedicated exoplanet mission, JWST promises to provide exquisite data for atmospheric characterisation.
5 Conclusion
We have presented the analysis of data from Hubble’s WFC3 G141 grism for three planets. By using the Iraclis pipeline and fitting the resultant spectra with TauREx, we have characterised the atmospheres of WASP-127 b, WASP-79 b and WASP-62 b, recovering best fit models which favour the presence of H2O and FeH in each case. This was performed during the ARES Summer School, using software and data publicly available to the community in order to allow for reproducible results.
The properties of WASP-127 b, particularly its extended atmosphere with clouds and large spectral features; the resultant high atmospheric detectability; and its unusually low density; make it an ideal target for further characterisation with the next generation of facilities. Large spectral features were also detected in WASP-79 b and WASP-62 b, with clouds in the atmosphere of the latter.
None of the three planets studied have strong features in their spectra that can be linked to NH3, CH4, CO, or CO2. This is expected, given their spectroscopic lines do not have major bands in this wavelength range compared to the H2O and FeH lines and higher quality data, with a broader spectral coverage, is required to improve constraints on the atmospheric chemistry. Nevertheless, studying the atmospheric composition of these planets has extended the catalogue of hot Jupiters studied with WFC3 from those by Tsiaras et al. (2018). The ADI introduced therein has been utilised effectively in this paper to estimate the significance of these atmospheric observations. This was done in order to unify the statistical results between our study and that of further populations studies, which remain fundamental tools in understanding the nature and evolutionary history of planets.
Acknowledgements:
We want to thank the anonymous reviewer for the insightful and constructive comments which helped improve the quality of the manuscript.
This work was realised as part of ARES, the Ariel Retrieval Exoplanet School, in Biarritz in 2019. The school was organised by Jean-Philippe Beaulieu with the financial support of CNES. The publicly available observations presented here were taken as part of proposals 14619 and 14767, led by Jessica Spake and David Sing respectively. These were obtained from the Hubble Archive which is part of the Mikulski Archive for Space Telescopes. We are thankful to those who operate this archive, and public nature of which increases scientific productivity and accessibility (Peek et al., 2019).
JPB acknowledges the support of the University of Tasmania through the UTAS Foundation and the endowed Warren Chair in Astronomy, Rodolphe Cledassou, Pascale Danto and Michel Viso (CNES). BE, QC, MM, AT and IW rfunding from the European Research Council (ERC) under the European Union’s Horizon 2020 research and innovation programme grant ExoAI (GA No. 758892) and the STFC grants ST/P000282/1, ST/P002153/1, ST/S002634/1 and ST/T001836/1. NS acknowledges the support of the IRIS-OCAV, PSL. MP acknowledges support by the European Research Council under Grant Agreement ATMO 757858 and by the CNES. RB is a Ph.D. fellow of the Research Foundation–Flanders (FWO). WP, TZ, and AYJ have received funding from the European Research Council (ERC) under the European Union’s Horizon 2020 research and innovation programme (grant agreement n∘ 679030/WHIPLASH). OV thank the CNRS/INSU Programme National de Planétologie (PNP) and CNES for funding support. GG acknowledges the financial support of the 2017 PhD fellowship programme of INAF. LVM and DMG acknowledge the financial support of the ARIEL ASI grant n. 2018-22-HH.0.
This paper includes data collected by the TESS mission which is funded by the NASA Explorer Program. TESS data is publicly available via the Mikulski Archive for Space Telescopes (MAST).
Software: Iraclis (Tsiaras et al., 2016b), TauREx3 (Al-Refaie et al., 2019), pylightcurve (Tsiaras et al., 2016a), ExoTETHyS (Morello et al., 2020), ArielRad (Mugnai et al., 2020), ExoWebb (Edwards et al., 2020), Astropy (Astropy Collaboration et al., 2018), h5py (Collette, 2013), emcee (Foreman-Mackey et al., 2013), Matplotlib (Hunter, 2007), Multinest (Feroz et al., 2009), Pandas (McKinney, 2011), Numpy (Oliphant, 2006), SciPy (Virtanen et al., 2020).
Appendix:
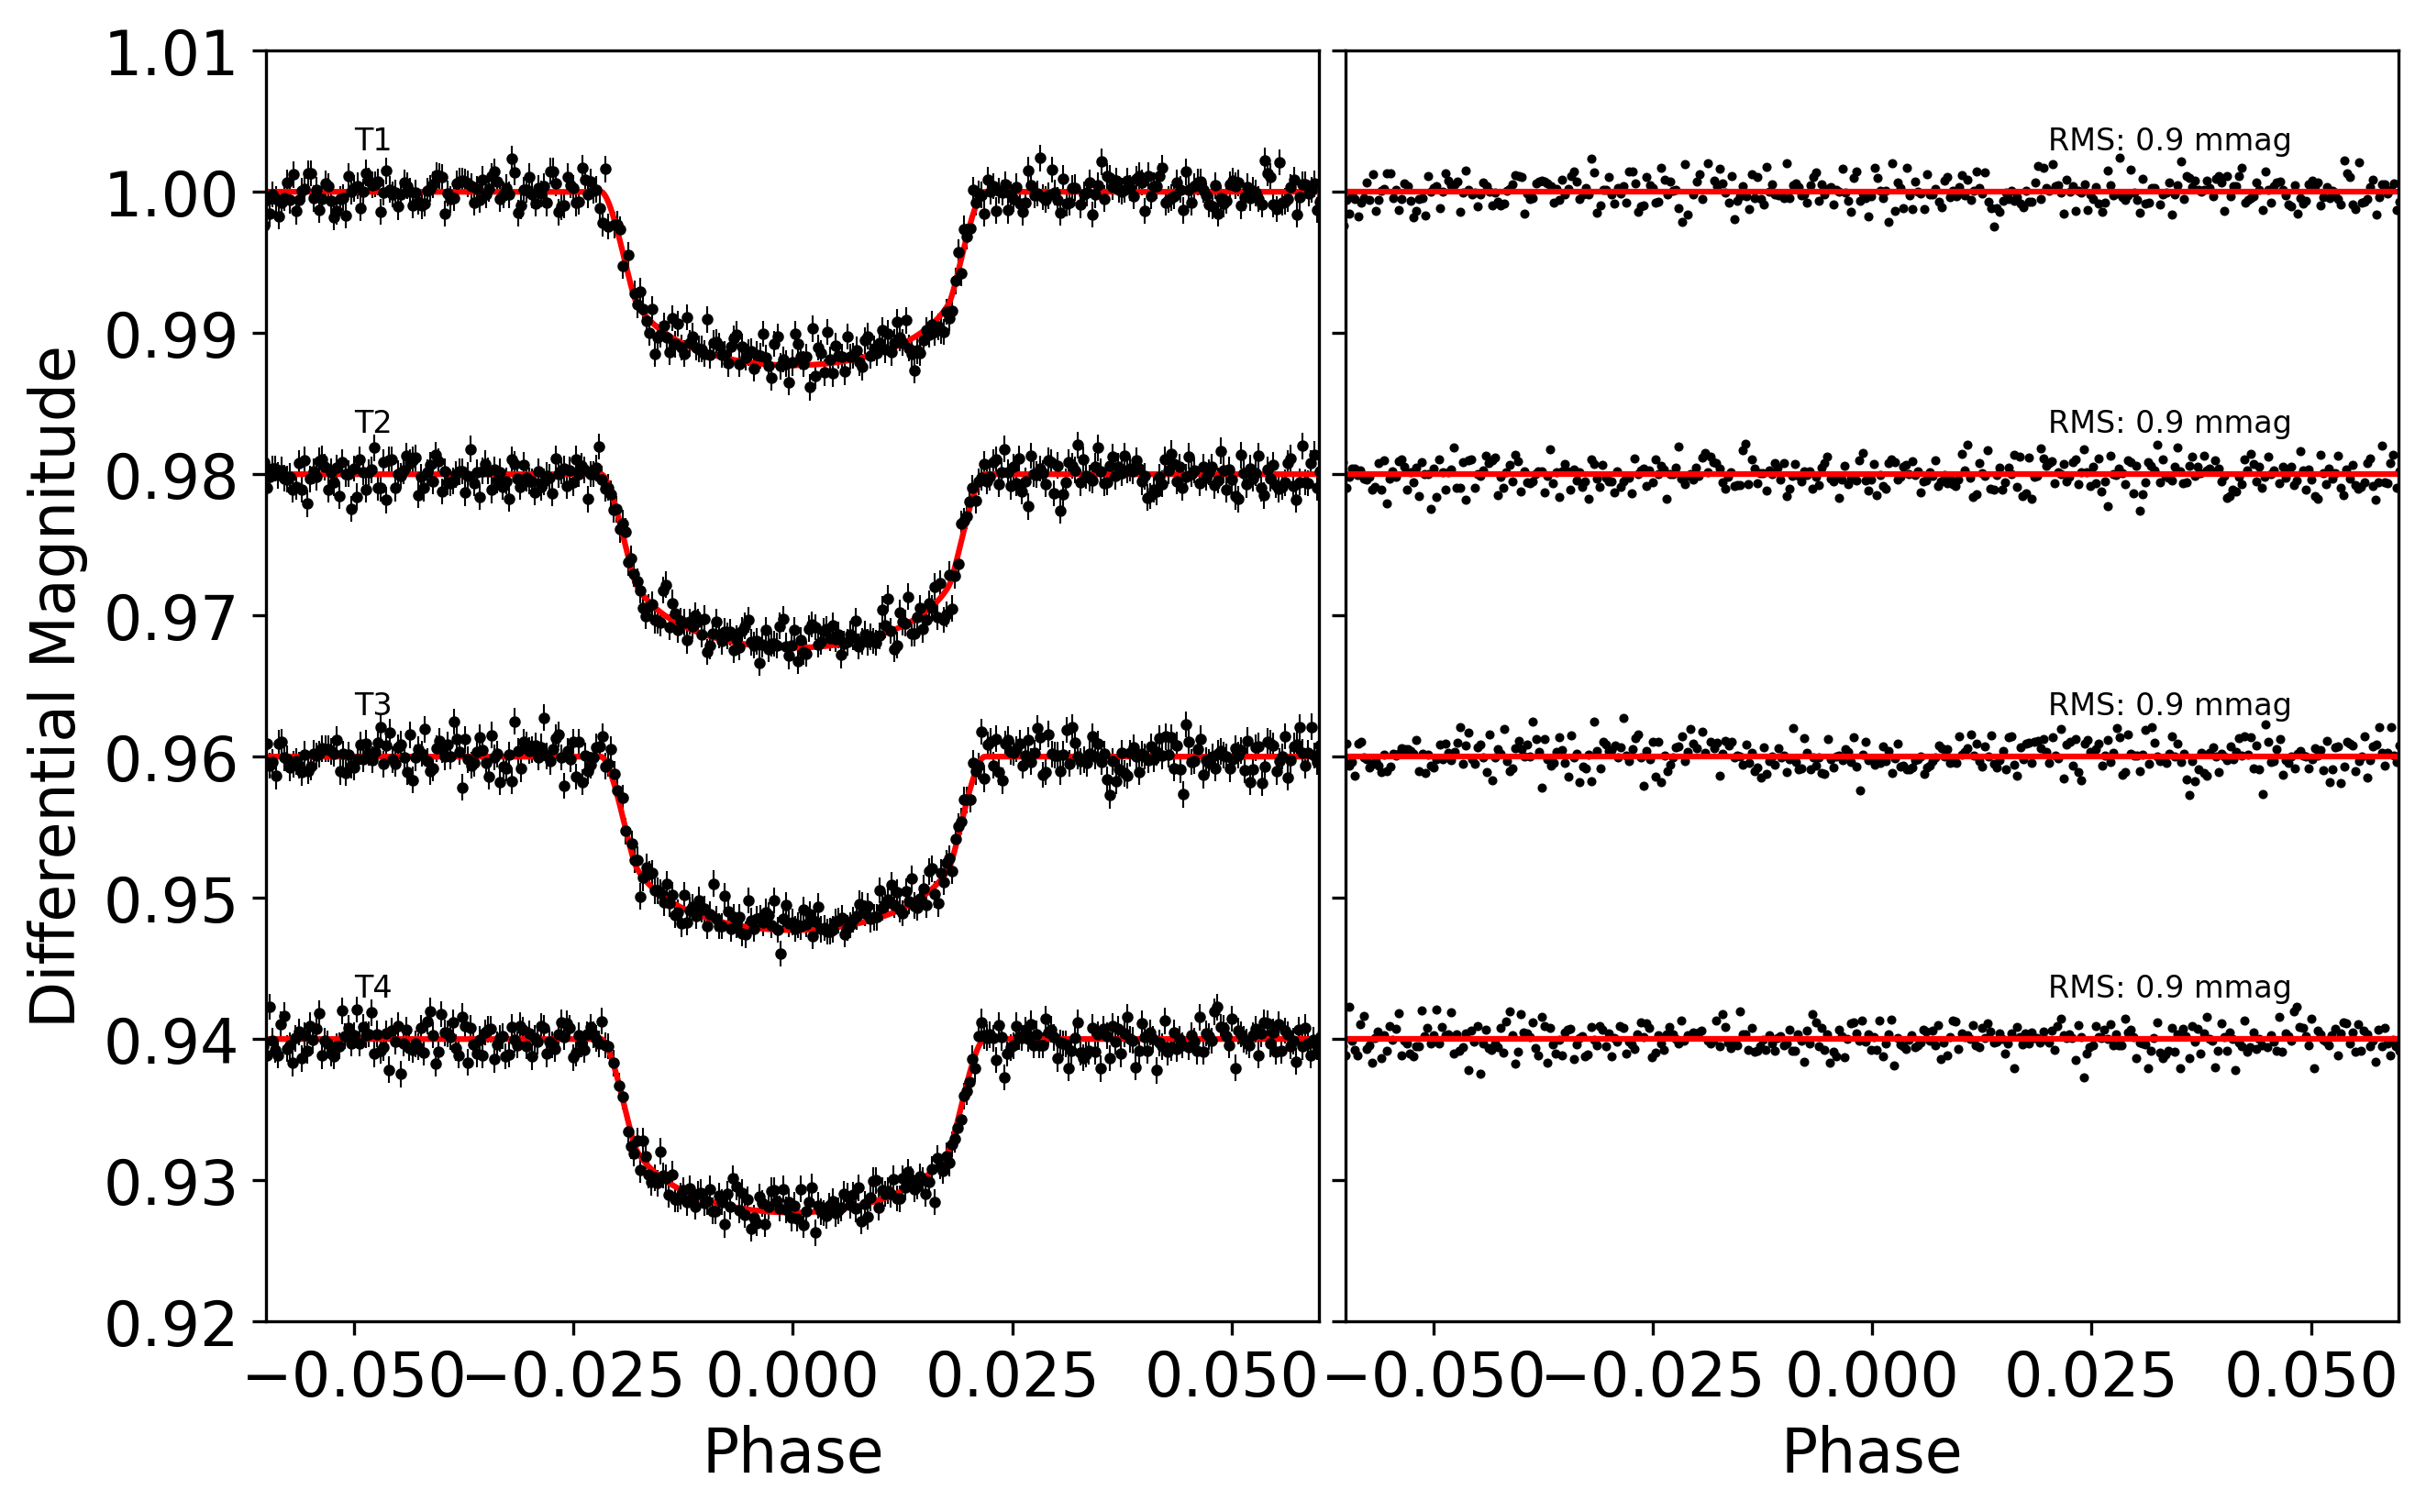
The white light curve fitting for the TESS data are in Figures 16 for WASP-127 b, 17 for WASP-79 b and 18 for WASP-62 b.
All transit mid times used for the fitting are listed in Table 6 and Table 7.
| Planet | Epoch | Mid Time [] | Reference |
| WASP-127 b | -103 | 2457808.60283 0.00031 | Palle et al. (2017) |
| WASP-127 b | -5 | 2458218.053097 0.000101 | This Work* |
| WASP-127 b | 74 | 2458548.11973 0.000469 | This Work |
| WASP-127 b | 75 | 2458552.297636 0.000428 | This Work |
| WASP-127 b | 77 | 2458560.65431 0.000435 | This Work |
| WASP-127 b | 78 | 2458564.83219 0.000431 | This Work |
| WASP-79 b | -531 | 2456215.4556 0.0005 | Brown et al. (2017) |
| WASP-79 b | -94 | 2457815.92207 0.000117 | This Work* |
| WASP-79 b | 69 | 2458412.892172 0.000299 | This Work |
| WASP-79 b | 70 | 2458416.554571 0.000311 | This Work |
| WASP-79 b | 73 | 2458427.541703 0.000332 | This Work |
| WASP-79 b | 74 | 2458431.204093 0.000347 | This Work |
| WASP-79 b | 75 | 2458434.866496 0.000321 | This Work |
| WASP-79 b | 76 | 2458438.528882 0.00029 | This Work |
| WASP-79 b | 77 | 2458442.191242 0.000292 | This Work |
| WASP-79 b | 78 | 2458445.853639 0.000326 | This Work |
| WASP-79 b | 79 | 2458449.515994 0.000314 | This Work |
| WASP-79 b | 80 | 2458453.178366 0.000317 | This Work |
| WASP-79 b | 81 | 2458456.840324 0.000363 | This Work |
| WASP-79 b | 82 | 2458460.503155 0.000335 | This Work |
| WASP-62 b | -614 | 2455767.1533 0.0005 | Brown et al. (2017) |
| WASP-62 b | -140 | 2457858.41397 0.000266 | This Work* |
| WASP-62 b | -34 | 2458326.078168 0.000293 | This Work |
| WASP-62 b | -33 | 2458330.490547 0.000294 | This Work |
| WASP-62 b | -32 | 2458334.902385 0.000315 | This Work |
| WASP-62 b | -30 | 2458343.725961 0.00025 | This Work |
| WASP-62 b | -28 | 2458352.550282 0.000278 | This Work |
| WASP-62 b | -27 | 2458356.961811 0.000257 | This Work |
| WASP-62 b | -26 | 2458361.374157 0.000268 | This Work |
| WASP-62 b | -25 | 2458365.786076 0.000295 | This Work |
| WASP-62 b | -24 | 2458370.197678 0.000244 | This Work |
| WASP-62 b | -23 | 2458374.610308 0.000284 | This Work |
| WASP-62 b | -22 | 2458379.021593 0.00025 | This Work |
| WASP-62 b | -20 | 2458387.845506 0.000238 | This Work |
| WASP-62 b | -19 | 2458392.257448 0.000258 | This Work |
| WASP-62 b | -17 | 2458401.081679 0.000286 | This Work |
| WASP-62 b | -16 | 2458405.493547 0.000294 | This Work |
| WASP-62 b | -14 | 2458414.317213 0.000241 | This Work |
| WASP-62 b | -12 | 2458423.141634 0.000372 | This Work |
| WASP-62 b | -11 | 2458427.55355 0.0003 | This Work |
| WASP-62 b | -10 | 2458431.96504 0.000233 | This Work |
| WASP-62 b | -9 | 2458436.376957 0.000258 | This Work |
| WASP-62 b | -1 | 2458471.672875 0.000281 | This Work |
| WASP-62 b | -0 | 2458476.084548 0.000273 | This Work |
| WASP-62 b | 1 | 2458480.496509 0.000269 | This Work |
| WASP-62 b | 2 | 2458484.90846 0.000263 | This Work |
| WASP-62 b | 3 | 2458489.320399 0.000275 | This Work |
| WASP-62 b | 4 | 2458493.732346 0.000274 | This Work |
| WASP-62 b | 5 | 2458498.144285 0.000271 | This Work |
| WASP-62 b | 6 | 2458502.556272 0.000263 | This Work |
| WASP-62 b | 7 | 2458506.968201 0.000308 | This Work |
| WASP-62 b | 8 | 2458511.380161 0.000259 | This Work |
| *Data from Hubble | |||
| Planet | Epoch | Mid Time [] | Reference |
|---|---|---|---|
| WASP-62 b | 9 | 2458515.793014 0.000308 | This Work |
| WASP-62 b | 10 | 2458520.203407 0.00031 | This Work |
| WASP-62 b | 11 | 2458524.616007 0.000263 | This Work |
| WASP-62 b | 14 | 2458537.851688 0.000269 | This Work |
| WASP-62 b | 16 | 2458546.675279 0.000324 | This Work |
| WASP-62 b | 17 | 2458551.087738 0.000337 | This Work |
| WASP-62 b | 19 | 2458559.91167 0.000278 | This Work |
| WASP-62 b | 20 | 2458564.323603 0.000285 | This Work |
| WASP-62 b | 22 | 2458573.147116 0.000311 | This Work |
| WASP-62 b | 23 | 2458577.559142 0.000317 | This Work |
| WASP-62 b | 25 | 2458586.382966 0.000333 | This Work |
| WASP-62 b | 26 | 2458590.795328 0.000345 | This Work |
| WASP-62 b | 27 | 2458595.206831 0.000331 | This Work |
| WASP-62 b | 29 | 2458604.031175 0.00029 | This Work |
| WASP-62 b | 30 | 2458608.443135 0.000301 | This Work |
| WASP-62 b | 31 | 2458612.855056 0.000311 | This Work |
| WASP-62 b | 32 | 2458617.266322 0.000359 | This Work |
| WASP-62 b | 33 | 2458621.67842 0.000344 | This Work |
| WASP-62 b | 34 | 2458626.090956 0.000358 | This Work |
| WASP-62 b | 35 | 2458630.502921 0.000265 | This Work |
| WASP-62 b | 36 | 2458634.914867 0.000257 | This Work |
| WASP-62 b | 38 | 2458643.738117 0.000318 | This Work |
| WASP-62 b | 39 | 2458648.150206 0.000305 | This Work |
| WASP-62 b | 40 | 2458652.561559 0.000312 | This Work |
| WASP-62 b | 41 | 2458656.974299 0.000292 | This Work |
| WASP-62 b | 42 | 2458661.385862 0.000292 | This Work |
| WASP-62 b | 43 | 2458665.798175 0.000285 | This Work |
| WASP-62 b | 44 | 2458670.210186 0.000304 | This Work |
| WASP-62 b | 45 | 2458674.621865 0.000315 | This Work |
| WASP-62 b | 46 | 2458679.034395 0.000284 | This Work |
References
- Abel et al. (2011) Abel, M., Frommhold, L., Li, X., & Hunt, K. L. 2011, The Journal of Physical Chemistry A, 115, 6805
- Abel et al. (2012) —. 2012, The Journal of chemical physics, 136, 044319
- Addison et al. (2013) Addison, B. C., Tinney, C. G., Wright, D. J., et al. 2013, ApJ, 774, L9
- Al-Refaie et al. (2019) Al-Refaie, A. F., Changeat, Q., Waldmann, I. P., & Tinetti, G. 2019, arXiv e-prints, arXiv:1912.07759
- Astropy Collaboration et al. (2018) Astropy Collaboration, Price-Whelan, A. M., Sipőcz, B. M., et al. 2018, AJ, 156, 123
- Batalha et al. (2013) Batalha, N. M., Rowe, J. F., Bryson, S. T., et al. 2013, The Astrophysical Journal Supplement, 204, 24
- Batygin & Stevenson (2010) Batygin, K., & Stevenson, D. J. 2010, ApJ, 714, L238
- Batygin et al. (2011) Batygin, K., Stevenson, D. J., & Bodenheimer, P. H. 2011, ApJ, 738, 1
- Baudino et al. (2015) Baudino, J.-L., Bézard, B., Boccaletti, A., et al. 2015, A&A, 582, A83. https://doi.org/10.1051/0004-6361/201526332
- Bean et al. (2018) Bean, J. L., Stevenson, K. B., Batalha, N. M., et al. 2018, ArXiv e-prints, arXiv:1803.04985
- Benneke & Seager (2012) Benneke, B., & Seager, S. 2012, ApJ, 753, 100
- Bonomo et al. (2017) Bonomo, A. S., Desidera, S., Benatti, S., et al. 2017, A&A, 602, A107
- Bourrier et al. (2015) Bourrier, V., des Etangs, A. L., & Vidal-Madjar, A. 2015, Astronomy & Astrophysics, 573, A11
- Brandl et al. (2018) Brandl, B. R., Absil, O., Agócs, T., et al. 2018, in Society of Photo-Optical Instrumentation Engineers (SPIE) Conference Series, Vol. 10702, Ground-based and Airborne Instrumentation for Astronomy VII, 107021U
- Brogi et al. (2012) Brogi, M., Snellen, I. A. G., de Kok, R. J., et al. 2012, Nature, 486, 502
- Brown et al. (2017) Brown, D. J. A., Triaud, A. H. M. J., Doyle, A. P., et al. 2017, MNRAS, 464, 810
- Burgasser et al. (2002) Burgasser, A. J., Marley, M. S., Ackerman, A. S., et al. 2002, ApJ, 571, L151
- Caldas et al. (2019) Caldas, A., Leconte, J., Selsis, F., et al. 2019, Astronomy & Astrophysics, 623, A161
- Cassan et al. (2012) Cassan, A., Kubas, D., Beaulieu, J.-P., et al. 2012, Nature, 481, 167
- Changeat et al. (2019) Changeat, Q., Edwards, B., Waldmann, I. P., & Tinetti, G. 2019, arXiv e-prints, arXiv:1903.11180
- Charnay et al. (2018) Charnay, B., Bézard, B., Baudino, J.-L., et al. 2018, The Astrophysical Journal, 854, 172. http://dx.doi.org/10.3847/1538-4357/aaac7d
- Chen, G. et al. (2018) Chen, G., Pallé, E., Welbanks, L., et al. 2018, A&A, 616, A145. https://doi.org/10.1051/0004-6361/201833033
- Claret (2000) Claret, A. 2000, A&A, 363, 1081
- Collette (2013) Collette, A. 2013, Python and HDF5 (O’Reilly)
- Cushing et al. (2008) Cushing, M. C., Marley, M. S., Saumon, D., et al. 2008, ApJ, 678, 1372
- Dressing & Charbonneau (2013) Dressing, C. D., & Charbonneau, D. 2013, The Astrophysical Journal, 767, 95
- Dulick et al. (2003) Dulick, M., Bauschlicher, C. W., J., Burrows, A., et al. 2003, ApJ, 594, 651
- Eastman et al. (2010) Eastman, J., Siverd, R., & Gaudi, B. S. 2010, PASP, 122, 935
- Edwards et al. (2020) Edwards, B., Al-Refaie, A., Lagage, P., & Gastaud, R. 2020, in prep
- Edwards et al. (2019) Edwards, B., Mugnai, L., Tinetti, G., Pascale, E., & Sarkar, S. 2019, AJ, 157, 242
- Edwards et al. (2018) Edwards, B., Rice, M., Zingales, T., et al. 2018, Experimental Astronomy, 47, 29–63. http://dx.doi.org/10.1007/s10686-018-9611-4
- Edwards et al. (2020a) Edwards, B., Changeat, Q., Baeyens, R., et al. 2020a, AJ, 160, 8
- Edwards et al. (2020b) Edwards, B., Changeat, Q., Yip, K. H., et al. 2020b, MNRAS, arXiv:2005.01684
- Ehrenreich et al. (2020) Ehrenreich, D., Lovis, C., Allart, R., et al. 2020, arXiv e-prints, arXiv:2003.05528
- Fanson et al. (2018) Fanson, J., McCarthy, P. J., Bernstein, R., et al. 2018, in Society of Photo-Optical Instrumentation Engineers (SPIE) Conference Series, Vol. 10700, Ground-based and Airborne Telescopes VII, 1070012
- Feroz et al. (2009) Feroz, F., Hobson, M. P., & Bridges, M. 2009, MNRAS, 398, 1601
- Fletcher et al. (2018) Fletcher, L. N., Gustafsson, M., & Orton, G. S. 2018, The Astrophysical Journal Supplement Series, 235, 24
- Foreman-Mackey et al. (2013) Foreman-Mackey, D., Hogg, D. W., Lang, D., & Goodman, J. 2013, PASP, 125, 306
- Fortney et al. (2008) Fortney, J. J., Lodders, K., Marley, M. S., & Freedman, R. S. 2008, ApJ, 678, 1419
- Fu et al. (2017) Fu, G., Deming, D., Knutson, H., et al. 2017, The Astrophysical Journal Letters, 847, L22. http://stacks.iop.org/2041-8205/847/i=2/a=L22
- Greene et al. (2016) Greene, T. P., Line, M. R., Montero, C., et al. 2016, ApJ, 817, 17
- Griffith (2014) Griffith, C. A. 2014, Philosophical Transactions of the Royal Society of London Series A, 372, 20130086
- Hellier et al. (2012) Hellier, C., Anderson, D. R., Collier Cameron, A., et al. 2012, Monthly Notices of the Royal Astronomical Society, 426, 739. https://doi.org/10.1111/j.1365-2966.2012.21780.x
- Heng & Kitzmann (2017) Heng, K., & Kitzmann, D. 2017, MNRAS, 470, 2972
- Heng et al. (2011) Heng, K., Menou, K., & Phillipps, P. J. 2011, MNRAS, 413, 2380
- Hoeijmakers et al. (2018) Hoeijmakers, H. J., Ehrenreich, D., Heng, K., et al. 2018, Nature, 560, 453
- Howard (2013) Howard, A. W. 2013, Science, 340, 572
- Hubeny et al. (2003) Hubeny, I., Burrows, A., & Sudarsky, D. 2003, ApJ, 594, 1011
- Hunter (2007) Hunter, J. D. 2007, Computing in Science & Engineering, 9, 90
- Kass & Raftery (1995) Kass, R. E., & Raftery, A. E. 1995, Journal of the american statistical association, 90, 773
- Lam et al. (2017) Lam, K. W. F., Faedi, F., Brown, D. J. A., et al. 2017, A&A, 599, A3
- Leconte et al. (2010) Leconte, J., Chabrier, G., Baraffe, I., & Levrard, B. 2010, A&A, 516, A64
- Li et al. (2015) Li, G., Gordon, I. E., Rothman, L. S., et al. 2015, The Astrophysical Journal Supplement Series, 216, 15
- Lithwick & Wu (2014) Lithwick, Y., & Wu, Y. 2014, Proceedings of the National Academy of Science, 111, 12610
- Lodders (2002) Lodders, K. 2002, The Astrophysical Journal, 577, 974. https://doi.org/10.1086%2F342241
- Lodders (2019) Lodders, K. 2019, arXiv e-prints, arXiv:1912.00844
- MacDonald et al. (2020) MacDonald, R. J., Goyal, J. M., & Lewis, N. K. 2020, arXiv e-prints, arXiv:2003.11548
- Madhusudhan (2012) Madhusudhan, N. 2012, ApJ, 758, 36
- Madhusudhan et al. (2016) Madhusudhan, N., Agúndez, M., Moses, J. I., & Hu, Y. 2016, Space Science Reviews, 205, 285–348. http://dx.doi.org/10.1007/s11214-016-0254-3
- Majeau et al. (2012) Majeau, C., Agol, E., & Cowan, N. B. 2012, ApJ, 747, L20
- Mazeh et al. (2016) Mazeh, T., Holczer, T., & Faigler, S. 2016, A&A, 589, A75
- McKinney (2011) McKinney, W. 2011, Python for High Performance and Scientific Computing, 14
- Morello et al. (2020) Morello, G., Claret, A., Martin-Lagarde, M., et al. 2020, AJ, 159, 75
- Mugnai et al. (2020) Mugnai, L. V., Pascale, E., Edwards, B., Papageorgiou, A., & Sarkar, S. 2020, arXiv e-prints, arXiv:2009.07824
- Oliphant (2006) Oliphant, T. E. 2006, A guide to NumPy, Vol. 1 (Trelgol Publishing USA)
- Owen & Lai (2018) Owen, J. E., & Lai, D. 2018, MNRAS, 479, 5012
- Palle et al. (2017) Palle, E., Chen, G., Prieto-Arranz, J., et al. 2017, A&A, 602, L15
- Peek et al. (2019) Peek, J., Desai, V., White, R. L., et al. 2019, in BAAS, Vol. 51, 105
- Pinhas et al. (2018) Pinhas, A., Madhusudhan, N., Gandhi, S., & MacDonald, R. 2018, Monthly Notices of the Royal Astronomical Society, 482, 1485–1498. http://dx.doi.org/10.1093/mnras/sty2544
- Pinhas et al. (2019) Pinhas, A., Madhusudhan, N., Gandhi, S., & MacDonald, R. 2019, MNRAS, 482, 1485
- Pluriel et al. (2020) Pluriel, W., Zingales, T., Leconte, J., & Parmentier, V. 2020, arXiv e-prints, arXiv:2003.05943
- Polyansky et al. (2018) Polyansky, O. L., Kyuberis, A. A., Zobov, N. F., et al. 2018, Monthly Notices of the Royal Astronomical Society, 480, 2597
- Rauscher & Menou (2013) Rauscher, E., & Menou, K. 2013, ApJ, 764, 103
- Ricker et al. (2014) Ricker, G. R., Winn, J. N., Vanderspek, R., et al. 2014, in Proceedings of the SPIE, Vol. 9143, Space Telescopes and Instrumentation 2014: Optical, Infrared, and Millimeter Wave, 914320
- Rocchetto et al. (2016) Rocchetto, M., Waldmann, I. P., Venot, O., Lagage, P. O., & Tinetti, G. 2016, ApJ, 833, 120
- Rodler (2018) Rodler, F. 2018, Exoplanet Research in the Era of the Extremely Large Telescope (ELT), 194
- Rothman et al. (1987) Rothman, L. S., Gamache, R. R., Goldman, A., et al. 1987, Appl. Opt., 26, 4058. http://ao.osa.org/abstract.cfm?URI=ao-26-19-4058
- Rothman et al. (2010) Rothman, L. S., Gordon, I. E., Barber, R. J., et al. 2010, J. Quant. Spec. Radiat. Transf., 111, 2139
- Sharp & Burrows (2007) Sharp, C. M., & Burrows, A. 2007, ApJS, 168, 140
- Showman et al. (2009) Showman, A. P., Fortney, J. J., Lian, Y., et al. 2009, The Astrophysical Journal, 699, 564
- Sing et al. (2016) Sing, D. K., Fortney, J. J., Nikolov, N., et al. 2016, Nature, 529, 59
- Sing et al. (2016) Sing, D. K., Fortney, J. J., Nikolov, N., et al. 2016, Nature, 529, 59
- Skidmore et al. (2018) Skidmore, W., Anupama, G. C., & Srianand, R. 2018, arXiv e-prints, arXiv:1806.02481
- Smalley et al. (2012) Smalley, B., Anderson, D. R., Collier-Cameron, A., et al. 2012, A&A, 547, A61
- Sotzen et al. (2019) Sotzen, K. S., Stevenson, K. B., Sing, D. K., et al. 2019, arXiv e-prints, arXiv:1911.02051
- Spake et al. (submitted) Spake, J. J., Sing, D. K., Wakeford, H. R., et al. submitted, MNRAS
- Stevenson et al. (2014) Stevenson, K. B., Désert, J.-M., Line, M. R., et al. 2014, Science, 346, 838
- Swain et al. (2008) Swain, M. R., Vasisht, G., & Tinetti, G. 2008, arXiv e-prints, arXiv:0802.1030
- Tennyson & Yurchenko (2018) Tennyson, J., & Yurchenko, S. 2018, Atoms, 6, 26
- Tennyson et al. (2016) Tennyson, J., Yurchenko, S. N., Al-Refaie, A. F., et al. 2016, Journal of Molecular Spectroscopy, 327, 73
- Tinetti et al. (2007) Tinetti, G., Vidal-Madjar, A., Liang, M.-C., et al. 2007, Nature, 448, 169
- Tinetti et al. (2018) Tinetti, G., Drossart, P., Eccleston, P., et al. 2018, Experimental Astronomy, 46, 135
- Tsiaras et al. (2016a) Tsiaras, A., Waldmann, I., Rocchetto, M., et al. 2016a, ascl:1612.018
- Tsiaras et al. (2016b) Tsiaras, A., Waldmann, I. P., Rocchetto, M., et al. 2016b, ApJ, 832, 202
- Tsiaras et al. (2019) Tsiaras, A., Waldmann, I. P., Tinetti, G., Tennyson, J., & Yurchenko, S. N. 2019, Nature Astronomy, 451
- Tsiaras et al. (2016c) Tsiaras, A., Rocchetto, M., Waldmann, I. P., et al. 2016c, ApJ, 820, 99
- Tsiaras et al. (2018) Tsiaras, A., Waldmann, I. P., Zingales, T., et al. 2018, AJ, 155, 156
- Virtanen et al. (2020) Virtanen, P., Gommers, R., Oliphant, T. E., et al. 2020, Nature Methods, 17, 261
- Visscher et al. (2010) Visscher, C., Lodders, K., & Fegley, B. 2010, The Astrophysical Journal, 716, 1060. https://doi.org/10.1088%2F0004-637x%2F716%2F2%2F1060
- Waldmann et al. (2015a) Waldmann, I. P., Rocchetto, M., Tinetti, G., et al. 2015a, ApJ, 813, 13
- Waldmann et al. (2015b) Waldmann, I. P., Tinetti, G., Rocchetto, M., et al. 2015b, ApJ, 802, 107
- Woitke et al. (2018) Woitke, P., Helling, C., Hunter, G. H., et al. 2018, A&A, 614, A1
- Wright et al. (2012) Wright, J. T., Marcy, G. W., Howard, A. W., et al. 2012, ApJ, 753, 160
- Yip et al. (2019) Yip, K. H., Waldmann, I. P., Tsiaras, A., & Tinetti, G. 2019, arXiv e-prints, arXiv:1811.04686
- Yurchenko et al. (2011) Yurchenko, S. N., Barber, R. J., & Tennyson, J. 2011, MNRAS, 413, 1828
- Yurchenko & Tennyson (2014) Yurchenko, S. N., & Tennyson, J. 2014, MNRAS, 440, 1649