Photoneutron Detection in Lightning by Gadolinium Orthosilicate Scintillators
Abstract
During a winter thunderstorm on November 24, 2017, a downward terrestrial gamma-ray flash took place and triggered photonuclear reactions with atmospheric nitrogen and oxygen nuclei, coincident with a lightning discharge at the Kashiwazaki-Kariwa nuclear power station in Japan. We directly detected neutrons produced by the photonuclear reactions with gadolinium orthosilicate scintillation crystals installed at sea level. Two gadolinium isotopes included in the scintillation crystals, 155Gd and 157Gd, have large cross sections of neutron captures to thermal neutrons such as 155Gd(n,)156Gd and 157Gd(n,)158Gd. De-excitation gamma rays from 156Gd and 158Gd are self-absorbed in the scintillation crystals, and make spectral-line features which can be distinguished from other non-neutron signals. The neutron burst lasted for 100 ms, and neutron fluences are estimated to be 52 and 31 neutrons cm-2 at two observation points inside the power plant. Gadolinium orthosilicate scintillators work as valid detectors for thermal neutrons in lightning.
I Introduction
Since the first detection reported by Shah et al.Shah et al. (1985), thunderstorms and lightning discharges have been thought to have an ability to produce neutrons in the atmosphereShyam and Kaushik (1999); Martin and Alves (2010); Gurevich et al. (2012); Chilingarian et al. (2012); Gurevich et al. (2015); Ishtiaq et al. (2016); Kuroda et al. (2016); Bowers et al. (2017); Enoto et al. (2017). At first, neutrons were considered to be produced via deutron-deutron fusions 2H(2H,)3He of vapor molecules in hot lightning pathsStephanakis et al. (1972); Shah et al. (1985); Ishtiaq et al. (2016). On the other hand, the discovery of high-energy phenomena in the atmosphere such as terrestrial gamma-ray flashes (TGFs) have convinced that thunderstorms can produce neutrons via photonuclear reactions with atmospheric nucleiBabich (2006, 2007); Carlson et al. (2010); Tavani et al. (2011); Bowers et al. (2017); Enoto et al. (2017).
TGFs are brief bursts of energetic photons lasting for hundreds of microseconds, coincident with lightning discharges. They have been routinely detected by in-orbit gamma-ray monitors such as Reuven Ramaty High Energy Solar Spectroscopic ImagerSmith et al. (2005), Astro‐Rivelatore Gamma a Immagini LeggeroTavani et al. (2011); Marisaldi et al. (2010), FermiBriggs et al. (2010); Mailyan et al. (2016), and Atmosphere-Space Interactions MonitorNeubert et al. (2019); Østgaard et al. (2019), after the discovery by Compton Gamma-Ray ObservatoryFishman et al. (1994). Besides space-borne observations of upward-oriented TGFs, similar downward-oriented phenomena have been reported by ground-based experiments, which are now called “downward TGFs”Dwyer et al. (2004); Tran et al. (2015); Hare et al. (2016); Bowers et al. (2017); Enoto et al. (2017); Abbasi et al. (2018); Smith et al. (2018); Wada et al. (2019a, b); Pleshinger et al. (2019); Wada et al. (2020). Both upward and downward TGFs originate from bremsstrahlung of relativistic electrons accelerated and multiplied by high electric fields in lightning.
Energy spectra of TGFs were found to extend up to 40 MeVSmith et al. (2005); Tavani et al. (2011); Marisaldi et al. (2010); Briggs et al. (2011). High-energy photons of 10 MeV can trigger photonuclear reactions with atmospheric nuclei such as 14N()13N (threshold 10.55 MeV) and 16O()15O (15.66 MeV). Neutrons generated by photonuclear reactions have kinetic energies of MeV, and are gradually thermalized in the atmosphere via multiple elastic scatterings with 14NRutjes et al. (2017); Bowers et al. (2017); Enoto et al. (2017). When photoneutrons are generated at a low altitude, i.e. during low-charge-center winter thunderstorms, a part of neutrons arrives at the ground while the rest is captured by ambient 14N via a neutron capture 14N()15N or a charged-particle reaction 14N()14CBabich (2017). Therefore, neutrons can be detected by ground-based apparatus in that case.
Detection techniques of thermal neutrons have been developed in various fields, such as astroparticle physics, nuclear security, non destructive inspection, etc. Common reactions utilized to detect thermal neutrons are neutron captures 1H()2H, 3He()2H, 6Li()3He, and 10B()7Li. For example, proportional counters filled with BF3 (including 10B) or 3He gas detected thermal neutrons in lightning at previous studiesShah et al. (1985); Shyam and Kaushik (1999); Martin and Alves (2010); Gurevich et al. (2012); Chilingarian et al. (2012); Ishtiaq et al. (2016). In addition to those reactions, gadolinium isotopes 155Gd and 157Gd have drawn attention as another neutron detection schemeKuroda et al. (2012); Oguri et al. (2014); Kuroda et al. (2016); Marti-Magro and Super-Kamiokande Collaboration (2017) thanks to their high cross sections to low-energy neutrons. Here we report a direct neutron detection by gadolinium orthosilicate scintillators coincident with a lightning discharge during a winter thunderstorm in Japan.
II Instrument
Gadolinium orthosilicate scintillator (celium-doped Gd2SiO5: GSO) is a relatively new type of inorganic scintillation crystals. GSO is characterized by high density (6.7 g cm-3), fast decaying of scintillation light (40 ns), and high radiation resistance ( Gy). They were employed for the Hard X-ray Detector onboard the Japanese X-ray astronomy satellite SuzakuTakahashi et al. (2007); Kokubun et al. (2007).
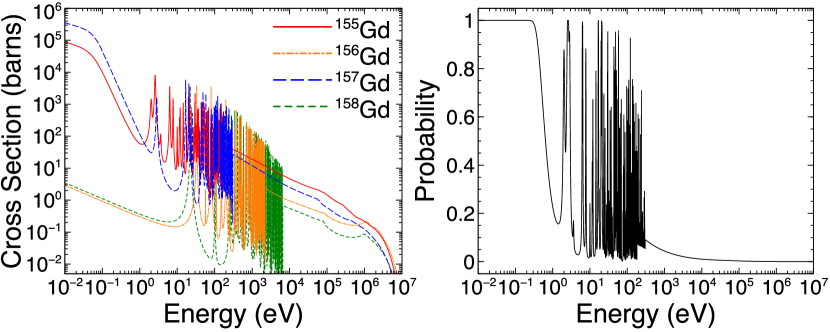
Since GSO scintillators contain gadolinium isotopes, they are thought to be suitable for thermal neutron detectionReeder (1994). The upper panel of Figure 1 shows cross sections of neutron captures with stable gadolinium isotopes. The isotopes 155Gd (14.8% in nature) and 157Gd (15.7%) have significantly high cross sections of neutron captures to thermal neutrons (0.025 eV) of and barns, respectively. As shown in the lower panel of Figure 1, a 5-mm thick GSO scintillator stops almost all neutrons below 0.3 eV via neutron captures 155Gd(,)156Gd and 157Gd(,)158Gd. After Gd nuclei capture a neutron, they emit de-excitation gamma rays; 156Gd mainly emits gamma-ray lines at 88.97 and 199.22 keV, and 158Gd at 79.51 and 181.94 keVShibata et al. (2011). The de-excitation lines are self-absorbed in the GSO scintillators, and hence they make a clear spectral-line feature for neutron detection.
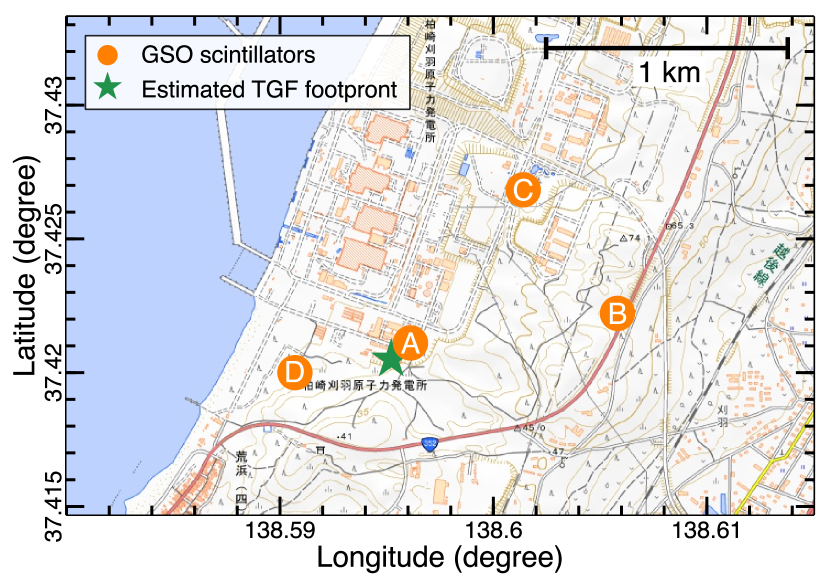
The Gamma-ray Observation of Winter Thunderclouds (GROWTH) experiment has been successfully operated in coastal areas of the Sea of Japan since 2006Tsuchiya et al. (2007, 2011, 2013); Umemoto et al. (2016); Enoto et al. (2017); Wada et al. (2018, 2019d, 2019c). One of our observation sites, the Kashiwazaki-Kariwa nuclear power station of Tokyo Electric Power Company Holdings in Niigata Prefecture, Japan, was upgraded with four gamma-ray detectors in 2016. The locations of the gamma-ray detectors are shown in Figure 2. Based on the discovery of photoneutron productions in winter lightningEnoto et al. (2017); Bowers et al. (2017), GSO scintillators were added to the four detectors in 2017 for neutron detection. We utilized GSO scintillators of cm3. These are connected with a photo-multiplier tube of Hamamatsu R7600U, and read out by our original data acquisition systemEnoto et al. (2017); Wada et al. (2018, 2019e).
III Calibration in laboratory
This laboratory calibration aims at confirming spectral features of neutron captures by Gd nuclei, and constraining a conversion factor to estimate the number of neutron captures in the GSO scintillators from intensities of de-excitation lines. The intensity of de-excitation lines is affected by various processes: branching ratios of de-excitation lines, detection efficiency of gamma-ray photons inside scintillators, and simultaneous self-absorption of multiple de-excitation lines. To take these effects into account, we performed a calibration measurement by irradiating neutrons to a GSO scintillator. We utilized 252Cf as a neutron source, which exhibits spontaneous fissions with a half life of 2.645 years; 0.188 neutrons are emitted per a decay on average. The energy spectrum of neutrons emitted from this isotope follows , where is the kinetic energy of neutrons(Meadows, 1967). The 252Cf source utilized here had a radioactivity of 30 kBq at the moment of the measurement, calibrated by the manufacturer of this source; neutrons were emitted per second. Note that 30% systematic uncertainty is claimed to the radioactivity.
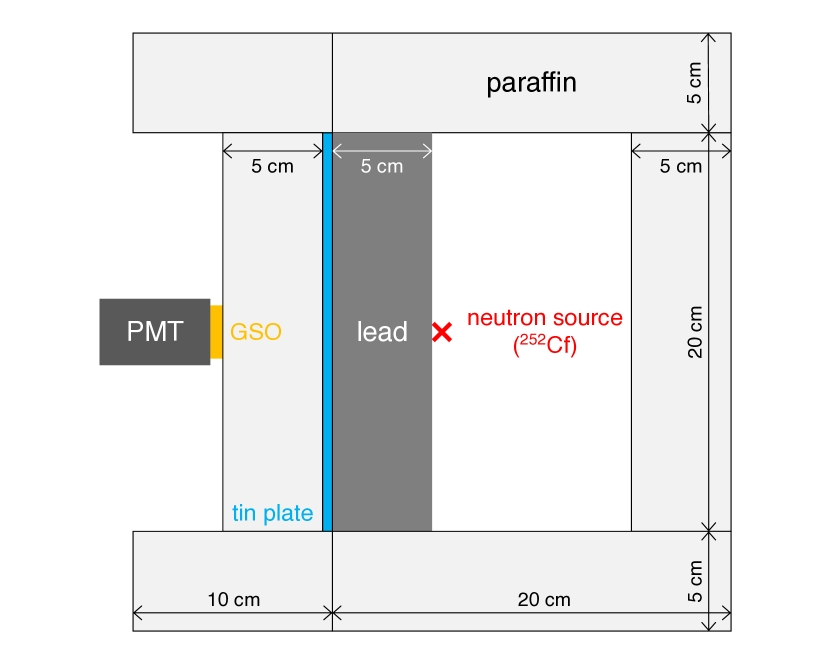
The measurement setup is shown in Figure 3. A lead block of 5-cm thickness, a tin plate of 3-mm thickness, and a paraffin block of 5-cm thickness are placed between the GSO scintillator and the neutron source. The lead block reduces background counts in GSO by screening gamma rays from 252Cf. Neutrons penetrating the lead block are thermalized by the paraffin block, then enter the GSO as thermal or epithermal neutrons. When the lead block absorbs gamma rays, the K X-ray line at 74.2 keV can be emitted. This line contaminates the energy spectrum in GSO and be mixed up with 89.0 keV and 79.5 keV gamma rays from 156Gd and 158Gd respectively, because the energy resolution of this setup at is 14.3 keV at 81 keV (17.6%; FWHM). Therefore, the tin plate is inserted to screen the K line from lead. The plate of 3-mm thickness cuts 99.8% of 80-keV photons. X-rays from tin (at 25.2 keV) do not matter in this measurement. Energy calibration of GSO was performed with the 32- and 662-keV lines of 137Cs, 81- and 356-keV lines of 133Ba. The gain calibration accuracy is within 4%, which is considered as a systematic error.
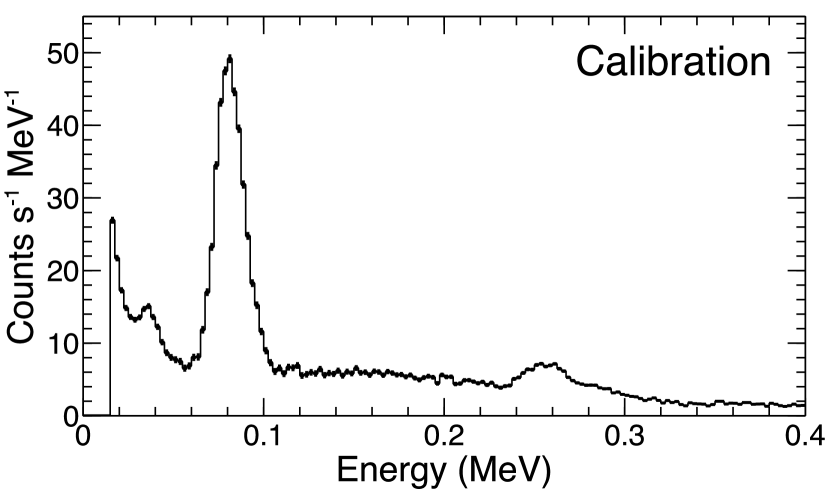
Measurements with 252Cf and background measurements were performed for 45.5 hours and 124 hours, respectively. Figure 4 presents the obtained energy spectrum. The most significant line is at 80 keV. In addition, lines around 35 keV and 260 keV are also found. These spectral features are consistent with a previous work(Reeder, 1994). By evaluating the primary line with a Gaussian and a continuum component, the center and count rate of the line is determined to be keV and , respectively. Statistical uncertainties shown in the present paper are at 1 confidence level. The line center is consistent with the 79.5 keV line from 158Gd. Therefore, the line mainly originates from neutron captures 157Gd(,)158Gd. It is thought that the contribution from 155Gd(,)156Gd, which emits a 89.0 keV line, is smaller than 157Gd(,)158Gd because its cross section to thermal neutrons is one forth of 157Gd(,)158Gd. In the same way, the center of the 260-keV line is determined to be keV. This line is consistent with a simultaneous detection of 79.5-keV and 181.9-keV lines from 158Gd as one line at 261.4 keV. In addition, 156Gd and 158Gd emit 38.7-keV and 29.3-keV electrons by internal conversions instead of 89.0-keV and 79.5-keV gamma rays, respectively(Reeder, 1994). The line structure around 35 keV seems to originate from monochromatic electrons of the internal conversion.
A Monte-Carlo simulation was then performed to test the number of neutrons captured in GSO in the geometry of the present experiment. A mass model of the geometry shown in Figure 3 is implemented in the simulation. Neutrons with the spectrum from 252Cf fissions were generated isotropically, then the number of the reactions 155Gd(n,)156Gd and 157Gd(n,)158Gd is registered. When neutrons are captured in GSO, tracking of their secondary products was terminated. Here we employed the neutron cross-section database JENDL-4.0(Shibata et al., 2011), developed and distributed by Japan Atomic Energy Agency.
When neutrons were generated in the simulation, reactions of 155Gd(n,)156Gd and reactions of 157Gd(n,)158Gd were registered. For the present geometry, the ratios of the reactions 155Gd(n,)156Gd and 157Gd(n,)158Gd to the total number of the generated neutrons are 0.022% and 0.075% respectively, and 0.097% in total.
Then, the simulation and the measurement are compared. The neutron source 252Cf emitted at the moment of the calibration measurement. Combining the neutron-emission rate with the ratio 0.097% obtained by the simulation, an expected neutron-capture rate in the GSO scintillator is . For comparison, the calibration measurement derived that the main 80-keV peak in Figure 4 has an intensity of . Therefore, one neutron-capture reaction inside a GSO scintillator makes counts at 80-keV. We adopted this number as a conversion factor to estimate neutron fluences in the following sections.
IV Observation
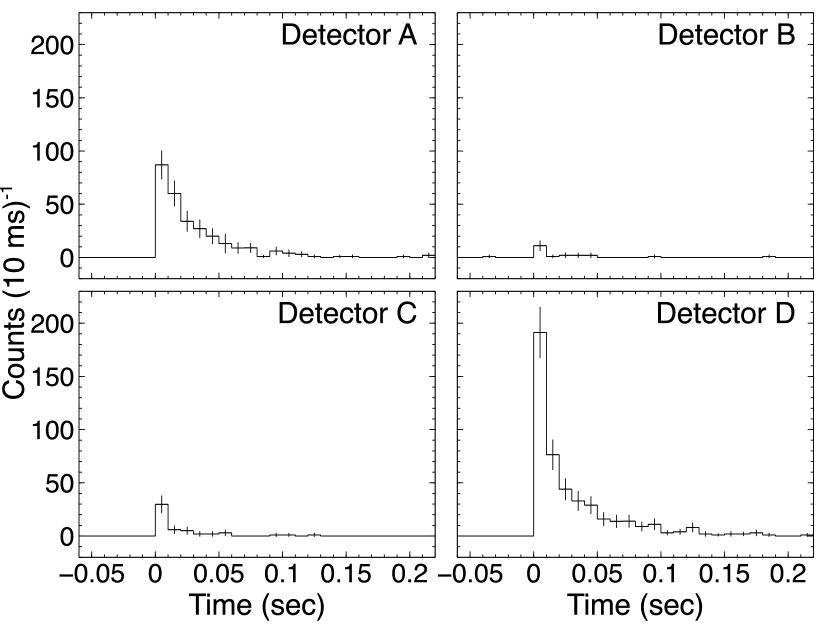
At 10:03:02, November 24th, 2017 (in Coordinated Universal Time), our gamma-ray detectors and monitoring posts operated by the power station recorded a downward TGF, as we previously reportedWada et al. (2019c). The downward TGF was followed by de-excitation gamma rays of neutron captures in the atmosphere, originating from photonuclear reactions. At the same time as the detection of the downward TGF and the photonuclear reactions, the GSO scintillators also recorded an increase in count rates lasting for 100 ms. Count-rate histories obtained by the GSO scintillators are shown in Figure 5. Significant increases in count rates were observed by Detectors A and D coincident with the lightning discharge.
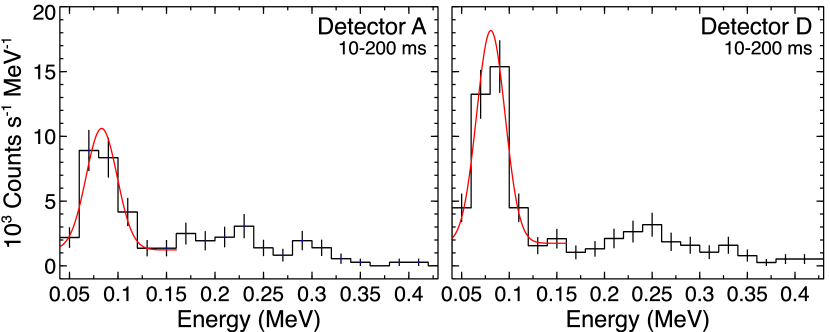
Energy spectra recorded by Detectors A and D were extracted from 10 ms to 200 ms after the lightning discharge, and presented in Figure 6. Since the initial 10 ms was disturbed by the downward TGF itself, this time domain was excluded for spectral analysis. Both spectra have a significant line feature at a low energy range around 80 keV. The center energy of the line was evaluated as keV and keV for Detectors A and D respectively by fitting with a Gaussian function plus a constant component. This is consistent with the center energy at 81 keV, obtained by the calibration measurement. Therefore, this is a successful detection of neutrons by GSO scintillators.
The photon counts at the line were also evaluated to be counts and counts for Detectors A and D respectively by the spectral fitting. By utilizing the conversion factor counts per one neutron capture obtained by the calibration, and neutrons were captured in the GSO scintillators of Detectors A and D, respectively.
V Discussion
The GSO scintillators employed in the present study have a detection area of cm2. For thermal neutrons, whose kinetic energies are 0.025 eV or less, the detection efficiency is almost 1.0 (Figure 1), and the effective area of the GSO scintillators is 5.76 cm2. In the actual situation, however, neutrons are not totally thermalized, and epi-thermal and fast neutrons must be also reaching the ground (e.g. Figure 3 in Bowers et al.Bowers et al. (2017)), not interacting with GSO (e.g. Figure 3 in Bowers et al.Bowers et al. (2017)) Therefore, we can only estimate lower limits of neutron fluences on the ground, based on the recorded number of neutron captures; 31 neutrons cm-2 and 52 neutrons cm-2 for Detectors A and D, respectively.
In our previous publicaitonWada et al. (2019c), we estimated the height, position, and the number of avalanche electrons of the downward TGF based on the on-ground measurement of radiation doses by monitoring posts. The footprint of the downward TGF was located 100 m southwest from Detector A, as shown in Figure 2. In the present result, GSO scintillators of Detectors A and D observed a significant number of neutrons, while Detectors B and C did not. Therefore, a larger number of neutrons were generated by the downward TGF around Detectors A and D, rather than around Detectors B and C. This is consistent with our previous estimation of the footprintWada et al. (2019c). The height and the number of avalanche electrons of the downward TGF had been also estimated to be km and electrons (above 1 MeV)Wada et al. (2019c). To compare the estimation and the present result of neutron fluences, we need end-to-end Monte-Carlo simulations calculating photonuclear reactions and propagation of neutrons in the atmosphere, which will be covered as a future work.
This paper presents that neutrons reaching the ground were directly detected by GSO scintillators coincident with a lightning discharge. Besides neutrons, de-excitation gamma-ray photons via atmospheric neutron captures 14N()15N also reached the ground simultaneously. In even such a high-radiation environment, GSO scintillators work as valid detectors for thermal neutron, as de-excitation gamma-ray lines of neutron captures with gadolinium isotopes were self-absorbed and clearly identified in energy spectra.
Acknowledgements.
We deeply thank the radiation safety group of the Kashiwazaki-Kariwa nuclear power plant for providing the observation site. Monte-Carlo simulations were performed on the Hokusai BigWaterfall supercomputing system operated by RIKEN Head Office for Information Systems and Cybersecurity. This research is supported by JSPS/MEXT KAKENHI grants 16H06006, 17K05659, 18J13355, 18H01236, 19H00683, and citizen supporters via an academic crowdfunding platform “academist”. T.E. is supported by Kyoto University and RIKEN Hakubi Fellow Programs. The background image in Figure 2 was provided by the Geospatial Information Authority of Japan.References
- Shah et al. (1985) G. N. Shah, H. Razdan, C. L. Bhat, and Q. M. Ali, Nature 313, 773 (1985).
- Shyam and Kaushik (1999) A. Shyam and T. C. Kaushik, Journal of Geophysical Research: Space Physics 104, 6867 (1999).
- Martin and Alves (2010) I. M. Martin and M. A. Alves, Journal of Geophysical Research: Space Physics 115, n/a (2010).
- Gurevich et al. (2012) A. V. Gurevich, V. P. Antonova, A. P. Chubenko, A. N. Karashtin, G. G. Mitko, M. O. Ptitsyn, V. A. Ryabov, A. L. Shepetov, Y. V. Shlyugaev, L. I. Vildanova, and et al., Physical Review Letters 108 (2012), 10.1103/physrevlett.108.125001.
- Chilingarian et al. (2012) A. Chilingarian, N. Bostanjyan, and L. Vanyan, Physical Review D 85 (2012), 10.1103/physrevd.85.085017.
- Gurevich et al. (2015) A. Gurevich, V. Antonova, A. Chubenko, A. Karashtin, O. Kryakunova, V. Lutsenko, G. Mitko, V. Piskal, M. Ptitsyn, V. Ryabov, and et al., Atmospheric Research 164-165, 339 (2015).
- Ishtiaq et al. (2016) P. M. Ishtiaq, S. Mufti, M. A. Darzi, T. A. Mir, and G. N. Shah, Journal of Geophysical Research: Atmospheres 121, 692 (2016).
- Kuroda et al. (2016) Y. Kuroda, S. Oguri, Y. Kato, R. Nakata, Y. Inoue, C. Ito, and M. Minowa, Physics Letters B 758, 286 (2016).
- Bowers et al. (2017) G. S. Bowers, D. M. Smith, G. F. Martinez-McKinney, M. Kamogawa, S. A. Cummer, J. R. Dwyer, D. Wang, M. Stock, and Z. Kawasaki, Geophysical Research Letters 44, 10,063 (2017).
- Enoto et al. (2017) T. Enoto, Y. Wada, Y. Furuta, K. Nakazawa, T. Yuasa, K. Okuda, K. Makishima, M. Sato, Y. Sato, T. Nakano, and et al., Nature 551, 481 (2017).
- Stephanakis et al. (1972) S. J. Stephanakis, L. S. Levine, D. Mosher, I. M. Vitkovitsky, and F. Young, Physical Review Letters 29, 568 (1972).
- Babich (2006) L. P. Babich, JETP Letters 84, 285 (2006).
- Babich (2007) L. P. Babich, Geomagnetism and Aeronomy 47, 664 (2007).
- Carlson et al. (2010) B. E. Carlson, N. G. Lehtinen, and U. S. Inan, Journal of Geophysical Research: Space Physics 115 (2010), 10.1029/2009ja014696.
- Tavani et al. (2011) M. Tavani, M. Marisaldi, C. Labanti, F. Fuschino, A. Argan, A. Trois, P. Giommi, S. Colafrancesco, C. Pittori, F. Palma, and et al., Physical Review Letters 106 (2011), 10.1103/physrevlett.106.018501.
- Smith et al. (2005) D. M. Smith, L. I. Lopez, R. P. Lin, and C. P. Barrington-Leigh, Science 307, 1085 (2005), http://science.sciencemag.org/content/307/5712/1085.full.pdf .
- Marisaldi et al. (2010) M. Marisaldi, F. Fuschino, C. Labanti, M. Galli, F. Longo, E. Del Monte, G. Barbiellini, M. Tavani, A. Giuliani, E. Moretti, and et al., Journal of Geophysical Research: Space Physics 115 (2010), 10.1029/2009ja014502.
- Briggs et al. (2010) M. S. Briggs, G. J. Fishman, V. Connaughton, P. N. Bhat, W. S. Paciesas, R. D. Preece, C. Wilson-Hodge, V. L. Chaplin, R. M. Kippen, A. von Kienlin, and et al., Journal of Geophysical Research: Space Physics 115 (2010), 10.1029/2009ja015242.
- Mailyan et al. (2016) B. G. Mailyan, M. S. Briggs, E. S. Cramer, G. Fitzpatrick, O. J. Roberts, M. Stanbro, V. Connaughton, S. McBreen, P. N. Bhat, and J. R. Dwyer, Journal of Geophysical Research: Space Physics 121, 11,346 (2016).
- Neubert et al. (2019) T. Neubert, N. Østgaard, V. Reglero, O. Chanrion, M. Heumesser, K. Dimitriadou, F. Christiansen, C. Budtz-Jørgensen, I. Kuvvetli, I. L. Rasmussen, and et al., Science , eaax3872 (2019).
- Østgaard et al. (2019) N. Østgaard, T. Neubert, V. Reglero, K. Ullaland, S. Yang, G. Genov, M. Marisaldi, A. Mezentsev, P. Kochkin, N. Lehtinen, and et al., Journal of Geophysical Research: Atmospheres 124, 14024 (2019).
- Fishman et al. (1994) G. J. Fishman, P. N. Bhat, R. Mallozzi, J. M. Horack, T. Koshut, C. Kouveliotou, G. N. Pendleton, C. A. Meegan, R. B. Wilson, W. S. Paciesas, and et al., Science 264, 1313 (1994).
- Dwyer et al. (2004) J. R. Dwyer, H. K. Rassoul, M. Al-Dayeh, L. Caraway, B. Wright, A. Chrest, M. A. Uman, V. A. Rakov, K. J. Rambo, D. M. Jordan, and et al., Geophysical Research Letters 31 (2004), 10.1029/2003gl018771.
- Tran et al. (2015) M. Tran, V. Rakov, S. Mallick, J. Dwyer, A. Nag, and S. Heckman, Journal of Atmospheric and Solar-Terrestrial Physics 136, 86 (2015).
- Hare et al. (2016) B. M. Hare, M. A. Uman, J. R. Dwyer, D. M. Jordan, M. I. Biggerstaff, J. A. Caicedo, F. L. Carvalho, R. A. Wilkes, D. A. Kotovsky, W. R. Gamerota, and et al., Journal of Geophysical Research: Atmospheres 121, 6511 (2016).
- Abbasi et al. (2018) R. U. Abbasi, T. Abu-Zayyad, M. Allen, E. Barcikowski, J. W. Belz, D. R. Bergman, S. A. Blake, M. Byrne, R. Cady, B. Cheon, and et al., Journal of Geophysical Research: Atmospheres 123, 6864 (2018).
- Smith et al. (2018) D. M. Smith, G. S. Bowers, M. Kamogawa, D. Wang, T. Ushio, J. Ortberg, J. R. Dwyer, and M. Stock, Journal of Geophysical Research: Atmospheres (2018), 10.1029/2018jd029105.
- Wada et al. (2019a) Y. Wada, T. Enoto, Y. Nakamura, Y. Furuta, T. Yuasa, K. Nakazawa, T. Morimoto, M. Sato, T. Matsumoto, D. Yonetoku, T. Sawano, H. Sakai, M. Kamogawa, T. Ushio, K. Makishima, and H. Tsuchiya, Communications Physics 2, 67 (2019a).
- Wada et al. (2019b) Y. Wada, T. Enoto, K. Nakazawa, Y. Furuta, T. Yuasa, Y. Nakamura, T. Morimoto, T. Matsumoto, K. Makishima, and H. Tsuchiya, Physical Review Letters 123 (2019b), 10.1103/physrevlett.123.061103.
- Pleshinger et al. (2019) D. J. Pleshinger, S. T. Alnussirat, J. Arias, S. Bai, Y. Banadaki, M. L. Cherry, J. H. Hoffman, E. Khosravi, M. D. Legault, R. Rodriguez, and et al., Journal of Geophysical Research: Space Physics (2019), 10.1029/2019ja026820.
- Wada et al. (2020) Y. Wada, T. Enoto, Y. Nakamura, T. Morimoto, M. Sato, T. Ushio, K. Nakazawa, T. Yuasa, D. Yonetoku, T. Sawano, and et al., Journal of Geophysical Research: Atmospheres (2020), 10.1029/2019jd031730.
- Briggs et al. (2011) M. S. Briggs, V. Connaughton, C. Wilson-Hodge, R. D. Preece, G. J. Fishman, R. M. Kippen, P. N. Bhat, W. S. Paciesas, V. L. Chaplin, C. A. Meegan, and et al., Geophysical Research Letters 38 (2011), 10.1029/2010gl046259.
- Rutjes et al. (2017) C. Rutjes, G. Diniz, I. S. Ferreira, and U. Ebert, Geophysical Research Letters 44, 10,702 (2017).
- Babich (2017) L. P. Babich, Geophysical Research Letters 44, 11,191 (2017).
- Shibata et al. (2011) K. Shibata, O. Iwamoto, T. Nakagawa, N. Iwamoto, A. Ichihara, S. Kunieda, S. Chiba, K. Furutaka, N. Otuka, T. Ohsawa, and et al., Journal of Nuclear Science and Technology 48, 1 (2011).
- Wada et al. (2019c) Y. Wada, T. Enoto, K. Nakazawa, Y. Furuta, T. Yuasa, Y. Nakamura, T. Morimoto, T. Matsumoto, K. Makishima, and H. Tsuchiya, Physical Review Letters 123 (2019c), 10.1103/physrevlett.123.061103.
- Kuroda et al. (2012) Y. Kuroda, S. Oguri, Y. Kato, R. Nakata, Y. Inoue, C. Ito, and M. Minowa, Nuclear Instruments and Methods in Physics Research Section A: Accelerators, Spectrometers, Detectors and Associated Equipment 690, 41 (2012).
- Oguri et al. (2014) S. Oguri, Y. Kuroda, Y. Kato, R. Nakata, Y. Inoue, C. Ito, and M. Minowa, Nuclear Instruments and Methods in Physics Research Section A: Accelerators, Spectrometers, Detectors and Associated Equipment 757, 33 (2014).
- Marti-Magro and Super-Kamiokande Collaboration (2017) L. Marti-Magro and Super-Kamiokande Collaboration, International Cosmic Ray Conference 301, 1043 (2017).
- Takahashi et al. (2007) T. Takahashi, K. Abe, M. Endo, Y. Endo, Y. Ezoe, Y. Fukazawa, M. Hamaya, S. Hirakuri, S. Hong, M. Horii, and et al., Publications of the Astronomical Society of Japan 59, S35 (2007).
- Kokubun et al. (2007) M. Kokubun, K. Makishima, T. Takahashi, T. Murakami, M. Tashiro, Y. Fukazawa, T. Kamae, G. M. Madejski, K. Nakazawa, K. Yamaoka, and et al., Publications of the Astronomical Society of Japan 59, S53 (2007).
- Reeder (1994) P. Reeder, Nuclear Instruments and Methods in Physics Research Section A: Accelerators, Spectrometers, Detectors and Associated Equipment 353, 134 (1994).
- Tsuchiya et al. (2007) H. Tsuchiya, T. Enoto, S. Yamada, T. Yuasa, M. Kawaharada, T. Kitaguchi, M. Kokubun, H. Kato, M. Okano, S. Nakamura, and et al., Physical Review Letters 99 (2007), 10.1103/physrevlett.99.165002.
- Tsuchiya et al. (2011) H. Tsuchiya, T. Enoto, S. Yamada, T. Yuasa, K. Nakazawa, T. Kitaguchi, M. Kawaharada, M. Kokubun, H. Kato, M. Okano, and et al., Journal of Geophysical Research 116 (2011), 10.1029/2010jd015161.
- Tsuchiya et al. (2013) H. Tsuchiya, T. Enoto, K. Iwata, S. Yamada, T. Yuasa, T. Kitaguchi, M. Kawaharada, K. Nakazawa, M. Kokubun, H. Kato, and et al., Physical Review Letters 111 (2013), 10.1103/physrevlett.111.015001.
- Umemoto et al. (2016) D. Umemoto, H. Tsuchiya, T. Enoto, S. Yamada, T. Yuasa, M. Kawaharada, T. Kitaguchi, K. Nakazawa, M. Kokubun, H. Kato, and et al., Physical Review E 93 (2016), 10.1103/physreve.93.021201.
- Wada et al. (2018) Y. Wada, G. S. Bowers, T. Enoto, M. Kamogawa, Y. Nakamura, T. Morimoto, D. M. Smith, Y. Furuta, K. Nakazawa, T. Yuasa, and et al., Geophysical Research Letters 45, 5700 (2018).
- Wada et al. (2019d) Y. Wada, T. Enoto, Y. Nakamura, Y. Furuta, T. Yuasa, K. Nakazawa, T. Morimoto, M. Sato, T. Matsumoto, D. Yonetoku, T. Sawano, H. Sakai, M. Kamogawa, T. Ushio, K. Makishima, and H. Tsuchiya, Communications Physics 2, 67 (2019d).
- Wada et al. (2019e) Y. Wada, T. Enoto, Y. Furuta, K. Nakazawa, T. Yuasa, T. Matsumoto, D. Umemoto, K. Makishima, and H. Tsuchiya (GROWTH), in Proceedings of International Symposium TEPA 2018: Thunderstorms and Elementary Particle Acceleration (2019) pp. 85–92, arXiv:1811.06212 [physics.ao-ph] .
- Meadows (1967) J. W. Meadows, Physical Review 157, 1076 (1967).