Possible evidence of ongoing planet formation in AB Aurigae††thanks: Based on data collected at the European Southern Observatory under programs 0104.C-0157, and 2104.C-5036
Abstract
Context. Planet formation is expected to take place in the first million years of a planetary system through various processes, which remain to be tested through observations.
Aims. With the recent discovery, using ALMA, of two gaseous spiral arms inside the 120 au cavity and connected to dusty spirals, the famous protoplanetary disk around AB Aurigae presents a strong incentive for investigating the mechanisms that lead to giant planet formation. A candidate protoplanet located inside a spiral arm has already been claimed in an earlier study based on the same ALMA data.
Methods. We used SPHERE at the Very Large Telescope (VLT) to perform near-infrared (IR) high-contrast imaging of AB Aur in polarized and unpolarized light in order to study the morphology of the disk and search for signs of planet formation.
Results. SPHERE has delivered the deepest images ever obtained for AB Aur in scattered light. Among the many structures that are yet to be understood, we identified not only the inner spiral arms, but we also resolved a feature in the form of a twist in the eastern spiral at a separation of about 30 au. The twist of the spiral is perfectly reproduced with a planet-driven density wave model when projection effects are accounted for. We measured an azimuthal displacement with respect to the counterpart of this feature in the ALMA data, which is consistent with Keplerian motion on a 4-yr baseline. Another point sxce is detected near the edge of the inner ring, which is likely the result of scattering as opposed to the direct emission from a planet photosphere. We tentatively derived mass constraints for these two features.
Conclusions. The twist and its apparent orbital motion could well be the first direct evidence of a connection between a protoplanet candidate and its manifestation as a spiral imprinted in the gas and dust distributions.
Key Words.:
Stars: individual (AB Aur) – Protoplanetary disks – Planet-disk interactions – Techniques: image processing – Techniques: high angular resolution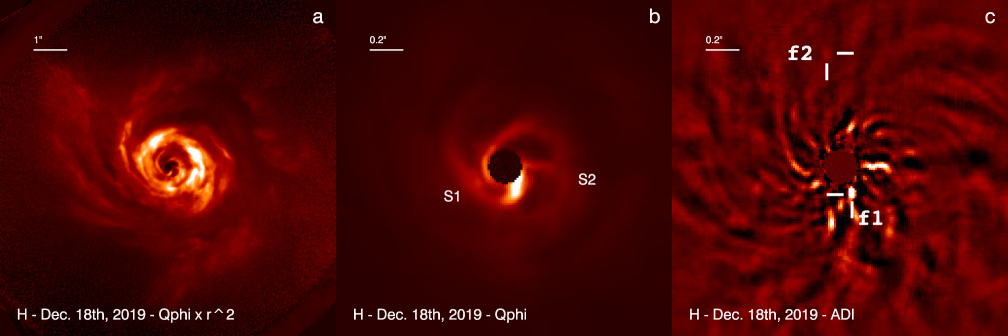
1 Introduction
Planets are believed to form in protoplanetary disks over a few million years. Images at all wavelengths exhibit a variety of structures, such as asymmetries, clumps, rings, or spirals. Most of these features, which hypothetically betray the presence of planets via gravitational or hydrodynamical effects, have been observed in disks orbiting Herbig Ae/Be stars because of their suitable brightness, particularly in the NIR (see for instance Grady et al. 2001; Clampin et al. 2003; Fukagawa et al. 2006; Isella et al. 2010; Christiaens et al. 2014). Planet formation is generally favored (Zhu 2015) over instabilities in a massive self-gravitating disk (Rice et al. 2005). In the early stage of planet formation, hydrodynamical simulations indicate that the accretion process generates at the planet location an inner and outer spiral pattern due to Lindblad resonances induced by disk-planet interactions (Gressel et al. 2013). While this crucial step is well-documented by theoretical works (Dong et al. 2015; Bae & Zhu 2018), observational evidence is rare and not fully conclusive. Recently, Muro-Arena et al. (2020) identified a kinked spiral in the protoplanetary disk SR 21, suggesting that it may be a promising system for potentially witnessing ongoing planet formation.
With a spectral type A0 (, DeWarf et al. 2003), AB Aurigae is one of the closest ( pc, Gaia Collaboration et al. 2018), and one of the most intensively studied Herbig Ae star. Optical scattered light images of its protoplanetary disk have been obtained in the visible (Grady et al. 1999; Fukagawa et al. 2004), and in the near-IR (Perrin et al. 2009; Hashimoto et al. 2011), revealing a moderately inclined (), flared disk and prominent spiral patterns extending from 200 to 450 au. In fact, AB Aurigae exhibits among the most spectacular spirals imaged so far in scattered light and high-contrast polarimetric imaging.
Millimetric observations have also been key in constraining the distribution of gas and dust in the AB Aur system. Using the IRAM Plateau de Bure Interferometer, Piétu et al. (2005) reported the presence of a large CO and dust rotating disk with a central cavity of an inner radius of au. Surprisingly, Tang et al. (2012) found counter-rotating CO spirals in the outer disk, which has been explained by projection effects of accretion flows arising from above the disk’s midplane. The high accretion rate (/yr, Salyk et al. 2013) measured for this 1 Myr object reinforces this interpretation.
More recently, Tang et al. (2017) studied the CO 2-1 and dust continuum distribution at very high angular scale ( or 13 au) using ALMA and revealed two spectacular CO spirals residing inside the large disk cavity. The authors speculated that these spirals are driven by planet formation and could be generated by two planets respectively located at 30 and 60-80 au from the star. Motivated by these results, we conducted VLT/SPHERE observations of the AB Aurigae system and present them in this letter. Here, we describe the observations, analyze the data and discuss the possible origin of the inner spiral pattern.
2 Observations
AB Aur (V=7.05, H=5.06, K=4.23) has been observed with SPHERE (Beuzit et al. 2019) in polarimetry (Dec 2019) and in spectro-photometry (Jan 2020). The first data set was obtained with the infrared camera IRDIS (Dohlen et al. 2008; de Boer et al. 2020) using Pupil Tracking (PT) in the H band, which allows us to retrieve, at the same time, the polarized intensity of the disk and the total intensity by making use of differential polarimetric imaging (DPI) and of angular differential imaging (ADI). The second epoch used the IRDIFS-EXT mode of SPHERE, which combines IRDIS in the K1K2 filters, and the spectrograph (IFS, Claudi et al. 2008) in low-resolution mode YJH (R=30), also processed with ADI. The observing log is provided in Table 1.
Both DPI and ADI increase the contrast by rejecting the starlight, exploiting either the fact that the stellar light is unpolarized or that off-axis objects rotate with the field in PT mode. While DPI provides unbiased polarimetric images of disks, ADI induces very strong photometric and astrometric artifacts owing to the self-subtraction effect (Milli et al. 2012). The data were processed at the SPHERE Data Center following Pavlov et al. (2008); Delorme et al. (2017); Maire et al. (2016). The calibrated data cubes were then processed with SpeCal for total intensity data (Galicher et al. 2018) and with a custom pipeline for polarimetric data (as in Bhowmik et al. 2019). The total intensity data were reduced with Principal Component Analysis (Soummer et al. 2012), whereas for polarimetry, we calculated the azimuthal Stokes parameters and maps following Schmid et al. (2006). For a sanity check, we compared our polarimetric reductions with those of the IRDAP pipeline (van Holstein et al. 2020), which implements a careful treatment of the instrumental polarization. We found that since the instrumental effects are much fainter than the disk structures we further discuss below, the images are identical in both pipelines. The first epoch is significantly better in terms of starlight rejection, therefore the following sections are mainly based on these observations.
3 Disk morphology
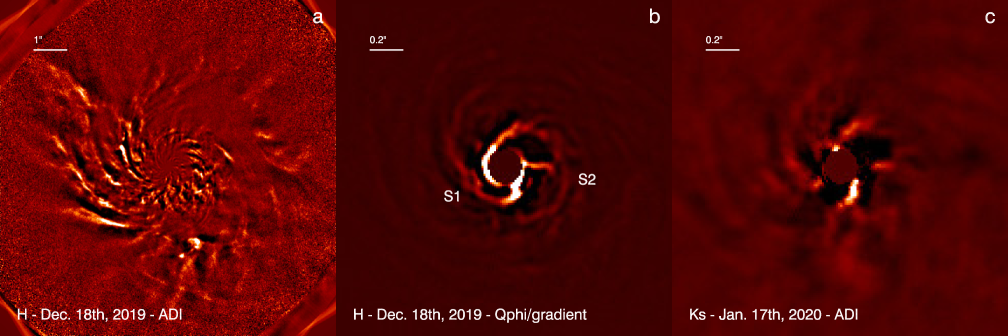
As the disk is moderately inclined, the ADI process strongly and irremediably attenuates the disk signal (Fig. 1c). Therefore, the following description is based on the polarimetric H-band image (Fig. 1a, b). The disk is visible all across the IRDIS field of view. We identify three main regions: the dust ring, the outer spirals, and the inner spirals.
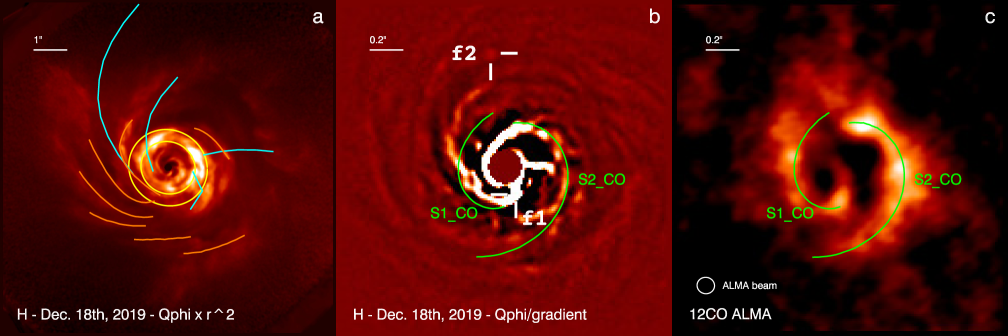
The position of the ring detected with ALMA in the continuum (Tang et al. 2017) is shown in Fig. 2a. In the sub-mm, it encompasses an elliptical region oriented at about 60∘ north to east, from a minimal radius of to a maximal separation of , corresponding to a ring of 140 au on average (yellow ellipses in Fig. 2a). The aspect ratio is consistent with an inclination of 30∘. In scattered light, the ring is not homogeneous with brighter parts in the west and the northeast, as opposed to the smooth 1.3 mm image, which instead peaks to the southwest. SPHERE resolves some structures in the ring that were already reported in scattered light by Oppenheimer et al. (2008) and Hashimoto et al. (2011). In particular, a depleted region in the polarized flux, formerly reported by Oppenheimer et al. (2008), is also observed at PA=343∘ although the contrast is low and its visibility is mostly a matter of intensity cut. We do not detect any point-source at this location, confirming the findings of Perrin et al. (2009).
Outward of the ring, there are several spiral-like structures which, given the sensitivity achieved with SPHERE DPI, could in fact be the trace of one single grand spiral with several ramifications. This pattern likely starts from the south and rolls clockwise while it gets broader with manifold branches (Fig. 1a). It is particularly pronounced at the east and matches well to all the spirals identified in 2009 H-band data by Hashimoto et al. (2011) at Subaru (orange lines in Fig. 2a), indicating no perceptible motion in ten years, as already concluded by Lomax et al. (2016) on a shorter timescale. Therefore, this pattern is unlikely to be driven by planets inside the ring. Out-of-plane CO spirals (Tang et al. 2012), which have no obvious counterpart in scattered light, are indicated in cyan (Fig. 2a).
Inward of the ring (), we detect two main spirals (S1 and S2 in Fig. 1b), starting as close as the edge of the coronagraphic mask (about 95 mas in radius) and in good agreement with the CO spirals identified by Tang et al. (2017, and shown as green lines labeled S1_CO and S2_CO in Fig. 2b, c). The angular resolution brought by SPHERE evidences that the two inner spirals seem to intersect at the south of the star exactly at the location of an intensity peak (, ), which itself is found at a very similar position than the CO peak. S2 matches well the western CO spiral, while S1 seems to deviate from the eastern CO spiral. We suspect that this mismatch is due to the difference of angular resolution, which for ALMA is about , while SPHERE provides in H band a resolution of . As a consequence, it is difficult to disentangle S1 from S2 at the north in the CO map. S2 is more diffuse than S1 and appears larger in the west. High-pass filtering of the polarimetric image (Fig. 2b) shows higher complexity with clumps and several arms.
While the CO map contains a cavity inward of the CO spirals the SPHERE observations reveal a third component ( in Fig. 1b) connecting the center of the image to S2, as a kind of ”bridge” of au long. This is not a post-processing artifact since this feature is seen both in the polarimetry image and in the total intensity ADI image, and was in fact already distinguishable in Hashimoto et al. (2011), but also in the gas line HCO+ (Rivière-Marichalar et al. 2019). Whether it is a true connection or a projection effect cannot be determined with these observations alone. On each side of the ”bridge,” the polarized intensity is rather low, even lower than in between the spiral arms. Interestingly, in the direction of this feature the intensity of the spiral S2 and of the ring is fainter, possibly tracing a shadow pattern. If so, it will favor a feature near the midplane of the disk. Finally, S1 shows an increase of its width at as a compact clump that is long (Fig. 1b, 2b), Complementary images are displayed in Appendix A.
4 Point-like sources
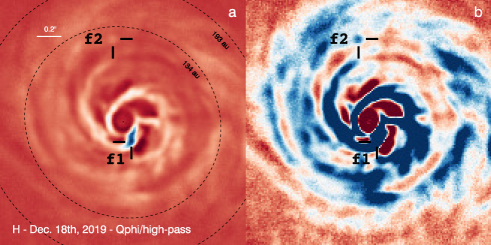
Many structures are observed in the disk but two features have a strong interest. The first one (f1) is the strongest signal in Fig. 1b and c, south of the coronagraphic mask edge, and a second one (f2) is a nearly point source further out to the north. Interestingly, both show up in DPI and ADI images (Fig. 3). They are also detected at the second epoch in total intensity (ADI), but with a much lower signal to noise ratio (Fig. 5).
We extracted the photometry and astrometry with SpeCal. The positions of the sources are based on the ADI reduction using the PCA 5 modes algorithm (Fig. 2b) and the negative fake planet injection method (for details see Galicher et al. 2018), but the values are consistent within error bars for all algorithms. f1 is located at , . It coincides with the root of the eastern spiral identified as S1 in the ALMA image, where the two spirals S1 and S2 observed with SPHERE appear to intersect. The shape of this feature in the image (Fig. 3a) is remarkable and we discuss it further in the next section. The second source, f2, lies at the very edge of the dust ring inside the cavity, in the prolongation of the eastern spiral. Its position is , .
Feature f1 is elongated while f2 is nearly point-like. This characteristic is confirmed by the photometric analysis. The contrast relative to the star derived from IRDIS data in the H band and measured at f1 is quite variable from one ADI reduction to another, ranging from to , depending on the effectiveness (ability to suppress the starlight) of the ADI algorithm.
Similarly, the photometry in the K1K2 IRDIS image obtained at the second epoch varies from one ADI reduction to the other, but with a small difference of contrast between the two narrow band filters: and , respectively. Whether it is indicative of a red color remains to be confirmed with higher quality data in the K band. Overall, we cannot consider the total intensity contrast measurements of f1 reliable as it cannot be assimilated to a point source. On the other hand, f2 has a stable contrast in the H band of , and in K1K2, indicative of a bona-fide point source, but with a grey color. Photometric measurements with the IFS (not shown here) in the YJH bands are not much more conclusive regarding f1, while f2 is actually not detected.
The fact that f1 and f2 are detectable in polarimetry and total intensity strongly suggests that these signals cannot result from the photosphere of some protoplanets. Instead, they are likely to be the telltale of dust particles detected from scattering or from other thermally induced mechanisms.
5 Spirals
The presence of spiral arms in protoplanetary disks has been usually associated to the indirect clues of planets provided that the disks are not massive enough to undergo self-gravity (Muto et al. 2012; Boccaletti et al. 2013; Benisty et al. 2015, for instance). This link with a gravitational perturber has never been definitely established, except for the prominent spiral arms in HD 100453, very likely launched by a stellar M-dwarf companion (Dong et al. 2016). In that respect, the ALMA observations of AB Aur (Tang et al. 2017) are likely the only case, together with GG Tau A (Phuong et al. 2020), to provide a strong suspicion for the presence of a protoplanet associated to spiral arms.
To model the morphology of the inner spirals we rely on the formulation of Muto et al. (2012) described in Appendix B. A direct fit of this analytical relation (Eq. 1) onto the spiral positions was found too unstable given the difficulty to isolate the spine of the spiral arms against the other disk structures. Instead, we proceed with a manual adjustment of the theoretical spiral location taking into account the disk inclination (), the disk Position Angle (), the gas disk vertical scale-height ( au at 100 au) and the flaring index (), following di Folco et al. (2009); Hashimoto et al. (2011); Tang et al. (2012); Li et al. (2016). Because the spirals are pressure bumps and the near IR emission is optically thick, the net effect is a local variation of the disk thickness, hence these spirals materialize at the disk surface and not in the mid-plane (Juhasz et al. 2015). Therefore, we assume that the altitude of the disk layer at which the optical depth () is equal to one is . These values are used to project the analytical relation onto the plane of the sky and are known to some level of accuracy. Therefore, the solutions presented here provide qualitative results, which may not be unique. We note, in particular, a degeneracy between the inclination, the disk scale-height, and the radial distance of the putative planet, whereas the flaring index has only a weak impact on the shape of the projected spiral.
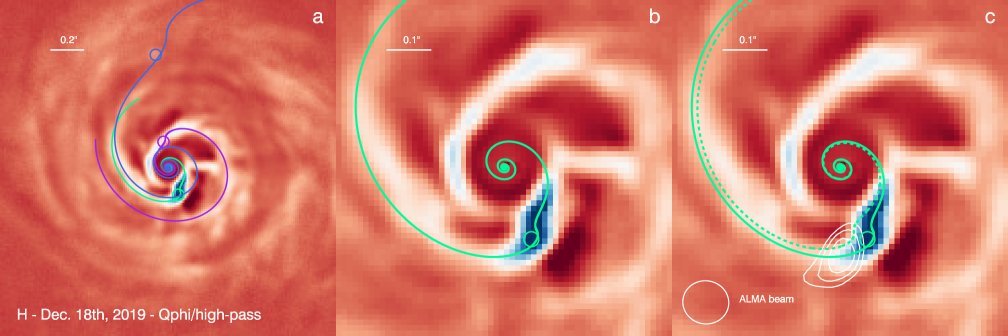
To account for S1 we considered two cases for which we forced a planet to be located close to the positions of the features discussed in section 4. A planet located at , (in the orbital plane of the disk) reproduces the shape of the spiral and is also in accordance with the location of f1 as seen in Fig. 4a, and b (green line). The analytical model of Eq. 1, while simple, matches the ”S” shape expected for a spiral density wave surprisingly well as it goes on to trigger the accretion of gas onto a protoplanet. On the contrary, imposing the planet location at f2 matches only the external part of the spiral S1 (blue line in Fig. 4a). For comparison, the contours of the CO peak in the ALMA image is shown in Fig. 4b. Being localized at the surface, the spiral twists appear slightly offset from the perturber positions (circles), which are in the midplane.
For the western spiral S2, since there is no obvious features nor strong signal which we can consider as a source, we blindly searched for the best matching model. The purple line in Fig. 4a corresponds to , . This model reproduces well the external part of the western spiral, which presents a more diffuse aspect or broader shape than the eastern one, but it fails to match the innermost, eastern arm which is less tightly wound as it approaches the occulting spot ().
6 Discussions
We provide a further exploratory analysis of the two identified objects, noting that they have both been detected in polarimetry and total intensity.
The object labeled f1 is fitting the source of the S1 spiral which at this location features an ”S” shape, suggestive of the stationary pattern composed of inward and outward spiral density waves excited by the gravitational potential of an accreting protoplanet (see Kley & Nelson 2012, for a review). The spirals are trailing, as predicted by theory, since the near side is the southeast part of the disk (Fukagawa et al. 2004) and the resolved velocity field (Piétu et al. 2005) implies that the disk rotates counterclockwise. However, it is not a straightforward exercise to determine whether the signal is from pure scattering (polarized) or a mix of scattering and emission (usually unpolarized). Zhu (2015) has calculated the spectral energy distribution emitted from an accreting circumplanetary disk, which can be compared to our photometric measurements, assuming the signal of f1 is dominated by emission. The luminosity varies as the product of the planet mass with the accretion rate, and also depends on the inner radius of the circumplanetary disk. These three parameters necessarily lead to a high degree of degeneracy. Although it is difficult to overcome the ADI bias in total intensity measured for the particular case of f1, as it is not point-like, we measured a minimum contrast of in the H band. If we assume a moderate accretion rate of /yr as in Zhu (2015), it translates into a planet mass of . We note that the accretion rates estimated for PDS 70b are orders of magnitude lower (Haffert et al. 2019; Hashimoto et al. 2020), which then would imply stellar mass for f1. As a consequence, the flux of f1 is likely not to be dominated by thermal emission.
On the contrary, the object f2 is not directly associated to a spiral, so we assume its flux can be attributed to pure scattering. Mass constraints can be derived from dynamical argument. Indeed, the inner edge of the disk cavity at au can be sculpted by the chaotic zone of a planetary mass object. Assuming a circular orbit for the sake of simplicity, Wisdom (1980) provides a relation between the planet/star mass ratio, and the inner edge/planet distance ratio, from which we derived a mass of . The AB Aur cavity is very large, such that, if resulting from dynamical interplay with planets, several bodies including f1 should be involved.
Finally, the object f1 appears rotated counterclockwise from the CO peak in the ALMA image which, considering the stellar mass, the 4-yr interval, and the physical stellocentric distance of f1, is in excellent agreement with the expected rotation ( in the orbital plane) of the spiral due to the Keplerian motion of the protoplanet candidate (Fig. 4c). However, the peak of the CO emission is at a radial distance slightly larger than expected. There are a few technical reasons accounting for this difference, which remain to be investigated thoroughly. Nevertheless, to our knowledge, this is the first time that we can confidently associate the rotation of a spiral pattern with the orbital motion of a planet candidate, which reinforces our confidence in the nature of the detected spiral twist.
In conclusion, the SPHERE observations of AB Aur in scattered light combined to the ALMA data in the thermal regime provide strong evidence that we are actually witnessing ongoing planet formation revealed by its associated spiral arms. Further observations would be required to confirm this result and to derive better mass estimates for potential planets in this location.
Acknowledgements.
French co-authors acknowledge financial support from the Programme National de Planétologie (PNP) and the Programme National de Physique Stellaire (PNPS) of CNRS-INSU in France. This work has made use of the SPHERE Data Centre, jointly operated by OSUG/IPAG (Grenoble), PYTHEAS/LAM/CESAM (Marseille), OCA/Lagrange (Nice) and Observatoire de Paris/LESIA (Paris). We thank P. Delorme (SPHERE Data Centre) for his efficient help during the data reduction process. YWT acknowledges support through MoST grant 108-2112-M-001-004-MY2. ALM acknowledges the financial support of the F.R.S-FNRS through a postdoctoral researcher grant.References
- Bae & Zhu (2018) Bae, J. & Zhu, Z. 2018, ApJ, 859, 118
- Benisty et al. (2015) Benisty, M., Juhasz, A., Boccaletti, A., et al. 2015, A&A, 578, L6
- Beuzit et al. (2019) Beuzit, J. L., Vigan, A., Mouillet, D., et al. 2019, A&A, 631, A155
- Bhowmik et al. (2019) Bhowmik, T., Boccaletti, A., Thébault, P., et al. 2019, A&A, 630, A85
- Boccaletti et al. (2013) Boccaletti, A., Pantin, E., Lagrange, A. M., et al. 2013, A&A, 560, A20
- Christiaens et al. (2014) Christiaens, V., Casassus, S., Perez, S., van der Plas, G., & Ménard, F. 2014, ApJ, 785, L12
- Clampin et al. (2003) Clampin, M., Krist, J. E., Ardila, D. R., et al. 2003, AJ, 126, 385
- Claudi et al. (2008) Claudi, R., Beuzit, J. L., Feldt, M., et al. 2008, in European Planetary Science Congress 2008, 875
- de Boer et al. (2020) de Boer, J., Langlois, M., van Holstein, R. G., et al. 2020, A&A, 633, A63
- Delorme et al. (2017) Delorme, P., Meunier, N., Albert, D., et al. 2017, in Proceedings of the SF2A, 347–361
- DeWarf et al. (2003) DeWarf, L. E., Sepinsky, J. F., Guinan, E. F., Ribas, I., & Nadalin, I. 2003, ApJ, 590, 357
- di Folco et al. (2009) di Folco, E., Dutrey, A., Chesneau, O., et al. 2009, A&A, 500, 1065
- Dohlen et al. (2008) Dohlen, K., Langlois, M., Saisse, M., et al. 2008, in Proc. SPIE, ed. I. S. McLean & M. M. Casali, 118
- Dong et al. (2016) Dong, R., Zhu, Z., Fung, J., et al. 2016, ApJ, 816, L12
- Dong et al. (2015) Dong, R., Zhu, Z., Rafikov, R. R., & Stone, J. M. 2015, ApJ, 809, L5
- Fukagawa et al. (2004) Fukagawa, M., Hayashi, M., Tamura, M., et al. 2004, ApJ, 605, L53
- Fukagawa et al. (2006) Fukagawa, M., Tamura, M., Itoh, Y., et al. 2006, ApJ, 636, L153
- Gaia Collaboration et al. (2018) Gaia Collaboration, Brown, A. G. A., Vallenari, A., et al. 2018, A&A, 616, A1
- Galicher et al. (2018) Galicher, R., Boccaletti, A., Mesa, D., et al. 2018, A&A, 615, A92
- Grady et al. (2001) Grady, C. A., Polomski, E. F., Henning, T., et al. 2001, AJ, 122, 3396
- Grady et al. (1999) Grady, C. A., Woodgate, B., Bruhweiler, F. C., et al. 1999, ApJ, 523, L151
- Gressel et al. (2013) Gressel, O., Nelson, R. P., Turner, N. J., & Ziegler, U. 2013, ApJ, 779, 59
- Haffert et al. (2019) Haffert, S. Y., Bohn, A. J., de Boer, J., et al. 2019, Nature Astronomy, 3, 749
- Hashimoto et al. (2020) Hashimoto, J., Aoyama, Y., Konishi, M., et al. 2020, arXiv.org [2003.07922v1]
- Hashimoto et al. (2011) Hashimoto, J., Tamura, M., Muto, T., et al. 2011, ApJ, 729, L17
- Isella et al. (2010) Isella, A., Natta, A., Wilner, D., Carpenter, J. M., & Testi, L. 2010, ApJ, 725, 1735
- Juhasz et al. (2015) Juhasz, A., benisty, M., Pohl, A., et al. 2015, MNRAS, 451, 1147
- Kadam et al. (2019) Kadam, K., Vorobyov, E., Regály, Z., Kóspál, Á., & Ábrahám, P. 2019, ApJ, 882, 96
- Kley & Nelson (2012) Kley, W. & Nelson, R. P. 2012, ARA&A, 50, 211
- Li et al. (2016) Li, D., Pantin, E., Telesco, C. M., et al. 2016, ApJ, 832, 18
- Lomax et al. (2016) Lomax, J. R., Wisniewski, J. P., Grady, C. A., et al. 2016, ApJ, 828, 2
- Maire et al. (2016) Maire, A.-L., Langlois, M., Dohlen, K., et al. 2016, in Proc. SPIE, Vol. 9908, 990834
- Milli et al. (2012) Milli, J., Mouillet, D., Lagrange, A. M., et al. 2012, A&A, 545, A111
- Muro-Arena et al. (2020) Muro-Arena, G. A., Ginski, C., Dominik, C., et al. 2020, A&A, 636, L4
- Muto et al. (2012) Muto, T., Grady, C. A., Hashimoto, J., et al. 2012, ApJ, 748, L22
- Oppenheimer et al. (2008) Oppenheimer, B. R., Brenner, D., Hinkley, S., et al. 2008, ApJ, 679, 1574
- Pavlov et al. (2008) Pavlov, A., Möller-Nilsson, O., Feldt, M., et al. 2008, in Proc. SPIE, Vol. 7019, 39
- Perrin et al. (2009) Perrin, M. D., Schneider, G., Duchêne, G., et al. 2009, ApJ, 707, L132
- Phuong et al. (2020) Phuong, N. T., Dutrey, A., di Folco, E., et al. 2020, A&A, 635, L9
- Piétu et al. (2005) Piétu, V., Guilloteau, S., & Dutrey, A. 2005, A&A, 443, 945
- Rafikov (2002) Rafikov, R. R. 2002, ApJ, 569, 997
- Rice et al. (2005) Rice, W. K. M., Lodato, G., & Armitage, P. J. 2005, MNRAS, 364, L56
- Rivière-Marichalar et al. (2019) Rivière-Marichalar, P., Fuente, A., Baruteau, C., et al. 2019, ApJ, 879, L14
- Salyk et al. (2013) Salyk, C., Herczeg, G. J., Brown, J. M., et al. 2013, ApJ, 769, 21
- Schmid et al. (2006) Schmid, H. M., Joos, F., & Tschan, D. 2006, A&A, 452, 657
- Soummer et al. (2012) Soummer, R., Pueyo, L., & Larkin, J. 2012, ApJ, 755, L28
- Tang et al. (2017) Tang, Y.-W., Guilloteau, S., Dutrey, A., et al. 2017, ApJ, 840, 0
- Tang et al. (2012) Tang, Y. W., Guilloteau, S., Piétu, V., et al. 2012, A&A, 547, A84
- van Holstein et al. (2020) van Holstein, R. G., Girard, J. H., de Boer, J., et al. 2020, A&A, 633, A64
- Wisdom (1980) Wisdom, J. 1980, AJ, 85, 1122
- Zhu (2015) Zhu, Z. 2015, ApJ, 799, 16
Appendix A Complementary data
| Date UT | Filter | Fov rotation | DIT | Nexp | Texp | seeing | Flux var. | TN | |
| (∘) | (s) | (s) | (′′) | (ms) | (%) | (∘) | |||
| 2019-12-18 | IRDIS - H | 29.6 | 32 | 160 | 5120 | 2 | |||
| 2020-01-17 | IRDIS - K1K2 | 38.5 | 16 | 256 | 4096 | 2 | |||
| 2020-01-17 | IFS - YJH | 38.5 | 64 | 64 | 4096 | 2 |
Appendix B Expression of a spiral arm
According to the theory of density waves generated by a gravitational perturber (Rafikov 2002) in protoplanetary disks, Muto et al. (2012) proposed an approximate linear relation to describe the shape of a spiral , as a function of the planet location (, ) and disk properties, as follows:
| (1) | |||||
where is the disk aspect ratio at the planet location, and are the power-law exponents of the angular frequency and temperature profile dependence with . In this paper, we assumed for the Keplerian velocity and to account for the temperature profile which varies as .
This formulation is now commonly used to interpret high-contrast images in which spiral patterns are observed, but it involves a number of assumptions, in particular, the idea that small grains observed in scattered light are coupled to the gas and that a single planet induces a single spiral arm. Clearly, this is not always supported by hydro-dynamical simulations, which result in much more complex morphologies. In a more realistic situation, a planet could produce several spiral arms (Dong et al. 2015) or planet formation could inevitably lead to multiple cores and, hence, to manifold spirals (Kadam et al. 2019).