Translating Video Recordings of
Mobile App Usages into Replayable
Scenarios
Abstract.
Screen recordings of mobile applications are easy to obtain and capture a wealth of information pertinent to software developers (e.g., bugs or feature requests), making them a popular mechanism for crowdsourced app feedback. Thus, these videos are becoming a common artifact that developers must manage. In light of unique mobile development constraints, including swift release cycles and rapidly evolving platforms, automated techniques for analyzing all types of rich software artifacts provide benefit to mobile developers. Unfortunately, automatically analyzing screen recordings presents serious challenges, due to their graphical nature, compared to other types of (textual) artifacts. To address these challenges, this paper introduces V2S, a lightweight, automated approach for translating video recordings of Android app usages into replayable scenarios. V2S is based primarily on computer vision techniques and adapts recent solutions for object detection and image classification to detect and classify user actions captured in a video, and convert these into a replayable test scenario. We performed an extensive evaluation of V2S involving 175 videos depicting 3,534 GUI-based actions collected from users exercising features and reproducing bugs from over 80 popular Android apps. Our results illustrate that V2S can accurately replay scenarios from screen recordings, and is capable of reproducing 89% of our collected videos with minimal overhead. A case study with three industrial partners illustrates the potential usefulness of V2S from the viewpoint of developers.
1. Introduction
Mobile application developers rely on a diverse set of software artifacts to help them make informed decisions throughout the development process. These information sources include user reviews, crash reports, bug reports, and emails, among others. An increasingly common component of these software artifacts is graphical information, such as screenshots or screen recordings. This is primarily due to the fact that they are relatively easy to collect and, due to the GUI-driven nature of mobile apps, they contain rich information that can easily demonstrate complex concepts, such as a bug or a feature request. In fact, many crowd-testing and bug reporting frameworks have built-in screen recording features to help developers collect mobile application usage data and faults (wat, 2019; bug, 2019; app, 2019b; tes, 2019b). Screen recordings that depict application usages are used by developers to: (i) help understand how users interact with apps (Schusteritsch et al., 2007; mrt, 2019); (ii) process bug reports and feature requests from end-users (Bettenburg et al., 2008); and (iii) aid in bug comprehension for testing related tasks (Mao et al., 2017). However, despite the growing prevalence of visual mobile development artifacts, developers must still manually inspect and interpret screenshots and videos in order to glean relevant information, which can be time consuming and ambiguous. The manual effort required by this comprehension process complicates a development workflow that is already constrained by language dichotomies (Moran et al., 2018b) and several challenges unique to mobile software, including: (i) pressure for frequent releases (Hu et al., 2014; Jones, 2013), (ii) rapidly evolving platforms and APIs (Linares-Vásquez et al., 2013; Bavota et al., 2015), (iii) constant noisy feedback from users (Ciurumelea et al., 2017; Di Sorbo et al., 2016; Palomba et al., 2017, 2018, 2015), and (iv) fragmentation in the mobile device ecosystem (Han et al., 2012; Wei et al., 2016; and, 2014) among others (Linares-Vásquez et al., 2017). Automation for processing graphical software artifacts is necessary and would help developers shift their focus toward core development tasks.
To improve and automate the analysis of video-related mobile development artifacts, we introduce Video to Scenario (V2S), a lightweight automated approach for translating video screen recordings of Android app usages into replayable scenarios. We designed V2S to operate solely on a video file recorded from an Android device, and as such, it is based primarily on computer vision techniques. V2S adapts recent Deep Learning (DL) models for object detection and image classification to accurately detect and classify different types of user actions performed on the screen. These classified actions are then translated into replayable scenarios that can automatically reproduce user interactions on a target device, making V2S the first purely graphical Android record-and-replay technique.
In addition to helping automatically process the graphical data that is already present in mobile development artifacts, V2S can also be used for improving or enhancing additional development tasks that do not currently take full advantage of screen-recordings, such as: creating and maintaining automated GUI-based test suites; and crowdsourcing functional and usability testing.
We conducted a comprehensive evaluation of V2S using both videos collected from users reproducing bugs as well as general usage videos from the top-rated apps of 32 categories in the Google Play market. As part of this evaluation, we examined the effectiveness of the different components that comprise V2S as well as the accuracy of the generated scenarios. Additionally, we assessed the overhead of our technique and conducted a case study with three industrial partners to understand the practical applicability of V2S. The results of our evaluation indicate that V2S is accurate, and is able to correctly reproduce 89% of events across collected videos. The approach is also robust in that it is applicable to a wide range of popular native and non-native apps currently available on Google Play. In terms of efficiency, we found that V2S imposes acceptable overhead, and is perceived as potentially useful by developers.
In summary, the main contributions of our work are as follows:
-
•
V2S, the first record-and-replay approach for Android that functions purely on screen-recordings of app usages. V2S adapts computer vision solutions for object detection, and image classification, to effectively recognize and classify user actions in the video frames of a screen recording;
-
•
An automated pipeline for dataset generation and model training to identify user interactions from screen recordings;
-
•
The results of an extensive empirical evaluation of V2S that measures the accuracy, robustness, and efficiency across 175 videos from 80 applications;
-
•
The results of a case study with three industrial partners, who develop commercial apps, highlighting V2S’s potential usefulness, as well as areas for improvement and extension;
-
•
An online appendix (Bernal-Cárdenas et al., 2019), which contains examples of videos replayed by V2S, experimental data, source code, trained models, and our evaluation infrastructure to facilitate reproducibility of the approach and the results.
2. Background
We briefly discuss DL techniques for image classification and object detection that we adapt for touch/gesture recognition in V2S.
2.1. Image Classification
Recently, DL techniques that make use of neural networks consisting of specialized layers have shown great promise in classifying diverse sets of images into specified categories. Advanced approaches leveraging Convolutional Neural Networks (CNNs) for highly precise image recognition (Krizhevsky et al., 2012; Simonyan and Zisserman, 2014; Zeiler and Fergus, 2014; Szegedy et al., 2015; He et al., 2016) have reached human levels of accuracy for image classification tasks.
Typically, each layer in a CNN performs some form of computational transformation to the data fed into the model. The initial layer usually receives an input image. This layer is typically followed by a convolutional layer that extracts features from the pixels of the image, by applying filters (a.k.a. kernels) of a predefined size, wherein the contents of the filter are transformed via a pair-wise matrix multiplication (i.e., the convolution operation). Each filter is passed throughout the entire image using a fixed stride as sliding window to extract feature maps. Convolutional layers are used in conjunction with “max pooling” layers to further reduce the dimensionality of the data passing through the network. The convolution operation is linear in nature. Since images are generally non-linear data sources, activation functions such as Rectified Linear Units (ReLUs) are typically used to introduce a degree of non-linearity. Finally, a fully-connected layer (or series of these layers) are used in conjunction with a Softmax classifier to predict an image class. The training process for CNNs is usually done by updating the weights that connect the layers of the network using gradient descent and back-propagating error gradients.
V2S implements a customized CNN for the specific task of classifying the opacity of an image to help segment GUI-interactions represented by a touch indicator (see Section 3.2).
2.2. Object Detection
In the task of image classification, a single, usually more general label (e.g., bird or person) is assigned to an entire image. However, images are typically multi-compositional, containing different objects to be identified. Similar to image classification, DL models for object detection have advanced dramatically in recent years, enabling object tracking and counting, as well as face and pose detection among other applications. One of the most influential neural architectures that has enabled such advancements is the R-CNN introduced by Girshick et al. (Girshick et al., 2014). The R-CNN architecture combines algorithms for image region proposals (RPs), which aim to identify image regions where content of interest is likely to reside, with the classification prowess of a CNN. An R-CNN generates a set of RP bounding-boxes using a selective search algorithm (Uijlings et al., 2013). Then, all identified image regions are fed through a pre-trained AlexNet (Krizhevsky et al., 2012) (i.e., the extractor) to extract image features into vectors. These vectors are fed into a support vector machine (i.e., the classifier) that determines whether or not each image region contains a class of interest. Finally, a greedy non-maximum suppression algorithm (i.e., the regressor) is used to select the highest likelihood, non-overlapping regions, as classified objects.
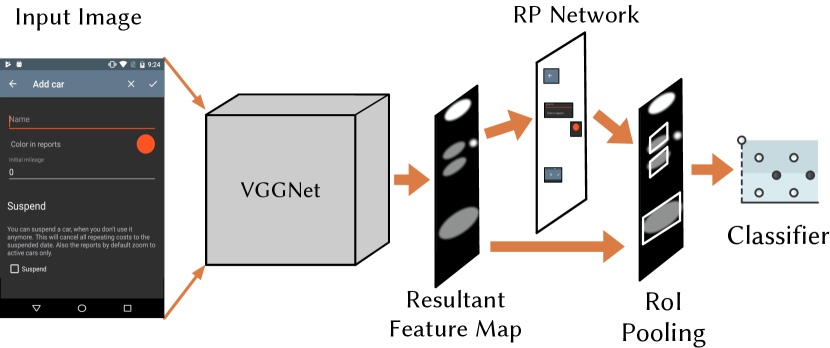
In this paper, we utilize the the Faster R-CNN (Ren et al., 2015) architecture (Fig. 1), which improves upon R-CNN architecture through the introduction of a separate NN to predict image region proposals. By integrating the training of the region proposal network into the end-to-end training of the network, both the speed and accuracy of the model increase. In V2S, we adapt the Faster R-CNN model to detect a touch indicator representing a user action in video frames.
3. The V2S Approach
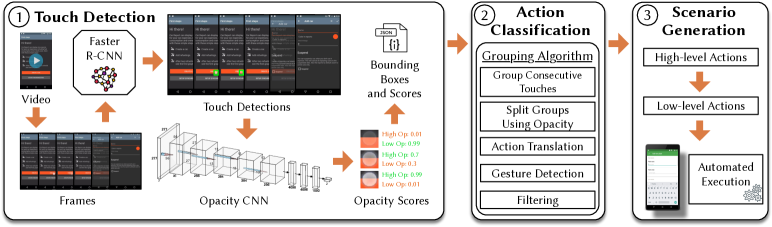
This section outlines the V2S approach for automatically translating Android screen recordings into replayable scenarios. Fig. 2 depicts V2S’s architecture, which is divided into three main phases: (i) the Touch Detection phase, which identifies user touches in each frame of an input video; (ii) the Action Classification phase that groups and classifies the detected touches into discrete user actions (i.e., tap, long-tap, and swipe), and (iii) the Scenario Generation phase that exports and formats these actions into a replayable script. Before discussing each phase in detail, we discuss some preliminary aspects of our approach, input specifications, and requirements.
3.1. Input Video Specifications
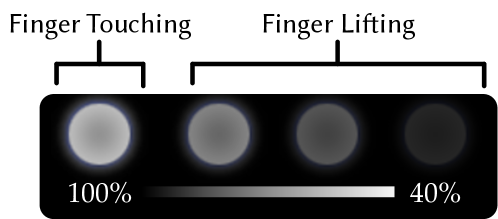
In order for a video to be consumable by V2S, it must meet a few lightweight requirements to ensure proper functioning with our computer vision (CV) models. First, the video frame size must match the full-resolution screen size of the target Android device, in order to be compatible with a specified pre-trained object-detection network. This requirement is met by nearly every modern Android device that has shipped within the last few years. These videos can be recorded either by the built-in Android screenrecord utility, or via third-party applications (g-p, 2019). The second requirement is that input videos must be recorded at least 30 “frames per second” (FPS), which again, is met or exceeded by a majority of modern Android devices. This requirement is due to the fact that the frame-rate directly corresponds to the accuracy with which “quick” gestures (e.g., fast scrolling) can be physically resolved in constituent video frames. Finally, the videos must be recorded with the “Show Touches” option enabled on the device, which is accessed through an advanced settings menu (sho, 2019), and is available by default on nearly all Android devices since at least Android 4.1. This option renders a touch indicator, which is a small semi-transparent circle, that gives a visual feedback when the user presses her finger on the device screen. The opacity of the indicator is fully solid from the moment the user first touches the screen and then fades from more to less opaque when a finger is lifted off the screen (Fig. 3).
3.2. Phase 1: Touch Detection
The goal of this phase is to accurately identify the locations where a user touched the device screen during a video recording. To accomplish this, V2S leverages the DL techniques outlined in Sec. 2 to both accurately find the position of the touch indicator appearing in video frames, and identify its opacity to determine whether a user’s finger is being pressed or lifted from the screen. More specifically, we adapt an implementation of Faster R-CNN (Ren et al., 2015, 2017), which makes use of VGGNet (Simonyan and Zisserman, 2014) for feature extraction of RPs in order to perform touch indicator detection. To differentiate between low and high-opacity detected touch indicators, we build an Opacity CNN, which is a modified version of AlexNet (Krizhevsky et al., 2012). Given that we adapt well-known DL architectures, here we focus on describing our adaptions, and provide model specs in our appendix (Bernal-Cárdenas et al., 2019).
The Touch Detection Phase begins by accepting as input a video that meets the specifications outlined in Sec. 3.1. First, the video is parsed and decomposed into its constituent frames. Then the Faster R-CNN network is utilized to detect the presence of the touch indicator, if any, in every frame. Finally, the Opacity CNN classifies each detected touch indicator as having either low or high-opacity. The output of this phase is a structured JSON with a set of touch indicator bounding boxes in individual video frames wherein each detected touch indicator is classified based on the opacity.
3.2.1. Parsing Videos
Before V2S parses the video to extract single frames, it must first normalize the frame-rate for those videos where it may be variable, to ensure a constant FPS. Certain Android devices may record variable frame-rate video for efficiency (sta, 2019). This may lead to inconsistencies in the time between frames, which V2S utilizes in the classification phase to synthesize the timing of touch actions. Thus, to avoid this issue, we normalize the frame rate to 30fps and extract individual frames using the FFmpeg (ffm, 2019) tool.
3.2.2. Faster R-CNN
After the individual frames have been parsed from the input video, V2S applies its object detection network to localize the bounding boxes of touch indicators. However, before using the object detection, it must be trained. As described in Sec. 2 the DL models that we utilize typically require large, manually labeled datasets to be effective. However, to avoid the manual curation of data, and make the V2S approach practical, we designed a fully automated dataset generation and training process. To bootstrap the generation of V2S’s object detection training dataset, we make use of the existing large-scale ReDraw dataset of Android screenshots (Moran et al., 2018a). This dataset includes over 14k screens extracted from the most popular Android applications on Google Play using a fully-automated execution technique.
Next, we randomly sample 5k unique screenshots of different apps and programmatically superimpose an image of the touch indicator at a random location in each screenshot. During this process, we took two steps to ensure that our synthesized dataset reflects actual usage of the touch indicator: (i) we varied the opacity of the indicator icon between 40%-100% to ensure our model is trained to detect instances where a finger is lifted off the screen; (ii) we placed indicator icons on the edges of the screen to capture instances where the indicator may be occluded. This process is repeated three times per screenshot to generate 15k unique images. We then split this dataset 70%/30% to create training and testing sets respectively. We performed this partitioning such that all screenshots expect one appear only in the testing set, wherein the one screenshot that overlapped had a different location and opacity value for the touch indicator. During testing, we found that a training set of 15k screens was large enough to train the model to extremely high levels of accuracy (i.e., ¿ 97%). To train the model we use the TensorFlow Object Detection API (TFO, 2019) that provides functions and configurations of well-known DL architectures. We provide details regarding our training process for V2S’s object detection network in Sec. 4.1. Note that, despite the training procedure being completely automated, it needs to be run only once for a given device screen size, after which it can be re-used for inference. After the model is trained, inference is run on each frame, resulting in a set of output bounding box predictions for each screen, with a confidence score.
3.2.3. Opacity CNN
Once V2S has localized the screen touches that exist in each video frame, it must then determine the opacity of each detected touch indicator to aid in the Action Classification phase. This will help V2S in identifying instances where there are multiple actions in consecutive frames with very similar locations (e.g., double tapping). To differentiate between low and high-opacity touch indicators, V2S adopts a modified version of the AlexNet (Krizhevsky et al., 2012) architecture as an Opacity CNN that predicts whether a cropped image of the touch indicator is fully opaque (i.e., finger touching screen) or low opacity (i.e., indicating a finger being lifted off the screen). Similar to the object detection network, we fully automate the generation of the training dataset and training process for practicality. We again make use of the ReDraw dataset and randomly select 10k unique screenshots, randomly crop a region of the screenshot to the size of a touch indicator, and an equal number of full and partial opacity examples are generated. For the low-opacity examples, we varied the transparency levels between 20%-80% to increase the diversity of samples in the training set. During initial experiments, we found that our Opacity CNN required fewer training samples than the object detection network to achieve a high accuracy (i.e., ¿ 97%). Similar to the Faster R-CNN model, this is a one-time training process, however, this model can be re-used across varying screen dimensions. Finally, V2S runs the classification for all the detected touch indicators found in the previous step. Then V2S generates a JSON file containing all the detected bounding boxes, confidence levels, and opacity classifications.
3.3. Phase 2: Action Classification
The JSON file generated by the Touch Detection phase contains detailed data about the bounding boxes, opacity information, and the frame of each detected touch indicator (note we use the term “touch indicator” and “touch” interchangeably moving forward). This JSON file is used as input into the Action Classification phase where single touches are grouped and classified as high-level actions. The classification of these actions involves two main parts: (i) a grouping algorithm that associates touches across subsequent frames as a discrete action; and (ii) action translation, which identifies the grouped touches as a single action type. The output of this step is a series of touch groups, each corresponding to an action type: (i) Tap, (ii) Long Tap, or (iii) Gesture (e.g., swipes, pinches, etc).
3.3.1. Action Grouping
The first step of V2S’s action grouping filters out detected touches where the model’s confidence is lower than 0.7. The second step groups touches belonging to the same atomic action according to a tailored heuristic and a graph connection algorithm. This procedure is necessary because discrete actions performed on the screen will persist across several frames, and thus, need to be grouped and segmented accordingly.
Grouping Consecutive Touches. The first heuristic groups touch indicators present in consecutive frames into the same group. As a measure taken to avoid (the rare occurrence of) a falsely detected touch indicator, touches that exist across two or fewer frames are discarded. This is due to the fact that, we observed in practice, even the quickest of touchscreen taps last across at least five frames.
Discrete Action Segmentation. There may exist successive touches that were carried out extremely fast, such that there is no empty frame between two touches. In other cases, the touch indicator of one action may not fully disappear before the user starts a new action, leading to two or more touch indicators appearing in the same frame. These two situations are common when a user is swiping a list and quickly tapping an option, or typing quickly on the keyboard, respectively. However, it can be hard to determine where one action ends and another begins.
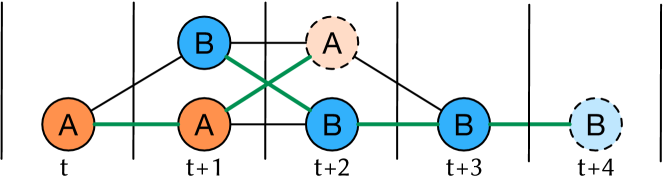
V2S analyzes groups of consecutive or overlapping touches and segments them into discrete actions using a heuristic-based approach. We model the grouping of touch indicators as a graph connectivity problem (see Fig. 4). In this formulation, touch indicators are represented as nodes, vertical lines separate consecutive frames, and edges are possible connections between consecutive touches that make up a discrete action. The goal is to derive the proper edges for traversing the graph such all touches for action are in one group and all touches for action are in another group (illustrated in green in Fig. 4). Our algorithm decomposes the lists of consecutive touches grouped together into a graph. Starting from the first node, our algorithm visits each subsequent node and attempts to link it to the previous node. If there is only one node in a subsequent frame, then two successive nodes are linked. If there is more than one node in a subsequent frame, our algorithm looks at the spatial distance between the previous node and both subsequent nodes, and groups previous nodes to their closer neighbors (as shown between frame and ). However, if multiple nodes in one frame are at similar distance from the previous node (as between frames and in Fig. 4), then the opacity of the nodes is used to perform the connection. For example, it is clear that node in frame is a finger being lifted off the screen. Thus, it must be connected to the previously occurring action (i.e., in ), and not the action that just started.
Finally, after this process, the opacity of all linked nodes are analyzed to determine further splits. There exist multiple actions with no empty frame between them. Therefore, if a low-opacity node is detected in a sequence of successively connected nodes, they are split into distinct groups representing different actions.
3.3.2. Action Translation
This process analyzes the derived groups of touches and classifies them based on the number and touch locations in each group. For touches that start and end in the same spatial location on the screen (e.g., the center of subsequent touch indicator bounding boxes varies by less than 20 pixels) the action is classified as a Tap or a Long Tap. Taps are recognized if the action lasts across 20 or fewer frames, and Long-Taps otherwise. Everything else is classified as a Gesture.
Filtering. V2S removes actions that have touch indicators with low average opacity (e.g., ¡ 0.1%) across a group, as this could represent a rare series of misclassified touch indicators from the Faster R-CNN. V2S also removes groups whose size is below or equals a threshold of two frames, as these might also indicate rare misclassifications. The result of the Action Classification phase is a structured list of actions (i.e., Tap, Long Tap, or Gesture), where each action is a series of touches associated to video frames and screen locations.
3.4. Phase 3: Scenario Generation
After all the actions have been derived by the Action Classification phase, V2S proceeds by generating commands using the Android Debug Bridge (adb) that replay the classified actions on a device. To accomplish this, V2S converts the classified, high-level actions into low-level instructions in the sendevent command format, which is a utility included in Android’s Linux kernel. Then, V2S uses a modified RERAN (Gomez et al., 2013) binary to replay the events on a device.
Generating the Scenario Script. The sendevent command uses a very limited instruction set in order to control the UI of an Android device. The main instructions of interest are the start_event, end_event, and coordinates where the user’s finger touched the screen, and certain special instructions required by devices with older API levels. To create the script, each action is exported starting with the start_event command. Then, for actions classified as a Tap, V2S provides a single coordinate pair, derived from the center of the detected bounding box of the Tap. For Gestures, V2S iterates over each touch that makes up the Gesture action and appends the pairs of each touch indicator to the list of instructions. For Long Taps, V2S performs similar processing to that of Gestures, but instead uses only a single pair from the initial detected touch indicator bounding box.
Then, V2S ends the set of instructions for an action with the appropriate end_event command. For Gestures and Long Taps the speed and duration of each instruction is extremely important in order to accurately replay the user’s actions. To derive the speed and duration of these actions, V2S adds timestamps to each touch location based on the timing between video frames (i.e., for 30fps, there is a 33 millisecond delay between each frame), which will temporally separate each touch command sent to the device. The same concept applies for Long Tap, however, since this action type uses a single touch location, the timing affects the duration that the touch event lasts on the screen.
Finally, in order to determine the delays between successive actions, the timing between video frames is again used. Our required 30fps frame-rate provides V2S with millisecond-level resolution of event timings, whereas higher frame-rates will only increase the fidelity of replay timing.
Scenario Replay. Once all the actions have been converted into low-level sendevent instructions, they are written to a log file. This log file is then fed into a translator which converts the file into a runnable format that can be directly replayed on a device. This converted file along with a modified version of the RERAN engine (Gomez et al., 2013) is pushed to the target device. We optimized the original RERAN binary to replay event traces more efficiently. Finally, the binary is executed using the converted file to faithfully replay the user actions originally recorded in the initial input video. We provide examples of V2S’s generated sendevent scripts, alongside our updated version of the RERAN binary in our online appendix (Bernal-Cárdenas et al., 2019).
4. Design of the Experiments
In this section, we describe the procedure we used to evaluate V2S. The goal of our empirical study is to assess the accuracy, robustness, performance, and industrial utility of the approach. The context of this evaluation consists of: (i) sets of 15,000 and 10,000 images, corresponding to the evaluation of V2S’s Faster R-CNN and Opacity CNN respectively; (ii) a set of 83 Android applications including 68 of the top-rated apps from Google Play, five open source apps with real crashes, five open source apps with known bugs, and five open source apps with controlled crashes; (iii) two popular target Android devices (the Nexus 5 and Nexus 6P)111 It should be noted that V2S can be used with emulators via minor modifications to the script generation process. The main quality focus of our study is the extent to which V2S can generate replayable scenarios that mimic original user GUI inputs. To achieve our study goals, we formulated the following five research questions:
-
•
RQ1: How accurate is V2S in identifying the location of the touch indicator?
-
•
RQ2: How accurate is V2S in identifying the opacity of the touch indicator?
-
•
RQ3: How effective is V2S in generating a sequence of events that accurately mimics the user behavior from video recordings of different applications?
-
•
RQ4: What is V2S’s overhead in terms of scenario generation?
-
•
RQ5: Do practitioners perceive V2S as useful?
4.1. RQ1: Accuracy of Faster R-CNN
To answer RQ1, we first evaluated the ability of V2S’s Faster R-CNN to accurately identify and localize the touch indicators present in screen recording frames with bounding boxes. To accomplish this, we followed the procedure to generate training data outlined in Sec. 3.2 complete with the 70%–30% split for the training and testing sets, respectively. The implementation of the Faster R-CNN object detection used by V2S is coupled to the size of the images used for training and inference. Thus, to ensure V2S’s model functions across different devices, we trained two separate Faster R-CNN models (i.e., one for the Nexus 5 and one for the Nexus 6P), by resizing the images from the ReDraw dataset to the target device image size. As we show in the course of answering other RQs, we found that resizing the images in the already large ReDraw dataset, as opposed to re-collecting natively sized images for each device, resulted in highly accurate detections in practice.
We used the TensorFlow Object Detection API (TFO, 2019) to train our model. Moreover, for the training process, we modified several of the hyper-parameters after conducting an initial set of experiments. These changes affected the number of classes (i.e., 1), maximum number of detections per class or image (i.e., 10), and the learning rate after 50k (i.e., ) and 100k (i.e., ) iterations. The training process was run for 150k steps with a batch size of 1, and our implementation of Faster R-CNN utilized a VGGNet (Simonyan and Zisserman, 2014) instance pre-trained on the MSCOCO dataset (Lin et al., 2014b). We provide our full set of model parameters in our online appendix (Bernal-Cárdenas et al., 2019).
To validate the accuracy of V2S’s Faster R-CNN models we utilize Mean Average Precision (mAP) which is commonly used to evaluate techniques for the object detection task. This metric is typically computed by averaging the precision over all the categories in the data, however, given we have a single class (the touch indicator icon), we report results only for this class. Thus, our mAP is computed as where corresponds to an identified image region with a correct corresponding label, and corresponds to the identified image regions with the incorrect label (which in our case would be an image region that is falsely identified as a touch indicator). Additionally, we evaluate the Average Recall of our model in order to determine if our model misses detecting any instances of the touch indicator. This is computed by where is the same definition stated above, and the corresponds to the total number of possible predictions.
During preliminary experiments with Faster R-CNN using the default touch indicator (see Fig. 5(a)), we found that, due to the default touch indicator’s likeness to other icons and images present in apps, it was prone to very occasional false positive detections (Fig. 5(b)). Thus, we analyzed particular cases in which the default touch indicator failed and replaced it with a more distinct, high-contrast touch indicator. We found that this custom touch indicator marginally improved the accuracy of our models. It should be noted that replacing the touch indicator on a device, requires the device to be rooted. While this is an acceptable option for most developers, it may prove difficult for end-users. However, even with the default touch indicator, V2S’s Faster R-CNN model still achieves extremely high levels of accuracy.


4.2. RQ2: Accuracy of Opacity CNN
To answer RQ2, we evaluated the ability of V2S’s Opacity CNN to predict whether the opacity of the touch indicator is solid or semi-transparent. To accomplish this, we followed dataset generation procedure outlined in Sec. 3.2, where equal number of full and partial opacity examples are generated. Thus, the generated dataset contains equal numbers of full and partial opacity examples for a total of 10k, which are evenly split into 70%–30% training and testing sets. We used the TensorFlow framework in combination with Keras to implement the Opacity CNN. In contrast to the Faster R-CNN model used previously, we do not need to create a separate model for each device. This is due to the touch indicator being resized when fed into the Opacity CNN. Similarly to the Faster R-CNN, we evaluate Opacity CNN using mAP across our two classes.
4.3. RQ3: Accuracy on Different Scenarios
To answer RQ3, we carried out two studies designed to assess both the depth, and breadth of V2S’s abilities to reproduce user events depicted in screen recordings. The first, Controlled Study, measures the depth of V2S’s abilities through a user study during which we collected real videos from end users depicting: bugs, real crashes, synthetically injected crashes, and normal usage scenarios for 20 apps. Next in the Popular Applications Study we measured the breadth of V2S’s abilities by recording scenarios for a larger, more diverse set of 64 most popular apps from the Google Play. We provide the full details of these apps in our online appendix (Bernal-Cárdenas et al., 2019).
4.3.1. Controlled Study
In this study we, considered four types of recorded usage scenarios depicting: (i) normal usages, (ii) bugs, (iii) real crashes, and (iv) controlled crashes. Normal usage scenarios refer to video recordings exercising different features on popular apps. Bug scenarios refer to video recordings that exhibit a bug on open source apps. Finally, controlled crashes refer to injected crashes into open source apps. This allows us to control the number of steps before the crash is triggered.
For this study, eight participants including 1 undergraduate, 3 masters, and 4 doctoral students were recruited from William & Mary (approved by the Protection of Human Subjects Committee (PHSC) at W&M under protocol PHSC-2019-01-22-13374) to record the videos, with each participant recording eight separate videos, two from each of the categories listed above. Four participants recorded videos on the Nexus 5 and four used the Nexus 6P. This accounts for a total of 64 videos, from 20 apps evenly distributed across all scenarios. Before recording each app, participants were either asked to use the app to become familiar with it, or read a bug/crash report before reproducing the fault. All of the real bugs and crashes were taken from established past studies on mobile testing and bug reporting (Moran et al., 2016, 2015; Chaparro et al., 2019).
4.3.2. Popular Applications Study
For the next study, we considered a larger more diverse set of apps from Google Play. More specifically we downloaded the two highest-rated apps from each non-game category (i.e., 32) for a total of 64 applications.
Two of the authors then recorded two scenarios per app accounting for 32 apps each, one using the Nexus 5 and the other using a Nexus 6P. The authors strived to use the apps as naturally as possible, and this evaluation procedure is in line with past evaluations of Android record-and-replay techniques (Qin et al., 2016; Gomez et al., 2013). The recorded scenarios represented specific use cases of the apps that exercise at least one of the major features, and were independent of one another. During our experiments, we noticed certain instances where our recorded scenarios were not replicable, either due to non-determinism or dynamic content (e.g., random popup appearing). Thus, we discarded these instances and were left with 111 app usage scenarios from 60 apps. It is worth noting that it would be nearly impossible for existing techniques such as RERAN (Gomez et al., 2013) or Barista (Fazzini et al., 2017) to reproduce the scenarios due to the nondeterminism of the dynamic content, hence our decision to exclude them.
To measure how accurately V2S replays videos, we use three different metrics. To compute these metrics, we manually derived the ground truth sequence of action types for each recorded video. First, we use Levenshtein distance, which is commonly used to compute distances between words at character level, to compare the original list of action types to the list of classified actions generated by V2S. Thus, we consider each type of action being represented as a character, and scenarios as sequences of characters which represent series of actions. A low Levenshtein distance value indicates fewer required changes to transform V2S’s output to the ground truth set of actions. Additionally, we compute the longest common subsequence (LCS) to find the largest sequence of each scenario from V2S’s output that aligns with the ground truth scenario from the video recording. For this LCS measure, the higher the percentage, the closer V2S’s trace is to a perfect match of the original trace. Moreover, we also computed the precision and recall for V2S to predict each type of action across all scenarios when compared to the ground truth. Finally, in order to validate the fidelity of the replayed scenarios generated by V2S compared to the original video recording, we manually compared each original video to each reproduced scenario from V2S, and determined the number of actions for each video that were faithfully replayed.
4.4. RQ4: Performance
To investigate RQ4, we evaluated V2S by calculating the average time it takes for a video to pass through each of the three phases of the V2S approach on commodity hardware (i.e., a single NVIDIA GTX 1080Ti). We see this as a worst case scenario for V2S performance, as our approach could perform substantially faster on specialized hardware. Note that since our replay engine is an enhancement of the RERAN engine, we expect our scripts to have similar or better overhead as reported in its respective paper (Gomez et al., 2013).
4.5. RQ5: Perceived Usefulness
Ultimately, our goal is to integrate V2S into real-world development environments. Thus, as part of our evaluation, we investigated V2S’s perceived usefulness with three developers who build Android apps (or web apps for mobile) for their respective companies.
The developers (a.k.a. participants) were contacted through direct contact of the authors. Participant #1 (P1) was a front-end developer on the image search team of the Google Search app (g-i, 2019), participant #2 (P2) is a developer of the 7-Eleven Android app (7-e, 2019), and participant #3 (P3) is a backend developer for the Proximus shopping basket app (pro, 2019). We interviewed the participants using a set of questions organized in two sections. The first section aimed to collect information on participants’ background, including their role at the company, the information used to complete their tasks, the quality of this information, the challenges of collecting it, and how they use videos in their every-day activities. The second section aimed to assess V2S’s potential usefulness as well as its accuracy in generating replayable scenarios. This section also asked the participants for feedback to improve V2S including likert scale questions. We provide the complete list of interview questions used in our online appendix (Bernal-Cárdenas et al., 2019), and discuss selected questions in Sec. 5.5.
The participants answered questions from the second section by comparing two videos showing the same usage scenario for their respective app: one video displaying the scenario manually executed on the app, and the other one displaying the scenario executed automatically via V2S’s generated script. Specifically, we defined, recorded, and manually executed a usage scenario on each app. Then, we ran V2S on the resulting video recordings. To define the scenarios, we identified a feature on each app involving any of the action types (i.e., taps, long taps, and gestures). Then, we generated a video showing the original scenario (i.e., video recording) and next to it the replayed scenario generated when executing V2S’s script. Both recordings highlight the actions performed on the app. We presented the video to participants as well as V2S’s script with the high-level actions automatically identified from the original video.
5. Empirical Results
5.1. RQ1: Accuracy of Faster R-CNN
| Model | Device | mAP | mAP@.75 | AR |
|---|---|---|---|---|
| Faster R-CNN-Original | Nexus 5 | 97.36% | 99.01% | 98.57% |
| Faster R-CNN-Original | Nexus 6P | 96.94% | 99.01% | 98.19% |
| Faster R-CNN-Modified | Nexus 5 | 97.98% | 99.01% | 99.33% |
| Faster R-CNN-Modified | Nexus 6P | 97.49% | 99.01% | 99.07% |
Table 1 depicts the precision and recall for V2S’s Faster R-CNN network for touch indicator detection on different devices and datasets. The first column identifies the usage of either the default touch indicator or the modified version. The second column describes the target device for each trained model. The third column provides the mAP regardless of the Intersection Over Union (IoU) (Ren et al., 2015) between the area of the prediction and the ground truth. The forth column presents the AP giving the proportion of out of the possible positives. All models achieve 97% mAP, indicating that V2S’s object detection network is highly accurate. The mAP only improves when we consider bounding box IoUs that match the ground truth bounding boxes by at least 75%, which illustrates that when the model is able to predict a reasonably accurate bounding box, it nearly always properly detects the touch indicator (99%). As illustrated by the last column in Table 1, the model also achieves extremely high recall, detecting at least 98% of the inserted touch indicators.
| Total | L-Op.-Orig. | H-Op.-Orig. | L-Op.-Cust. | H-Op.-Cust. | |
|---|---|---|---|---|---|
| Low Op | 5000 | 97.8% | 2.2% | 99.7% | 0.3% |
| High Op | 5000 | 1.4% | 98.6% | 0.8% | 99.2% |
5.2. RQ2: Accuracy of the Opacity CNN
To illustrate the Opacity Network’s accuracy in classifying the two opacity levels of touch indicators, we present the confusion matrix in Table 2. The results are presented for both the default and modified touch indicator. The overall top-1 precision for the original touch indicator is 98.2% whereas for the custom touch indicator is 99.4%. These percentages are computed by aggregating the correct identifications for both classes (i.e., Low/High-Opacity) together for the original and custom touch indicators. Hence, it is clear V2S’s Opacity CNN is highly effective at distinguishing between differing opacity levels.
| AppName | Rep. Actions | AppName | Rep. Actions | App Name | Rep. Actions | App Name | Rep. Actions | App Name | Rep. Actions | |||||
| Ibis Paint X | 11/11 | 36/36 | Firefox | 22/22 | N/A | Tasty | 20/20 | 14/36 | SoundCloud | 12/12 | 13/13 | LetGo | 17/17 | 15/15 |
| Pixel Art Pro | 20/20 | 9/9 | MarcoPolo | 12/12 | 30/30 | Postmates | 26/26 | 12/12 | Shazam | 12/15 | 20/20 | TikTok | 14/14 | 11/11 |
| Car-Part.com | 20/20 | 16/16 | Dig | 13/13 | N/A | Calm | 9/9 | 11/16 | 14/14 | 19/19 | 18/18 | 13/13 | ||
| CDL Practice | 8/8 | 13/13 | Clover | 15/15 | 19/19 | Lose It! | 36/36 | N/A | News Break | 1/18 | 9/9 | CBSSports | 25/25 | 16/16 |
| Sephora | 4/9 | 13/13 | PlantSnap | 39/39 | 18/24 | U Remote | 14/14 | 18/18 | FamAlbum | 19/19 | 8/26 | MLBatBat | 11/13 | N/A |
| SceneLook | 14/14 | 16/16 | Translator | 20/20 | 28/28 | LEGO | 52/52 | 24/24 | Baby-Track | 14/14 | 12/12 | G-Translate | 14/17 | 15/15 |
| KJ Bible | 16/16 | 19/19 | Tubi | 2/19 | 30/30 | Dev Libs | 35/35 | 22/22 | Walli | 8/8 | N/A | G-Podcast | 9/9 | 15/15 |
| Bible App | 12/12 | 15/15 | Scan Radio | 24/27 | N/A | Horoscope | 24/24 | 19/19 | ZEDGE | 9/9 | 18/18 | Airbnb | 9/9 | 14/14 |
| Indeed Jobs | 15/15 | 19/19 | Tktmaster | 30/30 | 14/14 | Waze | 17/17 | 19/19 | G-Photo | 18/18 | 18/18 | G-Earth | 8/13 | 1/30 |
| UPS Mobile | 16/16 | 19/24 | Greet Cards | 23/23 | N/A | Transit | 26/26 | 18/18 | PicsArt | 18/18 | 39/39 | DU Record | 15/15 | 9/9 |
| Webtoon | 17/17 | 15/21 | QuickBooks | 47/47 | 28/28 | WebMD | 7/34 | 7/26 | G-Docs | 3/26 | N/A | AccuWeath | 13/13 | 21/21 |
| MangaToon | 16/16 | 28/28 | Yahoo Fin | 23/23 | N/A | K-Health | 10/10 | 15/24 | M. Outlook | 27/27 | 21/26 | W. Radar | 14/14 | 13/13 |
5.3. RQ3: Scenario Replay Accuracy
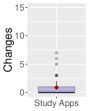
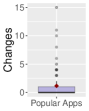
Levenshtein Distance. Fig. 6(a) and 6(b) depict the number of changes required to transform the output event trace into the ground truth for the apps used in the controlled study and the popular apps study, respectively. For the controlled study apps, on average it requires changes per user trace to transform V2S’s output into ground truth event trace, whereas for the popular apps it requires slightly more with changes. Overall, V2S requires minimal changes per event trace, being very similar to the ground truth.
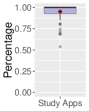
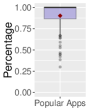
Longest Common Subsequence. Fig. 6(c) and 6(d) presents the percentage of events for each trace that match those in the original recording trace for the controlled study and popular apps study respectively. On average V2S is able to correctly match 95.1% of sequential events on the ground truth for the controlled study apps and 90.2% for popular apps. These results suggest that V2S is able to generate sequences of actions that closely match the original trace in terms of action types.
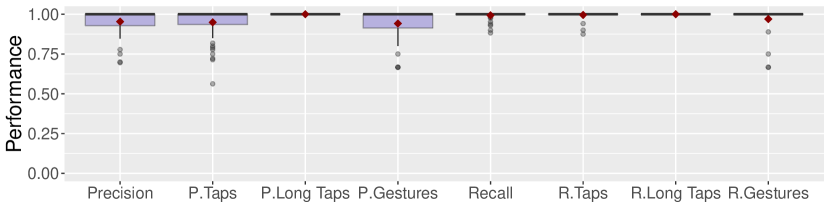
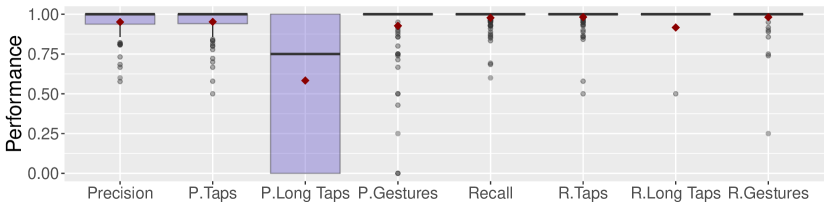
Precision and Recall. Fig. 7 and 8 show the precision and recall results for the controlled study and popular apps study, respectively. These plots were constructed by creating an order agnostic “bag of actions” for each predicted action type, for each scenario in our datasets. Then the precision and recall are calculated by comparing the actions to a ground truth “bag of actions” to compute precision and recall metrics. Finally, an overall average precision and recall are calculated across all action types. The results indicate that on average, the precision of the event traces is 95.3% for the controlled study apps and 95% for popular apps. This is also supported for each type of event showing also a high level of precision across types except for the precision on Long Taps for the popular apps. This is mainly due to the small number (i.e., 9 Long Taps) of this event type across all the popular app traces. Also, Fig. 7 and 8 illustrate that the recall across action types is high with an average of 99.3% on controlled study apps and 97.8% on the popular apps for all types of events. In general, we conclude that V2S can accurately predict the correct number of event types across traces.
Success Rate. Finally, we also evaluated success rate of each replayed action for all scenarios across both RQ3 studies. The 175 videos were analyzed manually and each action was marked as successful if the replayable scenario faithfully exercised the app features according to the original video. This means that in certain cases videos will not exactly match the original video recording (e.g., due to a single keyboard keystroke error that still led to the same feature result). Thus, after validating all 64 videos for the controlled study, V2S fully reproduces 93.75% of the scenarios, and 94.48% of the consecutive actions. V2S fully reproduced 96.67% of the scenarios for bugs and crashes and 91.18% of apps usages. Detailed results for the popular apps study are shown in Table 3, where each app, scenario (with total number of actions), and successfully replayed actions are displayed. Green cells indicate a fully reproduced video, Orange cells indicate more than 50% of events reproduced, and Red cells indicate less than 50% of reproduced events. Blue cells show non-reproduced videos due to non-determinism/dynamic content. For the 111 scenarios recorded for the popular apps, V2S fully reproduced 81.98% scenarios, and 89% of the consecutive actions. Overall, this signals strong replay-ability performance across a highly diverse set of applications. Instances where V2S failed to reproduce scenarios are largely due to minor inaccuracies in Gesture events due to our video resolution of 30fps. We discuss potential solutions to this limitation in Sec. 6.
5.4. RQ4: Approach Performance
To measure the performance of V2S, we measured the average time in seconds/frame (s/f) for a single video frame to be processed across all recorded videos for three components: (i) the frame extraction process (0.045 s/f), (ii) the touch indicator detection process (1.09 s/f), and (iii) the opacity classification process (0.032 s/f). The script generation time is negligible compared to these other processing times, and is only performed once per video. This means that an average video around 3 mins in length would take V2S 105 minutes to fully process and generate the script. However, this process is fully automated, can run in the background, and can be accelerated by more advanced hardware. We expect the overhead of our replayed scripts to be similar or better than RERAN since V2S replay engine is essentially an improved version of RERAN’s.
5.5. RQ5: Perceived Usefulness
The three industry participants agreed that further tool support is needed for helping QA members and other stakeholders with generating video recordings. For example, P3 mentions that while videos are ”more useful than images” (in some cases), they “may be difficult to record” because of “time constraints”. All participants also (strongly) agreed that the scenarios produced by V2S (in the generated scripts) are accurate with respect to the scenarios that were manually executed.
Regarding V2S’s usefulness, P1 remarked that the QA team could use V2S to help them create videos more optimally. P2 supported this claim as he mentions that V2S could help “the QA team write/provide commands or steps, then the tool would read and execute these while recording a video of the scenario and problem. This solution could be integrated in the continuous integration pipeline”. In addition, P3 mentions that V2S could be used during app demos: V2S could “automatically execute a script that shows the app functionality and record a video. In this way, the demo would focus on business explanation rather than on manually providing input to the app or execute a user scenario”.
P2 also indicated that V2S could be used to analyze user behavior within the app, which can help improve certain app screens and navigation. He mentions that V2S “could collect the type of interactions, # of taps, etc. to detect, for example, if certain screens are frequently used or if users often go back after they go to a particular screen”. He mentions that this data “could be useful for marketing purposes”. P3 finds V2S potentially useful for helping reproduce hard-to-replicate bugs.
The participants provided valuable and specific feedback for improving V2S. They suggested to enrich the videos produced when executing V2S’s script with a bounding box of the GUI components or screen areas being interacted with at each step. They also mention that the video could show (popup) comments that explain what is going on in the app (e.g., a comment such as “after 10 seconds, button X throws an error”), which can help replicate bugs. They would like to see additional information in the script, such as GUI metadata that provides more in-depth and easy-to-read information about each step. For example, the script could use the names or IDs of the GUI components being interacted with and produce steps such as “the user tapped on the send button” instead of “the user tapped at (10.111,34.56)”. P3 mentioned that “it would be nice to change the script programmatically by using the GUI components’ metadata instead of coordinates, so the script is easier to maintain”. They suggest to include an interpreter of commands/steps, written in a simple and easy-to-write language, which would be translated into low-level commands.
6. Limitations & Threats to Validity
Limitations. Our approach has various limitations that serve as motivation for future work. One current limitation of the Faster R-CNN implementation our approach utilizes is that it is tied to the screen size of a single device, and thus a separate model must be trained for each screen size to which V2S is applied. However, as described in Sec. 3.2, the training data process is fully automated and models can be trained once and used for any device with a given screen size. This limitation could be mitigated by increasing dataset size including all type of screen sizes with a trade-off on the training time. To facilitate the use of our model by the research community, we have released our trained models for the two popular screen sizes of the Nexus 5 and Nexus 6P in our online appendix (Bernal-Cárdenas et al., 2019).
Another limitation, which we will address in future work, is that our replayable traces are currently tied to the dimensions of a particular screen, and are not easily human readable. However, combining V2S with existing techniques for device-agnostic test case translation (Fazzini et al., 2017), and GUI analysis techniques for generating natural language reports (Moran et al., 2016) could mitigate these limitations.
Finally, as discussed in Sec. 5.3, one limitation that affects the ability of V2S to faithfully replay swipes is the video frame-rate. During the evaluation, our devices were limited to 30fps, which made it difficult to completely resolve a small subset of gesture actions that were performed very quickly. However, this limitation could be addressed by improved Android hardware or software capable of recording video at or above 60fps, which, in our experience, should be enough to resolve nearly all rapid user gestures.
Internal Validity. In our experiments evaluating V2S, threats to internal validity may arise from our manual validation of the correctness of replayed videos. To mitigate any potential subjectivity or errors, we had at least two authors manually verify the correctness of the replayed scenarios. Furthermore, we have released all of our experimental data and code (Bernal-Cárdenas et al., 2019), to facilitate the reproducibility of our experiments.
Construct Validity. The main threat to construct validity arises from the potential bias in our manual creation of videos for the popular apps study carried out to answer RQ3. It is possible that the author’s knowledge of V2S influenced the manner in which we recorded videos. To help mitigate this threat, we took care to record videos as naturally as possible (e.g., normal speed, included natural quick gestures). Furthermore, we carried out an orthogonal controlled study in the course of answering RQ3, where users unfamiliar with V2S naturally recorded videos on a physical device, representing an unbiased set of videos. Another potential confounding factor concerns the quality of the dataset of screens used to train, test, and evaluate V2S’s Faster R-CNN and Opacity CNN. To mitigate this threat, we utilize the ReDraw dataset (Moran et al., 2018a) of screens which have undergone several filtering and quality control mechanisms to ensure a diverse set of real GUIs. One more potential threat concerns our methodology for assessing the utility of V2S. Our developer interviews only assess the perceived usefulness of our technique, determining whether developers actually receive benefit from V2S is left for future work.
External Validity. Threats to the generalizability of our conclusions are mainly related to: (i) the number and diversity apps used in our evaluation; (ii) the representativeness of usage scenarios depicted in our experimental videos; and (iii) the generalizability of the responses given by the interviewed developers. To help mitigate the first threat, we performed a large-scale study with 64 of the top applications on Google Play mined from 32 categories. While performing additional experiments with more applications is ideal, our experimental set of applications represents a reasonably large number of apps with different functionalities, which illustrate the relatively applicability of V2S. To mitigate the second threat, we collected scenarios illustrating bugs, natural apps usages, real crashes, and controlled crashes from eight participants. Finally, we do not claim that the feedback we received from developers generalizes broadly across industrial teams. However, the positive feedback and suggestions for future work we received in our interviews illustrate the potential practical usefulness of V2S.
7. Related Work
Analysis of video and screen captures. Lin et al. (Lin et al., 2014a) proposed an approach called Screenmilker to automatically extract screenshots of sensitive information (e.g., user entering a password) by using the Android Debug Bridge. This technique focuses on the extraction of keyboard inputs from ”real-time” screenshots. Screenmilker is primarily focused upon extracting sensitive information, whereas V2S analyzes every single frame of a video to generate a high fidelity replay script from a sequence of video frames.
Krieter et al. (Krieter and Breiter, 2018) use video analysis to extract high-level descriptions of events from user video recordings on Android apps. Their approach generates log files that describe what events are happening at the app level. Compared to our work, this technique is not able to produce a script that would automatically replay the actions on a device, but instead simply describe high-level app events (e.g., “WhatsApp chat list closed”). Moreover, our work focuses on video analysis to help with bug reproduction and generation of test scenarios, rather than describing usage scenarios at a high level.
Bao et al. (Bao et al., 2015) and Frisson et al. (Frisson et al., 2016) focus on the extraction of user interactions to facilitate behavioral analysis of developers during programming tasks using CV techniques. In our work, rather than focusing upon recording developers interactions, we instead focus on understanding and extracting generic user actions on mobile apps in order to generate high-fidelity replay scripts.
Other researchers have proposed approaches that focus on the generation of source code for Android applications from screenshots or mock-ups. These approaches rely on techniques that vary solely from CV-based (Nguyen and Csallner, 2015) to DL-based (Beltramelli, 2018; Moran et al., 2018a; Chen et al., 2018).
The most related work to V2S is the AppFlow approach introduced by Hu et al. (Hu et al., 2018). AppFlow leverages machine learning techniques to analyze Android screens and categorize types of test cases that could be performed on them (i.e., a sign in screen whose test case would be a user attempting to sign in). However, this technique is focused on the generation of semantically meaningful test cases in conjunction with automated dynamic analysis. In contrast, V2S is focused upon the automated replication of any type of user interaction on an Android device, whether this depicts a usage scenario or bug. Thus, V2S could be applied to automatically reproduce crowdsourced mobile app videos, whereas AppFlow is primarily concerned with the generation of tests rather than the reproduction of existing scenarios.
Record and replay. Many tools assist in recording and replaying tests for mobile platforms (Gomez et al., 2013; air, 2019; rep, 2019; Jeon and Foster, 2012; Moran et al., 2017). However, many of these tools require the recording of low-level events using adb, which usually requires rooting of a device, or loading a custom operating system (OS) to capture user actions/events that are otherwise not available through standard tools such as adb. While our approach uses RERAN (Gomez et al., 2013) to replay system-level events, we rely on video frames to transform touch overlays to low-level events. This facilitates bug reporting for users by minimizing the requirement of specialized programs to record and replay user scenarios.
Hu et al. (Hu et al., 2015) developed VALERA for replaying device actions, sensor and network inputs (e.g., GPS, accelerometer, etc.), event schedules, and inter-app communication. This approach requires a rooted target device and the installation of a modified Android runtime environment. These requirements may lead to practical limitations, such as device configuration overhead and the potential security concerns of rooted devices. Such requirements are often undesirable for developers (Lam et al., 2017). Conversely, our approach is able to work on any unmodified Android version without the necessity of a rooted device, requiring just a screen recording.
Nurmuradov et al. (Nurmuradov and Bryce, 2017) introduced a record and replay tool for Android applications that captures user interactions by displaying the device screen in a web browser. This technique uses event data captured during the recording process to generate a heatmap that facilitate developers’ understanding on how users are interacting with an application. This approach is limited in that users must interact with a virtual Android device through a web application, which could result in unnatural usage patterns. This technique is more focused towards session-based usability testing, whereas V2S is focused upon replaying ”in-field” app usages from users or crowdsourced testers collected from real devices via screen recordings.
Other work has focused on capturing high-level interactions in order to replay events (Halpern et al., 2015; air, 2019; Milano, 2019; esp, 2019). For instance Mosaic (Halpern et al., 2015), uses an intermediate representation of user interactions to make replays device agnostic. Additional tools including HiroMacro (hir, 2019) and Barista (Fazzini et al., 2017) are Android applications that allow for a user to record and replay interactions. They require the installation or inclusion of underlying frameworks such as replaykit (rep, 2019), AirTest (air, 2019), or troyd (Jeon and Foster, 2012). Android Bot Maker (bot, 2019) is an Android application that allows for the automation of individual device actions, however, it does not allow for recording high-level interactions, instead one must enter manually the type of action and raw coordinates. In contrast to these techniques, one of V2S’s primary aims is to create an Android record and replay solution which an inherently low barrier to usage. For instance, there are no frameworks to install, or instrumentation to add, the only input is an easily collectable screen recording. This makes V2S suitable for use in crowd- or beta-testing scenarios, and improves the likelihood of its adoption among developers for automated testing, given its ease of use relative to developer’s perceptions of other tools (Linares-Vásquez et al., 2017).
Finally, as crowdsourcing information from mobile app users has become more common with the advent of a number of testing services (app, 2019a; tes, 2019a; myc, 2019), researchers have turned to utilizing usage data recorded from crowd-testers to enhance techniques related to automated test case generation for mobile apps. Linares-Vásquez et al. first introduced the notion of recording crowd-sourced data to enhance input generation strategies for mobile testing through the introduction of the MonkeyLab framework (Linares-Vásquez et al., 2015). This technique adapted N-gram language models trained on recorded user data to predict event sequences for automated mobile test case generation. Mao et al. developed the Polariz approach which is able to infer “motif” event sequences collected from the crowd that are applicable across different apps (Mao et al., 2017). The authors found that the activity-based coverage of the Sapienz automated testing tool can be improved through a combination of crowd-based and search-based techniques. The two approaches discussed above require either instrumented or rooted devices (MonkeyLab), or interaction with apps via a web-browser (Polariz). Thus, V2S is complementary to these techniques as it provides a frictionless mechanism by which developers can collect user data in the form of videos.
8. Conclusion & Future Work
We have presented V2S, an approach for automatically translating video recordings of Android app usages into replayable scenarios. A comprehensive evaluation indicates that V2S: (i) accurately identifies touch indicators and it is able to differentiate between opacity levels, (ii) is capable of reproducing a high percentage of complete scenarios related to crashes and other bugs, with promising results for general user scenarios as well, and (iii) is potentially useful to support real developers during a variety of tasks.
Future work can make V2S applicable to different software maintenance tasks, such as: (i) producing scripts with coordinate-agnostic actions, (ii) generating natural language user scenarios, (iii) improving user experience via behavior analysis, (iv) facilitating additional maintenance tasks via GUI-based information, etc.
Acknowledgements.
This work is supported in part by the NSF CCF-1927679, CCF-1815186, CNS-1815336, and CCF-1955837 grants. Any opinions, findings, and conclusions expressed herein are the authors’ and do not necessarily reflect those of the sponsors.References
- (1)
- and (2014) 2014. Android Fragmentation Statistics http://opensignal.com/reports/2014/android-fragmentation/.
- 7-e (2019) 2019. 7-Eleven https://play.google.com/store/apps/details?id=com.sei.android.
- air (2019) 2019. Airtest Project. Retrieved August 14, 2019 from http://airtest.netease.com/
- sho (2019) 2019. Android Show Touches Option https://medium.theuxblog.com/enabling-show-touches-in-android-screen-recordings-for-user-research-cc968563fcb9.
- app (2019a) 2019a. Applause Crowdsourced Testing Service https://www.applause.com/crowdtesting.
- app (2019b) 2019b. AppSee https://www.appsee.com.
- bug (2019) 2019. BugClipper http://bugclipper.com.
- rep (2019) 2019. Command line tools for recording, replaying and mirroring touchscreen events for Android: appetizerio/replaykit. https://github.com/appetizerio/replaykit original-date: 2016-10-28T01:10:09Z.
- esp (2019) 2019. Create UI tests with Espresso Test Recorder. https://developer.android.com/studio/test/espresso-test-recorder
- ffm (2019) 2019. FFmpeg tool https://www.ffmpeg.org/.
- g-p (2019) 2019. Google Play Screen Recording Apps https://play.google.com/store/search?q=screen%20recording&c=apps.
- g-i (2019) 2019. Google Search https://play.google.com/store/apps/details?id=com.google.android.googlequicksearchbox.
- hir (2019) 2019. HiroMacro Auto-Touch Macro - Apps on Google Play. https://play.google.com/store/apps/details?id=com.prohiro.macro&hl=en
- mrt (2019) 2019. Mr. Tappy Mobile Usability Testing Device https://www.mrtappy.com.
- myc (2019) 2019. MyCrowd Crowdsourced Testing Service https://mycrowd.com.
- pro (2019) 2019. Proximus https://www.proximus.be.
- bot (2019) 2019. [ROOT] Bot Maker for Android - Apps on Google Play. https://play.google.com/store/apps/details?id=com.frapeti.androidbotmaker&hl=en
- sta (2019) 2019. Stackoverflow Android Screen Record https://stackoverflow.com/questions/29546743/what-is-the-frame-rate-of-screen-record/44523688.
- TFO (2019) 2019. TensorFlow Object Detection API https://github.com/tensorflow/models/tree/master/research/object_detection.
- tes (2019a) 2019a. TestBirds Crowdsourced Testing Service https://www.testbirds.com.
- tes (2019b) 2019b. TestFairy https://testfairy.com.
- wat (2019) 2019. WatchSend https://watchsend.com.
- Bao et al. (2015) Lingfeng Bao, Jing Li, Zhenchang Xing, Xinyu Wang, and Bo Zhou. 2015. scvRipper: video scraping tool for modeling developers’ behavior using interaction data. In Proceedings of the 37th International Conference on Software Engineering (ICSE’15). IEEE Press, 673–676.
- Bavota et al. (2015) G. Bavota, M. Linares-Vásquez, C.E. Bernal-Cárdenas, M. Di Penta, R. Oliveto, and D. Poshyvanyk. 2015. The Impact of API Change- and Fault-Proneness on the User Ratings of Android Apps. IEEE Transactions on Software Engineering 41, 4 (April 2015), 384–407.
- Beltramelli (2018) Tony Beltramelli. 2018. pix2code: Generating code from a graphical user interface screenshot. In Proceedings of the ACM Symposium on Engineering Interactive Computing Systems (SIGCHI’18). ACM, 3.
- Bernal-Cárdenas et al. (2019) Carlos Bernal-Cárdenas, Nathan Cooper, Kevin Moran, Oscar Chaparro, Andrian Marcus, and Denys Poshyvanyk. 2019. V2S Online Appendix https://sites.google.com/view/video2sceneario/home.
- Bettenburg et al. (2008) Nicolas Bettenburg, Sascha Just, Adrian Schröter, Cathrin Weiss, Rahul Premraj, and Thomas Zimmermann. 2008. What Makes a Good Bug Report?. In Proceedings of the 16th ACM SIGSOFT International Symposium on Foundations of Software Engineering (FSE’08). New York, NY, USA, 308–318.
- Chaparro et al. (2019) Oscar Chaparro, Carlos Bernal-Cárdenas, Jing Lu, Kevin Moran, Andrian Marus, Massimiliano Di Penta, Denys Poshyvanyk, and Vincent Ng. 2019. Assessing the Quality of the Steps to Reproduce in Bug Reports. In Proceedings of the 27th ACM Joint European Software Engineering Conference and Symposium on the Foundations of Software Engineering (ESEC/FSE’19). Bergamo, Italy.
- Chen et al. (2018) Chunyang Chen, Ting Su, Guozhu Meng, Zhenchang Xing, and Yang Liu. 2018. From UI design image to GUI skeleton: a neural machine translator to bootstrap mobile GUI implementation. In Proceedings of the 40th International Conference on Software Engineering (ICSE’18). ACM, 665–676.
- Ciurumelea et al. (2017) Adelina Ciurumelea, Andreas Schaufelbühl, Sebastiano Panichella, and Harald Gall. 2017. Analyzing Reviews and Code of Mobile Apps for Better Release Planning. In Proceedings of the IEEE 24th International Conference on Software Analysis, Evolution and Reengineering (SANER’17). 91–102.
- Di Sorbo et al. (2016) Andrea Di Sorbo, Sebastiano Panichella, Carol V. Alexandru, Junji Shimagaki, Corrado A. Visaggio, Gerardo Canfora, and Harald C. Gall. 2016. What Would Users Change in My App? Summarizing App Reviews for Recommending Software Changes. In Proceedings of the 24th ACM SIGSOFT International Symposium on Foundations of Software Engineering (FSE’16). Seattle, WA, USA, 499–510.
- Fazzini et al. (2017) M. Fazzini, E. N. D. A. Freitas, S. R. Choudhary, and A. Orso. 2017. Barista: A Technique for Recording, Encoding, and Running Platform Independent Android Tests. In Proceedings of the 10th IEEE International Conference on Software Testing, Verification and Validation (ICST’17). 149–160.
- Frisson et al. (2016) Christian Frisson, Sylvain Malacria, Gilles Bailly, and Thierry Dutoit. 2016. InspectorWidget: A System to Analyze Users Behaviors in Their Applications. In Proceedings of the CHI Conference Extended Abstracts on Human Factors in Computing Systems (CHI’16). ACM, 1548–1554.
- Girshick et al. (2014) Ross Girshick, Jeff Donahue, Trevor Darrell, and Jitendra Malik. 2014. Rich Feature Hierarchies for Accurate Object Detection and Semantic Segmentation. In Proceedings of the IEEE Conference on Computer Vision and Pattern Recognition (CVPR’14). Washington, DC, USA, 580–587.
- Gomez et al. (2013) Lorenzo Gomez, Iulian Neamtiu, Tanzirul Azim, and Todd Millstein. 2013. RERAN: Timing- and touch-sensitive record and replay for Android. In Proceedings of the 35th International Conference on Software Engineering (2013) (ICSE’13). 72–81.
- Halpern et al. (2015) M. Halpern, Y. Zhu, R. Peri, and V. J. Reddi. 2015. Mosaic: cross-platform user-interaction record and replay for the fragmented android ecosystem. In Proceedings of the IEEE International Symposium on Performance Analysis of Systems and Software (2015) (ISPASS’15). 215–224.
- Han et al. (2012) Dan Han, Chenlei Zhang, Xiaochao Fan, Abram Hindle, Kenny Wong, and Eleni Stroulia. 2012. Understanding Android Fragmentation with Topic Analysis of Vendor-Specific Bugs. In Proceedings of the 19th Working Conference on Reverse Engineering (WCRE’12). Washington, DC, USA, 83–92.
- He et al. (2016) K. He, X. Zhang, S. Ren, and J. Sun. 2016. Deep Residual Learning for Image Recognition. In Proceedings of the IEEE Conference on Computer Vision and Pattern Recognition (CVPR’16). 770–778.
- Hu et al. (2014) Gang Hu, Xinhao Yuan, Yang Tang, and Junfeng Yang. 2014. Efficiently, Effectively Detecting Mobile App Bugs with AppDoctor. In Proceedings of the 9th European Conference on Computer Systems (EuroSys’14). New York, NY, USA, Article 18, 15 pages.
- Hu et al. (2018) Gang Hu, Linjie Zhu, and Junfeng Yang. 2018. AppFlow: using machine learning to synthesize robust, reusable UI tests. In Proceedings of the 26th ACM Joint Meeting on European Software Engineering Conference and Symposium on the Foundations of Software Engineering (2018) (ESEC/FSE’18). 269–282.
- Hu et al. (2015) Yongjian Hu, Tanzirul Azim, and Iulian Neamtiu. 2015. Versatile yet lightweight record-and-replay for Android. In Proceedings of the ACM SIGPLAN International Conference on Object-Oriented Programming, Systems, Languages, and Applications (2015) (OOPSLA’15). 349–366.
- Jeon and Foster (2012) Jinseong Jeon and Jeffrey S Foster. 2012. Troyd: Integration Testing for Android. (2012), 7.
- Jones (2013) N. Jones. 2013. Seven best practices for optimizing mobile testing efforts. Technical Report G00248240. Gartner.
- Krieter and Breiter (2018) Philipp Krieter and Andreas Breiter. 2018. Analyzing mobile application usage: generating log files from mobile screen recordings. In Proceedings of the 20th International Conference on Human-Computer Interaction with Mobile Devices and Services (2018) (MobileHCI’18). 1–10.
- Krizhevsky et al. (2012) Alex Krizhevsky, Ilya Sutskever, and Geoffrey E Hinton. 2012. ImageNet Classification with Deep Convolutional Neural Networks. In Proceedings of the 25th Neural Information Processing Systems (NeurIPS’12). 1097–1105.
- Lam et al. (2017) Wing Lam, Zhengkai Wu, Dengfeng Li, Wenyu Wang, Haibing Zheng, Hui Luo, Peng Yan, Yuetang Deng, and Tao Xie. 2017. Record and replay for Android: are we there yet in industrial cases?. In Proceedings of the 11th Joint Meeting on Foundations of Software Engineering - 2017 (2017) (ESEC/FSE’17). 854–859.
- Lin et al. (2014a) Chia-Chi Lin, Hongyang Li, Xiaoyong Zhou, and XiaoFeng Wang. 2014a. Screenmilker: How to Milk Your Android Screen for Secrets. In Proceedings of the Network and Distributed System Security Symposium (2014) (NDSS’14).
- Lin et al. (2014b) Tsung Yi Lin, Michael Maire, Serge Belongie, James Hays, Pietro Perona, Deva Ramanan, Piotr Dollár, and C. Lawrence Zitnick. 2014b. Microsoft COCO: Common objects in context. , 740–755 pages.
- Linares-Vásquez et al. (2013) Mario Linares-Vásquez, Gabriele Bavota, Carlos Bernal-Cárdenas, Massimiliano Di Penta, Rocco Oliveto, and Denys Poshyvanyk. 2013. API Change and Fault Proneness: A Threat to the Success of Android Apps. In Proceedings of the 9th Joint Meeting on Foundations of Software Engineering (ESEC/FSE’13). New York, NY, USA, 477–487.
- Linares-Vásquez et al. (2017) Mario Linares-Vásquez, Carlos Bernal-Cardenas, Kevin Moran, and Denys Poshyvanyk. 2017. How Do Developers Test Android Applications?. In Proceedings of the IEEE International Conference on Software Maintenance and Evolution (ICSME’17). 613–622.
- Linares-Vásquez et al. (2017) Mario Linares-Vásquez, Kevin Moran, and Denys Poshyvanyk. 2017. Continuous, Evolutionary and Large-Scale: A New Perspective for Automated Mobile App Testing. In Proceedings of the IEEE International Conference on Software Maintenance and Evolution (ICSME’17). 399–410.
- Linares-Vásquez et al. (2015) Mario Linares-Vásquez, Martin White, Carlos Bernal-Cárdenas, Kevin Moran, and Denys Poshyvanyk. 2015. Mining Android App Usages for Generating Actionable GUI-based Execution Scenarios. In Proceedings of the 12th Working Conference on Mining Software Repositories (MSR’15). 111–122.
- Mao et al. (2017) Ke Mao, Mark Harman, and Yue Jia. 2017. Crowd Intelligence Enhances Automated Mobile Testing. In Proceedings of the 32nd IEEE/ACM International Conference on Automated Software Engineering (ASE’17). Piscataway, NJ, USA, 16–26.
- Milano (2019) Diego Torres Milano. 2019. Android ViewServer client. Contribute to dtmilano/AndroidViewClient development by creating an account on GitHub. https://github.com/dtmilano/AndroidViewClient
- Moran et al. (2018b) Kevin Moran, Carlos Bernal-Cárdenas, Mario Linares-Vásquez, and Denys Poshyvanyk. 2018b. Overcoming Language Dichotomies: Toward Effective Program Comprehension for Mobile App Development. In Proceedings of the 26th International Conference on Program Comprehension (ICPC’18). 7–18.
- Moran et al. (2017) Kevin Moran, Richard Bonett, Carlos Bernal-Cardenas, Brendan Otten, Daniel Park, and Denys Poshyvanyk. 2017. On-Device Bug Reporting for Android Applications. In Proceedings of the IEEE/ACM 4th International Conference on Mobile Software Engineering and Systems (MOBILESoft’17). 215–216.
- Moran et al. (2015) Kevin Moran, Mario Linares-Vásquez, Carlos Bernal-Cárdenas, and Denys Poshyvanyk. 2015. Auto-completing Bug Reports for Android Applications. In Proceedings of the 10th Joint Meeting of the European Software Engineering Conference and the 23rd ACM SIGSOFT Symposium on the Foundations of Software Engineering (ESEC/FSE’15). Bergamo, Italy.
- Moran et al. (2016) Kevin Moran, Mario Linares-Vásquez, Carlos Bernal-Cárdenas, Christopher Vendome, and Denys Poshyvanyk. 2016. Automatically discovering, reporting and reproducing android application crashes. In Proceedings of the IEEE International Conference on Software Testing, Verification and Validation (ICST’16). IEEE, 33–44.
- Moran et al. (2018a) Kevin Patrick Moran, Carlos Bernal-Cardenas, Michael Curcio, Richard Bonett, and Denys Poshyvanyk. 2018a. Machine Learning-Based Prototyping of Graphical User Interfaces for Mobile Apps. IEEE Transactions on Software Engineering (2018).
- Nguyen and Csallner (2015) Tuan Anh Nguyen and Christoph Csallner. 2015. Reverse Engineering Mobile Application User Interfaces with REMAUI. In Proceedings of the 30th IEEE/ACM International Conference on Automated Software Engineering (ASE’15). Washington, DC, USA, 248–259.
- Nurmuradov and Bryce (2017) Dmitry Nurmuradov and Renee Bryce. 2017. Caret-HM: recording and replaying Android user sessions with heat map generation using UI state clustering. In Proceedings of the 26th ACM SIGSOFT International Symposium on Software Testing and Analysis (2017) (ISSTA’17). 400–403.
- Palomba et al. (2015) F. Palomba, M. Linares-Vasquez, G. Bavota, R. Oliveto, M. Di Penta, D. Poshyvanyk, and A. De Lucia. 2015. User reviews matter! Tracking crowdsourced reviews to support evolution of successful apps. In Proceedings of the IEEE International Conference on Software Maintenance and Evolution (ICSME’15). 291–300.
- Palomba et al. (2018) Fabio Palomba, Mario Linares-Vásquez, Gabriele Bavota, Rocco Oliveto, Massimiliano Di Penta, Denys Poshyvanyk, and Andrea De Lucia. 2018. Crowdsourcing user reviews to support the evolution of mobile apps. Journal of Systems and Software (2018), 143–162.
- Palomba et al. (2017) Fabio Palomba, Pasquale Salza, Adelina Ciurumelea, Sebastiano Panichella, Harald Gall, Filomena Ferrucci, and Andrea De Lucia. 2017. Recommending and Localizing Change Requests for Mobile Apps Based on User Reviews. In Proceedings of the 39th International Conference on Software Engineering (ICSE’17). Piscataway, NJ, USA, 106–117.
- Qin et al. (2016) Zhengrui Qin, Yutao Tang, Ed Novak, and Qun Li. 2016. MobiPlay: A Remote Execution Based Record-and-replay Tool for Mobile Applications. In Proceedings of the 38th International Conference on Software Engineering (ICSE’16). New York, NY, USA, 571–582.
- Ren et al. (2015) Shaoqing Ren, Kaiming He, Ross Girshick, and Jian Sun. 2015. Faster R-CNN: Towards Real-time Object Detection with Region Proposal Networks. In Proceedings of the 28th International Conference on Neural Information Processing Systems (NeurIPS’15). Cambridge, MA, USA, 91–99.
- Ren et al. (2017) Shaoqing Ren, Kaiming He, Ross Girshick, and Jian Sun. 2017. Faster R-CNN: towards real-time object detection with region proposal networks. IEEE Transactions on Pattern Analysis & Machine Intelligence 6 (2017), 1137–1149.
- Schusteritsch et al. (2007) Rudy Schusteritsch, Carolyn Y. Wei, and Mark LaRosa. 2007. Towards the Perfect Infrastructure for Usability Testing on Mobile Devices. In Proceedings of the CHI Extended Abstracts on Human Factors in Computing Systems (CHI’07). New York, NY, USA, 1839–1844.
- Simonyan and Zisserman (2014) Karen Simonyan and Andrew Zisserman. 2014. Very Deep Convolutional Networks for Large-Scale Image Recognition. In Proceedings of the International Conference on Learning Representations (ICLR’14), Vol. abs/1409.1556.
- Szegedy et al. (2015) Christian Szegedy, Wei Liu, Yangqing Jia, Pierre Sermanet, Scott Reed, Dragomir Anguelov, Dumitru Erhan, Vincent Vanhoucke, and Andrew Rabinovich. 2015. Going Deeper with Convolutions. In Proceedings of the Computer Vision and Pattern Recognition (CVPR’15).
- Uijlings et al. (2013) J. R. R. Uijlings, K. E. A. van de Sande, T. Gevers, and A. W. M. Smeulders. 2013. Selective Search for Object Recognition. International Journal of Computer Vision 104, 2 (01 Sep 2013), 154–171.
- Wei et al. (2016) L. Wei, Y. Liu, and S. C. Cheung. 2016. Taming Android Fragmentation: Characterizing and Detecting Compatibility Issues for Android Apps. In Proceedings of the 31st IEEE/ACM International Conference on Automated Software Engineering (ASE’16). 226–237.
- Zeiler and Fergus (2014) Matthew D. Zeiler and Rob Fergus. 2014. Visualizing and Understanding Convolutional Networks. In Proceedings of the 13th European Conference on Computer Vision (ECCV’14). Cham, 818–833.