FootTile: a Rugged Foot Sensor for
Force and Center of Pressure Sensing in Soft Terrain
Abstract
In this paper we present FootTile, a foot sensor for reaction force and center of pressure sensing in challenging terrain. We compare our sensor design to standard biomechanical devices, force plates and pressure plates. We show that FootTile can accurately estimate force and pressure distribution during legged locomotion. FootTile weighs , has a sampling rate of , a footprint of 10 x and can easily be adapted in sensor range to the required load case. In three experiments we validate: first the performance of the individual sensor, second an array of FootTiles for center of pressure sensing and third the ground reaction force estimation during locomotion in granular substrate. We then go on to show the accurate sensing capabilities of the waterproof sensor in liquid mud, as a showcase for real world rough terrain use.
I INTRODUCTION
In walking robotics and in biomechanics, sensors are a fundamental tool to understand the mechanics and control of a system. Biomechanic data is especially important in outdoor environments, to collect data during natural locomotion.
Standard tools in biomechanics, are ground reaction force plates and pressure plates to measure the force and pressure distribution on a foot. Force plates and pressure plates are easy to use, but are are heavy, delicate, immobile and expensive. It is also not possible to measure pressure distribution on soft and granular substrate. The biggest drawback of these systems, however, is that they are not wearable. Both systems can only capture a small number of strides because of their size. Therefore it becomes hard to collect average data or data where the conditions change between steps.
To have a pressure or force reading for a long duration at every step of a system, wearable devices are required. The most direct sensors are strain gauge based force/torque sensors [1]. Attached to the foot, these sensors can read forces and torques with high range, accuracy, and frequency. Stiff sensors, however, tend to be heavy and increase the rotational inertia when placed at the end of a leg. They are also expensive and very sensitive to impact forces. Soft sensors solve the problems of weight and impact sensitivity by implementing soft, deformable elements. Under load, the soft element deforms, and various sensing principles can measure the deformation. The Optoforce sensor measures the changes in light reflection on the inside of a soft dome due to deformation.
Alternatively, the deformation of a soft sensor body can be detected by Hall effect sensors [2], resistive [3, 4, 5, 6] or capacitive [7] sensors. While these sensors are easy to use and cheap to implement they are not sufficiently robust against the high impact forces during running and can not easily be scaled down and miniaturized.
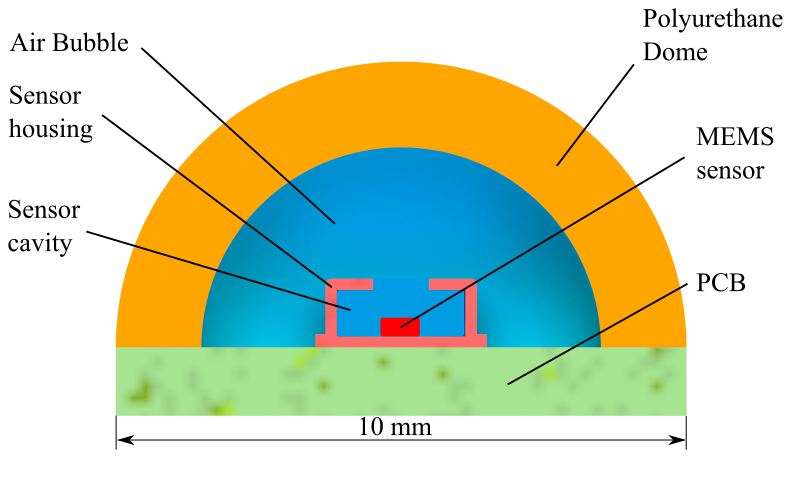
Tenzer and colleagues [9] developed a tactile sensor called ’Takktile’, based on a barometric pressure sensor. The micro-electro-mechanical (MEMS) sensor’s cavity gets filled with rubber that transmits external forces to the pressure sensor’s membrane. The miniature sensor can measure forces up to and can be overloaded with of its nominal force. To extend the sensor range, Chuah and colleagues [10] implemented a higher range pressure sensor in the same design to circumvent the range limits. Lèon and colleagues [8] enhanced the sensor range by including an engineered bubble into the rubber dome. This bubble acts as a pressure transducer. Based on the dome deformation the bubble volume reduces, and the pressure in the bubble rises. The range can be designed based on the dome design and can be adjusted for any load case. The sensor was used in the paper to measure the forces on a rotorcraft robotic landing gear.
In this project, we adapt the sensor design from [8], for use in legged locomotion, with our requirements for force range, sensitivity, sensor size and sampling frequency. Specifically, we implement a sensor array and showcase measurements of forces as well as the center of pressure on solid and soft terrain. We present a foot sensor array that is lightweight, rugged, wearable, waterproof and allows force and pressure sensing in flat and rough terrain and granular media as well as mud. As shown in previous research, the sensor can be used on robotic systems for control purposes. We illustrate the advantages of this miniature sensor for use in biomechanical legged locomotion experiments for animal or robotic subjects. We compare the sensor performance to force plates and pressure plates, the two standard devices for biomechanical data acquisition. We show how the sensor can estimate ground reaction forces and the center of pressure. We present experimental data how the sensor can be used on solid ground, as well as granular medium and real world rough terrain, like mud.
II METHODS
II-A Sensor design
The sensor in Figure 1 consists of a barometric pressure sensor (MPL115A2, NXP) . To date, it is the miniature barometric pressure sensor with the highest sample rate on the market.
In this paper we implement simplified polyurethane half-spheres with a spherical bubble inside to reduce the mold complexity. By using different PU materials, three design parameters can be used to adapt the sensor range to the application. The spheres are produced in a two-part 3D printed mold (Onyx, Markforged) and glued airtight to the sensor PCB with instant glue. To make the FootTile as small as possible, we chose a bubble diameter of to fit around the sensor diagonal of . The total sensor design has production costs of less than 10 € per sensor.
The pressure sensor is internally temperature compensated with an individual calibration. Using temperature compensated pressure for calculations we can assume an isotherm process (), the general gas law results in:
| which leads to | |||||
| (1) |
where is the pressure in the bubble, is the bubble volume, and is the gas temperature in the bubble, before and after deformation, respectively. The MEMS sensor has a range of to . The initial pressure in the bubble during manufacturing is one atmospheric pressure, around . The sensor saturates at . To maximize the range of the MEMS sensor, the bubble should compress by % of its initial volume at the maximum external load. By changing the bubble volume and the dome geometry, the sensor range can be designed for many load cases.
To show the range dependency on the dome and bubble volume as well as the material, we test the parameter space shown (Table I).
| Parameter | Values |
|---|---|
| Dome diameter [mm] | 10, 11, 12 |
| Bubble radius [mm] | 3 |
| Material | Vytaflex40 (E=), |
| Vytaflex60 (E=) |
II-B Sensor validation
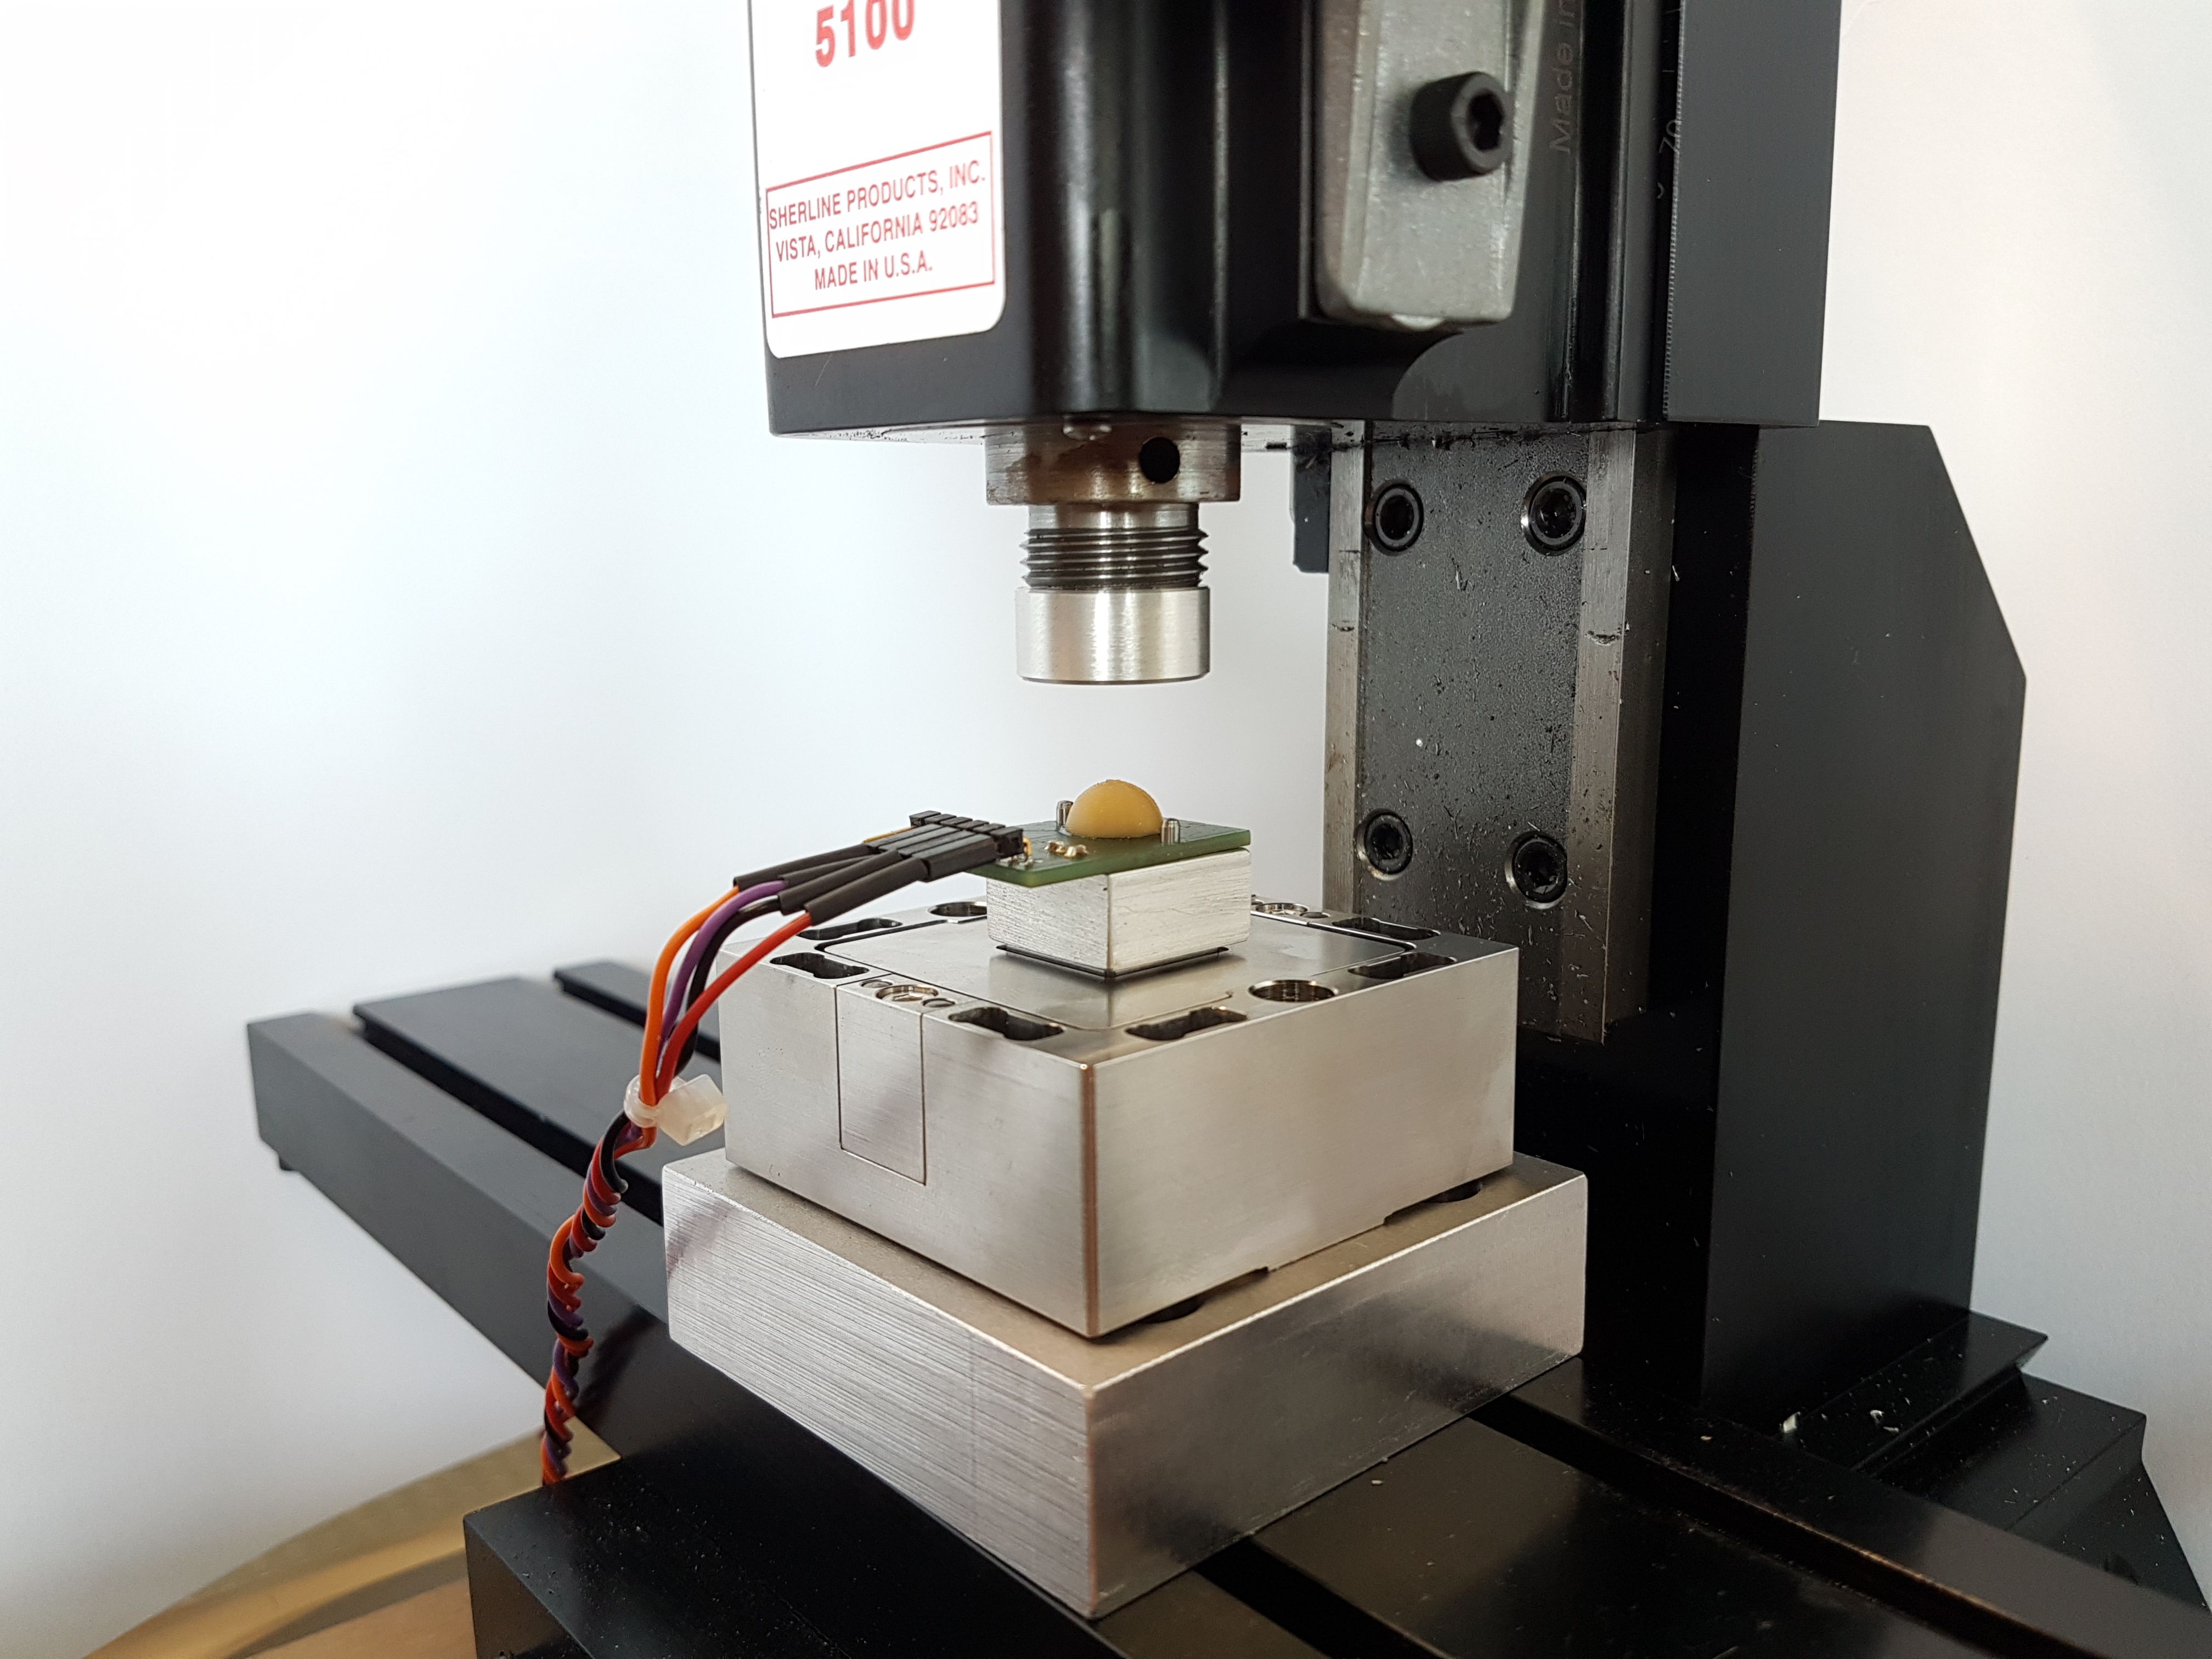
To calibrate the sensor reading to the applied force, we use a 3-axis force sensor (K3D60, ME-Systeme) as ground truth. The FootTile is fixed to the force sensor mounted on the z-axis of a manual mill (Figure 2). By moving the mill in the vertical direction, the indenter on the mill head deforms the FootTile, and the force sensor data can be compared to the FootTile data. The FootTile is connected via I2C to a Raspberry Pi 3B+. The force sensor is connected to an amplifier (BA9236, Burster) and an analog-digital converter (MCP3208, Microchip). The different sensor configurations from Table I are indented until the sensor saturates at to determine the maximum sensor range. The sensor has a conversion time for one data sample of . This results in a maximum theoretical reading frequency of . Due to speed restrictions in the Raspberry I2C driver, data for both sensors is sampled at . The indentation experiments are repeated four times, and the data is averaged and shown with 95% confidence intervals.
II-C FootTile array
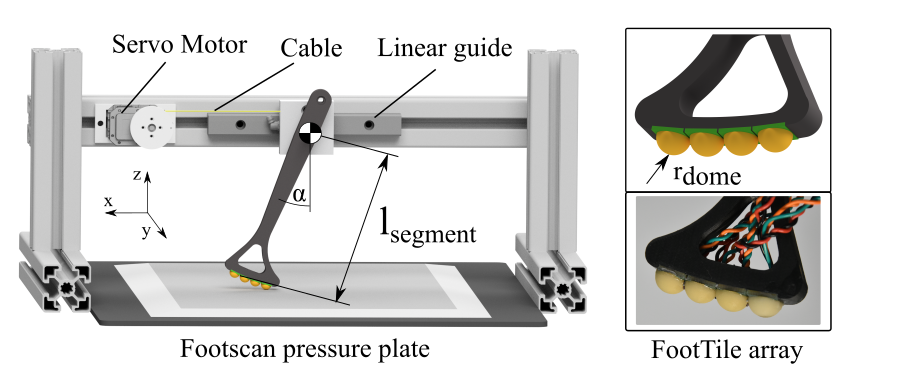
In order to measure the pressure distribution and center of pressure (COP) along a footpad, we implement an array of FootTiles. The center of pressure describes the point where the resultant force vector of a pressure field acts on a body [11]. To simplify the experiment, we restrict the foot to only roll on the ground in the sagittal plane. Therefore we only use a one-dimensional array of sensors. The foot of our robot [12] is redesigned to have a constant radius of measured from the ankle joint over the footpad. The footpad arc spans the angle the robot leg sweeps during actuated hopping. We place four sensors along the arc of the foot segment arc. As ground-truth the foot rolls onto a pressure plate (Advanced footscan pressure plate, rsscan). The FootTiles are connected to a I2C multiplexer (TCA9548A, Texas Instruments), to use several sensors on one I2C bus and reduce the delays caused by the sensor conversion time. To measure the foot position and segment angle, we place two markers along the leg axis. The experiments are recorded with a camera at . From the video111https://youtu.be/X7irusBHC3Q, we can extract the marker position to calculate angle and position data of the foot segment. The pressure plate data is recorded with as well as the FootTile array data. The leg’s joint is connected to a linear rail with two ball bearings (Figure 3). The linear rail guarantees that the arc on the footpad of the leg segment experiences pure rolling without height changes. To make the experiment reproducible, we implement a servo motor (MX-28AR Dynamixel) that pulls the linear guide sled with a constant velocity by a Teflon cable.
II-D Granular and muddy substrate
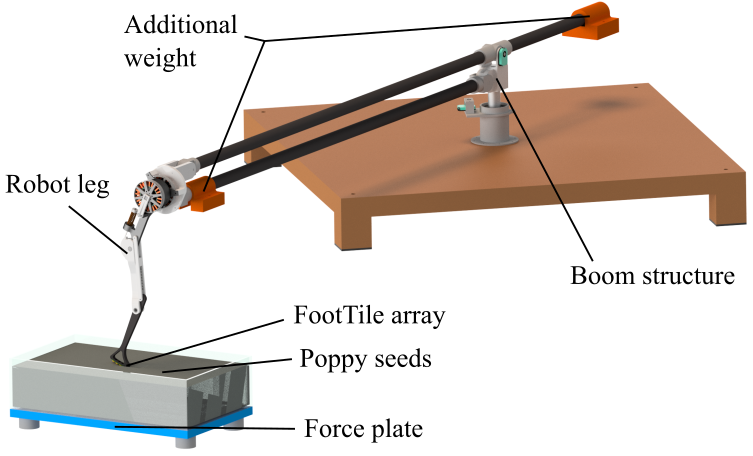
Here, we compare the ground reaction force (GRF) estimation capabilities of the FootTile array. We simulate locomotion in granular medium by using poppy seeds as substrate [13]. The leg with a total weight of is dropped into a box filled with poppy seeds. As ground-truth we place a force plate (9260AA, Kistler) under the box (Figure 4). We record the experiment with a high-speed camera from the sagittal plane at . To simulate locomotion, a servo motor (MX-64, Dynamixel) is connected to the hip of the robot to achieve realistic leg swinging behavior. The center of mass (COM) motion of the robot is constrained to the sagittal plane by a boom structure. The leg is dropped from a foot height of above the substrate. Data from the FootTile array is recorded at a maximum achievable frequency of .
We further test the sensor under realistic conditions in rough terrain by replacing the poppy seeds with mud from a nearby forest, to showcase the rugged and waterproof design. The leg is dropped into mud while the same data as before is recorded. After use, the sensors are cleaned with water while remaining fully functional. To make the sensor waterproof, only the back of each PCB had to be covered with a layer of waterproof protective urethane resin (Urethane Cramolin). The resin protects the PCB from moisture, chemicals, and abrasion. The domes seal the sensors water- and airtight by design.
III RESULTS
III-A Sensor validation

We compare the data from the FootTile to the force data recorded from the force sensor (Figure 5). The FootTile data is normalized to the maximum value when the barometric sensor saturates. As expected, the FootTiles saturate at different forces depending on the material and dome geometry. The sensors molded with Vytaflex 40 saturate at lower forces than the senors with Vytaflex 60 domes. Sensors saturate at higher forces for bigger dome diameters. All data displayed is averaged over four experiments and displayed with 95% confidence intervals. As shown in previous studies [9], the sensor measurements are repeatable with a standard deviation of 0.03 for the normalized sensor output. Because of the deforming bubble geometry, the sensor output is nonlinear with respect to the applied force. The sensor fitting best for the required sensor range of 25- from previous experiments with the robot is the sensor with the Vytaflex 60 dome. The sensor with PCB and dome has a size of 10 x 10 x and weighs . All subsequent experiments use this sensor.
Since the measurements have such a small standard deviation, we can approximate the sensor output with a third-order polynomial to correct sensor data in coming experiments. The pressure-force equation for the selected sensor (Figure 5 orange) can be approximated with
| (2) |
with %, where F is the applied force, and p is the FootTile output pressure.
III-B FootTile Array
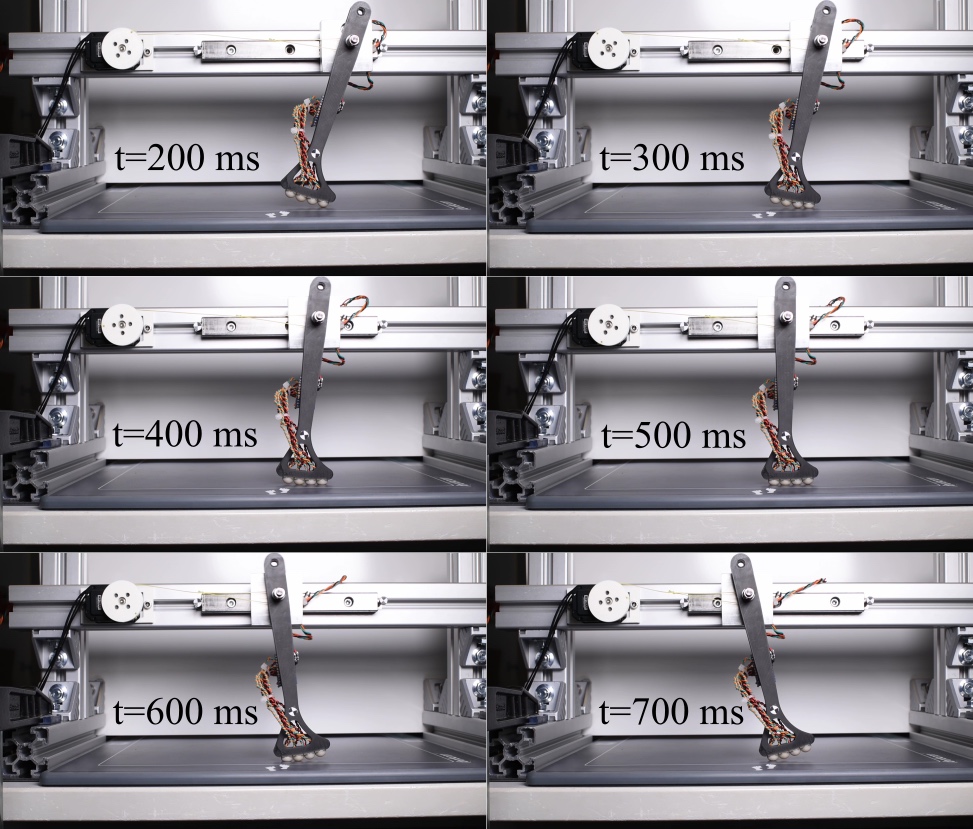
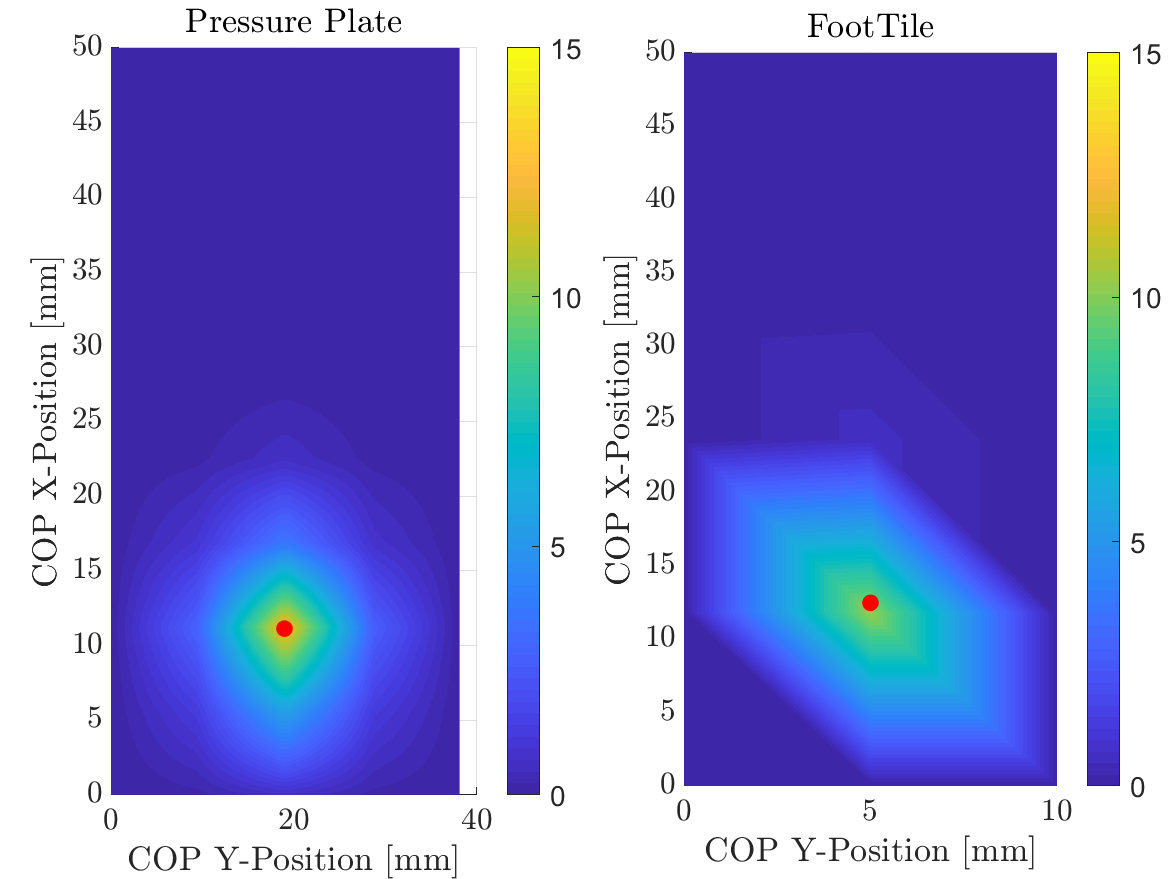
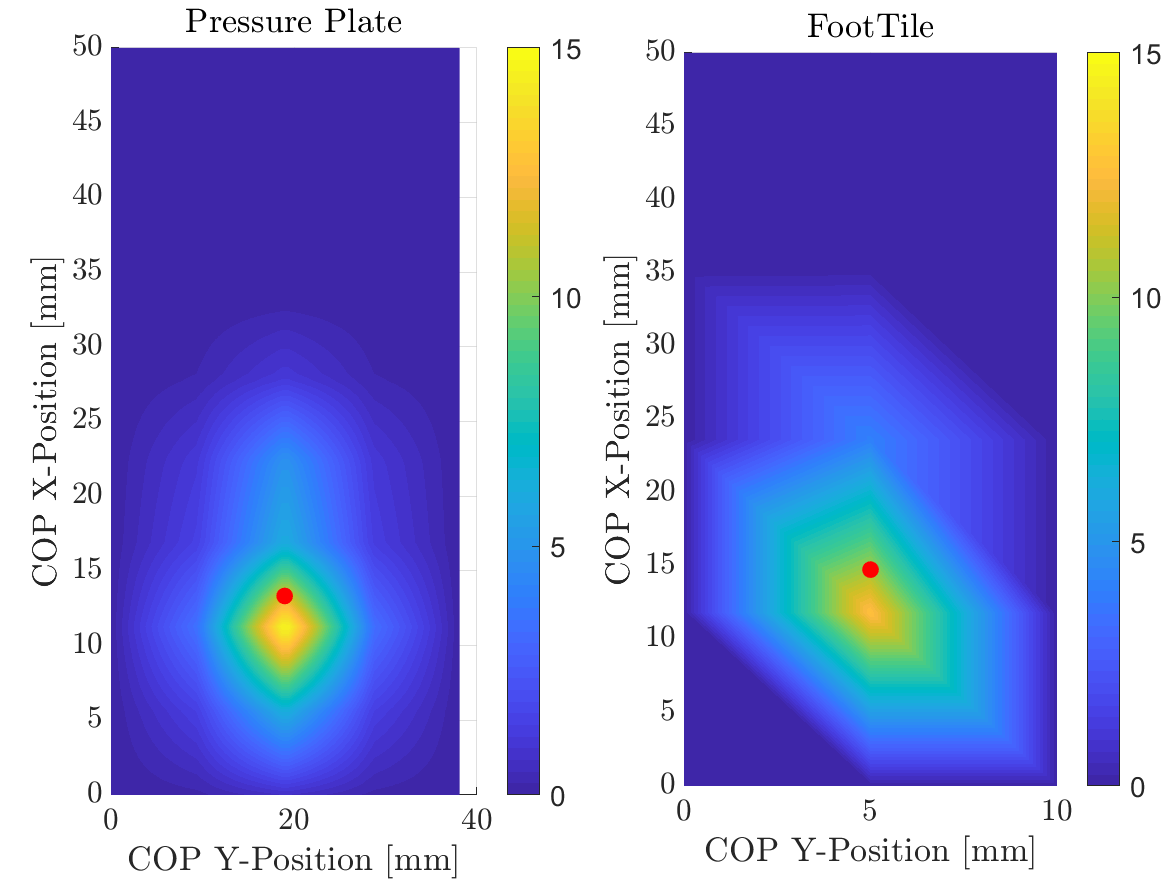
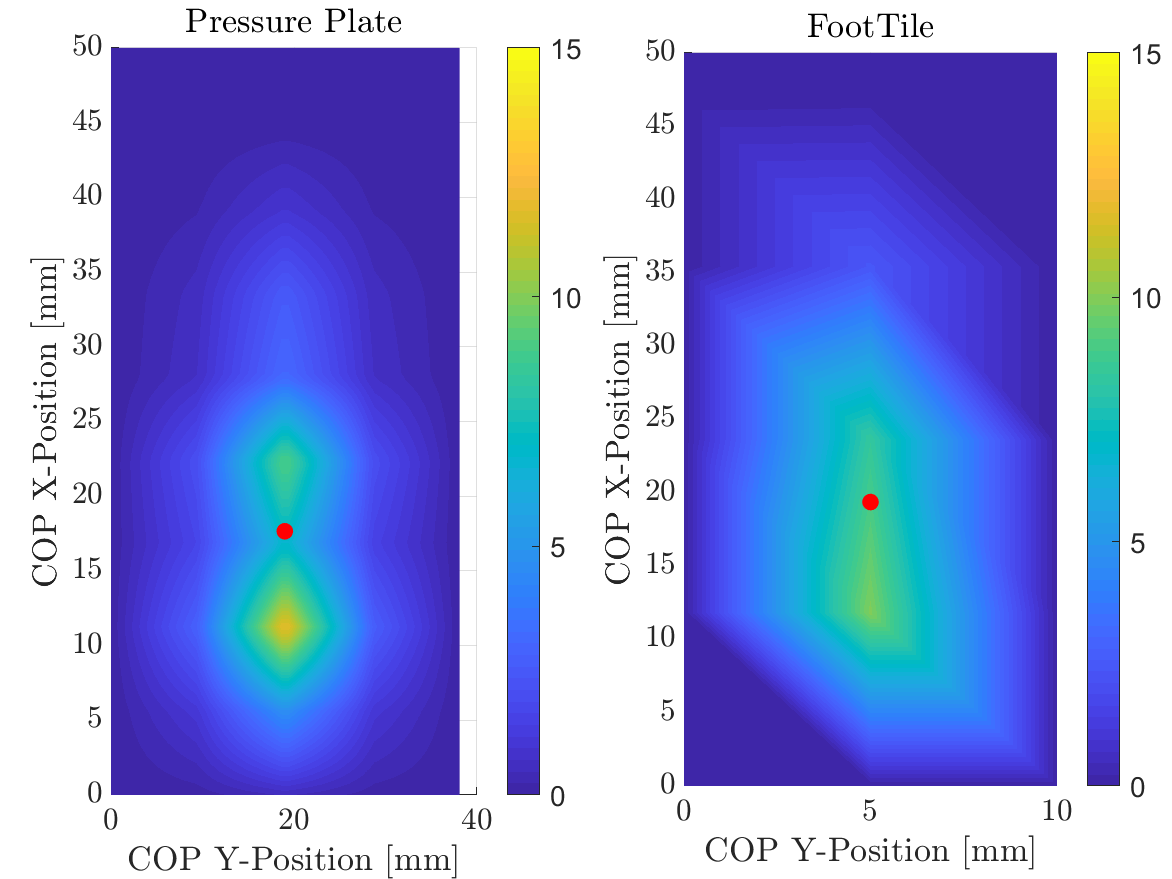
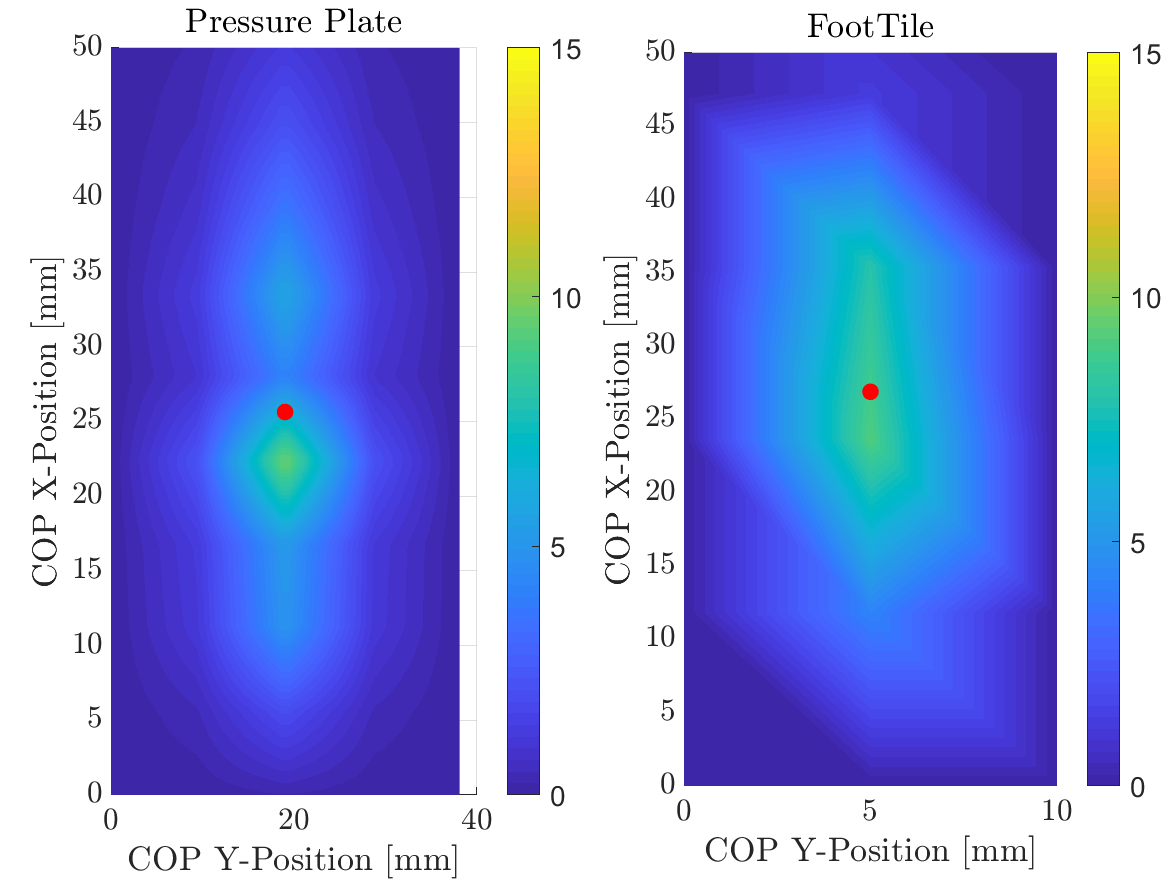
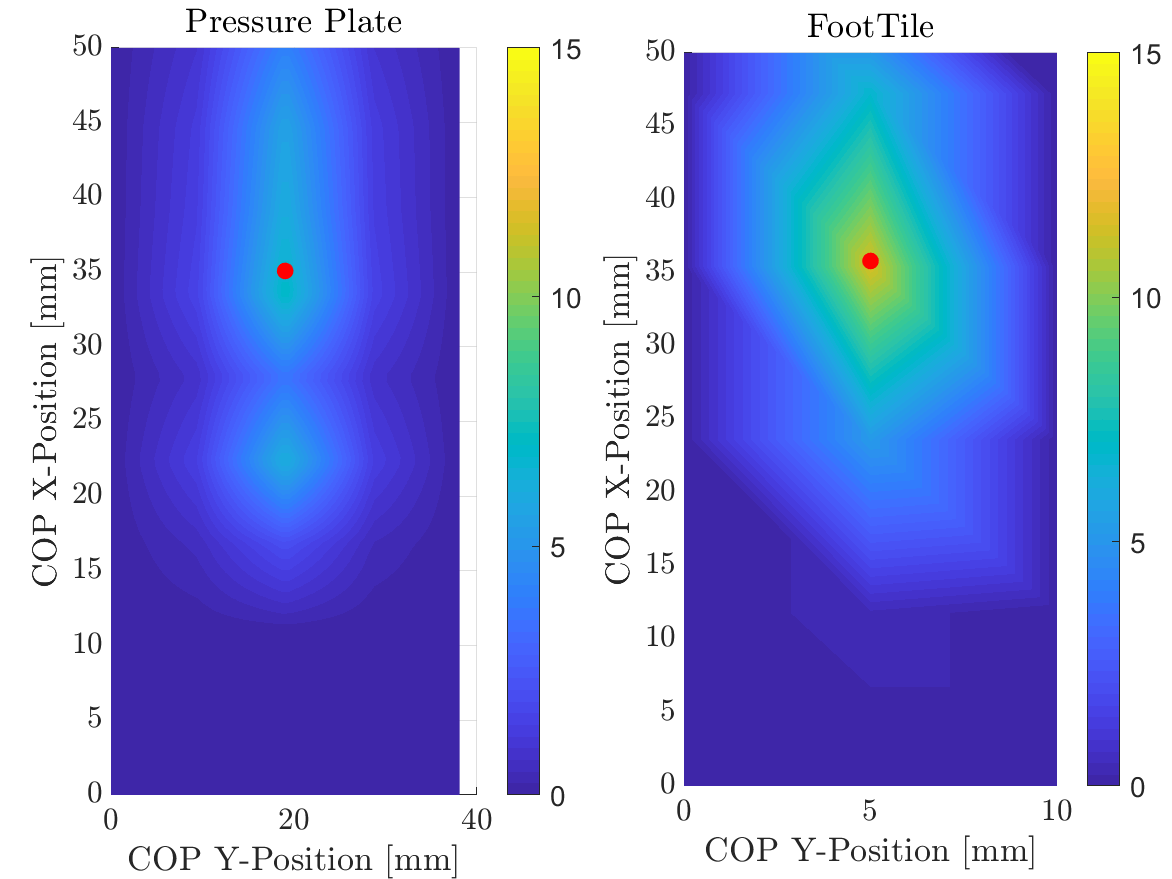
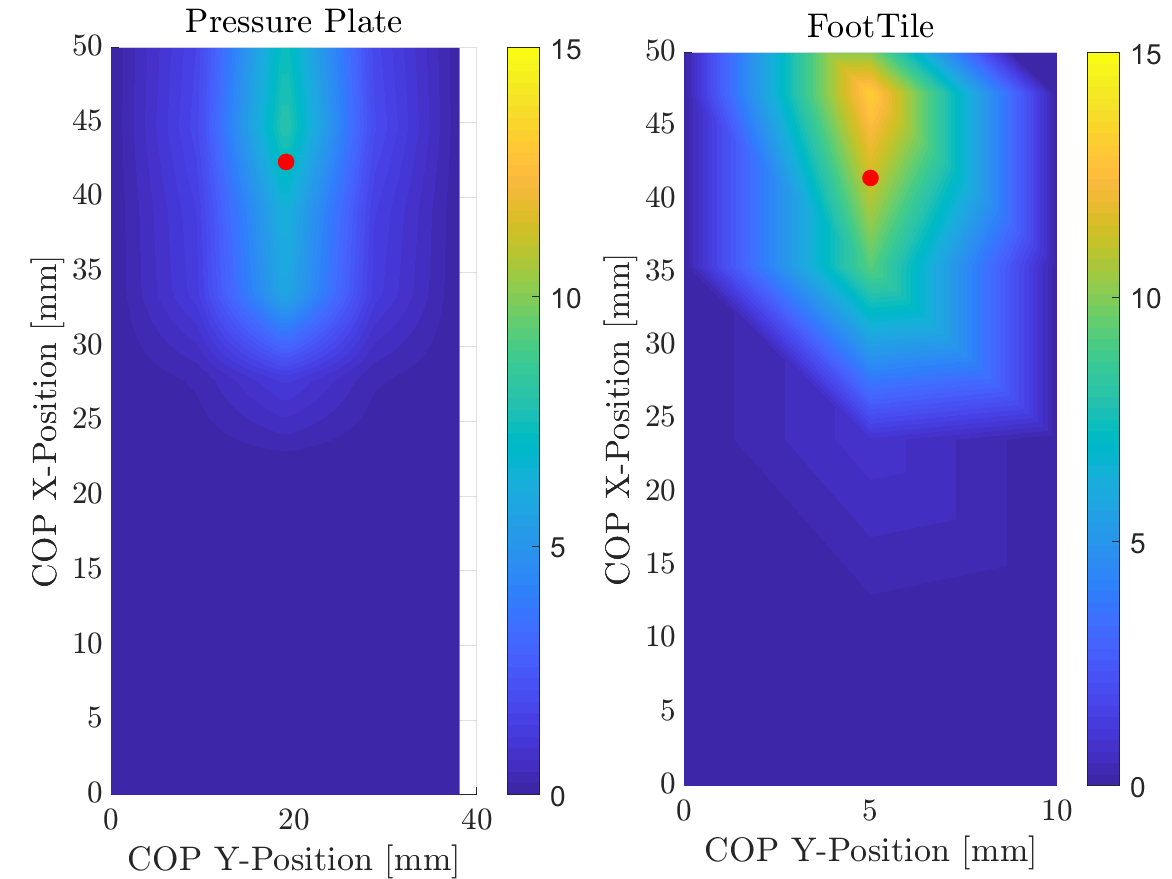
To validate how well the FootTiles can estimate the pressure distribution, we plot the pressure plate data versus the data of a array of FootTiles (Figure 7). The pressure plate data shows an interpolation of all the active sensor cells. The FootTile data shows the raw data from the individual FootTiles. We calculate the active area of the FootTile array by using the video data (Figure 6) to calculate the leg segment angle and find the contact points for all sensors with
| (3) | |||
where and are the y and z contact point coordinates with respect to the leg segment joint, is the segment length, is the segment angle to the vertical, and is the dome radius as shown in Figure 3. The origin is in the rotary joint on the linear guide. To calculate the COP position in the sensor grid, we use a weight function in x and y direction,
| (4) | |||
where and are the Cartesian COP coordinates (Figure 7) in the grid, is the normalized sum of all grid pressure, and index and of the grid are used as the linear weight functions in x and y directions. We construct a matrix with the raw FootTile data in the second column to be able to compare the pressure distributions visually.
Since the FootTile array in this paper is one-dimensional, we only compare the x-component of the COP position (Figure 8). The COP estimation from the FootTile array fits the ground truth from the pressure plate. The error is less than throughout the whole experiment. Only at the end of the experiment, the error gets bigger due to the FootTile lifting from the pressure plate.

III-C Granular and muddy substrate
We compare the reading of the FootTile array with the force plate recorded ground reaction forces during actuated stepping into the poppy seed box (Figure 9). The sensor values are recalculated into forces using Equation 2. The sum of all forces is plotted together with the vertical ground reaction force of the force plate (Figure 10).
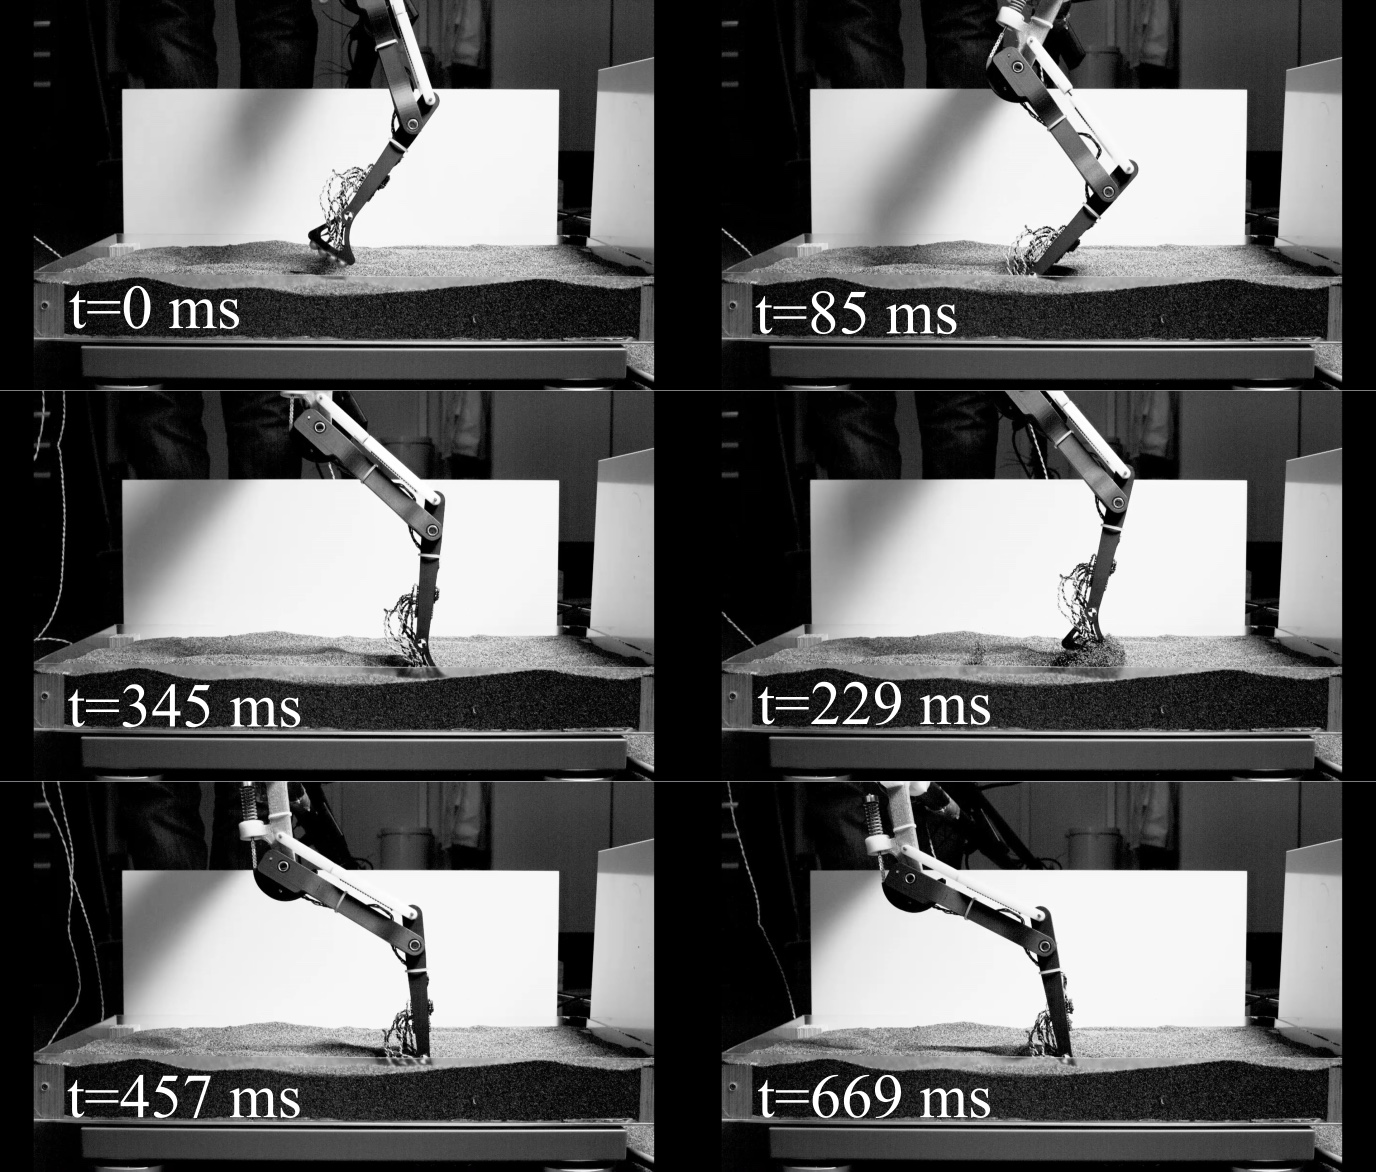


The leg hops three times (visible in supplementary video). During the first hop (Figure 11), a single FootTile measures most of the force. During the second hop, the force is distributed among all sensors. During the third hop, the leg comes to rest in the poppy seed box. During all three hops the GRF estimation is reasonable and follows the ground truth data of the force plate. Around the force peaks, there is a small deviation in between the FootTile and the ground truth. We believe this to be caused by the hyper-elastic material properties of the polyurethane dome as well as the torque influences that we neglect here.
The FootTile array is able to estimate the vertical ground reaction force with a mean error of less than . Discrepancies between the ground truth and the FootTile estimation stem from the one-dimensional sensor array. Since the sensor is modular, it is possible to use multiple lines of sensors shifted by half the sensor length to increase the sensing resolution in one direction. This way, more sensors are engaged at the same time and potential error during the transition from one sensor to the next could be prevented.
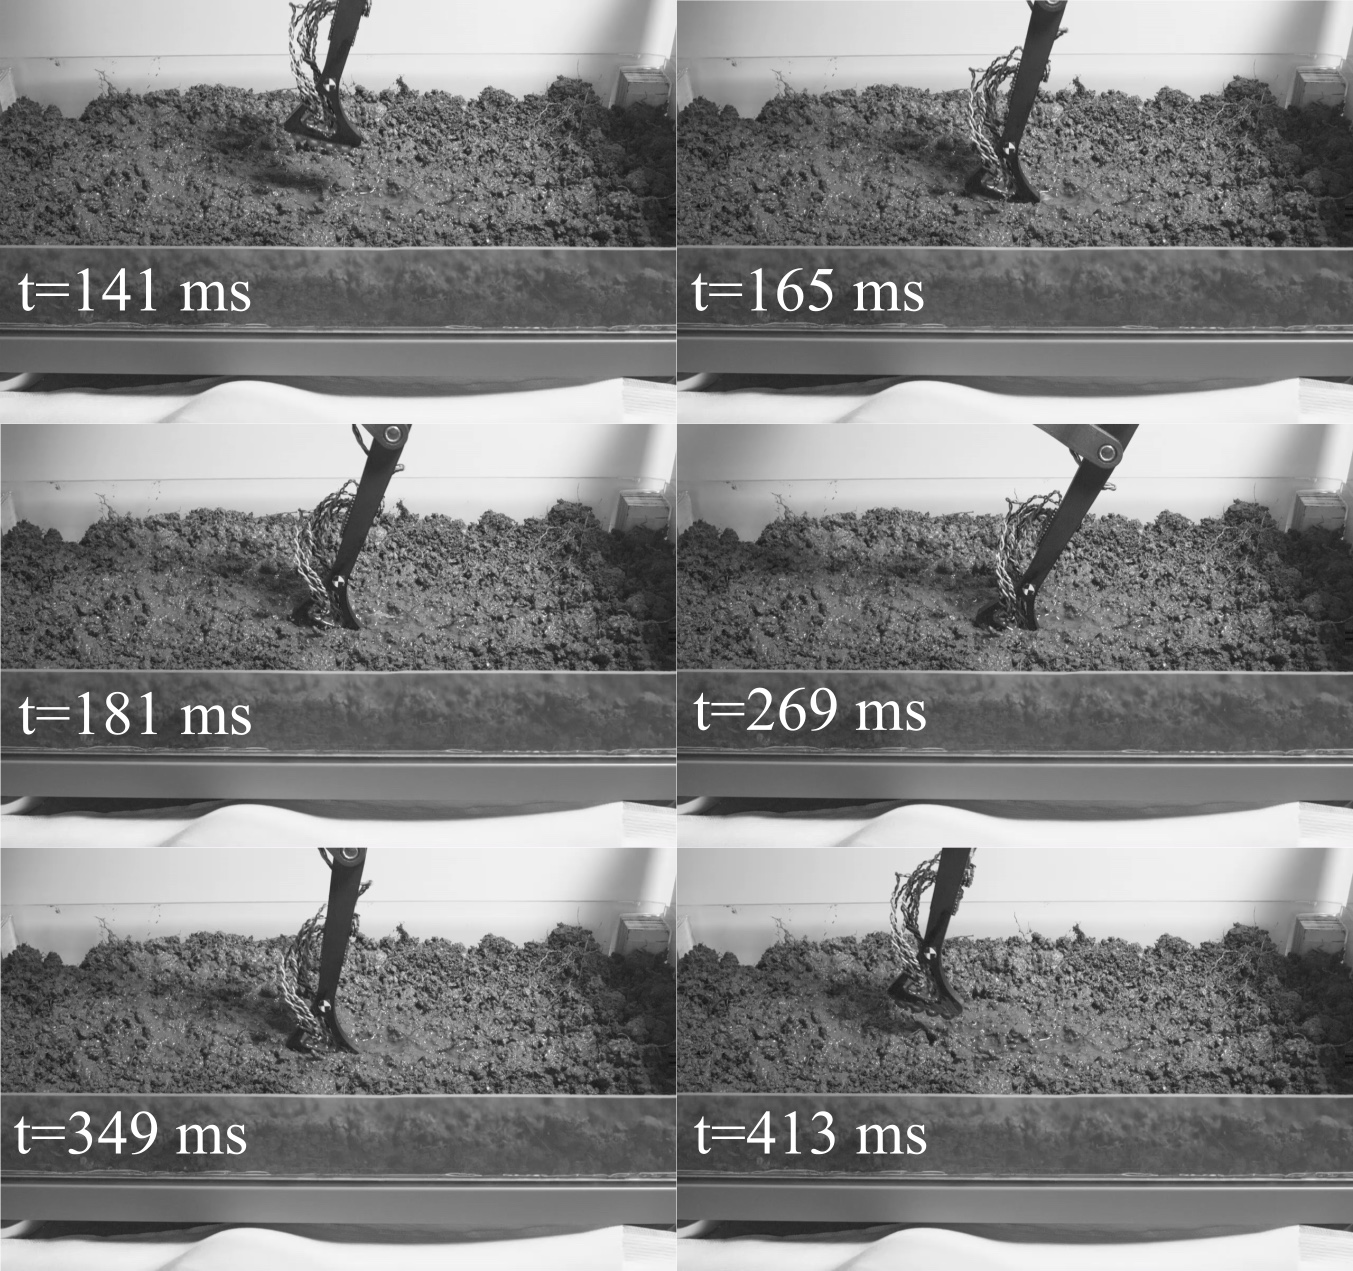
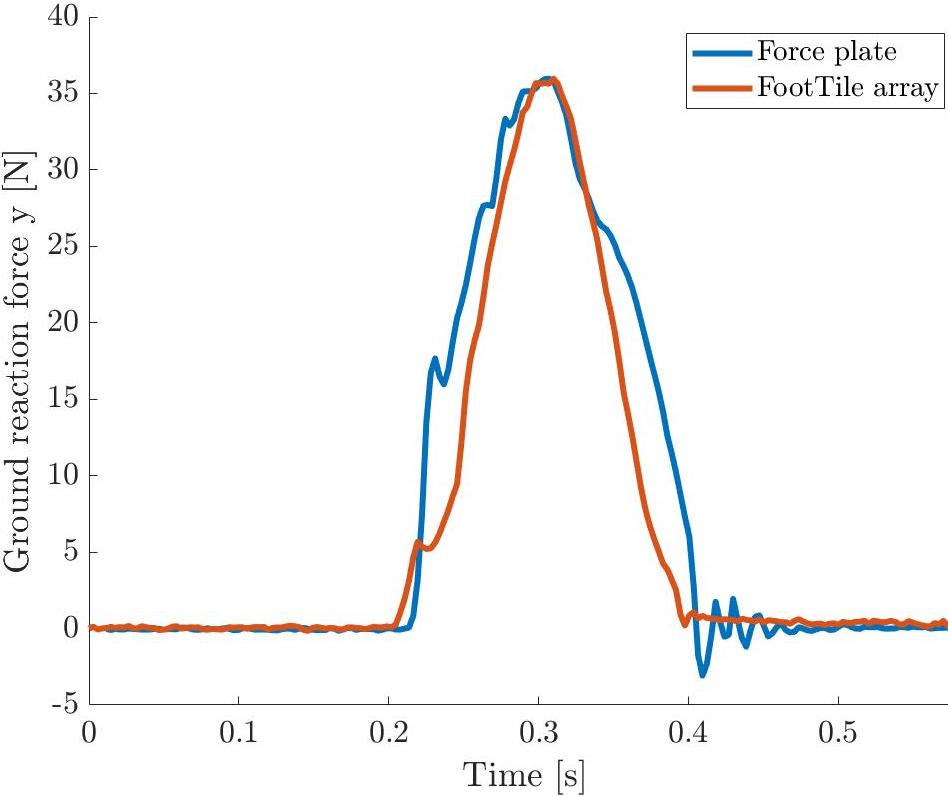
To showcase the ruggedness, the FootTile array is dropped into mud, where the sensor array is fully submerged in liquid mud (Figure 12). The array stays fully functional during the experiment (Figure 13). After use, the FootTile array can be washed in water without compromising the functionality of the sensor (supplementary video). Again, the summation of FootTile GRF estimation follows the ground-truth from the force plate. Small deviations could stem from the highly anisotropic material that includes small stones and roots. This shows the capability of the FootTile to be used outside of a laboratory environment in soft and moist real world terrains.
IV DISCUSSION
In this paper, we present FootTile, a force and pressure sensor that is lightweight, small, portable, rugged, modular, and low cost. The sensor can easily be adapted to any required load case. We adapt the previously presented sensor design in size, measuring range, sampling frequency and reduced complexity. We present experimental data and show that FootTile can be used as an alternative to standard biomechanical tools like force plates and pressure plates. FootTile can accurately estimate ground reaction forces as well as center of pressure position in one device.
If required, the reading frequency could be improved with a dedicated microcontroller (in the boundaries of material responsiveness). With the current development of smaller MEMS pressure sensors for smartphones the sensor could be miniaturized further. In the future, we plan to mount the small-sized FootTile sensor units on robotic feet as well as animal feet to investigate force and pressure distribution in rough terrain and granular media in the dynamic locomotion of robots and running birds.
ACKNOWLEDGMENT
We thank Alborz Aghamaleki Sarvestani for the many fruitful discussions in the lab, Annalena Daniels for the material characterization and initial experiments and the Robotics support group (ZWE) for providing the 3D printed parts.
References
- [1] Roman Kaslin et al. “Towards a Passive Adaptive Planar Foot with Ground Orientation and Contact Force Sensing for Legged Robots” In 2018 IEEE/RSJ International Conference on Intelligent Robots and Systems (IROS) IEEE, 2018 DOI: 10.1109/iros.2018.8593875
- [2] Arvind Ananthanarayanan, Shaohui Foong and Sangbae Kim “A compact two DOF magneto-elastomeric force sensor for a running quadruped” In 2012 IEEE International Conference on Robotics and Automation IEEE, 2012 DOI: 10.1109/icra.2012.6225201
- [3] Marco Hutter et al. “STARLETH: A Compliant Quadruped Robot For Fast, Efficient, and Versatile Locomotion” In Adaptive Mobile Robotics WORLD SCIENTIFIC, 2012, pp. 483–490 DOI: 10.1142/9789814415958˙0062
- [4] Y. Takahashi et al. “High-speed pressure sensor grid for humanoid robot foot” In 2005 IEEE/RSJ International Conference on Intelligent Robots and Systems IEEE, 2005 DOI: 10.1109/iros.2005.1545126
- [5] Kristin Fondahl et al. “An adaptive sensor foot for a bipedal and quadrupedal robot” In 2012 4th IEEE RAS & EMBS International Conference on Biomedical Robotics and Biomechatronics (BioRob) IEEE, 2012 DOI: 10.1109/biorob.2012.6290735
- [6] Max Lungarella and Luc Berthouze “Robot Bouncing: On the Synergy Between Neural and Body-Environment Dynamics” In Embodied Artificial Intelligence Springer Berlin Heidelberg, 2004, pp. 86–97 DOI: 10.1007/978-3-540-27833-7˙6
- [7] X. Wu et al. “Integrated Ground Reaction Force Sensing and Terrain Classification for Small Legged Robots” In IEEE Robotics and Automation Letters 1.2 Institute of ElectricalElectronics Engineers (IEEE), 2016, pp. 1125–1132 DOI: 10.1109/lra.2016.2524073
- [8] Benjamin Leon, Julian J. Rimoli and Claudio V. Leo “Elastomer Encapsulated Pressure Sensor With Engineered Air Cavity for Force Sensing” In IEEE Sensors Journal 19.16 Institute of ElectricalElectronics Engineers (IEEE), 2019, pp. 6628–6643 DOI: 10.1109/jsen.2019.2912515
- [9] Yaroslav Tenzer, Leif P. Jentoft and Robert D. Howe “The Feel of MEMS Barometers: Inexpensive and Easily Customized Tactile Array Sensors” In IEEE Robotics & Automation Magazine 21.3 Institute of ElectricalElectronics Engineers (IEEE), 2014, pp. 89–95 DOI: 10.1109/mra.2014.2310152
- [10] Meng Yee Chuah and Sangbae Kim “Enabling Force Sensing During Ground Locomotion: A Bio-Inspired, Multi-Axis, Composite Force Sensor Using Discrete Pressure Mapping” In IEEE Sensors Journal 14.5 Institute of ElectricalElectronics Engineers (IEEE), 2014, pp. 1693–1703 DOI: 10.1109/jsen.2014.2299805
- [11] Peter R. Cavanagh “A technique for averaging center of pressure paths from a force platform” In Journal of Biomechanics 11.10-12 Elsevier BV, 1978, pp. 487–491 DOI: 10.1016/0021-9290(78)90060-x
- [12] Felix Ruppert and Alexander Badri-Spröwitz “Series Elastic Behavior of Biarticular Muscle-Tendon Structure in a Robotic Leg” In Frontiers in Neurorobotics 13 Frontiers Media SA, 2019 DOI: 10.3389/fnbot.2019.00064
- [13] Chen Li et al. “Systematic study of the performance of small robots on controlled laboratory substrates” In Micro- and Nanotechnology Sensors, Systems, and Applications II SPIE, 2010 DOI: 10.1117/12.851047