date—— date——
Analytical and numerical investigation of the airflow in face masks used for protection against COVID-19 virus – implications for mask design and usage
Abstract
The use of face masks for the general public has been suggested in literature as a means to decrease virus transmission during the global COVID-19 pandemic. However, literature findings indicate that most mask designs do not provide reliable protection. This paper investigates the hypothesis that the impaired protection is mainly due to imperfect fitting of the masks, so that airflow, which contains virus-transporting droplets, can leak through gaps into or out of the mask. The fluid dynamics of face masks are investigated via analytical and numerical computations. The results demonstrate that the flow can be satisfactorily predicted by simplified analytical 1D-flow models, by efficient 2D-flow simulations and by 3D-flow simulations. The present results show that already gap heights larger than can result in the mask not fulfilling FFP2 or FFP3 standards, and for gap heights of ca. most of the airflow and droplets may pass through the gap. The implications of these findings are discussed and improvements to existing mask designs are suggested.
keywords:
Computational Fluid Dynamics, airflow, Filtering Face Piece (FFP) masks, respirators, self-made masks, surgical masks, virus transmission, COVID-19 virus.1 Introduction
During the virus pandemic COVID-19 in 2020, several countries have either enforced or discussed whether wearing face masks should be compulsory in public places (Howard, 2020). Opposing arguments include that masks should be reserved for healthcare workers and that the use of medical masks in the community may create a false sense of security (World Health Organization, 2020). However, the global shortage of masks may not persist indefinitely so that protective masks may become available to the public in future. Arguments in favor of using face masks for the general public include indications by several studies that face masks can reduce viral exposure and infection risks (e.g. van der Sande et al., 2008). Protective effects of masks were demonstrated for various severe infections such as SARS, tuberculosis and pandemic influenza (e.g. Andersen, 2019; Jung et al., 2014, and references therein) and also for dust, oil, or combustion-exhaust particles (Penconek et al., 2012; Ntlailane and Wichmann, 2019).
Virus transmission can occur via direct contact with secretions and via exhaled water droplets (Tellier, 2006). The former risk can be reduced by hygiene practices, such as hand washing and not touching one’s face; furthermore, the virus was found to survive at most several days on surfaces (Kampf et al., 2020). However, reducing the risk of virus transmission via droplets is complicated by the different particle sizes, which roughly range from larger droplets in the order of to smaller aerosol-size droplets in the order of (Tellier, 2006; Fabian et al., 2008). Larger particles () have shorter settling times, i.e. they fall to the ground within seconds up to a few minutes. Smaller particles, however, may float in the air for hours and particles with a diameter essentially do not settle (Tellier, 2006). Thus virus-contaminated droplets may accumulate in closed rooms such as workplaces or public transportation. Although at present it is not known how long the virus remains infectious, results by van Doremalen et al. (2020) indicate that the virus could survive several hours in aerosols-size droplets, and Asadi et al. (2020) conclude from their literature review that even the smallest aerosol-size droplets might be able to transmit the virus during face-to-face conversation with an asymptomatic infected individual.
Fabian et al. (2008) found that humans exhale droplets per liter of air, of which had diameters between and , and were smaller than . That most exhaled particles have diameters below has been confirmed by other authors (e.g. Fairchild and Stampfer, 1987; Papineni and Rosenthal, 1997; Edwards et al., 2004). Thus this work focuses on particles smaller than .
To reduce the risk of inhaling such droplets, self-made-masks, surgical masks and so-called respirators, such as Filtering Face Piece (FFP) masks, are under discussion (cf. Steinle et al., 2018).
The performance of face masks is typically assessed via experiments that determine the filtration efficiency (FE) and the total inward leakage (TIL). The filtration efficiency is the percentage of particles that do not pass through the filter if the mask is tightly fitted. For example, Mueller et al. (2018) reported average filtration efficiencies of handkerchiefs (), T-shirts (), surgical masks () and FFP3-masks (, corresponding to the mask in Fig. 20). Thus, whereas typical household fabrics may not provide sufficient protection, industrial materials from which FFP3-masks are made typically have satisfactory filtering qualities.
However, the filtration efficiency of the filter material is not sufficient to assess the protection offered by a mask; rather, the protection can be measured by the total inward leakage, which is the percentage of particles that enter the mask through both the filter and the face-seal leakage. Alternatively, the protection factor (PF) can be used, for which holds (van der Sande et al., 2008).
Milton et al. (2013) found that surgical masks reduced the number of influenza virus droplet that were emitted by ca. compared to test persons not wearing masks if the droplets were larger than , but for smaller droplets the surgical masks provided no substantial protection.
Therefore, in the following the focus will be only on FFP-masks, which are typically more effective than surgical or home-made masks (van der Sande et al., 2008). FFP-masks can be subdivided in classes FFP1 to FFP3 with filtration efficiencies of (FFP1), (FFP2) and (FFP3), respectively, and leakage rates of less than (FFP1), (FFP2) and (FFP3) (cf. Seidler et al., 2004; Lee et al., 2016; European norm EN 149:2001+A1:2009). Thus technically it would appear that FFP3-masks provide satisfactory protection, and indeed they are widely used in hospitals. As outlined in the following, though, literature suggests that many FFP3-masks do not provide reliable protection, especially if not properly fitted.
Steinle et al. (2018) investigated FFP2-masks with median filtration efficiency of and found that the total inward leakage varied between . Cherrie et al. (2018), Lee et al. (2016) and Jung (2014) reported similar values and argued that, regardless of the quality of the filter materials, FFP-type masks may not provide reliable protection if the mask does not fit tightly. Lee et al. (2017) reported face-seal leakage surrounding the chin and the cheeks for FFP-masks, because the masks did not fit all wearers. Furthermore, they observed that the percentage of particles that penetrated through face-seal leaks increased for low air intake and for particle diameters below . Children were found to be less protected by FFP-type masks, which was attributed to inferior fitting of the masks on smaller faces (van der Sande et al., 2008).
Moreover, filtration efficiencies for masks may be different depending on the particles used. Penconek et al. (2013) found that commercially available FFP2- and FFP3-masks did not provide sufficient protection against diesel exhaust fumes. Filtration efficiency is typically tested with NaCl particles or paraffin oil droplets (Penconek et al., 2013), but water droplets appear to be rarely used.
Performing activities such as exercising, nodding or shaking was found to affect total inward leakage, although the total inward leakage varied mostly by factor or less (van der Sande et al., 2008).
However, how tightly does a mask have to fit and how large may gaps between mask and face be before the mask ceases to provide the promised protection? The aim of the present work is to answer these questions via analytical and numerical flow computations for a generic mask. From these findings, recommendations for the design of more effective industrial and self-made masks are derived, with focus on re-usability of the masks.
2 Theory
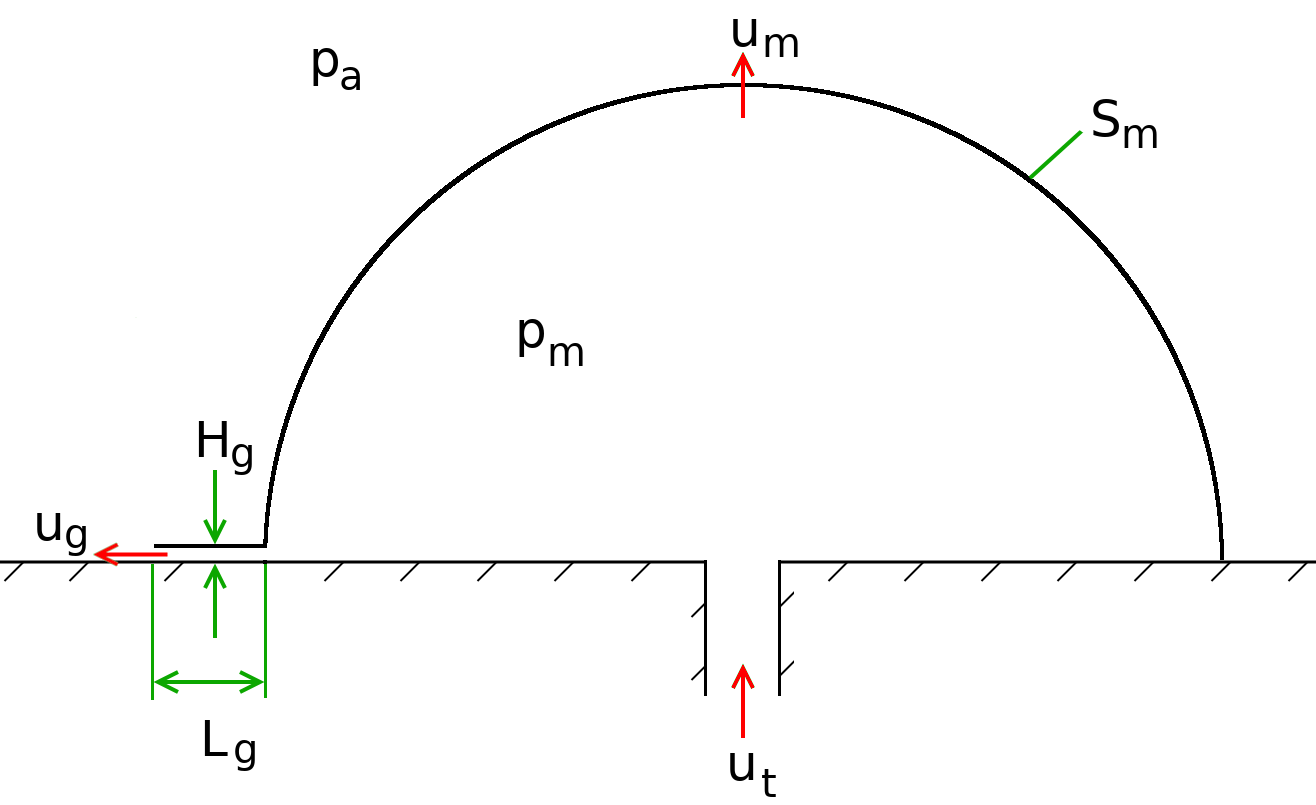
To investigate the airflow through face masks, the problem can be reduced to one-dimensional (1D) flow for a simplified geometry (cf. Fig. 1) by the following assumptions. The fluid is considered as incompressible because the Mach number is well below (cf. Ferziger et al., 2020). The pressure within the mask is assumed to be uniform, so for all directions ; thus the surface area of the mask filter-piece influences the flow through the filter, but the geometrical shape of the mask has a negligible influence. Therefore, the mask geometry can be simplified to a half-sphere e.g. with radius and surface area . The mask has a uniform gap along a width of its perimeter and otherwise fits tightly to the face. The mask rim has length with constant gap height . Face and nose are approximated as a plane pierced by a channel with cross-sectional area (cf. Fig. 1). No flow occurs through the face, the nose or the boundaries of the gap.
When inhaling or exhaling, the total (volumetric) flow rate through the nose is with average velocity and cross-sectional area . From mass conservation follows
| (1) |
with flow rate through the gap , average flow velocity within the gap, gap cross-sectional area , flow rate through the mask filter , average flow velocity through the surface of the masks filter-piece.
Within the gap, the flow is assumed to be fully-developed laminar Pouseuille flow, which is justified because the average gap velocities within the framework of this analysis were below the critical velocity
| (2) |
with hydraulic diameter , gap heights , kinematic viscosity for air at room temperature and critical Reynolds number for plane channel flow (cf. Schlichting and Gersten, 2017, p. 104). Gap Reynolds numbers in this work were within .
Pressure losses occur in the flow at the gap inlet, within the gap, at the gap outlet, and at the mask filter-piece. The combined pressure loss at gap inlet and gap outlet can be expressed as
| (3) |
with loss coefficient , density of air , average gap velocity , average flow velocity through the nose and its absolute value ; the term is included to obtain the correct sign for both inhaling and exhaling.
The loss coefficients and were taken from Idelchik (1986, p. 92 and p. 128) as and .
Assuming a fully-developed laminar flow in a plane-channel, the pressure loss within the gap is
| (4) |
with dynamic viscosity of air , gap length , gap height and average gap velocity .
The pressure loss due to the flow through the mask surface is approximately
| (5) |
with viscous porous resistance , which is a property of the mask filter material, density of air and velocity of the airflow through the mask, which can be computed from the flow rate through the mask.
It is expected that the assumption, that the pressure loss depends linearly on the velocity, can be made with good approximation for these flow rates. Unfortunately, only qualitative curves were available to the authors to validate this statement. However, Jung et al. (2014) present experimental data for pressure drop for flow rate and for FFP-type masks, and even when linearly scaling the pressure drop for via gives only differences to the actually measured value of to . This is acceptable for the present purposes, because the results in Sect. 4 show that changing by even changed the ratio , i.e. gap flow rate divided by total flow rate, by ca. or less, i.e. the flow did not change qualitatively.
The pressure drop through the gap must be equal to the pressure drop through the mask filter-piece
| (6) |
and because the total flow rate must equal the sum of the flow rates through mask and gap (cf. Eq. (1))
| (7) |
and thus the flow velocity through the filter can be expressed as
| (8) |
| (9) | |||
The solution for gap velocity can be determined as follows:
| (10) |
| (11) |
| (12) |
| (13) |
| (14) |
The average flow velocity through the mask , the pressure drop and the flow rates through the mask filter and through the gap can then be computed as
| (15) |
| (16) |
| (17) |
This 1D-model allows the computation of the gap flow rate as a function of gap width , gap height and gap length .
3 Simulation Setup
Except for the largest particles, most droplets exhaled during breathing are in the range of typical tracer particles used in optical flow measurement techniques. For example, typical droplet diameters used in gas flows lie within to (cf. Tropea and Yarin, 2007). Thus, the droplets of interest in this work can be assumed to follow the airflow and need not be resolved in the simulations.
In order to validate the analytical model from Sect. 2, simulations are performed for using a 2D-geometry and a commercial computational fluid dynamics (CFD) software. The governing equations for the single-phase flow simulations are the equation for mass conservation and the three equations for momentum conservation, collectively called the Navier-Stokes equations:
| (18) |
| (19) |
with volume of control volume (CV) bounded by the closed surface , fluid velocity vector u with the Cartesian components , unit vector n normal to and pointing outwards, time , pressure , fluid density , components of the viscous stress tensor and unit vector ij in direction . The fluid, gaseous air, is considered incompressible. Selected flow simulations were repeated with compressible air following the ideal gas law and it was verified that compressibility effects were negligible for the investigated cases.
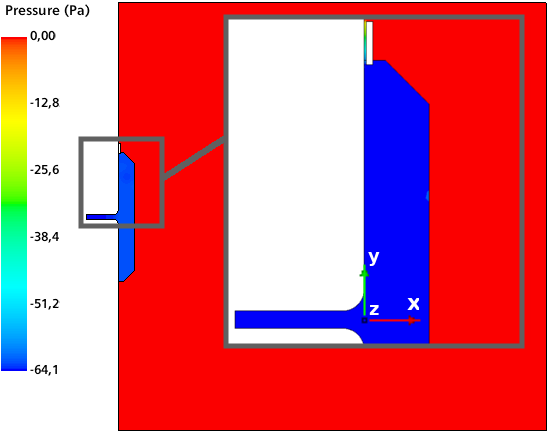
The computational domain is box-shaped with dimensions , with an extended channel that represents the nose as illustrated in Fig. 2. The coordinate system has its origin in the center of the nose opening at the same level as the face, as shown in Fig. 2, which is represented as a flat wall. As Fig. 2 demonstrates, the pressure within the mask is approximately uniform, therefore only the surface area , not the geometrical shape of the mask, influences the results, so the mask was represented by a simplified polygonal shape. The mask surface is the same as in Sect. 2, , and it is modeled as a porous interface with pressure drop according to Eq. (5), with viscous porous resistance unless stated otherwise. The top boundary () is set up as pressure outlet, with atmospheric pressure prescribed. Symmetry boundary conditions are prescribed at boundaries , , and . At the outward end surface of the nose-channel, the velocity is prescribed so that . All other boundaries are impermeable, no-slip wall boundaries.
The simulations were performed quasi-two-dimensional (2D), i.e. the grid is only 1 cell thick in -direction with symmetry conditions applied at front and back planes. With correctly prescribed total flow rate , nose cross-section area , mask filter surface and gap cross-section area , equivalent results to the theoretical formulation from Sect. 2 can be expected. As all gradients in -direction are zero, the width of the domain can be chosen arbitrarily and the results can be scaled to the desired gap width and mask filter surface . The basic configuration corresponds to a mask which fits tightly except over a width along the perimeter.
To simulate the flow in a geometry with a shorter gap width, e.g. , the simulation could be performed in three dimensions (3D) with a partially closed gap, which would increase the number of cells and the computational effort. In the following, a more efficient approach was selected so that the flow problem remains two-dimensional and the computational effort remains low. Consider that, if the gap were closed (), the flow rate through the mask filter , so the average velocity through the mask filter is . If the gap width is halved, the domain size in -direction and thus and are halved as well. To maintain the same flow rate , and thus also are doubled. To avoid that Eq. (5) leads to twice the desired pressure drop along the mask, the larger mask filter is modeled by halving . Thus the same flow rate and pressure loss occur through the mask as previously. So if the reference gap width is as in the present case , then selecting provides the desired solution for simulations with different gap widths.
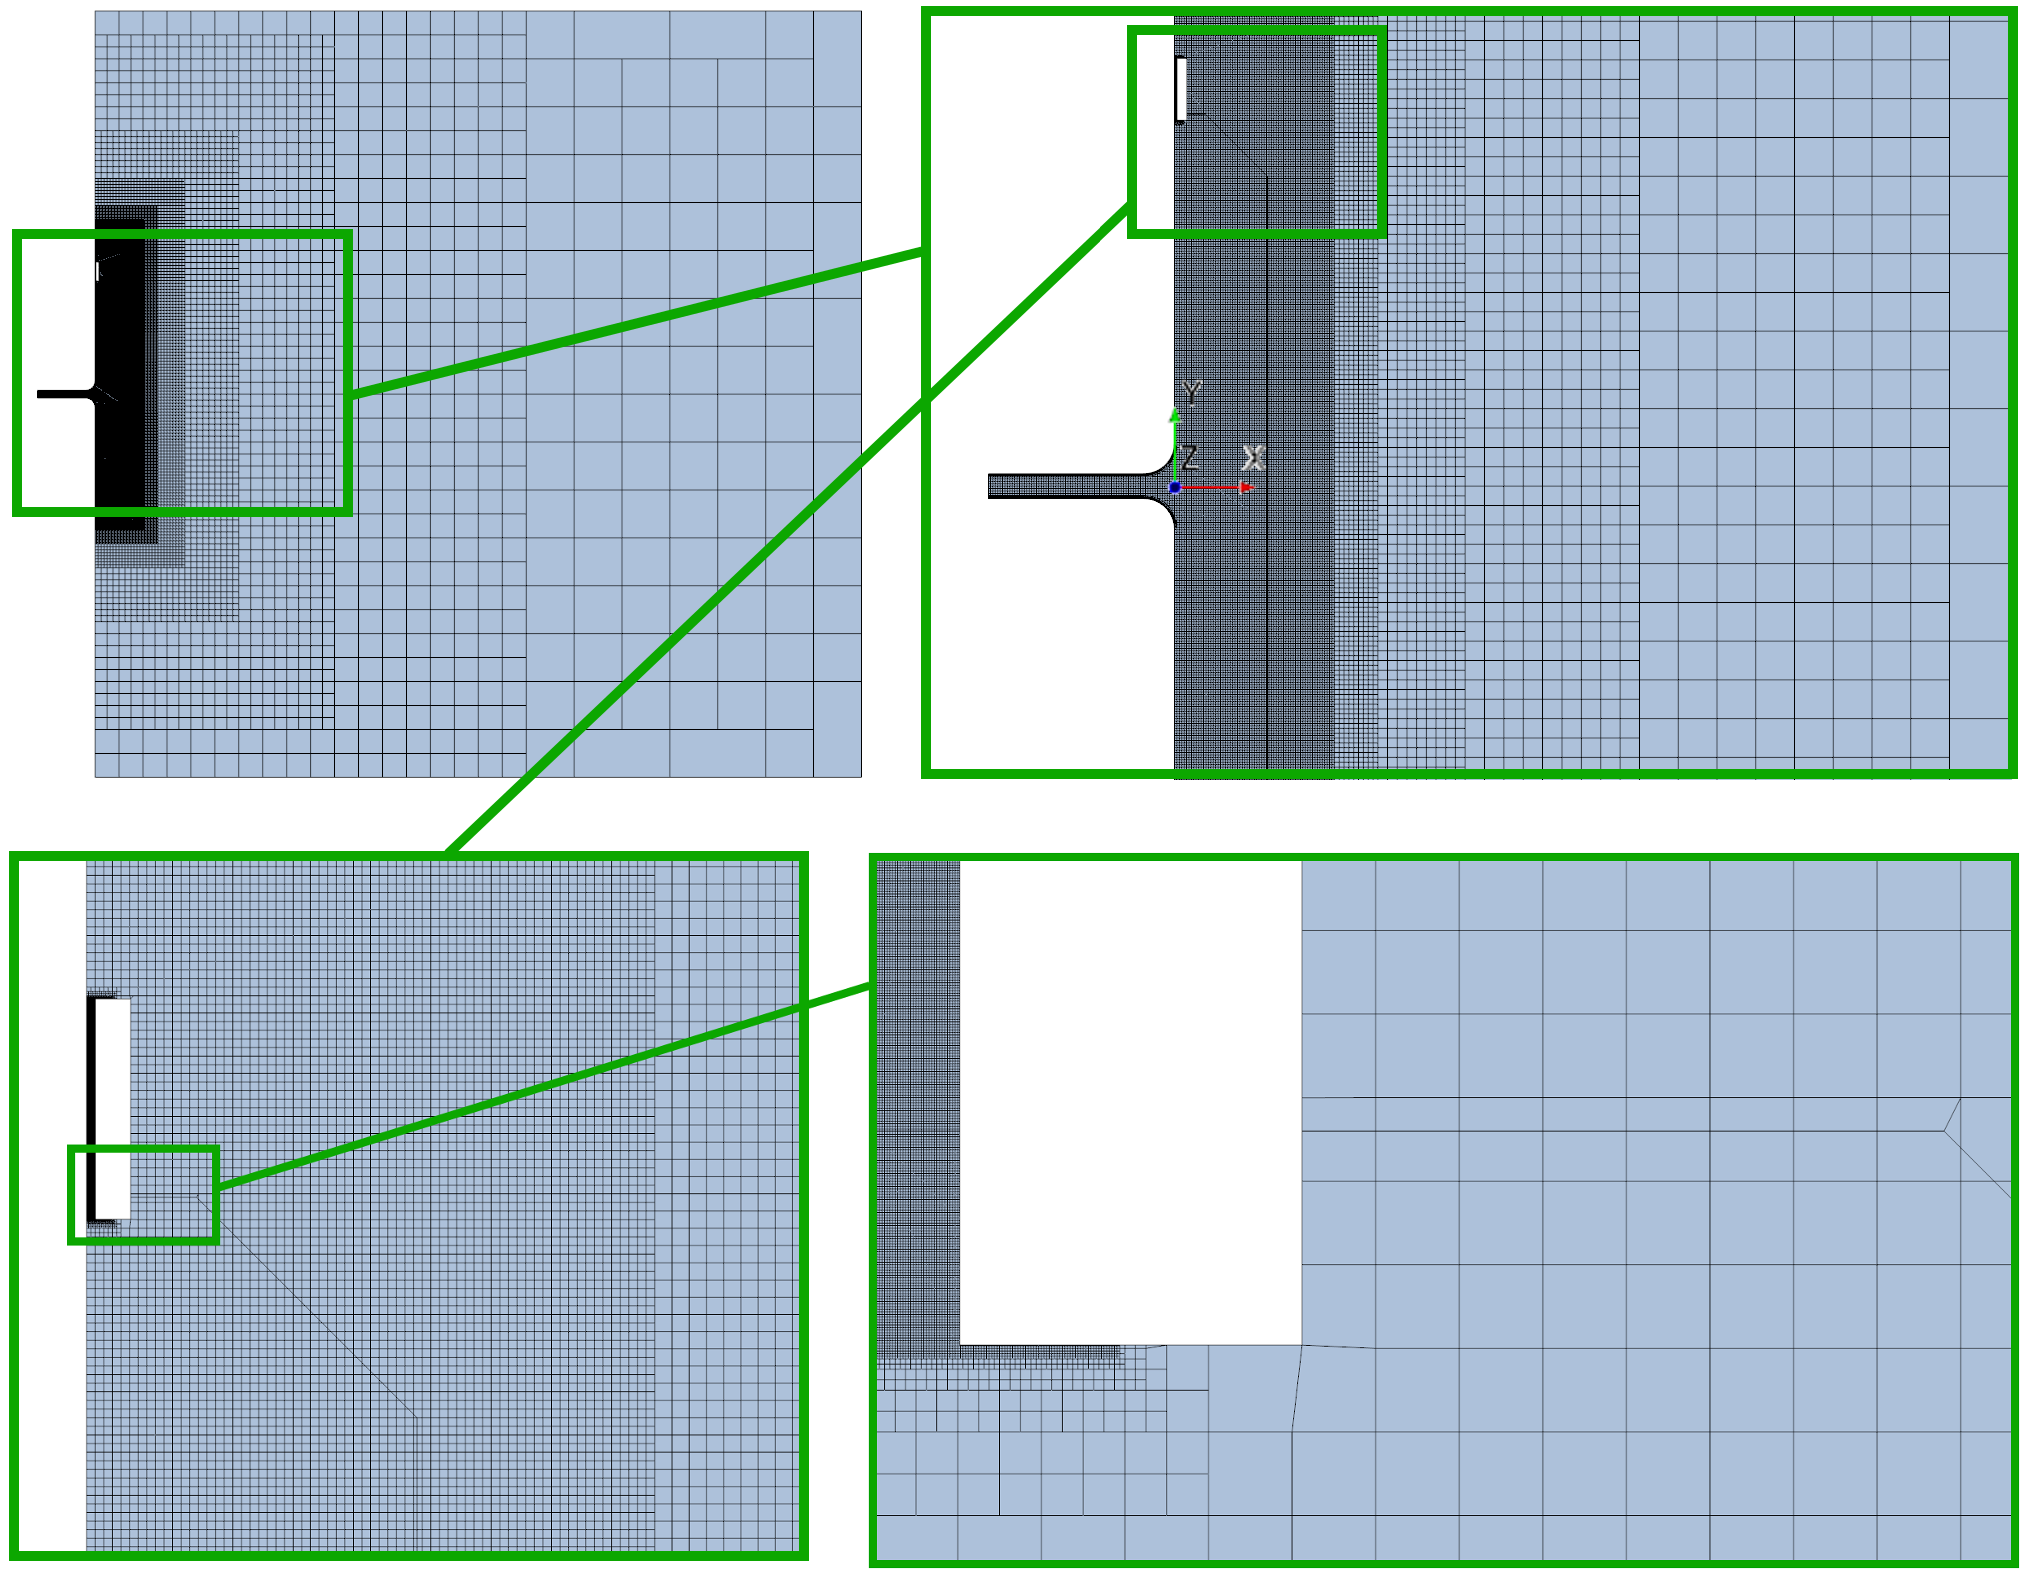
The solution domain was discretized with a rectilinear grid with local mesh refinement as shown in Fig. 3, so that the gap was resolved with at least cells per gap height . For the grid dependence study, the grids were refined uniformly by halving the cells in - and -directions. Depending on the gap size, the grids consisted of ca. to cells.
All simulations were performed using the commercial flow solver Simcenter STAR-CCM+ (version 15.02.007-R8) by Siemens. The solver is based on the finite volume method (FVM) and the implicit unsteady segregated solver was used. All approximations were of second order. The under-relaxation factors were for velocities and for pressure. The initial conditions were pressure , velocity and density . The time step was and outer iterations were performed per time step. The total simulated time was selected , at which point a converged, quasi-steady solution was obtained in all simulations. Detailed information on finite-volume-based flow simulations can be found e.g. in Ferziger et al. (2020).
Simulations were performed for inhaling of air and compared to theoretical predictions from Sect. 2 for different gap height , gap width and total flow rate .
To verify that the conclusions drawn from the 2D-flow simulations are applicable to realistic 3D-flow through face masks, also 3D-flow simulations were performed for a few representative configurations.
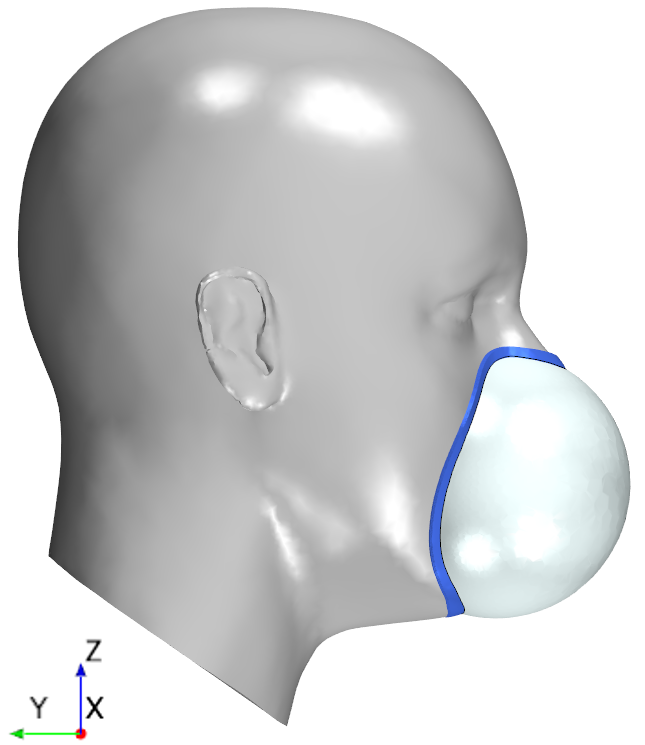
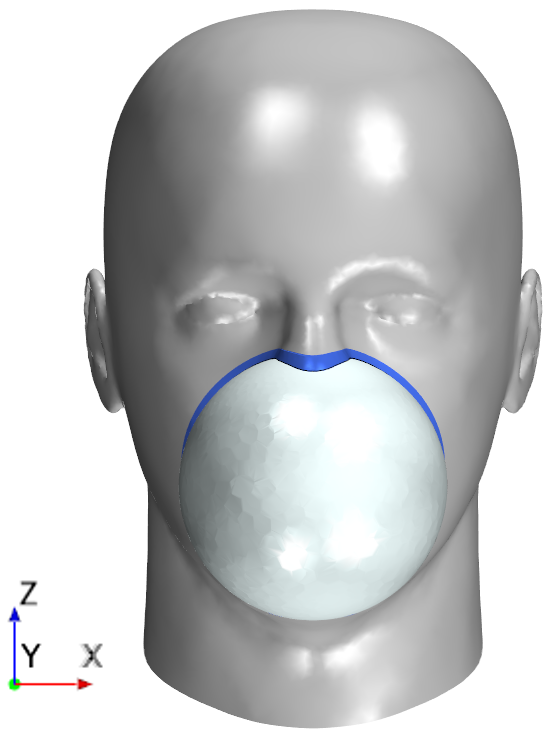
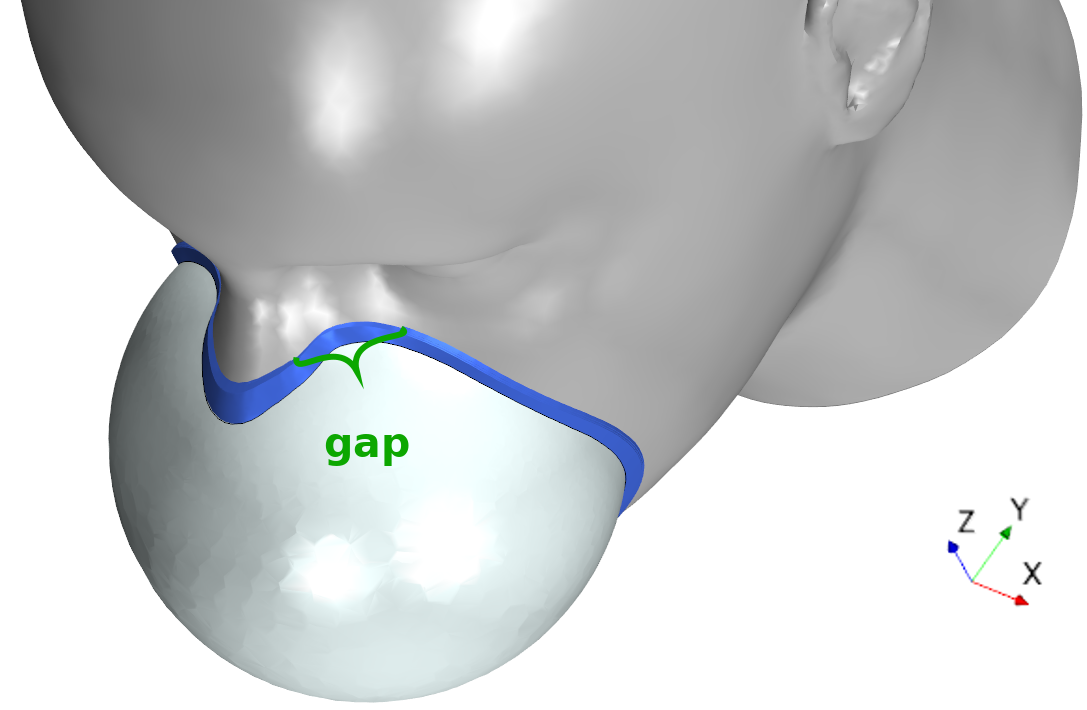
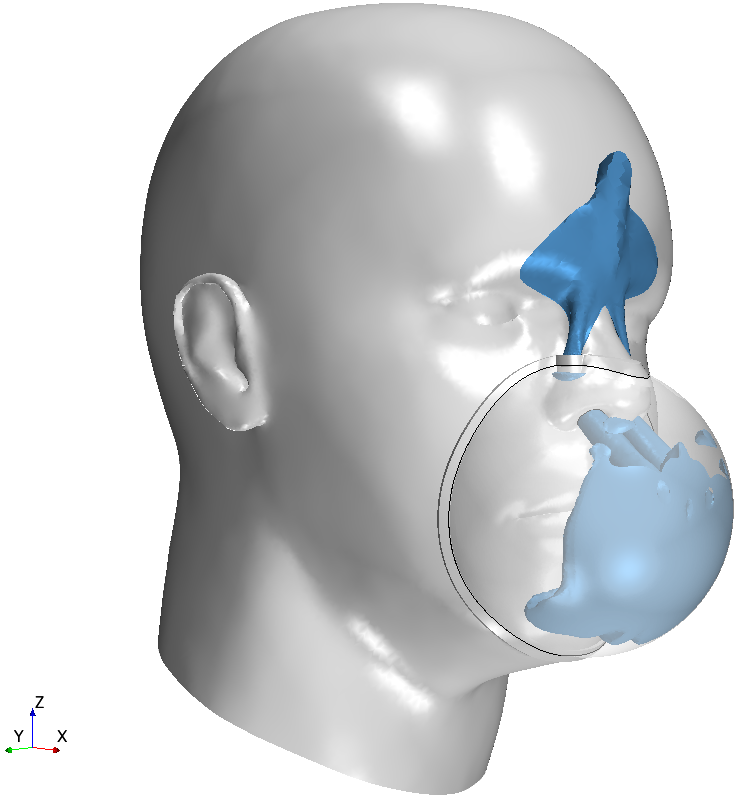
The simulation setup was the same as in the 2D-flow simulations, with the following exceptions: Head and mask had realistic geometries as shown in Fig. 4, and the air flows through the nostrils. The human head111Human Head 1/6 Scale by TheNewBlood, Creative Commons - Attribution - Non-Commercial license, Link: http://www.thingiverse.com/thing:2859425, license link: http://creativecommons.org/licenses/by-nc/3.0/ had a vertical distance between top of head and chin of . The face mask had a spherical shape with radius and filter surface area . The mask had a seal with length and there was a gap between seal and face of average height , which extended along a width of below the left eye (cf. Fig. 4).
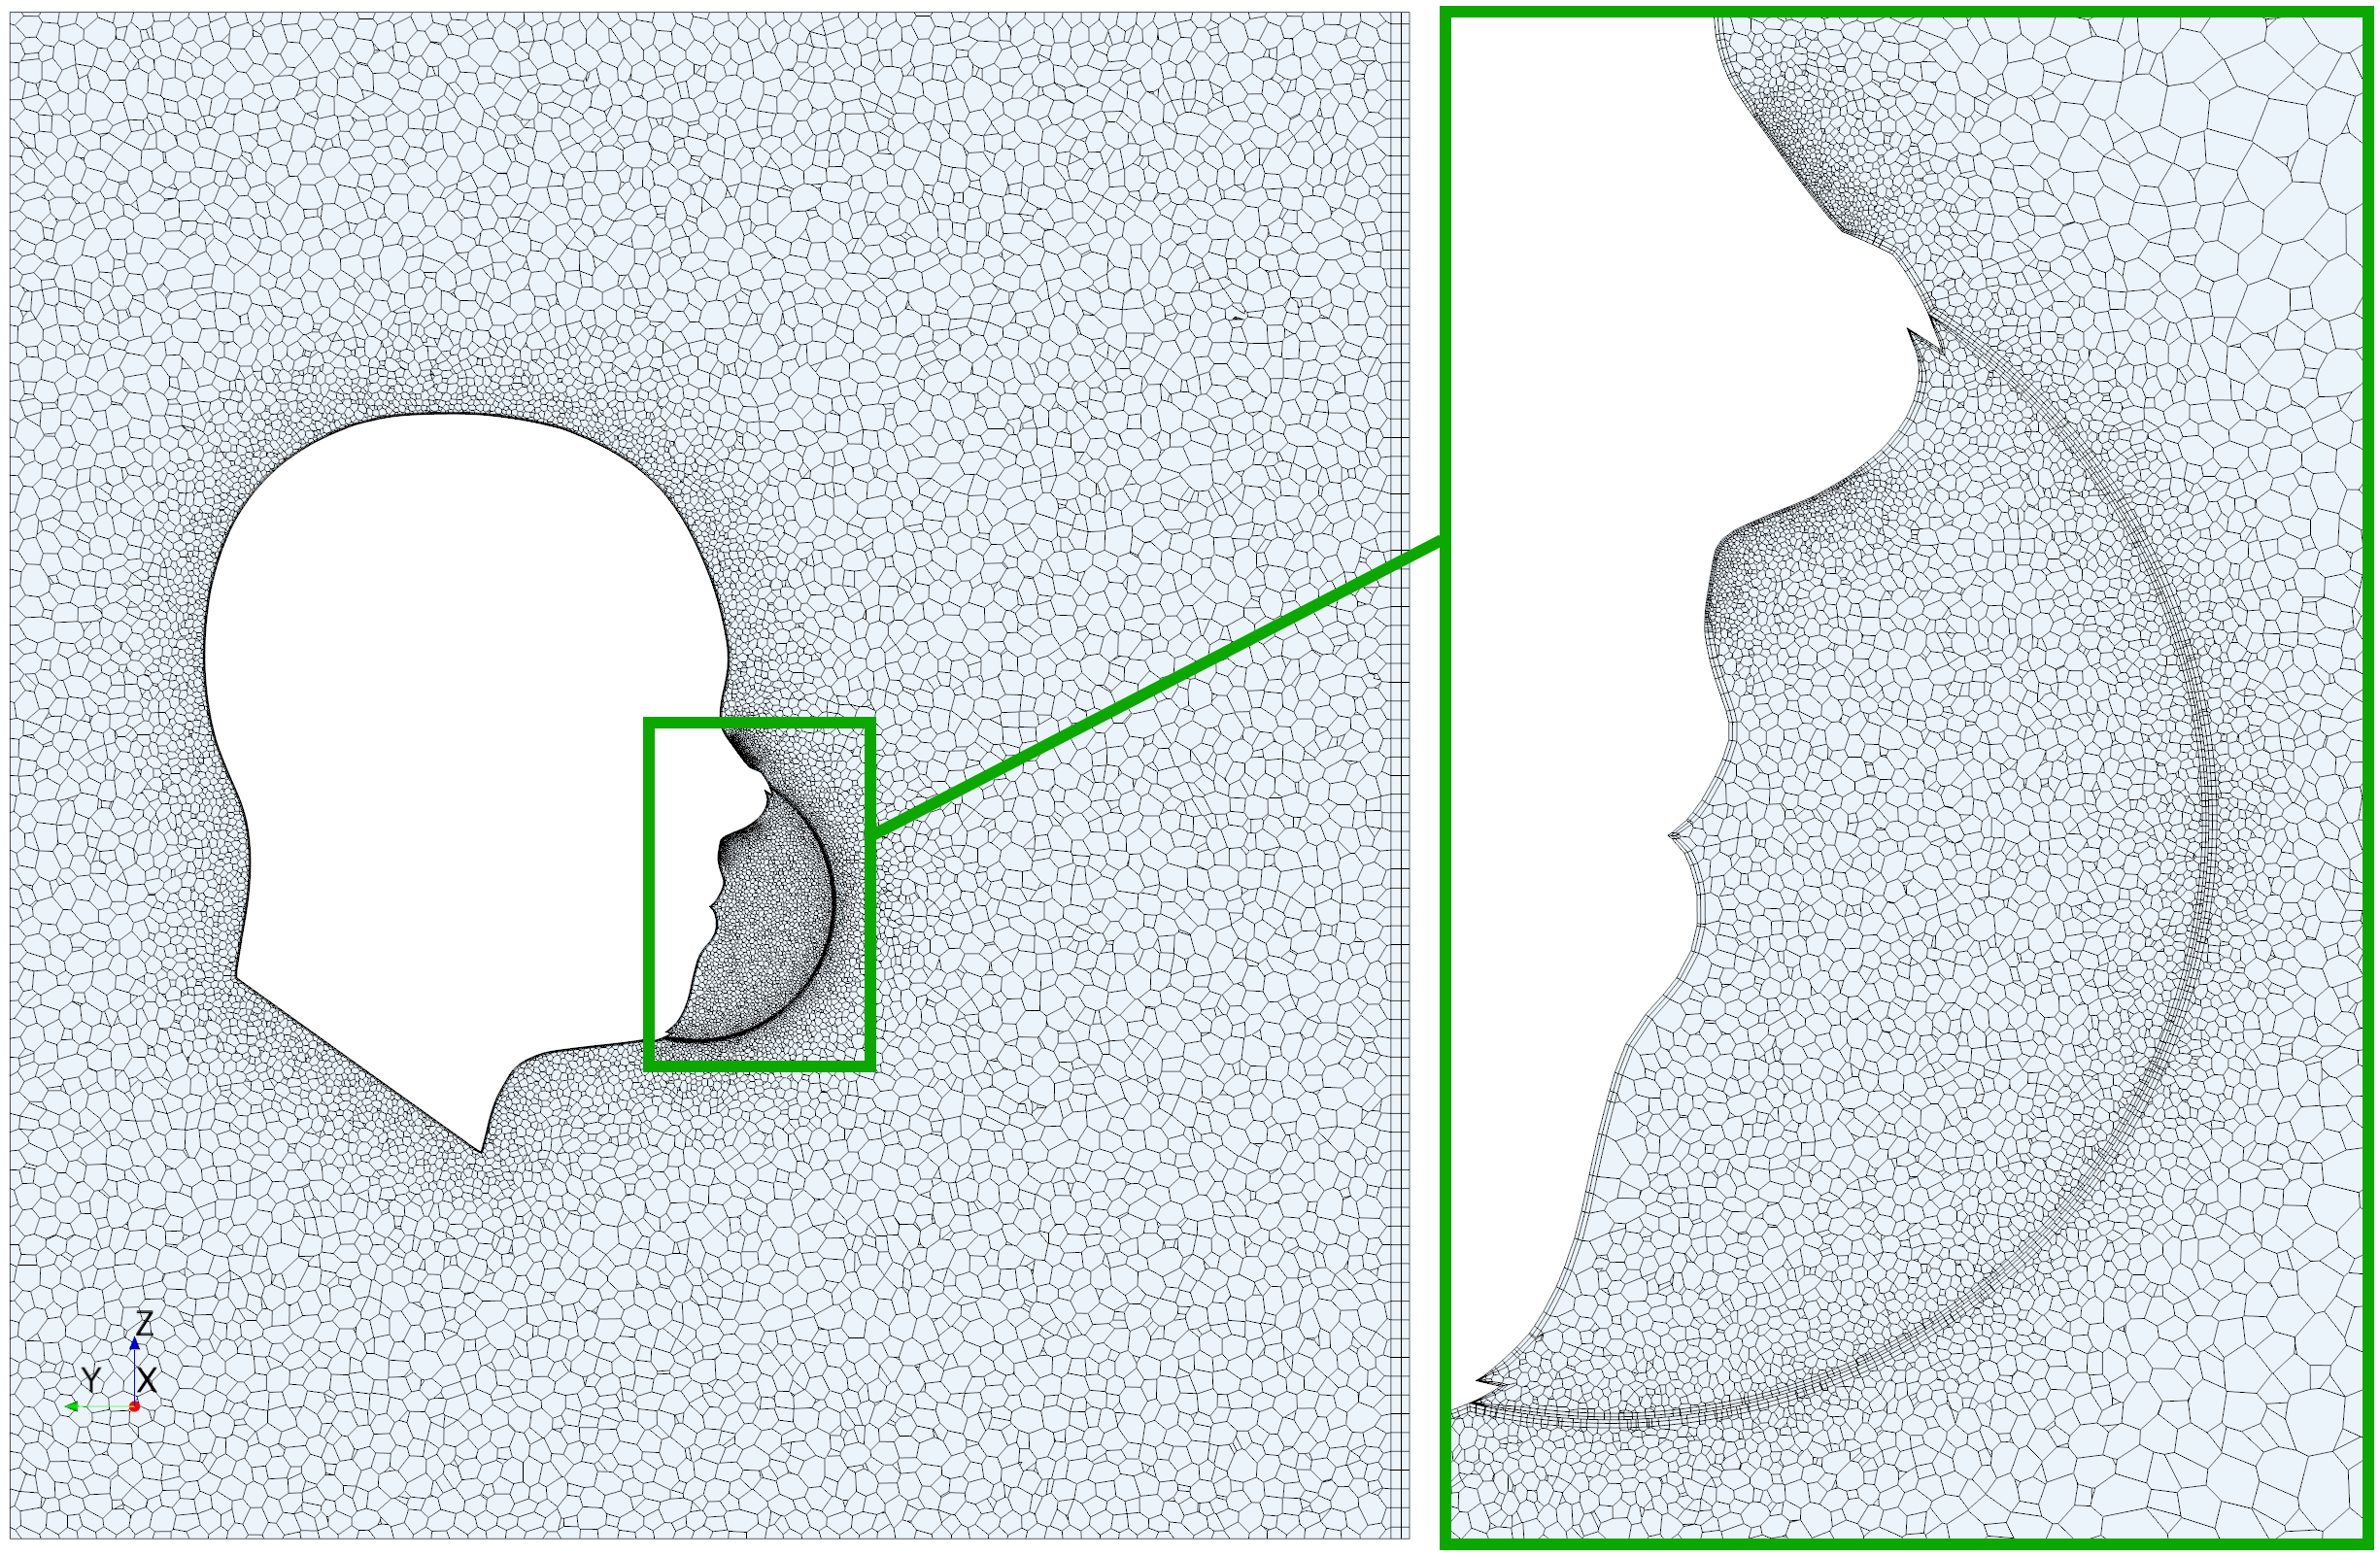
The solution domain was a box with dimensions , , . The 3D-grid consisted of polyhedral cells with prism cells near the wall boundaries, so that there were more than cells per gap height. The boundary opposite to the mask was the pressure outlet and all other boundaries except the mask surface and the nostrils were impermeable no-slip walls. The computational grid consisted of ca. million cells.
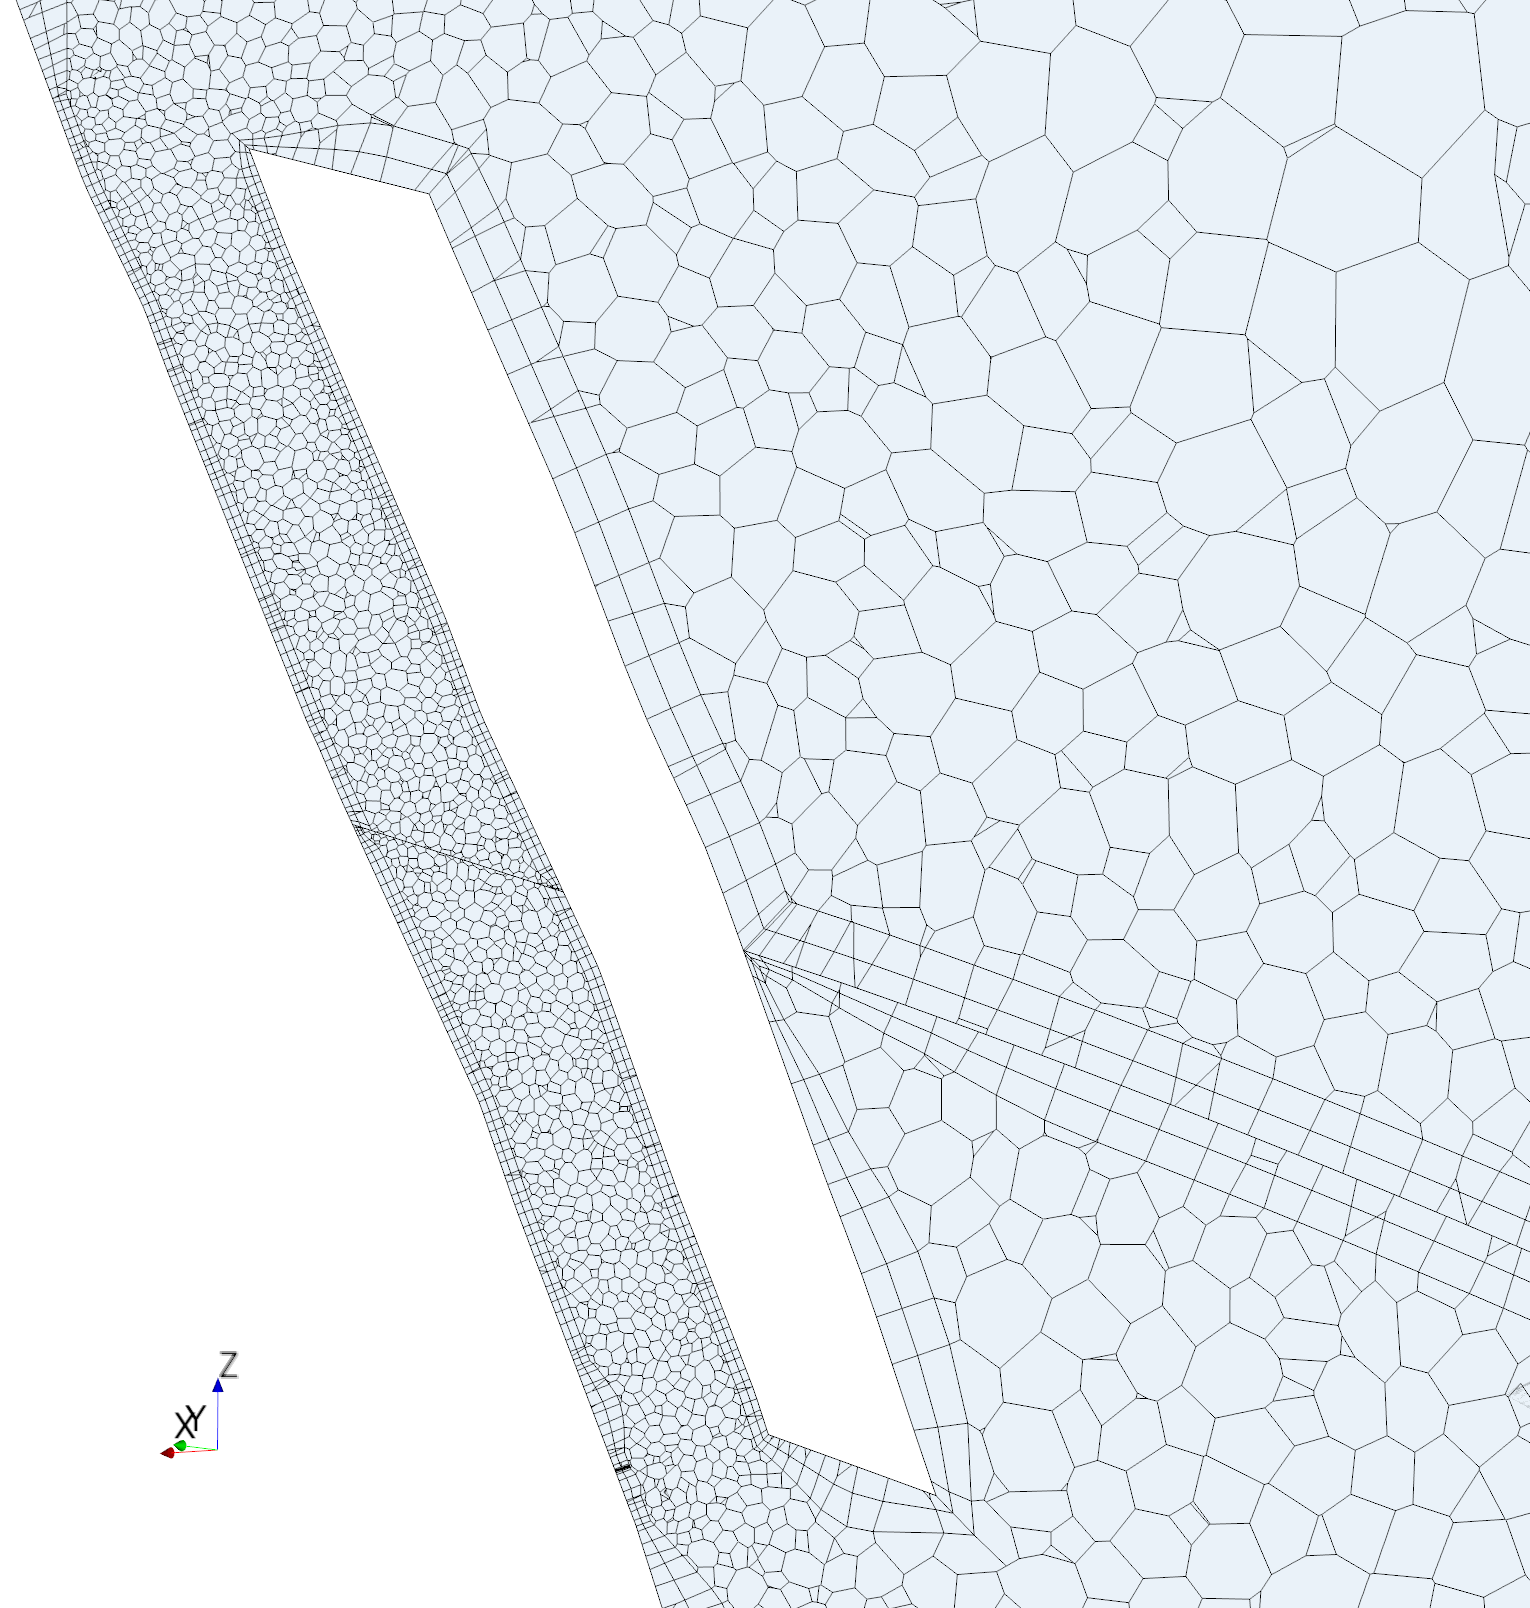
Two further cases were investigated with a slightly modified setup, i.e. under-relaxation factors (velocities) and (pressure), time step and a finer grid with ca. cells (cf. Fig. 5).
In one set of simulations, air was allowed to enter the mask through two gaps below the eyes, each with width and average height . The total gap length was , which corresponds more closely to a typical mask seal. Both inhaling and exhaling were simulated with total flow rates and .
In another set of simulations, below both eyes there was a gap with a circular-segment cross-section, with total gap width and average gap height as shown in Fig. 17. Air was exhaled with total flow rates and .
4 Results
Figures 6-8 show results from 2D-flow simulations based on the setup from Sect. 3 for inhaling. The mask has a viscous porous resistance of , corresponding to a mask that, when tightly fitted, produces a pressure drop close to the upper limit for a FFP3 mask according to the EN149 norm, i.e. (for total flow rate ) and (for ). Typical pressure drops measured in experiments for FFP2- and FFP3-masks were e.g. (Jung et al., 2014) and (Serfozo et al., 2017), indicating that the choice of is feasible.
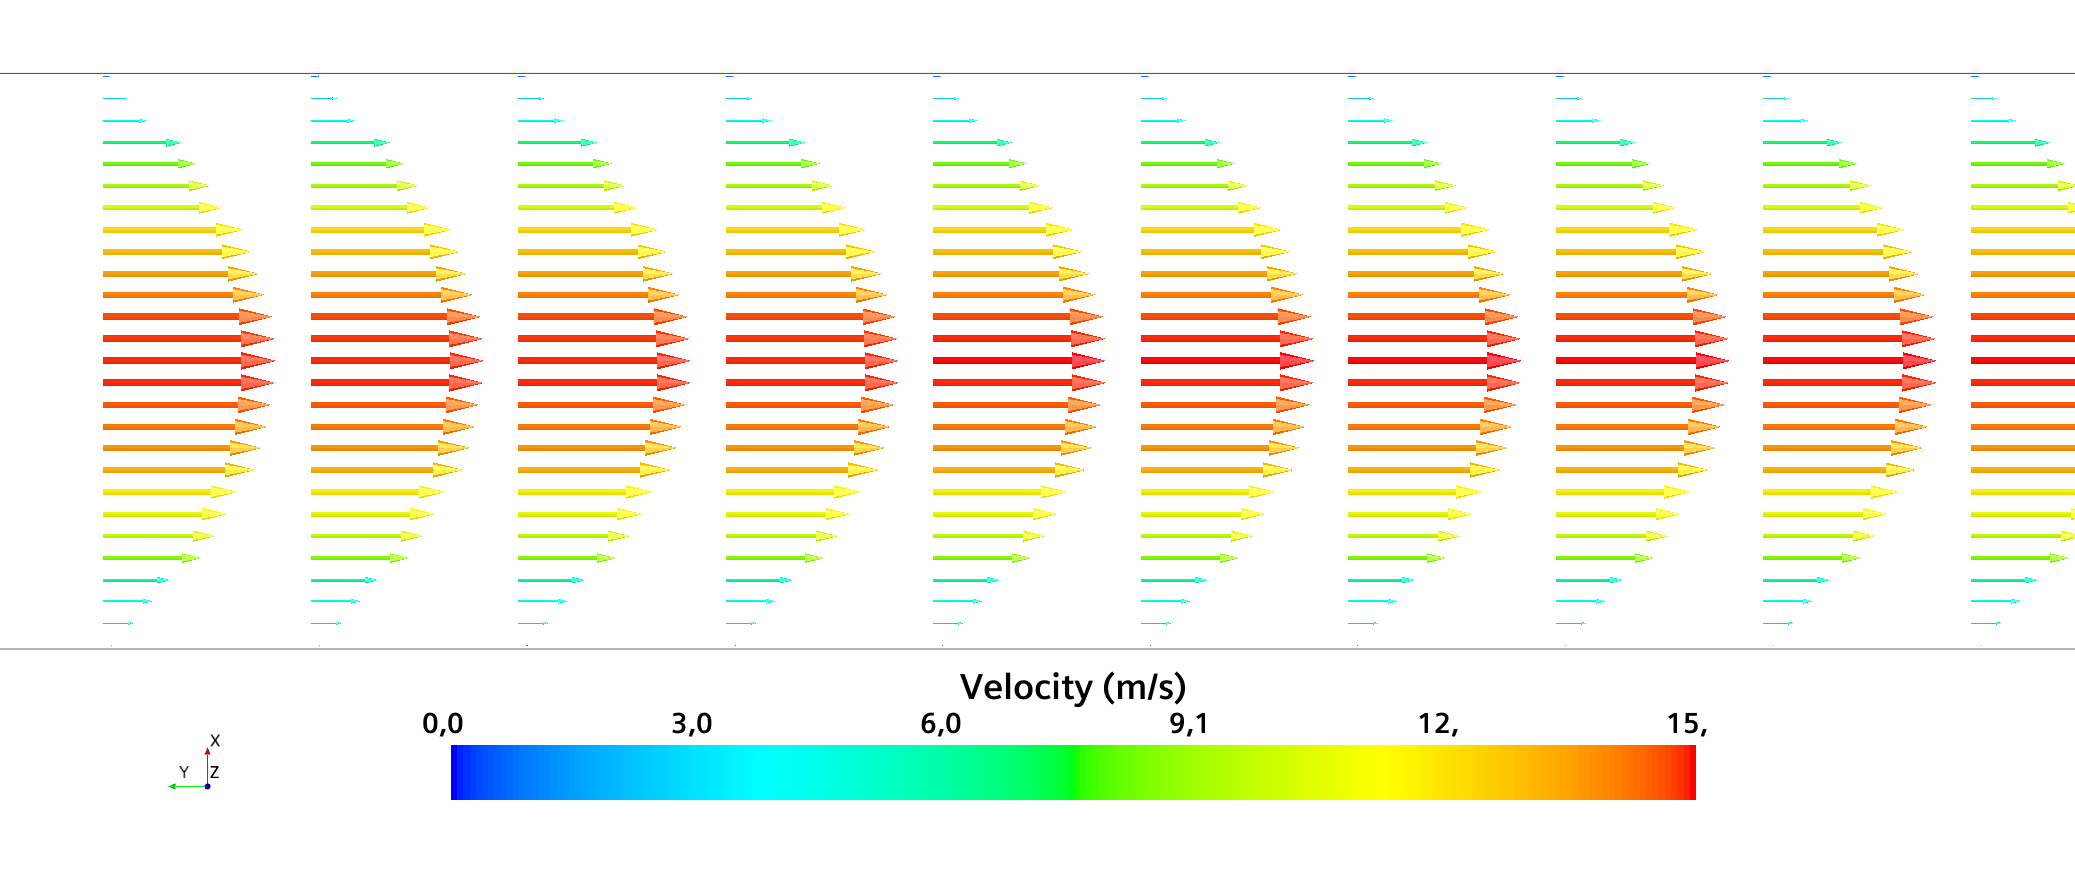
Flow rate

Flow rate

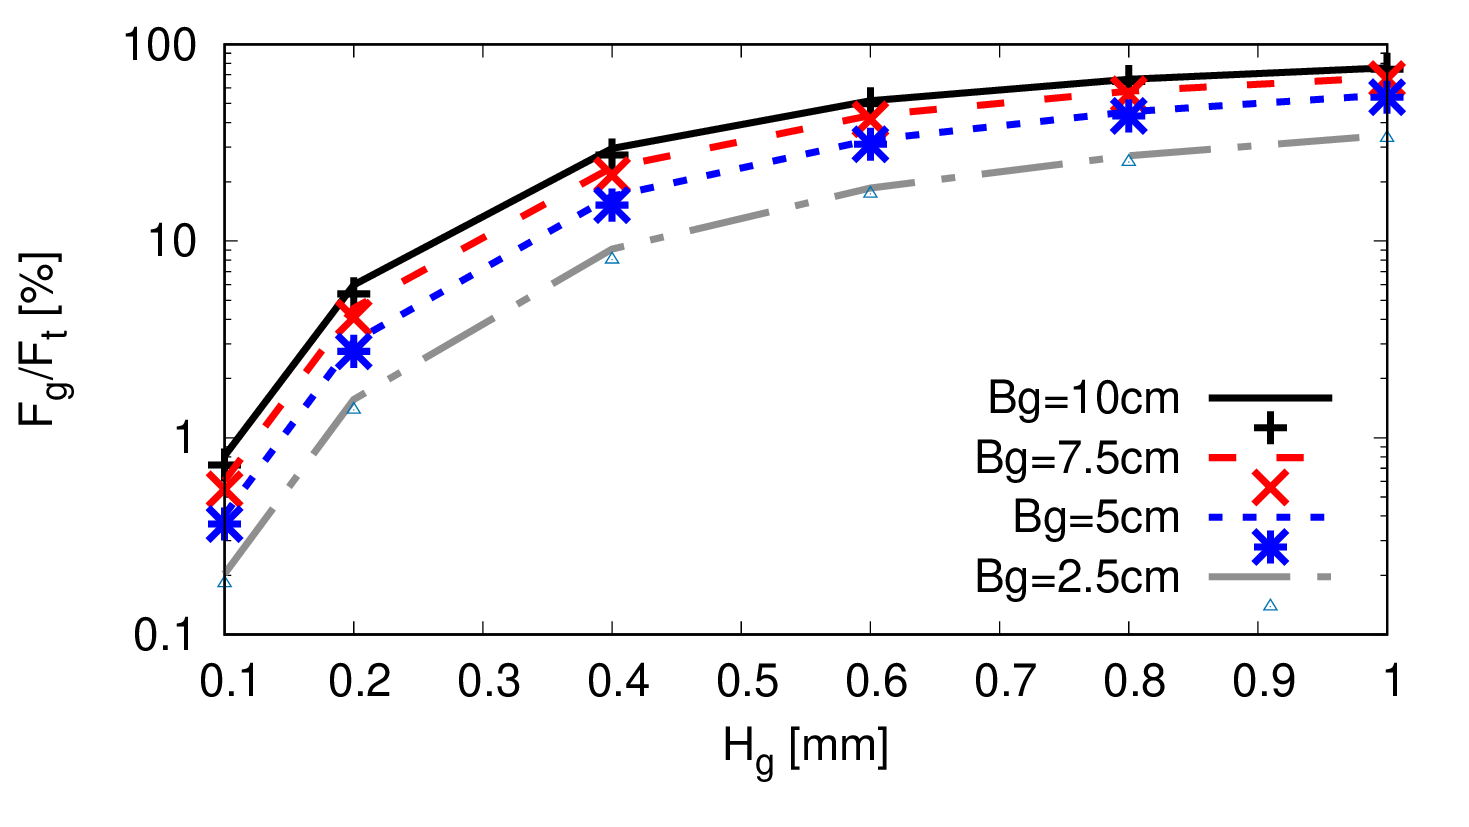
Figure 6 shows that the flow rate through the gap between mask seal and face depends non-linearly on the gap height . The predictions from the simple analytical model from Sect. 2 agree well with the more sophisticated 2D-flow simulation results.
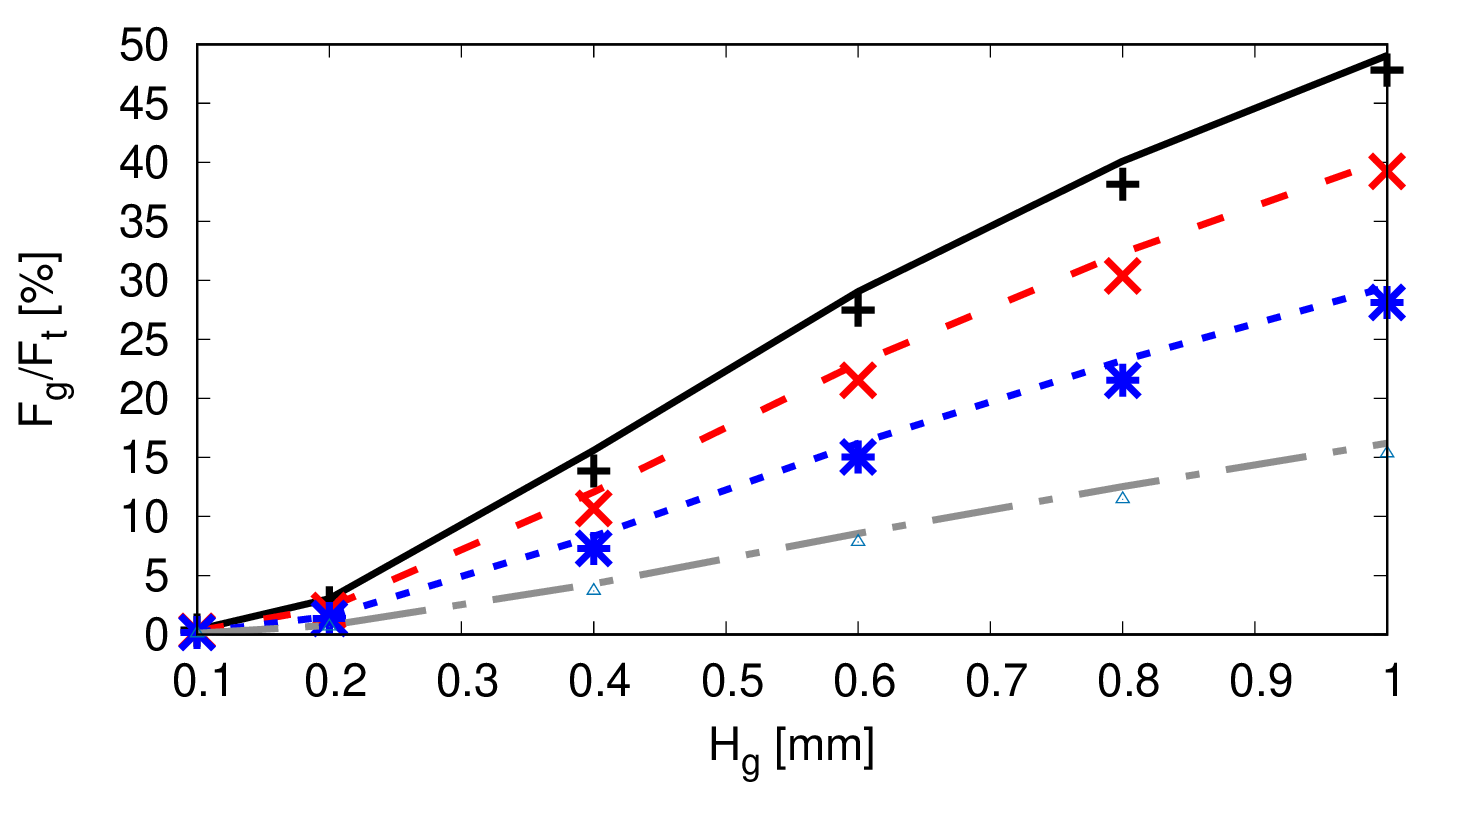
Figure 7 shows that gap heights of or less are required so that less than of the air flows through the gap. Figure 7 also shows that even a gap of height (which corresponds to the height of a beard a few hours after a close shave) causes that to of the inhaled air flows unfiltered through the gap, depending on the width of the gap (here: between and ).
The results also show that the gap height has the largest influence: increasing gap height by a factor of can increase the flow rate through the gap by a factor of up to . The gap width had a comparatively small influence: increasing gap width by a factor of increased the flow rate through the gap by a factor of up to ca. .
Flow rate
Flow rate

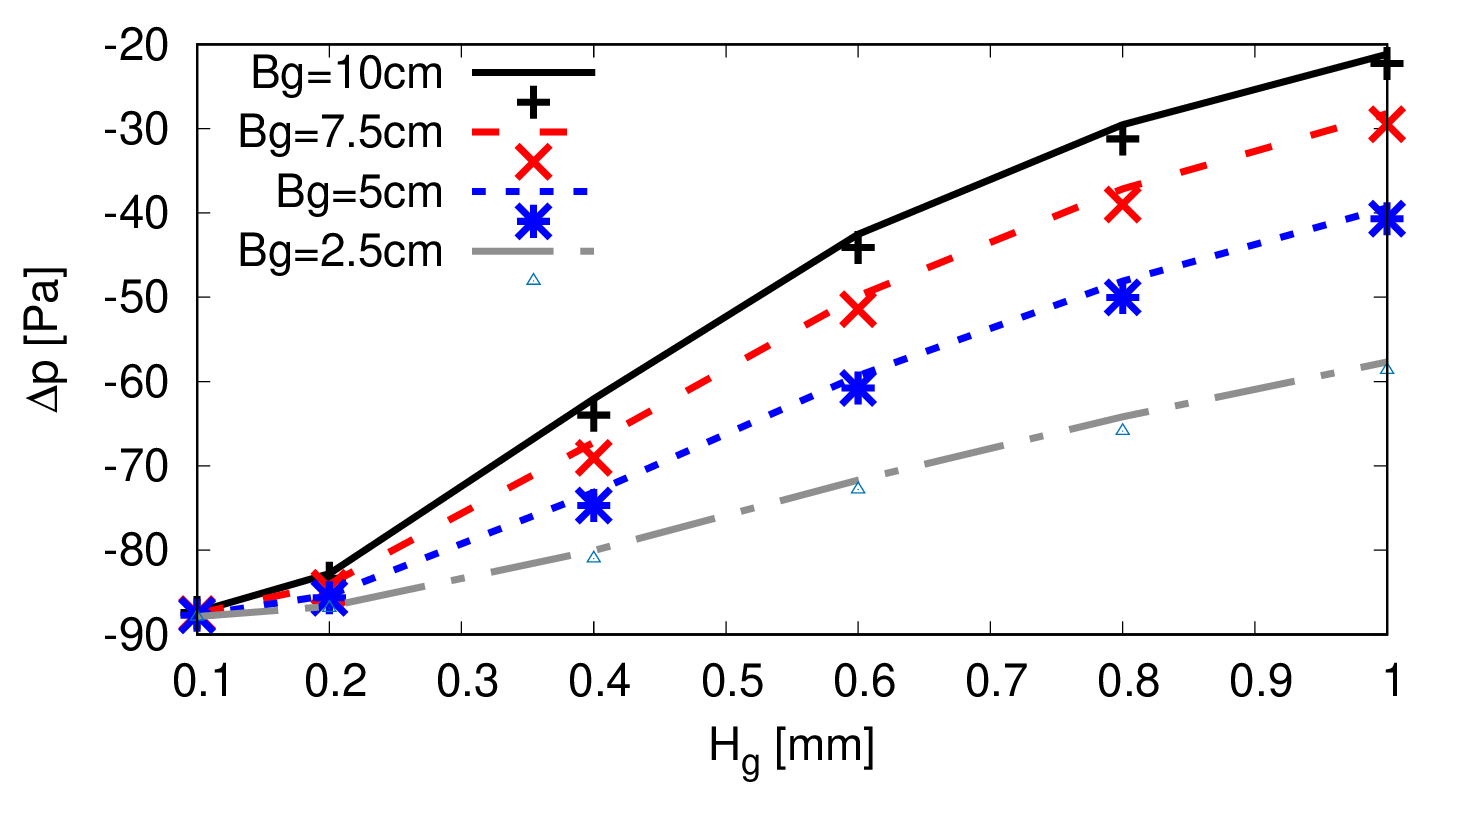
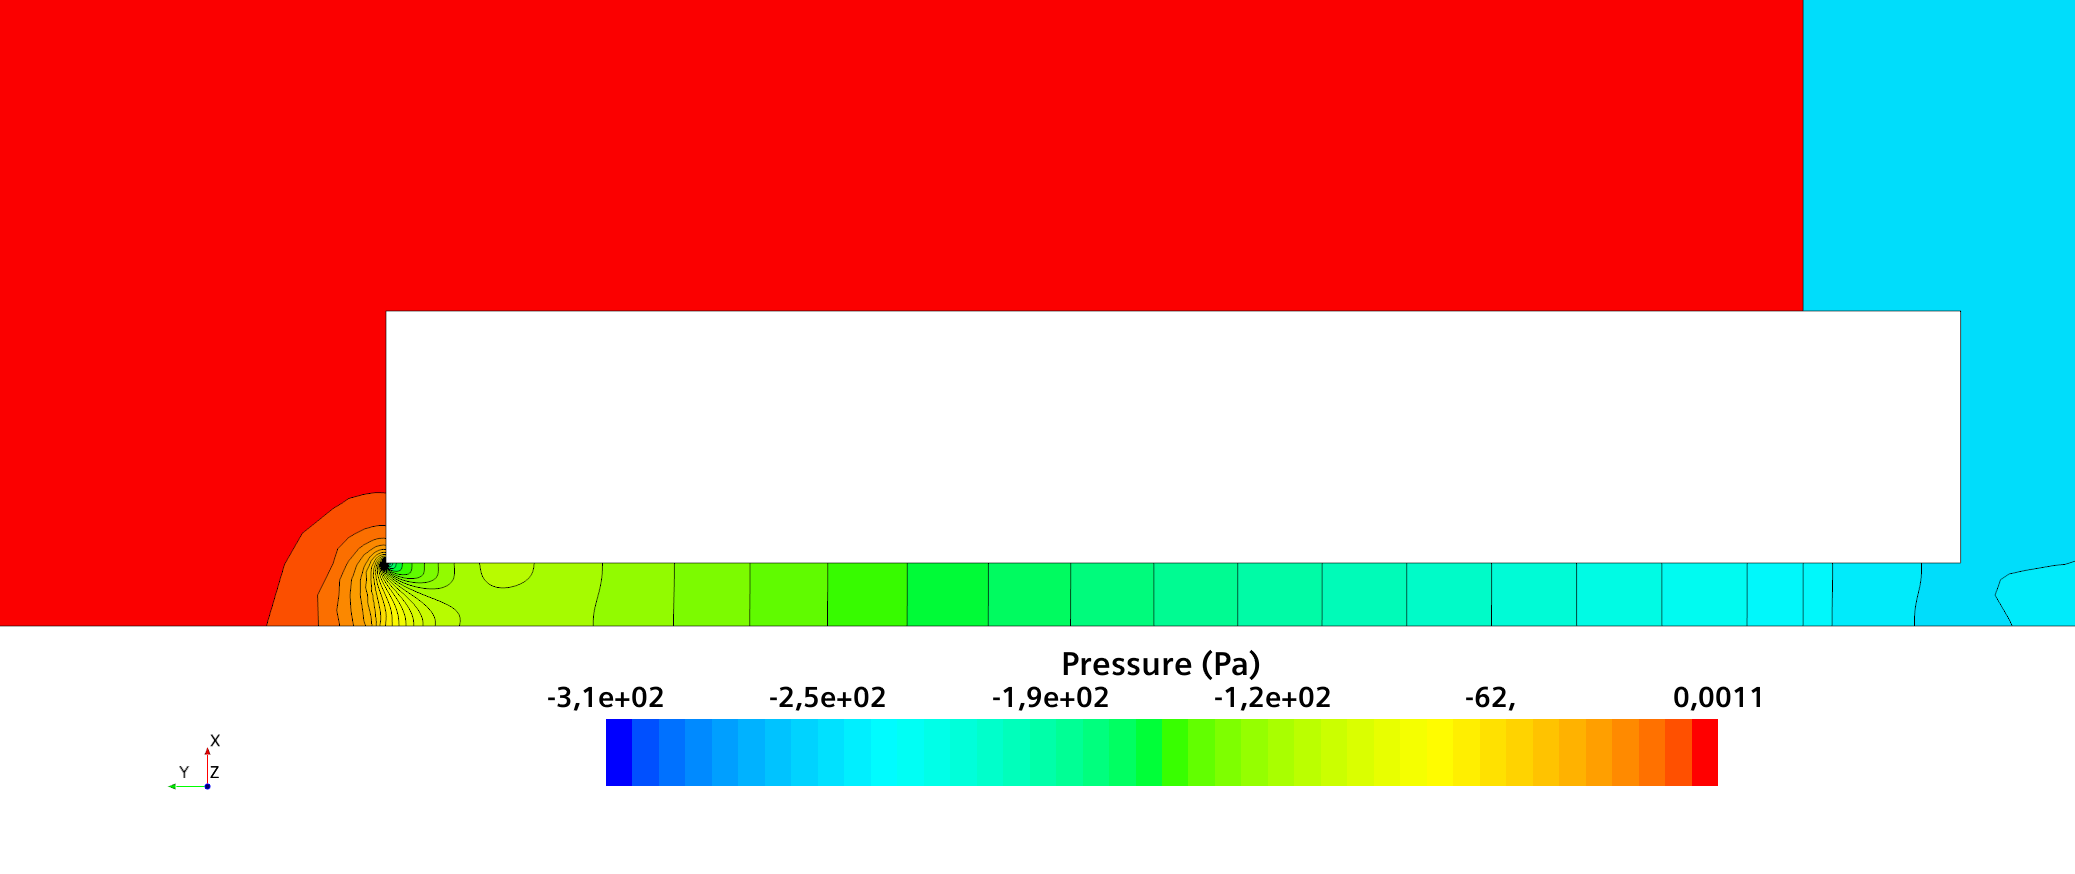
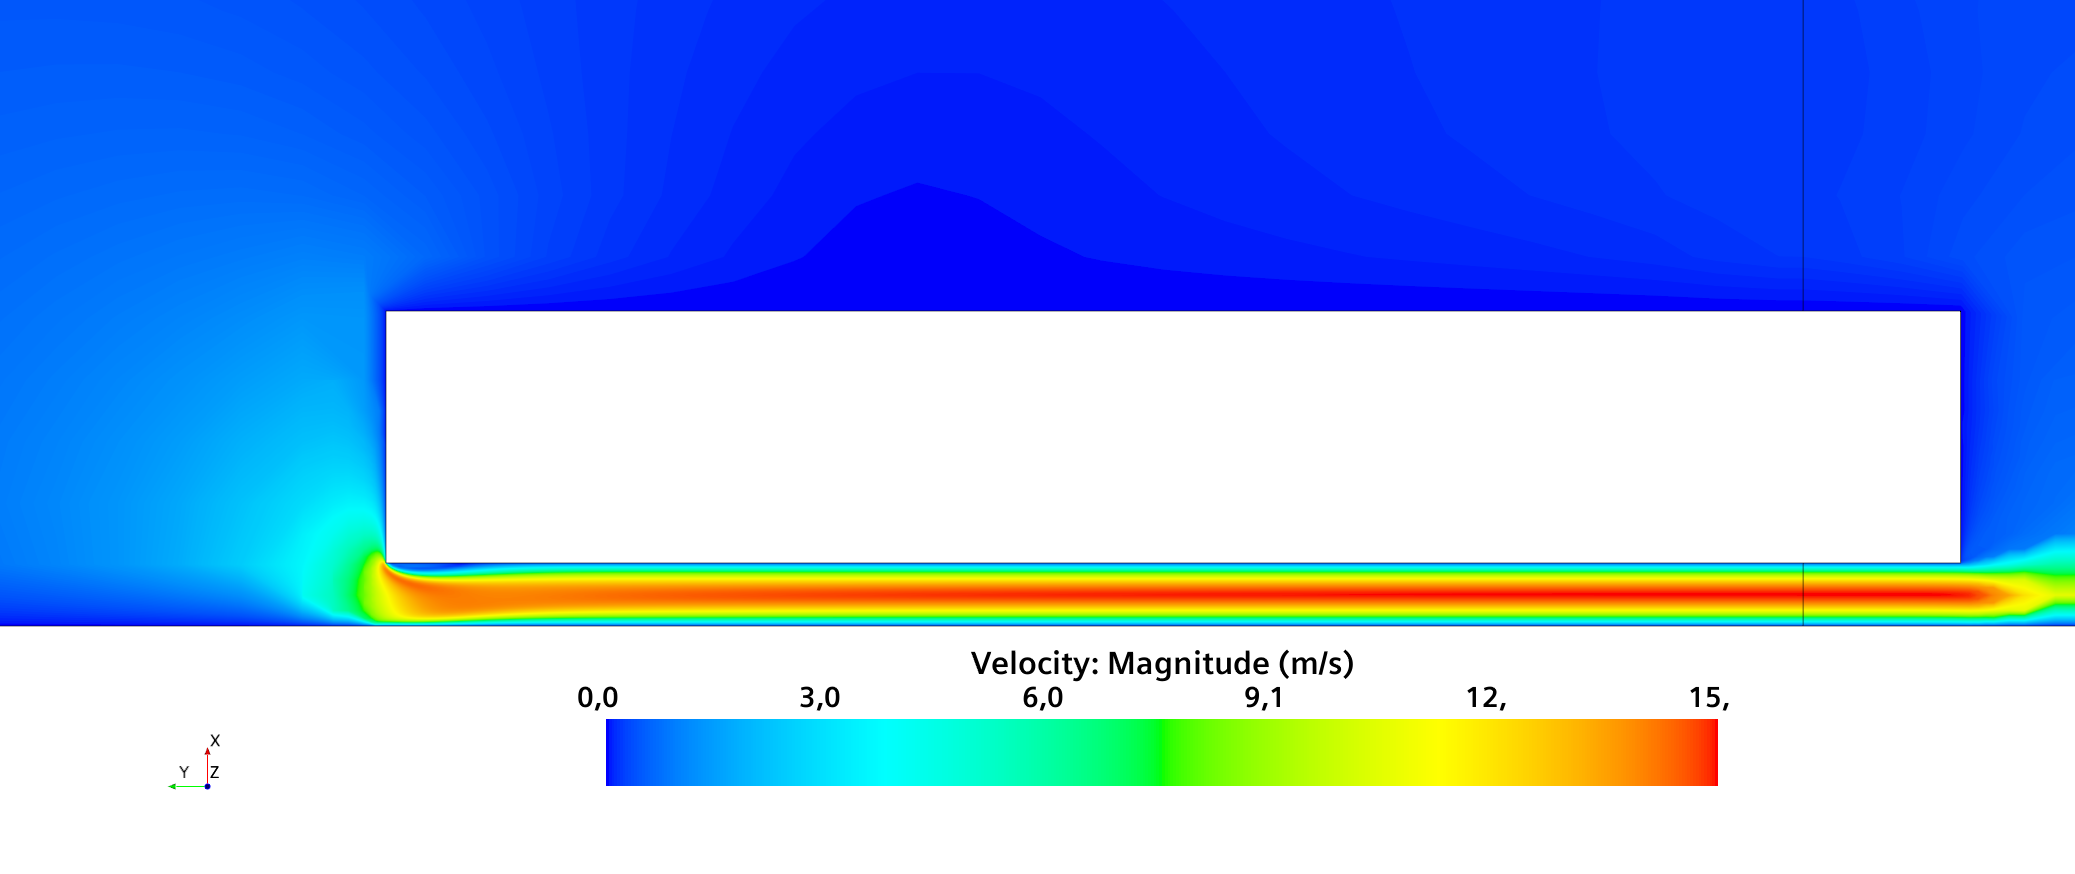
Figure 8 shows that the pressure drop across the mask filter can decrease by more than when the gap height is increased to . This makes breathing easier, which could tempt mask wearers not to tighten the mask to the face, with the consequence that up to ca. of the air flows unfiltered through the gap into the mask. Figure 9 shows pressure and velocities within the gap for a representative configuration.
Flow rate
Flow rate

Figures 10-12 show results for a mask with viscous porous resistance . When tightly fitted, the mask produces a pressure drop close to the lowest values that FFP3-masks on the market may provide.
The results show similar trends as those for , and although the filter resistance is halved, the flow rate through the gap reduces only by in most cases. Thus, the choice of filter material has a comparatively small influence concerning how large the gap height may be before the mask ceases to fulfill FFP3 requirements.
Figures 6-12 show the results obtained for the fine grid. Results for medium and coarse grids are not depicted because they show no noticeable differences. Average differences between simulation results for the flow rates on coarse, medium and fine grids are less than . The differences between analytical predictions and simulation results for the flow rates was for all simulated cases.
Flow rate

Flow rate
Flow rate

Flow rate

Flow rate

Flow rate

From Figs. 6-12, the analytical approach from Sect. 2 can be considered sufficiently validated. Therefore, Fig. 13 presents analytical predictions without backup from simulation data. The figure shows that when the gap height is small (a few multiples of ), then changing the seal thickness (i.e. the gap length) from a thin seal () to a wide seal () can change the gap flow rate by factor or more. This demonstrates that the thickness of the mask seal can have a substantial influence whether or not a mask fulfills FFP2- or FFP3-requirements.
Gap width

Gap width

Gap width

To validate that the assumptions which were made in the analytical approach from Sect. 2 and in the 2D-flow simulations from Sect. 3 are valid, 3D-flow simulations were performed with a realistic human head and mask geometry (cf. Fig. 4) for three cases denoted setups A, B, and C. These differ mainly with regard to the gap shape, flow rate and flow direction, as summarized in Table 1.
| setup A | setup B | setup C | |
| , | , | ||
| gap below | left eye | both eyes | both eyes |
| gap section | rectangular | rectangular | circular segment |
| breath | inhaling | both | exhaling |
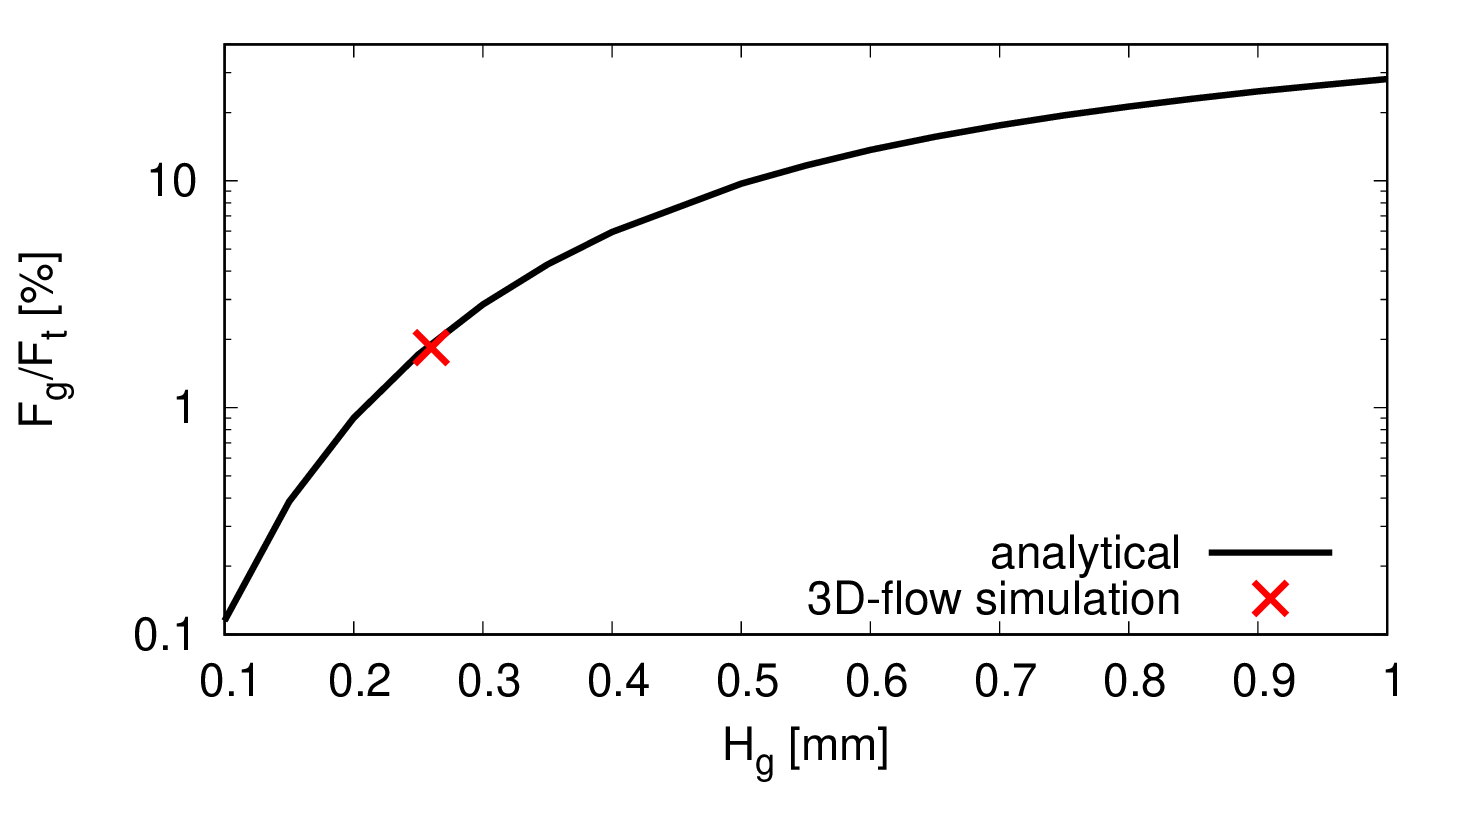
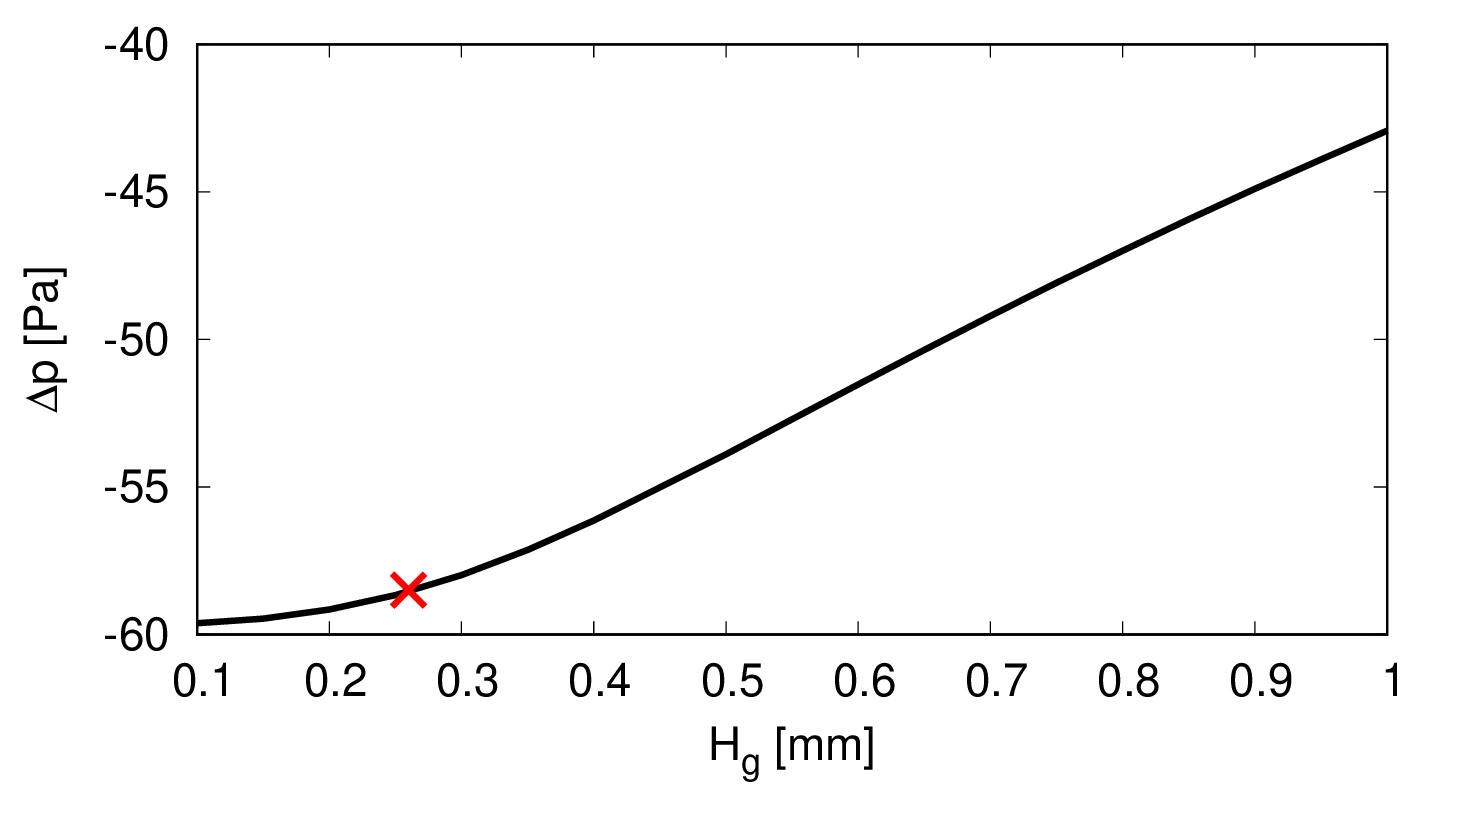
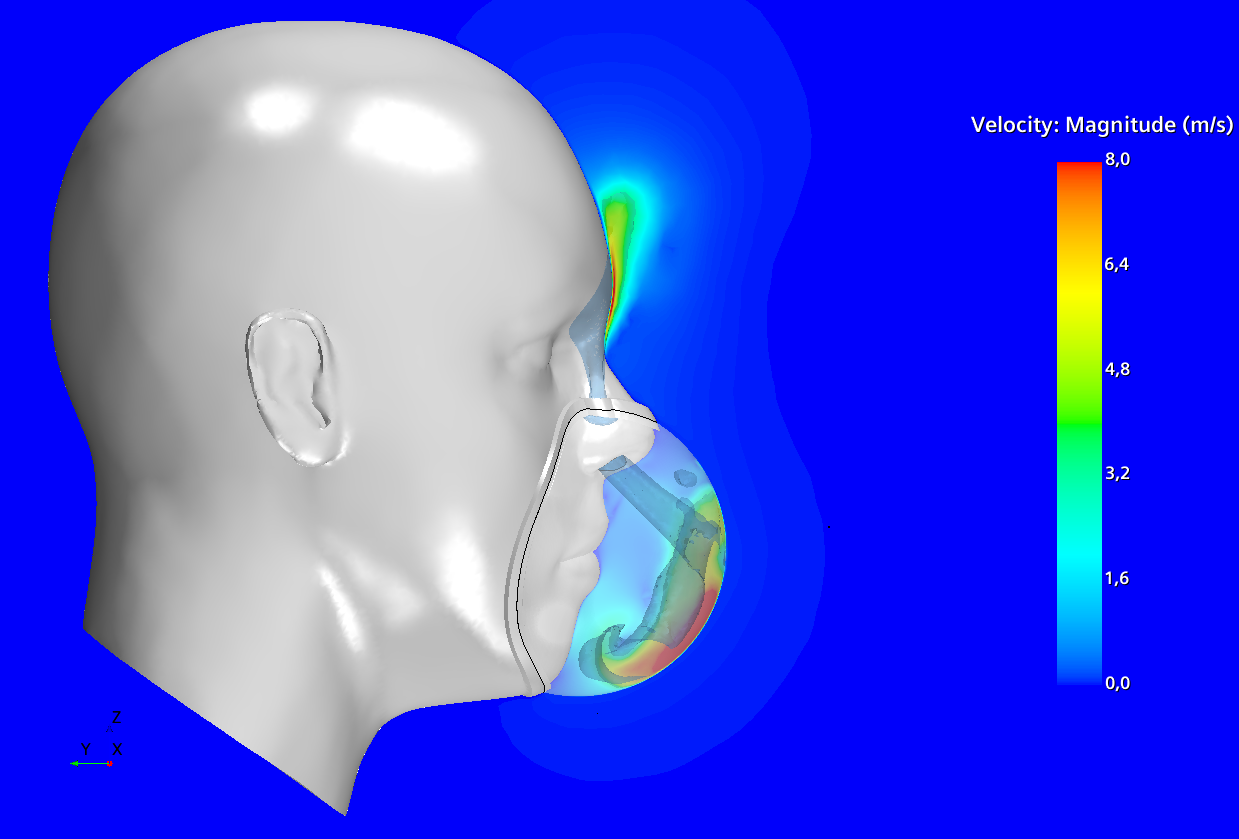
The first 3D-flow simulation results (setup A from Table 1) correspond to inhaling during normal breathing with a mask that fits tightly over the whole perimeter, except for a very small gap (average gap height and gap width , cf. Figs. 4 and 14).
Figures 14-15 show that the analytical predictions for gap flow rate and pressure within the mask agree well with 3D-flow simulation results, demonstrating that previous assumptions were justified. The results show that the pressure (not shown) can indeed be approximated as constant within the mask. The largest flow velocities occur within the gap, as expected. Although the gap is very small, of the flow enters the mask through the gap, which just fulfills FFP3-requirements that leakage must be below . Thus if there would be another such gap below the other eye, or if the seal would be slightly thinner (i.e. smaller gap length ), FFP3-requirements would not be fulfilled.
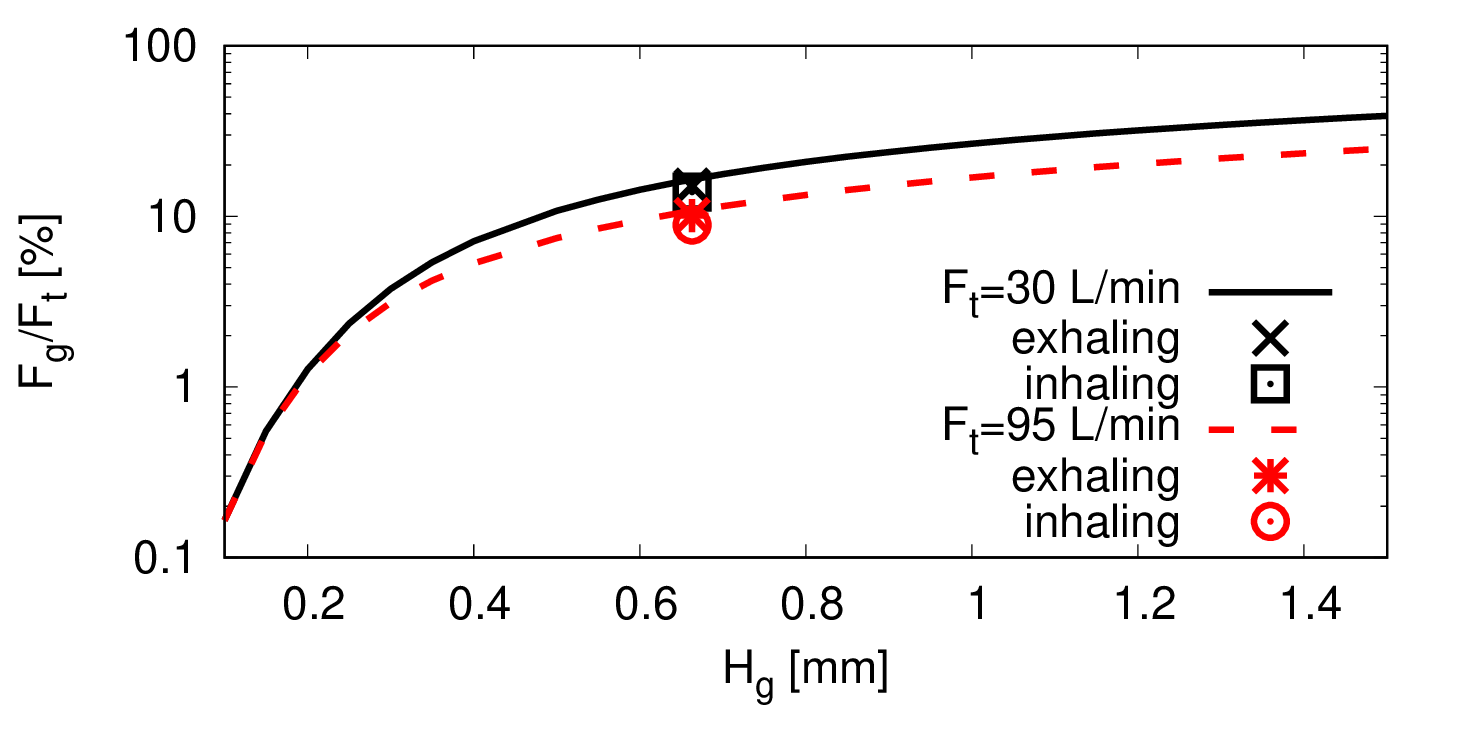
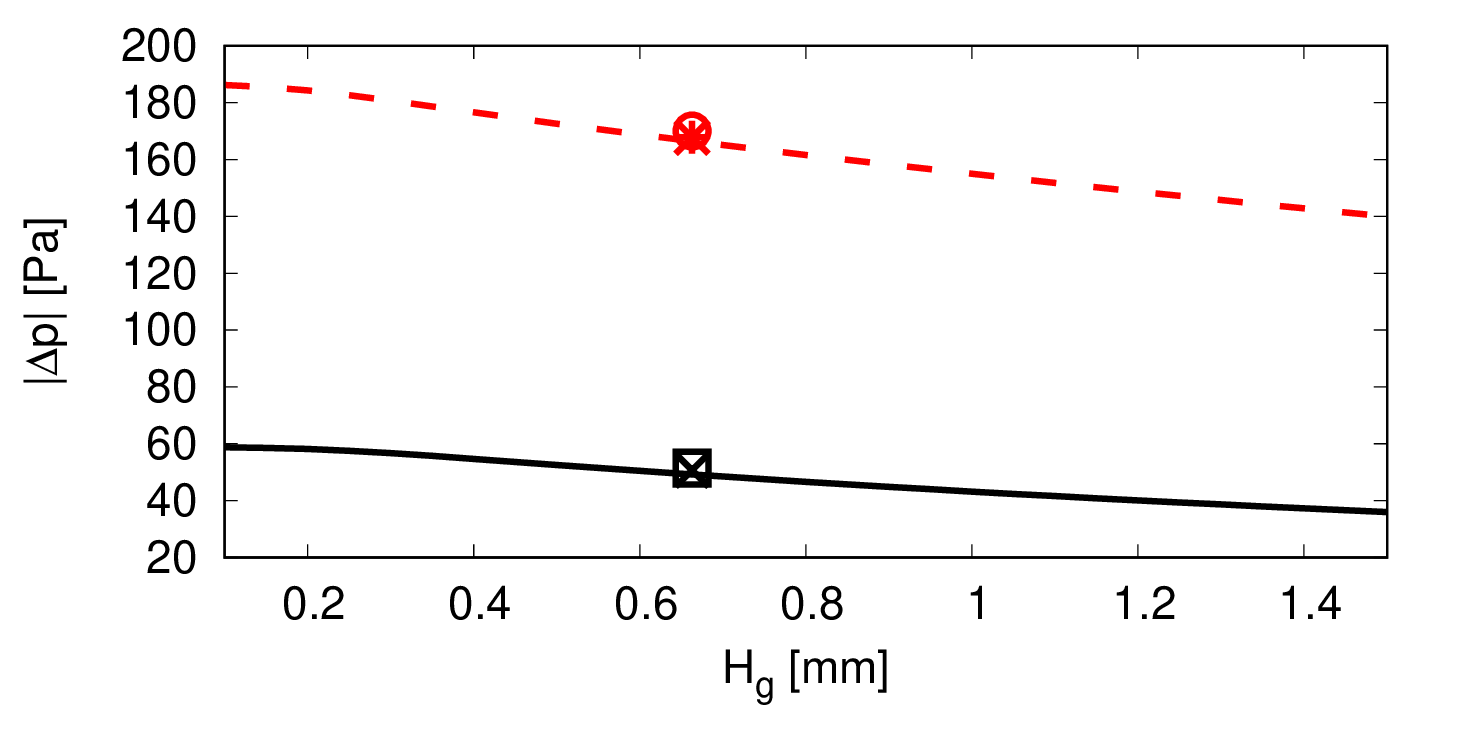
The second 3D-flow simulation results (setup B from Table 1) correspond to inhaling and exhaling during either normal breathing or deep breathing with a mask that fits tightly over the whole perimeter, except for two small gaps (average gap height and total gap width ).
Figure 16 shows that, although the gaps are still comparatively small, between (inhaling with total flow rate ) and (exhaling with total flow rate ) of the flow enters or leaves the mask through the gap unfiltered, i.e. neither FFP3- nor FFP2-requirements (i.e. less than leakage) are fulfilled. As before, the percentage flow through the gap is larger for lower flow rates. The gap flow rates were ca. larger for exhaling than for inhaling, which was attributed to the different edge angles at gap inlet and outlet for this specific geometry (i.e. different resistance for entering the gap). The agreement with analytical results from the 1D model is again remarkably good.
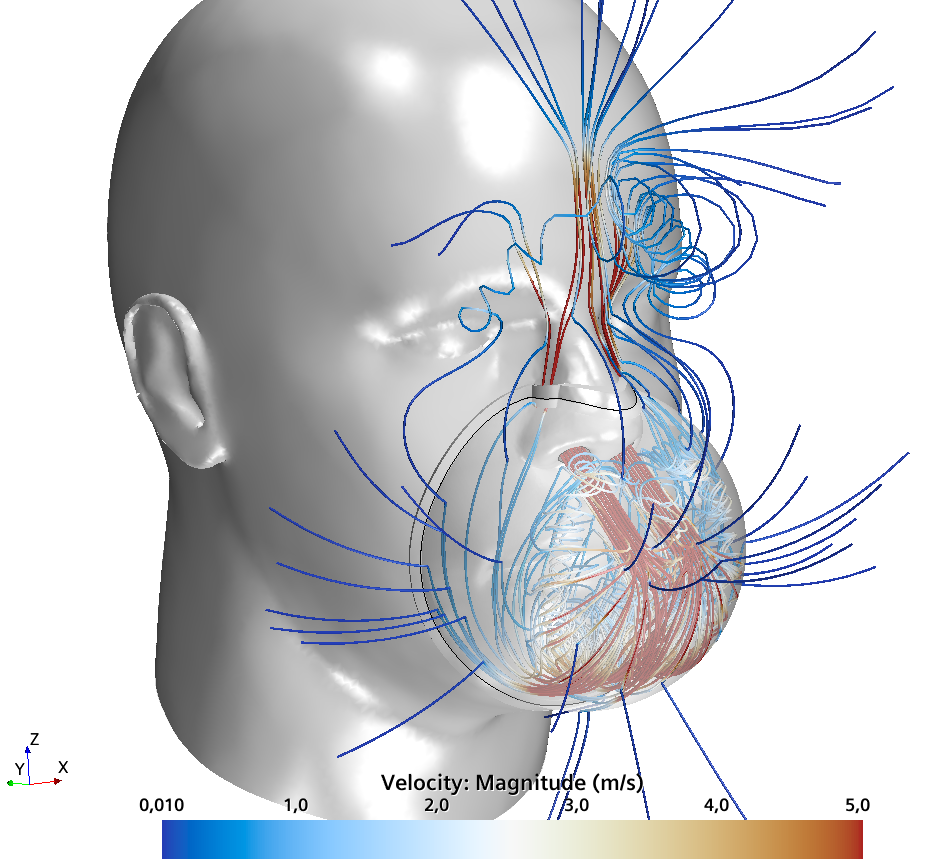
The third 3D-flow simulation results (setup C from Table 1) correspond to exhaling during either normal or deep breathing with a mask that fits tightly over the whole perimeter, except for two medium-sized gaps (average gap height and total gap width ). The gaps are located at both sides of the nose, as is typical for many self-made or surgical masks. However, the selected gap size is still small compared to the range of typical gap sizes for such masks.
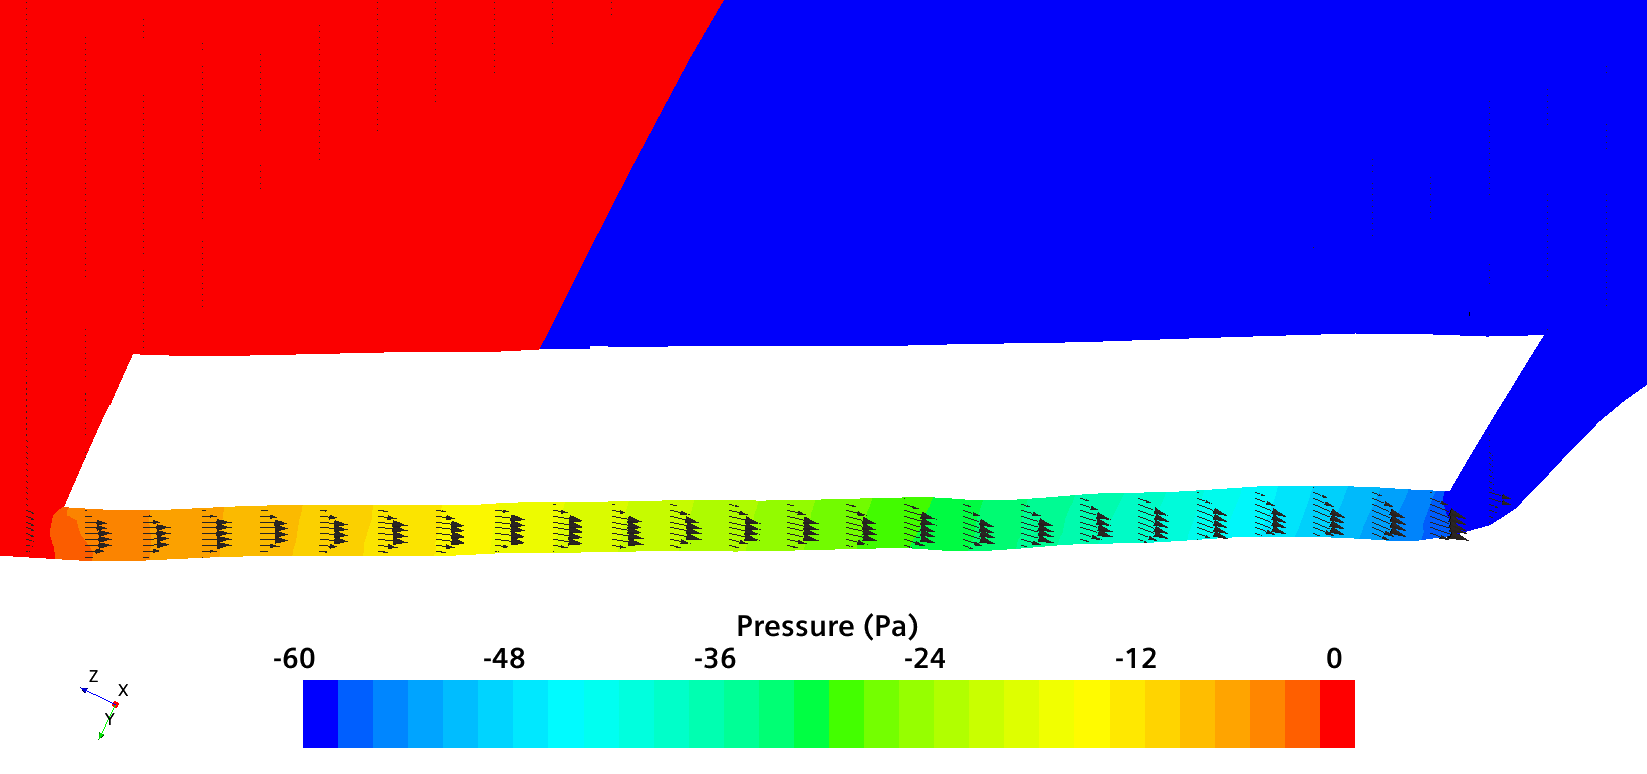
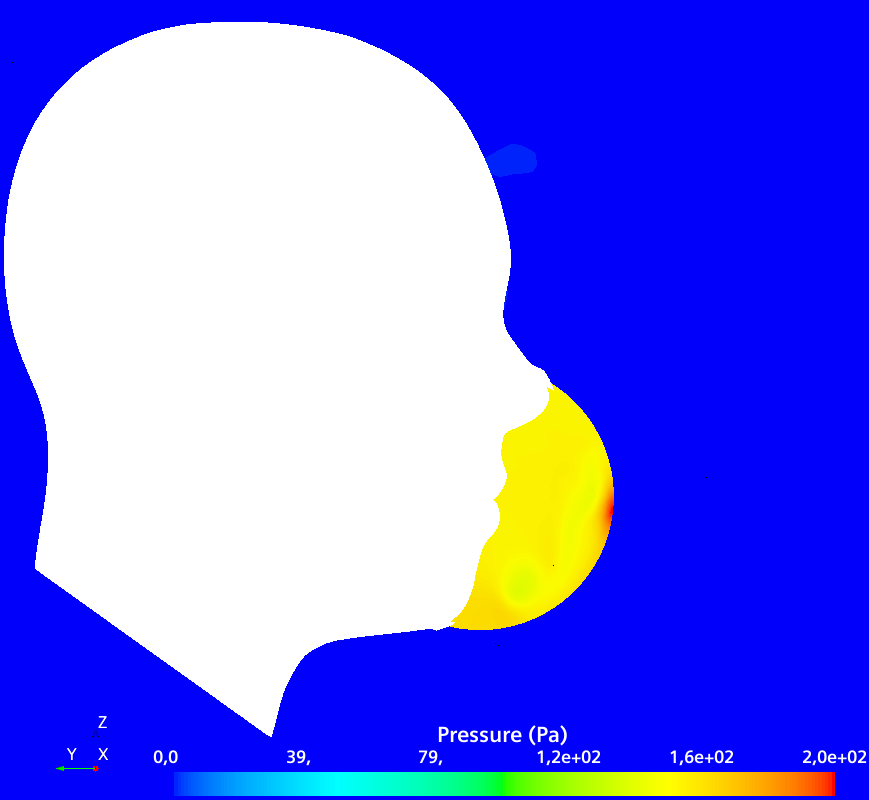
For exhaling with a total flow rate , ca. of the flow leaves the mask through the gap unfiltered, i.e. neither FFP3-, FFP2 nor FFP1-requirements (i.e. less than leakage) are fulfilled. The pressure drop was . A grid study was performed on two grids with cells and cells, and the results for flow rates and pressure drop differed by less than , indicating that the discretization was sufficiently fine. The results demonstrate how sensitive the protection provided by the mask is to airflow leakage through comparatively small gaps.
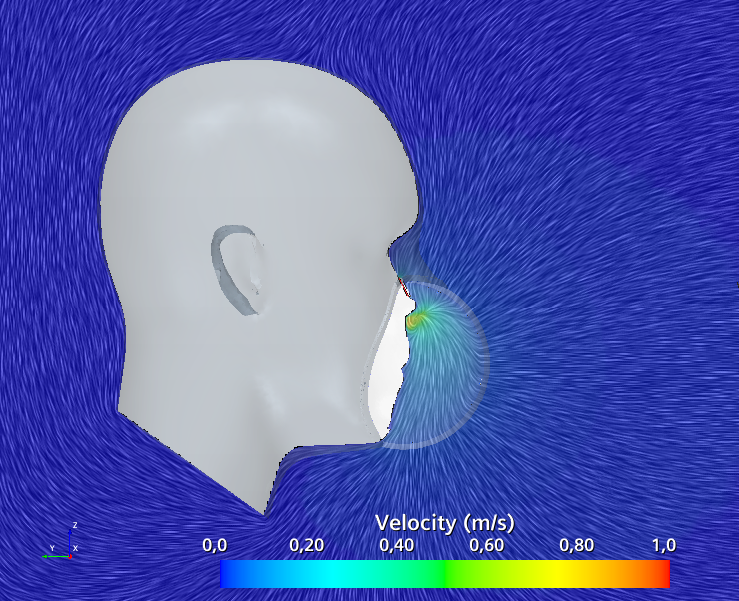
Finally, Figs. 17-18 present results for exhaling of air with a total flow rate of , where of the flow leaves the mask through the gap unfiltered with a pressure drop of . Figure 17 shows that the gap directs the airflow towards the eyes with comparatively large velocities (locally more than , i.e. up to Beaufort number 5 ‘fresh breeze’). Figure 18 shows how the exhaled breath from the nostrils hits the mask, is diverted sideways, partially passes through the mask with low velocities and partially is accelerated through the narrow gap and blows against the eyes and the forehead. If the mask is worn in combination with glasses, such a flow can be visualized by the fogging of the glasses.
5 Discussion
The present results demonstrate that tight fitting of face masks is of paramount importance. If the mask does not fit to the face perfectly, i.e. without a gap, airflow containing virus-carrying droplets leaks into or out of the mask unfiltered. The results in Sect. 4 demonstrate that already for gap heights , the total inward leakage will typically be larger than , so that FFP3-requirements are not fulfilled anymore. For gap heights , ca. to of the air can enter the mask unfiltered through the gap, so that mostly FFP2- or even FFP1-requirements are not fulfilled, while for gaps of height more than of the air may pass through the gap unfiltered.
The gap height had the largest influence on the flow rate: It was found that increasing gap height by a factor of can increase the flow rate through the gap by a factor of up to . The seal thickness (i.e. gap length ) also influenced the filtering performance substantially: For small gap heights (), changing the seal thickness from a thin seal () to a wide seal () can change the gap flow rate by factor or more. In contrast, changing the gap width had a comparatively small influence, and changing the filter material had an even smaller effect.
For the design of FFP-type masks it is therefore critical to ensure that the masks fit tightly without a gap, even if put on in a hurry by a layperson. Further, the seal thickness should be made as large as possible, to reduce the negative effects in case that there is a gap between face and mask.
The present results confirm the experimental observation by Lee et al. (2017) that for lower flow rates the percentage of leaked airflow increases. Moreover, the present findings indicate that the large variation in protection observed for FFP2- and FFP3-type masks in literature (with total inward leakage of or more for some test participants) resulted from imperfect fitting of the masks. Already for gaps which can hardly be distinguished by the naked eye, the mask may loose most of its protection. Therefore, it appears that the design of many typical FFP-type masks does not adequately consider the importance of tight fitting of the mask and may not provide reliable protection. Thus, fit-testing with suitable instruction can be recommended (cf. Lepelletier et al., 2019).
From the above discussion follows that most designs for self-made masks and surgical masks are not suitable for filtering out the majority of exhaled droplets, i.e. droplets smaller than , because they do not fit tightly and thus most air will enter and leave the mask through the gaps instead of through the filter. Only large droplets that do not follow the flow of air may be filtered more effectively. Future work could model larger droplets as Lagrangian particles, to determine via flow simulations the amount of larger droplets that pass through the gap as a function of the particle size and gap location.
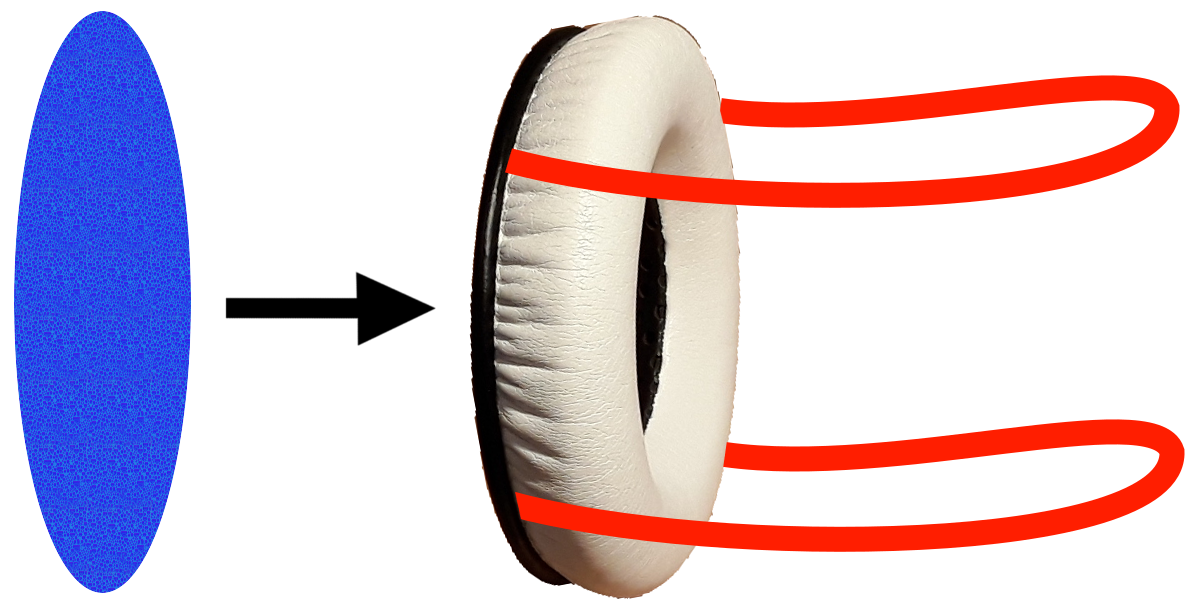
From the present findings, it can be expected that the design of most self-made masks as well as industrial masks can be improved by attaching an impermeable, sufficiently thick sealing material to the mask rim. This material should be flexible enough to allow tight fitting for different face geometries, which can be achieved by selecting a deformable material and pressing it tightly against the face by adjustable bands. Furthermore, the material should be comfortable enough to allow wearing durations of several hours. An example for such a material are the ear-pieces of typical passive noise-cancelling headphones. The mask filter can be made of the same materials used so far. The shape of the filter is not important because the present results show that the pressure within the mask is basically uniform. The suggested improved design is illustrated in Fig. 19.
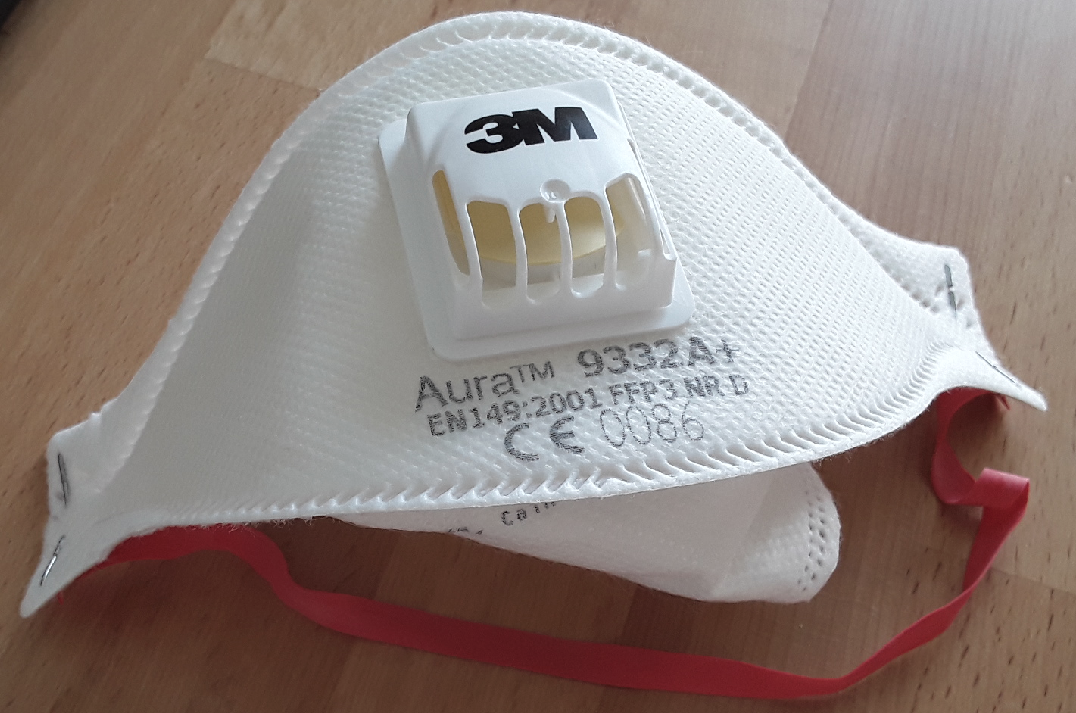
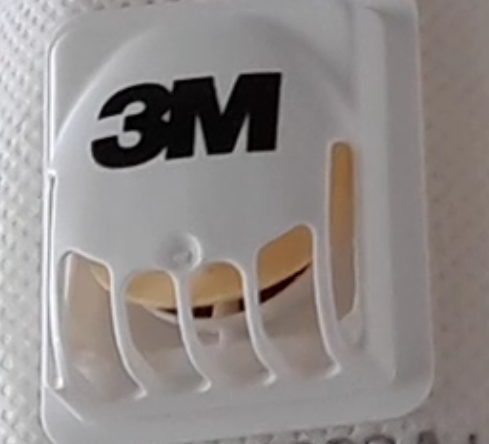
The present results have implications also for masks with one-way valves as shown in Fig. 20. One-way valves can reduce the breathing effort and humidity inside the mask: When exhaling, the valve opens a gap of height and width . Thus from the present results it can be expected that for these masks most air leaves the mask through the valve unfiltered. Therefore, such a mask does not provide adequate protection for others when worn by an infected person. Especially, such masks should not be worn by healthcare workers or other professions where the risk of being infected is increased.
For pandemic viruses such as COVID19, which survives at most several days on surfaces (Kampf et al., 2020), ordinary citizens may only require a few masks, which can be stored in a dry, warm place and after a few days can be reused, and thus would remain reusable for years. With suitable material choice, the mask can even be disinfected more quickly, for example by placing it in an oven at temperatures in the order of for ca. half an hour (Mackenzie, 2020). In this manner, production and distribution of FFP3-masks for the general public can be realized comparatively cost-effectively, so that social and economic consequences of a pandemic might be reduced by this measure.
Acknowledgments
The authors are grateful to Prof. Moustafa Abdel-Maksoud, Institute for Fluiddynamics and Ship Theory, Hamburg University of Technology, Hamburg, Germany for support and valuable discussions. The availability of the CFD software Simcenter STAR-CCM+ for this study, provided by Siemens Industry Software, is highly appreciated.
References
2em1
Andersen, B. M. (2019). Protection of Upper Respiratory Tract, Mouth and Eyes. In Prevention and Control of Infections in Hospitals (pp. 129-146). Springer, Cham.
Asadi, S., Bouvier, N., Wexler, A. S., and Ristenpart, W. (2020). The coronavirus pandemic and aerosols: Does COVID-19 transmit via expiratory particles?, Aerosol Science and Technology, 54:6, 635-638, DOI: 10.1080/02786826.2020.1749229
Cherrie, J. W., Apsley, A., Cowie, H., Steinle, S., Mueller, W., Lin, C., Horwell, C. J., Sleeuwenhoek, A., and Loh, M. (2018). Effectiveness of face masks used to protect Beijing residents against particulate air pollution. Occupational and environmental medicine, 75(6), 446-452.
Edwards, D. A., Man, J. C., Brand, P., Katstra, J. P., Sommerer, K., Stone, H. A., Nardell, E., and Scheuch, G. (2004). Inhaling to mitigate exhaled bioaerosols. Proceedings of the National Academy of Sciences, 101(50), 17383-17388.
Fabian, P., McDevitt, J. J., DeHaan, W. H., Fung, R. O., Cowling, B. J., Chan, K. H., Leung, G. M., and Milton, D. K. (2008). Influenza virus in human exhaled breath: an observational study. PloS one, 3(7).
Fairchild, C. I., and Stampfer, J. F. (1987). Particle concentration in exhaled breath. American Industrial Hygiene Association Journal, 48(11), 948-949.
Ferziger, J. H., Perić, M., and Street, R. L. (2020). Computational methods for fluid dynamics. Berlin: Springer.
Idelchik, I. E. (1986). Handbook of hydraulic resistance. Washington, DC, Hemisphere Publishing Corp., 1986, 662 p. Translation.
Howard, J. (2020). Should you wear a mask? US health officials re-examine guidance amid coronavirus crisis, CNN online article, March 31, 2020, link: https://edition.cnn.com/2020/03/31/health/coronavirus-masks-experts-debate/index.html
Jung, H. (2014). Performance of Filtration Efficiency, Pressure Drop and Total Inward Leakage in Anti-yellow Sand Masks, Quarantine Masks, Medical Masks, General Masks and Handkerchiefs (Doctoral dissertation, Seoul National University).
Jung, H., Kim, J., Lee, S., Lee, J., Kim, J., Tsai, P., and Yoon, C. (2014). Comparison of filtration efficiency and pressure drop in anti-yellow sand masks, quarantine masks, medical masks, general masks, and handkerchiefs. Aerosol Air Qual Res, 14(14), 991-1002.
Kampf, G., Todt, D., Pfaender, S., and Steinmann, E. (2020). Persistence of coronaviruses on inanimate surfaces and its inactivation with biocidal agents. Journal of Hospital Infection.
Lee, S. A., Hwang, D. C., Li, H. Y., Tsai, C. F., Chen, C. W., and Chen, J. K. (2016). Particle size-selective assessment of protection of European standard FFP respirators and surgical masks against particles-tested with human subjects. Journal of healthcare engineering.
Lee, S. A., Chen, Y. L., Hwang, D. C., Wu, C. C., and Chen, J. K. (2017). Performance evaluation of full facepiece respirators with cartridges. Aerosol and Air Quality Research, 17(5), 1316-1328.
Lepelletier, D., Keita-Perse, O., Parneix, P., Baron, R., Glélé, L. S. A., Grandbastien, B., and French Society for Hospital Hygiene working group. (2019). Respiratory protective equipment at work: good practices for filtering facepiece (FFP) mask. European Journal of Clinical Microbiology and Infectious Diseases, 38(11), 2193-2195.
Mackenzie, D. (2020). Reuse of N95 Masks. Engineering (Beijing, China).
Milton, D. K., Fabian, M. P., Cowling, B. J., Grantham, M. L., and McDevitt, J. J. (2013). Influenza virus aerosols in human exhaled breath: particle size, culturability, and effect of surgical masks. PLoS pathogens, 9(3).
Mueller, W., Horwell, C. J., Apsley, A., Steinle, S., McPherson, S., Cherrie, J. W., and Galea, K. S. (2018). The effectiveness of respiratory protection worn by communities to protect from volcanic ash inhalation. Part I: filtration efficiency tests. International journal of hygiene and environmental health, 221(6), 967-976.
Ntlailane, M. G. L., and Wichmann, J. (2019). Effectiveness of N95 respirators for nanoparticle exposure control (2000–2016): a systematic review and meta-analysis. Journal of Nanoparticle Research, 21(8), 170.
Papineni, R. S., and Rosenthal, F. S. (1997). The size distribution of droplets in the exhaled breath of healthy human subjects. Journal of Aerosol Medicine, 10(2), 105-116.
Penconek, A., Drążyk, P., and Moskal, A. (2013). Penetration of diesel exhaust particles through commercially available dust half masks. Annals of occupational hygiene, 57(3), 360-373.
Schlichting, H., and Gersten, K. (2017). Boundary-layer theory. 9th edition, Springer-Verlag Berlin Heidelberg, DOI: 10.1007/978-3-662-52919-5.
Serfozo, N., Ondráček, J., Zíková, N., Lazaridis, M., and Ždímal, V. (2017). Size-resolved penetration of filtering materials from CE-marked filtering facepiece respirators. Aerosol Air Qual. Res, 17, 1305-1315.
Steinle, S., Sleeuwenhoek, A., Mueller, W., Horwell, C. J., Apsley, A., Davis, A., Cherrie, J. W., and Galea, K. S. (2018). The effectiveness of respiratory protection worn by communities to protect from volcanic ash inhalation. Part II: Total inward leakage tests. International journal of hygiene and environmental health, 221(6), 977-984.
Tellier, R. (2006). Review of aerosol transmission of influenza A virus. Emerging infectious diseases, 12(11), 1657.
Tropea, C., and Yarin, A. L. (2007). Springer handbook of experimental fluid mechanics. Springer Science & Business Media.
van der Sande, M., Teunis, P., and Sabel, R. (2008). Professional and home-made face masks reduce exposure to respiratory infections among the general population. PLoS One, 3(7).
van Doremalen, N., Bushmaker, T., Morris, D. H., Holbrook, M. G., Gamble, A., Williamson, B. N., Tamin, A., Harcourt, J. L., Thornburg, N. J., Gerber, S. I., de Wit, E., and Lloyd-Smith, J. O. (2020). Aerosol and surface stability of SARS-CoV-2 as compared with SARS-CoV-1. New England Journal of Medicine, 382(16), 1564-1567.
World Health Organization. (2020). Advice on the use of masks in the context of COVID-19: interim guidance, 6 April 2020 (No. WHO/2019-Cov/IPCMasks/2020.3). World Health Organization.