∎
1Institute of Physics, Slovak Academy of Sciences, 84228 Bratislava, Slovakia
2LIP-Laboratório de Instrumentação e Física Experimental de Partículas , 3004-516 Coimbra, Portugal
3Institute of Nuclear Physics, Polish Academy of Sciences, 31342 Kraków, Poland
4Smoluchowski Institute of Physics, Jagiellonian University of Cracow, 30-059 Kraków, Poland
5GSI Helmholtzzentrum für Schwerionenforschung GmbH, 64291 Darmstadt, Germany
6Technische Universität Darmstadt, 64289 Darmstadt, Germany
7Institut für Strahlenphysik, Helmholtz-Zentrum Dresden-Rossendorf, 01314 Dresden, Germany
8Joint Institute of Nuclear Research, 141980 Dubna, Russia
9Institut für Kernphysik, Goethe-Universität, 60438 Frankfurt, Germany
10Excellence Cluster ’Origin and Structure of the Universe’ , 85748 Garching, Germany
11Physik Department E62, Technische Universität München, 85748 Garching, Germany
12II.Physikalisches Institut, Justus Liebig Universität Giessen, 35392 Giessen, Germany
13Institute for Nuclear Research, Russian Academy of Science, 117312 Moscow, Russia
14Institute of Theoretical and Experimental Physics, 117218 Moscow, Russia
15National Research Nuclear University MEPhI (Moscow Engineering Physics Institute), 115409 Moscow, Russia
16Department of Physics, University of Cyprus, 1678 Nicosia, Cyprus
17Laboratoire de Physique des 2 infinis Irène Joliot-Curie, Université Paris-Saclay, CNRS-IN2P3. , F-91405 Orsay , France
18Nuclear Physics Institute, The Czech Academy of Sciences, 25068 Rez, Czech Republic
19LabCAF. F. Física, Univ. de Santiago de Compostela, 15706 Santiago de Compostela, Spain
20Uniwersytet Warszawski - Instytut Fizyki Doświadczalnej, 02-093 Warszawa, Poland
21Dipartimento di Fisica and INFN, Università di Torino, 10125 Torino, Italy
a also at Coimbra Polytechnic - ISEC, Coimbra, Portugal
b also at Technische Universität Dresden, 01062 Dresden, Germany
c also at Frederick University, 1036 Nicosia, Cyprus
† deceased
e-mail: hades-info@gsi.de
Charged-pion production in collisions at = 2.4
Abstract
We present high-statistic data on charged-pion emission from Au+Au collisions at = 2.4 GeV (corresponding to = 1.23 A GeV) in four centrality classes in the range 0 - 40 of the most central collisions. The data are analyzed as a function of transverse momentum, transverse mass, rapidity, and polar angle. Pion multiplicity per participating nucleon decreases moderately with increasing centrality. The polar angular distributions are found to be non-isotropic even for the most central event class. Our results on pion multiplicity fit well into the general trend of the world data, but undershoot by data from the FOPI experiment measured at slightly lower beam energy. We compare our data to state-of-the-art transport model calculations (PHSD, IQMD, PHQMD, GiBUU and SMASH) and find substantial differences between the measurement and the results of these calculations.
pacs:
25.75.-q heavy-ion collisions 25.75.Dw charged-pion spectra1 Introduction
Heavy-ion collisions at relativistic energies allow the study of bulk properties of strongly interacting matter at high temperatures and densities. In these studies, the phase-space distributions of various final-state particles are analyzed and compared to the corresponding distributions in nucleon-nucleon interactions in order to disentangle bulk phenomena from the trivial superposition of elementary interactions. The particles present in the final state of relativistic nuclear collisions carry information about the initial state, e.g. the impact parameter, about the properties of the high-density phase of the system, e.g. the pressure and its gradients, and about the expansion and freeze-out conditions of the produced strongly-interacting matter, often called fireball. The final-state particles are either surviving nucleons, nuclear clusters, or newly-produced particles. Being the lightest mesons, pions are the pseudo-Goldstone bosons of SU2 reflecting the approximate spontaneous breaking of chiral symmetry of the QCD. Hence, they are a measure for the degree of excitation in a gas of hadrons Stock (1986). They have an isospin of one and come in the three charge states , and , and they are the only abundantly produced particles in the few-GeV energy range. Their yields, phase-space distributions, and multi-particle correlations carry information about all stages of the collision.
In this paper, we present experimental data on charged-pion production in centrality-selected Au+Au collisions at =2.4 GeV (corresponding to a beam kinetic energy of = 1.23 A GeV on fixed target). Our results profit from high statistics and thus complement and extend earlier studies of pion production at similar energies and with heavy nuclei Muntz et al. (1995); Wagner et al. (1998); Reisdorf et al. (2007); Pelte et al. (1997); Wolf et al. (1998); Averbeck et al. (2003, 1997); Holzmann et al. (1997); Harris et al. (1987); Klay et al. (2003); Nagamiya et al. (1981). They cover rapidity and transverse-momentum (or mass) distributions, as well as derived quantities. Some of the latter are analyzed as a function of the collision centrality. Special emphasis is put on the comparison of the experimental findings with results from microscopic model calculations. Detailed investigations of spectra generated in thermal models in comparison to experimental data are also ongoing and will be discussed in future publications. First results on two-pion correlations have recently been published Adamczewski-Musch et al. (2019a, b). Multi-pion correlation and collective-flow studies are the subject of separate forthcoming articles.
After describing the experimental setup and the analysis methods in section 2, we present transverse-momentum () and reduced transverse-mass spectra (), as well as rapidity distributions which are used to determine the multiplicities of charged pions in section 3. In section 3.1, our result on the pion yield is compared to the pion excitation function for beam kinetic energies ranging from threshold up to 10 GeV. It is well established that pions at SIS18 energies are emitted preferably in the forward/backward direction. In section section 3.2, we present the centrality and momentum dependence of the parameter which quantifies the pion anisotropy. The presentation of our results ends with a detailed comparison of the observables discussed in the previous sections to five state-of-the-art microscopic models Hartnack et al. (1998); Cassing and Bratkovskaya (1999); Buss et al. (2012); Petersen et al. (2019); Weil et al. (2016); Aichelin et al. (2020) in section 4.
We note in passing that the measured pion yields are important for the normalization of the dielectron data obtained in the same experiment Adamczewski-Musch et al. (2019c). The low-energy region of the invariant-mass spectra of dielectrons is dominated by the decay products of neutral pions. The charged pions can be used to construct triple differential momentum distributions of neutral pions and their decays which allow to constrain the part of the dielectron spectrum originating from pion decays.
2 Experimental setup and data analysis
The experiment was performed with the High Acceptance Di-Electron Spectrometer (HADES) at the Schwerionensynchrotron SIS18 at GSI, Darmstadt. HADES, although primarily optimized to measure dielectrons Agakichiev et al. (2007); Agakishiev et al. (2011a); Adamczewski-Musch et al. (2019c), has also excellent hadron identification capabilities Agakishiev et al. (2009a, b, c, 2010, 2011b, 2015); Adamczewski-Musch et al. (2018a). HADES is a charged particle detector consisting of a six-coiled magnet producing a toroidal field centered around the beam axis. Six identical detection sections are located between the coil planes and cover polar angles between 18∘ and 85∘. Its large azimuthal acceptance varies from 65 at low to 90 at high polar angles. The corresponding losses are corrected for in the analysis. Each sector is equipped with a Ring-Imaging Cherenkov (RICH) detector for electron identification (not relevant for the present analysis) followed by four layers of Mini-Drift Chambers (MDCs), two in front of and two behind the magnetic field. The MDCs record space points of the trajectories of charged particles which, together with the known magnetic field, are used to determine the particle momentum. The momentum resolution of the charged pions was found to be and depends only weakly on laboratory momentum. The arrival time of the charged particles is measured by a scintillator based Time-Of-Flight detector (TOF) covering polar angles from to and Resistive Plate Chambers (RPC) covering polar angles from to . Their respective time resolutions are 150 and 66 ps. A Pre-Shower detector (behind the RPC, for electron identification) provides additional position information. The experimental setup is described in detail in Agakishiev et al. (2009d).
The beam consisted of Au69+ ions and had an intensity of approximately particles/s. It impinged on a 15-fold segmented gold target, with an integral thickness corresponding to an interaction probability of 1.4 ; the total length of the target assembly was 60 mm. Several triggers were implemented: The minimum-bias trigger was defined by a valid signal in a diamond START detector in front of the target. An online trigger detected interactions and rejected peripheral collisions. It was based on the summed TOF detector multiplicity signal, which selected events with more than about 20 charged particles in this detector. About 2.1 billion Au+Au events, corresponding to the 40% most central collisions, were acquired this way. The centrality of the recorded events has been mapped onto the distribution of the charged particle multiplicity detected in the RPC and TOF detectors (for details see Adamczewski-Musch et al. (2018b)). Interactions of beam particles outside of the target have been rejected by requiring that the main interaction vertex is reconstructed within mm of the center of the target in the direction of the beam. The details of the procedure, which provides a measure of centrality and verifies that the online trigger does not bias the phase-space distributions, are described in Adamczewski-Musch et al. (2018b).
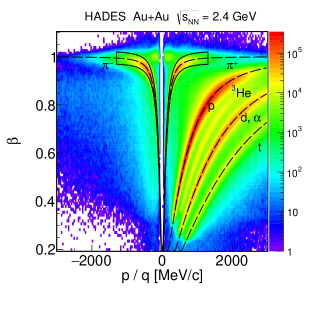
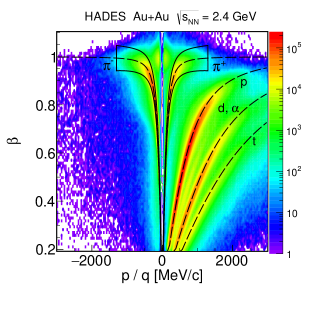
Charged-hadron identification is based on the time-of-flight measured with TOF and RPC. Particle velocity is obtained from the measured flight time and flight path. Combining this information with the particle momenta allows to identify charged particles (e.g. pions, kaons or protons) with high significance. Figure 1 shows the population of all charged particles in the plane spanned by their and laboratory momenta divided by charge for the RPC (left) and TOF (right) detectors. The different particle species are well separated and distributed along the black dashed curves which represent the function:
| (1) |
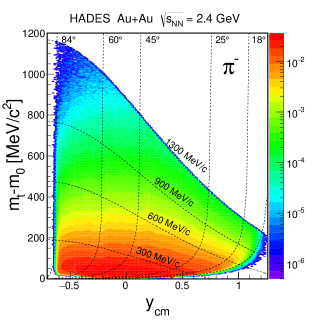
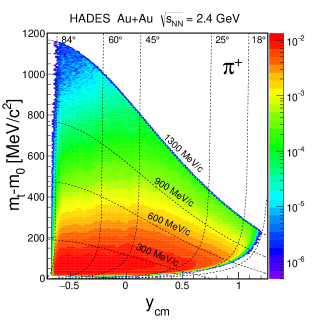
The projections of momentum slices on the axis are fitted with a Gaussian distribution, the mean of which is fixed to the value given by eq. (1). Their widths are free parameters which are used to select 2 bands along the kinematic curves given by eq. (1). In order to avoid contamination of the sample by protons and of the sample by high momentum particles with wrong charge assignment, only pions with laboratory momenta below 1.3 GeV are accepted for further analysis. The losses due to the 2 cut are taken care of by the efficiency and acceptance correction described below. The coverage in the plane spanned by rapidity (ycm) and reduced transverse mass (mt - m0) of the measured but uncorrected yields is shown in fig. 2.
The measured (raw) pion spectra obtained after particle identification must be corrected for the spectrometer acceptance and losses due to the various cuts introduced during track reconstruction. These efficiency and acceptance corrections have been calculated from simulated Au+Au events generated by the UrQMD model Bass et al. (1998). The detector response was simulated using the Geant3 Brun et al. (1987) based simulation package including geometry and characteristic of all HADES detectors. Simulations were subjected to the same reconstruction and analysis steps for all centrality classes as the experimental data. The fraction of lost tracks (particles) is quantified by the ratio of the number reconstructed to the number of simulated tracks. The used efficiency and acceptance correction method is described in detail in Agakishiev et al. (2009b). The resulting correction factors were calculated in 14 rapidity ( = 0.1), 60 transverse momentum ( = 25 MeV), and 60 transverse mass ( = 25 MeV) intervals (bins). They are typically on the order of 1.5 - 2.0 over our phase space coverage, including the correction for acceptance limitations in azimuthal angle. The bins near the acceptance limits for which the factor was higher than 6.6 (15 efficiency) were excluded from the analysis. The validity of the correction procedure was checked by alternatively using a track-embedding method. Charged pions were generated with a thermal phase space distribution and inverse slope extracted from data. After embedding them into measured events, these events were processed by the standard reconstruction chain and the fraction of lost embedded tracks was calculated. It was found that the resulting correction factors differ by less than 1 from the ones obtained when using plain simulated UrQMD events. Differential pion yields are calculated as the product of raw yields and the correction factors in all accepted bins of and and are modeled using the following functions:
| (2) |
| (3) |
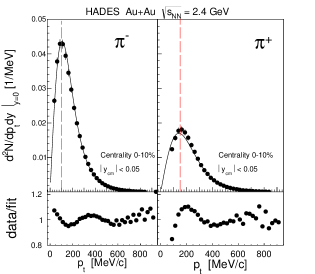
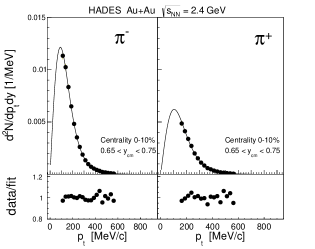
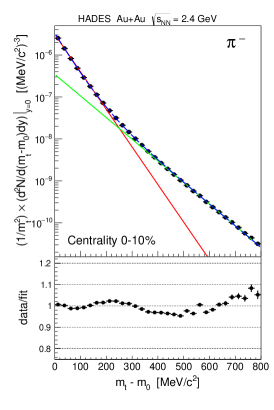
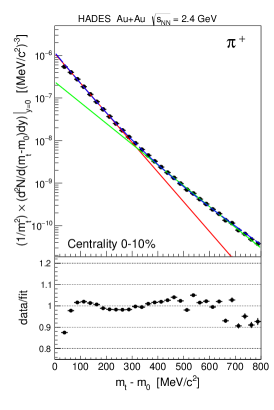
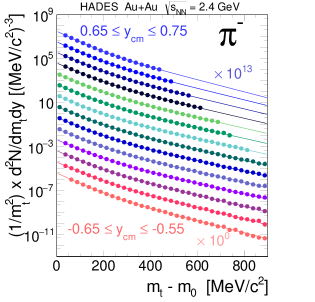
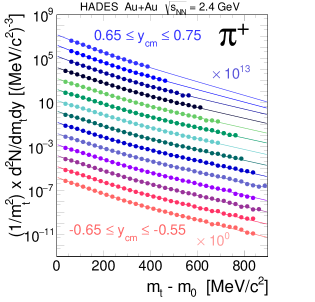
Examples of the transverse-momentum distributions of and mesons () at mid-rapidity (a) and forward rapidity (b) are shown in fig. 3 together with fits of the function (2). We have chosen a superposition of two Boltzmann distributions, because the pion reduced transverse-mass spectra deviate from a single exponential as is demonstrated in figs. 4 (a) and (b) which show the spectra at mid-rapidity. The parameters and account for different slopes at low and high reduced transverse masses, respectively.
The fit procedure starts with independent single Boltzmann fits in separate ranges (0-300 MeV and 500-800 MeV). We use the resulting inverse slope parameters as starting values for and for the double Boltzmann fit in the range 0-800 MeV. This is done in two steps. First, we require to be in an interval of few MeV around the value obtained from the single Boltzmann fit in order to improve the fit for . Then we release the limits and perform the two-slope fit again, extracting the final values of and , shown in table 1. The resulting errors are of the order of 1 MeV or smaller but depend on the chosen fit range and are correlated. Therefore, we refrain from quoting them explicitly. The fit function (3) is used to extrapolate the spectrum into the low and high regions outside of the acceptance. The particle yield in each rapidity interval is obtained as the sum of the measured and extrapolated yields. The fraction of the latter is a few percent at mid-rapidity and up to 30% towards forward and backward rapidity. The fit ranges were restricted in and to be below 800 MeV. The extrapolation into unmeasured regions is subject to systematic uncertainties. A close look to the spectra of the positively (negatively) charged pions in fig. 3 (a) reveals that at low momenta the data points are systematically below (above) the fitted curves. We attribute this deviation from a Boltzmann shape to the Coulomb interaction of the pions with the net positive charge of the expanding fireball. This well-established effect Barz et al. (1998) causes shifts of the momentum distributions which are different for the positively and negatively charged pions. The former are accelerated leading to a reduced yield at low momenta and the latter are decelerated leading to an increased yield at low momenta. The comparison of the transverse-momentum distributions of and in fig. 3 (a) illustrate these momentum shifts: the maximum of the () spectrum (represented by red dashed lines) is shifted from their average value of about 125 MeV to 100 MeV (150 MeV). Based on these results, a separate paper on the determination of the Coulomb potential is in preparation. The deviations between the transverse-momentum (or mass) distributions and the Boltzmann fits cause a systematic underestimate (overestimate) of the extrapolation into the low-momentum region of the () yield of 4. The and rapidity distributions are obtained by integrating the measured transverse-mass distributions and adding the extrapolated yields (see fig. 6 in section 3). The missing yields in the tails of the rapidity distributions are estimated by using the shape obtained from five transport models (IQMD, PHSD, GiBUU, SMASH) Hartnack et al. (1998); Cassing and Bratkovskaya (1999); Buss et al. (2012); Petersen et al. (2019); Aichelin et al. (2020) (see section 4). The respective averaged extrapolated contributions to the yields vary from 31% (30%) in central collisions to 36% (33%) in the peripheral ones for negatively (positively) charged pions. The systematic uncertainty of this extrapolation procedure is estimated by considering two extreme assumptions about the polar angle distribution of the pions (see section 3.2): (1) The polar angle distribution of the pions is assumed to be of the form () with extracted from our measurement as discussed in section 3.2. This gives a lower limit which is smaller than the estimated yield. (2) The polar angle distribution of the pions is assumed to be of the form ( with and given by the shape of the polar angle distribution of in p+p interactions at 2 GeV (see fig. 19 in Fickinger et al. (1962)). This is an upper limit, because the very forward and backward preferences will be more pronounced in p+p than in collisions. This upper limit was found to be 8 and was reduced to 5 to take the higher energy of the p+p data into account.
The statistical errors are negligible due to the large number of analyzed events. The total systematic errors sum up to 7 based on the comparison of the corrected yield in the different sectors (), as a measure of the systematic uncertainty of efficiency correction and on the errors coming from the extrapolations in rapidity () and in () (4). The different systematic uncertainties are added quadratically.
3 Results
| yield | yield 4 | |||
|---|---|---|---|---|
| [1/evt] | [1/evt] | [MeV] | [MeV] | |
| 0-40 | 7.3 0.4 | 11.1 0.6 0.6 | 44 | 87 |
| 0-10 | 11.6 0.6 | 17.1 0.9 0.9 | 46 | 91 |
| 10-20 | 8.0 0.4 | 12.1 0.6 0.6 | 43 | 85 |
| 20-30 | 5.6 0.3 | 8.7 0.4 0.4 | 42 | 82 |
| 30-40 | 3.9 0.2 | 6.3 0.3 0.3 | 41 | 79 |
| yield | yield 4 | |||
| [1/evt] | [1/evt] | [MeV] | [MeV] | |
| 0-40 | 3.9 0.2 | 6.0 0.3 0.3 | 52 | 88 |
| 0-10 | 6.2 0.3 | 9.3 0.5 0.5 | 54 | 92 |
| 10-20 | 4.3 0.2 | 6.6 0.3 0.3 | 51 | 89 |
| 20-30 | 3.0 0.2 | 4.7 0.2 0.2 | 49 | 86 |
| 30-40 | 2.1 0.1 | 3.4 0.2 0.2 | 47 | 83 |
The complete set of the corrected charged-pion measurements is given in fig. 5 together with the fits corresponding to eq. (3). The resulting slope parameters and of the transverse-mass spectra at mid-rapidity are listed in table 1. describes the slope of the low part of the spectrum which contains the bulk of the particles and is usually attributed to pions originating from decays. stands for the slope at higher which is often interpreted as a thermal component Hong et al. (1997), but can be also attributed to pions from decays of various broad higher-lying resonances.
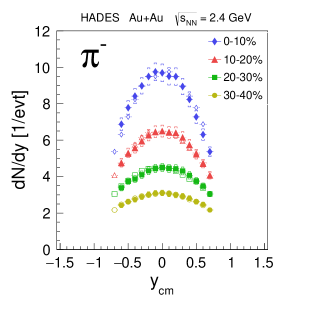
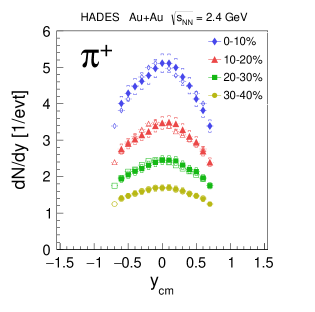
The rapidity distributions of extrapolated and integrated yields for both charges are presented in fig. 6 for the centrality classes 0-10%, 10-20%, 20-30%, and 30-40%. The yields and their errors listed in table 1 refer to the means and the scatter of the values obtained from the extrapolations in rapidity described in the previous section.
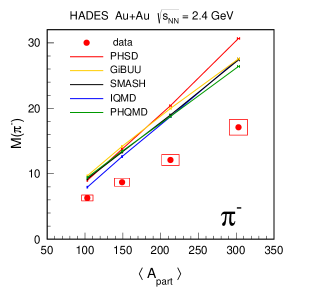
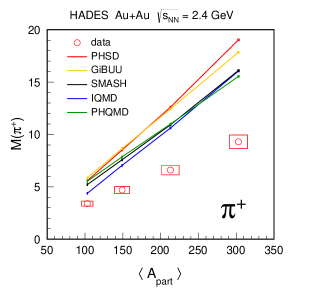
Figure 7 shows the centrality dependence of pion yields in Au+Au collisions with the centrality parameterized by the mean number of participants . The pion multiplicity per participating nucleon as a function of decreasing centrality and system size increases in our data from 0.13 in the most central Au+Au collisions (0-10) to 0.14 in the 30-40 interval, see also fig. 9 and fig 10. Note that the statistical errors are negligible and most of the systematic uncertainties partially cancel when comparing the multiplicities in different centrality classes relative to each other. The scaling of the yields with the mean number of participants is quantified by the scaling parameter , where the multiplicity is . We find for a value of and for a value of . Hence, we observe for both pion species a significantly weaker than linear scaling with the mean number of participants . Hence, we observe for both pion species a significantly weaker than linear scaling with the mean number of participants and the decrease with increasing centrality observed in fig. 9 is indeed significant.
The multiplicity of mesons is larger than the one of the due to the neutron over proton excess in the Au nucleus. Using the parameterizations from VerWest and Arndt (1982) for the energy dependence of the pion production cross sections in the different isospin channels of nucleon-nucleon interactions, the ratio can be calculated for our beam energy (1.23 A GeV). The respective value of agrees with the experimental finding of
3.1 Beam-energy and system-size dependence
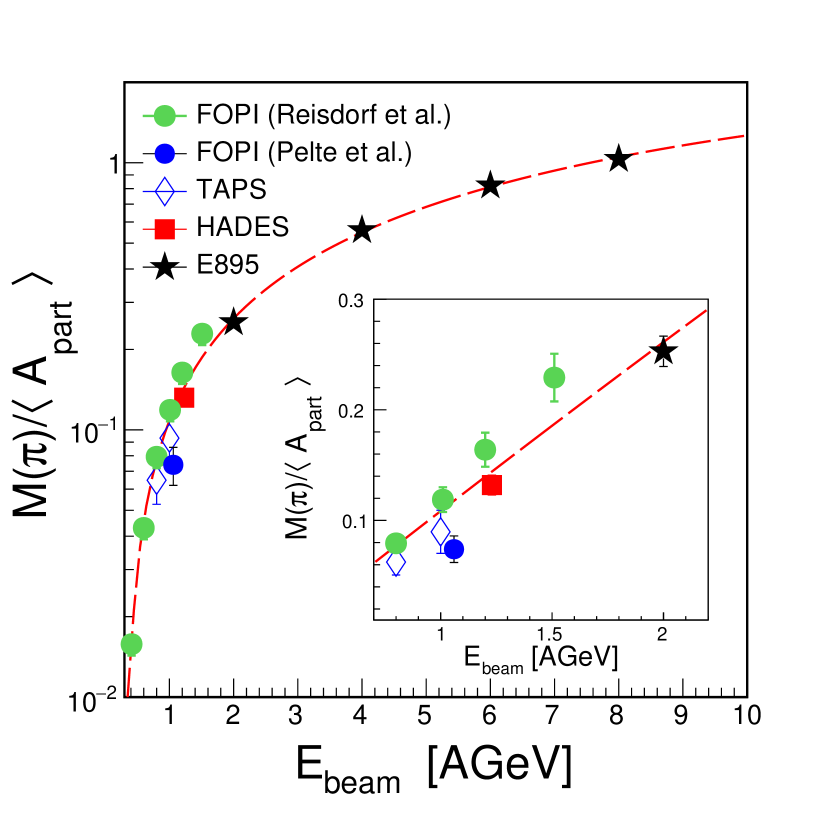
The excitation function of pion multiplicities in Au+Au collisions from threshold up to beam energies of 10 A GeV is displayed in fig. 8 and fig. 9. In the past, in this energy range pion data have been collected by the TAPS Wolf et al. (1998); Averbeck et al. (2003), the KaoS Wagner et al. (1998), the FOPI Reisdorf et al. (2007); Pelte et al. (1997) and the E895 Klay et al. (2003) experiments. The world data, together with the presented result, are plotted in terms of the normalized total pion multiplicity as a function of the beam kinetic energy where and , when not available, is approximated as . The number of participants is not a direct observable and the methods used for its estimation vary between different experiments, which puts limits on the accuracy of such a comparison (Note that all published TAPS data were extrapolated to 4 assuming isotropic emission from a source at mid-rapidity). Our results for are listed in table 2 (together with values of taken from Adamczewski-Musch et al. (2018b)) and fit well into the overall systematics of the world data.
| b | |||
|---|---|---|---|
| 0-40 | 25.6 1.8 | 193 13 | 0.0 9.3 |
| 0-10 | 40.0 2.8 | 303 12 | 0.0 4.7 |
| 10-20 | 28.4 2.0 | 213 12 | 4.7 6.6 |
| 20-30 | 20.2 1.4 | 149 10 | 6.6 8.1 |
| 30-40 | 14.4 1.0 | 103 8 | 8.1 9.3 |
We model the energy dependence of the pion multiplicity with a simple second order polynomial () (the dashed line in fig. 8). The resulting parameters are , A GeV-1, A GeV-2. It turns out that the early result from the FOPI experiment at 1 A GeV Pelte et al. (1997) is significantly below the value suggested by the world data. This has already been discussed by the FOPI collaboration in Reisdorf et al. (2007) and attributed to detector effects. Therefore we exclude this measurement in the fit. Furthermore, the FOPI data points at 1.2 and 1.5 A GeV are 25% (2.5) above our data and the trend of the world data.
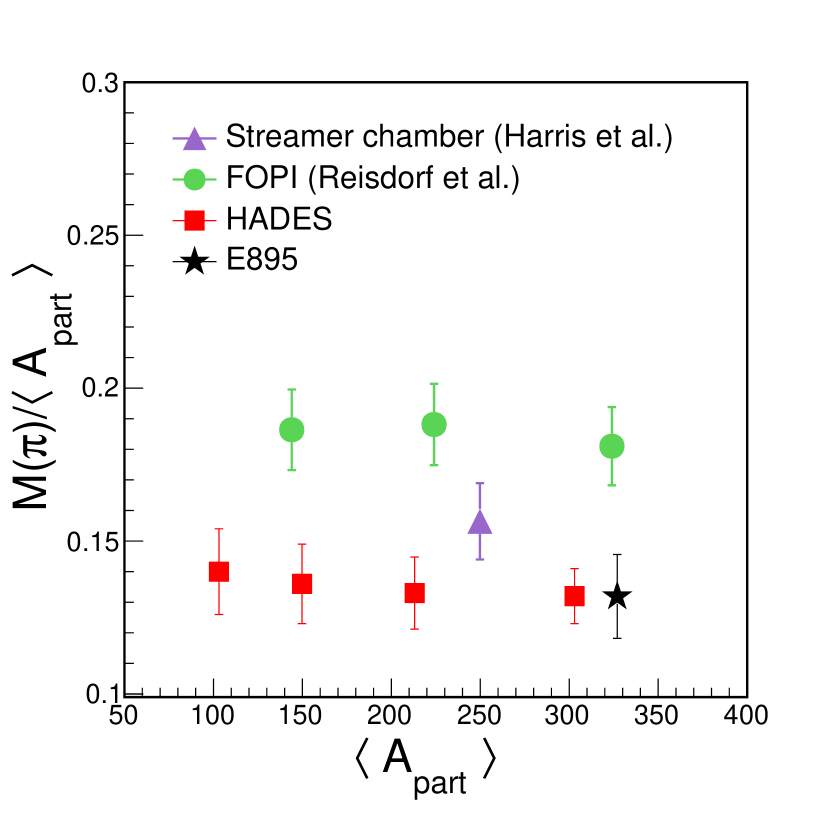
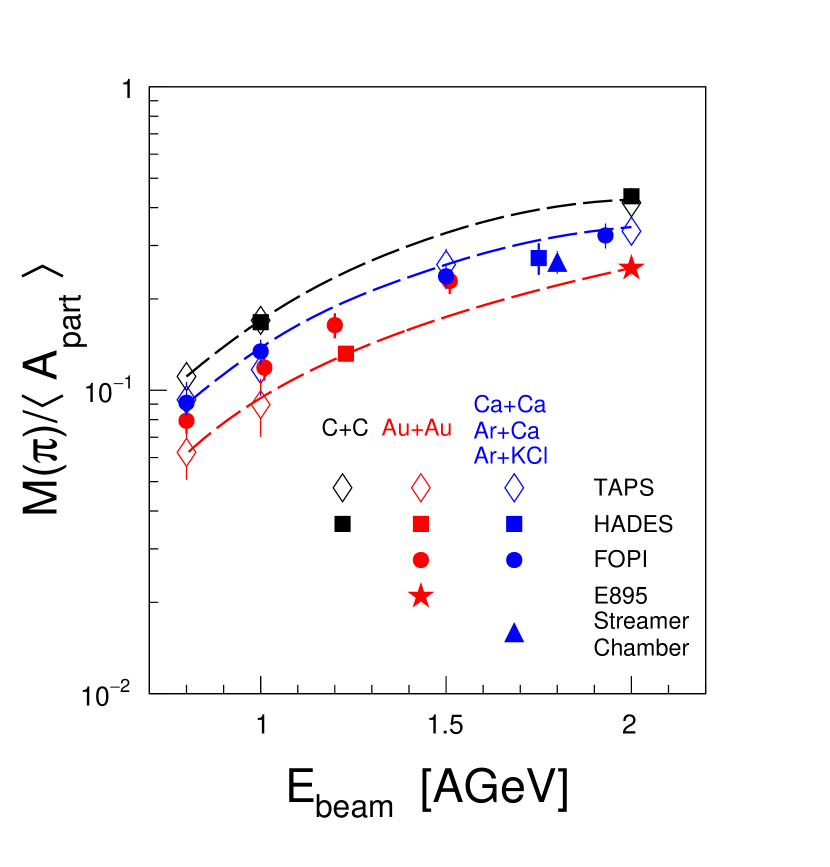
In order to compare system size dependence of pion production measured by HADES with other experiments at slightly different energies, it is necessary to scale their results to the same energy of 1.23 A GeV. This kind of scaling is done to data in fig. 9 using pion energy excitation function from fig. 8. The centrality dependence of from HADES is compared to the energy-scaled FOPI data in fig. 9. Both data sets exhibit a similar weak variation of with but differ significantly in absolute values. Also shown is the reduced pion multiplicity scaled to 1.23 A GeV obtained by E895 Klay et al. (2003) and the BEVALAC Streamer Chamber group for La+La collisions Harris et al. (1987). The FOPI results on pion multiplicity lie even above the La+La data in spite of the known trend that the reduced pion multiplicity increases with decreasing system size at a given energy Gazdzicki and Roehrich (1995). This discrepancy might be (partly) explained by the previously mentioned different methods in the estimation of the number of participants. Indeed, if one uses for the FOPI data the charge balance of the reconstructed charged particles as a centrality estimator instead Reisdorf et al. (2010), the values for come closer to our data points.
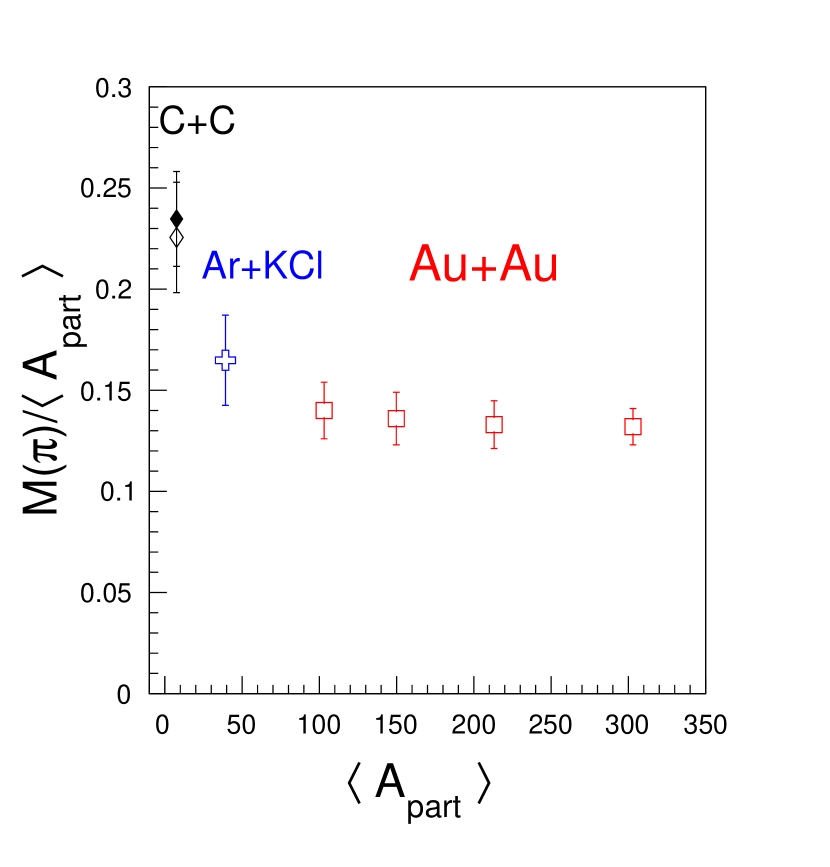
We have measured pion production also in the much lighter systems Ar+KCl Agakishiev et al. (2011a); VerWest and Arndt (1982) and C+C Agakishiev et al. (2009b) at similar beam energies. In order to examine the system-size dependence of the pion production, the yields in Ar+KCl and C+C were scaled to the beam energy of 1.23 A GeV using the curves displayed on fig. 10. The scaling factors are 0.63 for Ar+KCl at 1.76 A GeV, 1.33 for C+C at 1 A GeV and 0.54 for C+C at 2 A GeV. Figure 11 compares our centrality dependent normalized pion yields from Au+Au collisions with those of the lighter systems. While the normalized pion multiplicity varies only slightly (less than 10%) in collision systems with 100 participant nucleons and more it increases by up to 30% at 40 participants and is almost a factor of two higher at 6 participants in the light C+C system.
3.2 Polar angle distribution
So far we have parameterized the phase space of the pions by rapidity and transverse momentum or reduced transverse mass. In the following, we span the pion phase space using their c.m. polar angle and momentum . The polar angular distributions () of charged pions in heavy-ion and N+N collisions are known to be non-isotropic with a preference for forward and backward angles. This feature is also illustrated in fig. 12 for the four centrality classes. Fully isotropic emission would correspond to a flat distribution.
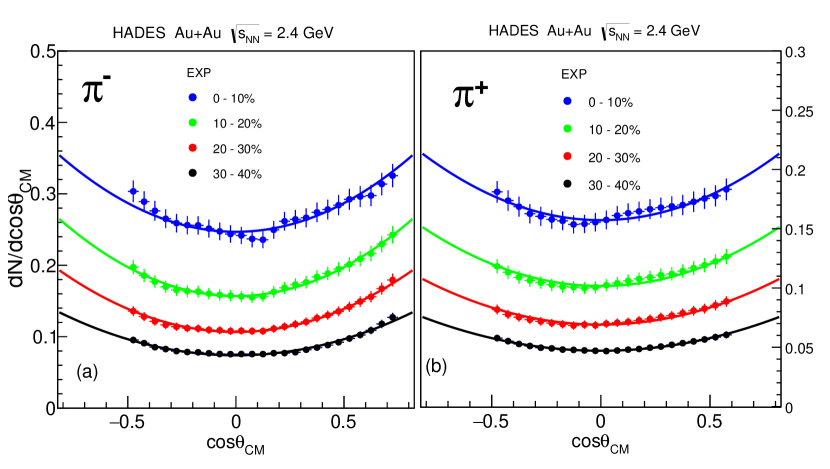
In order to quantify the deviation from isotropy, the distributions are fitted with a quadratic function of :
| (4) |
where C is a normalization factor and a parameter which quantifies the forward/backward preference of pion emission.
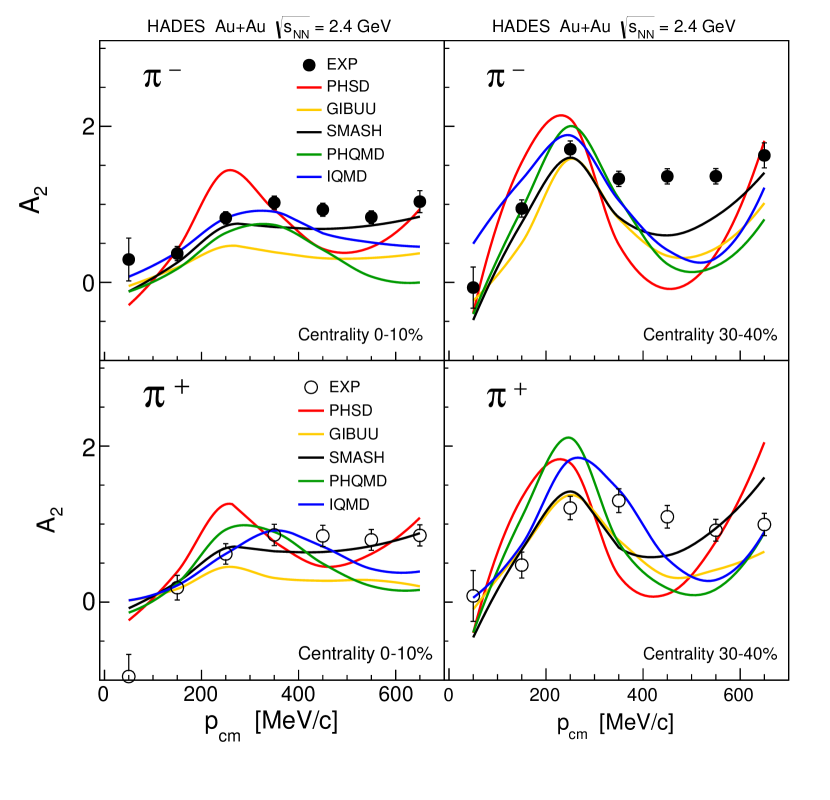
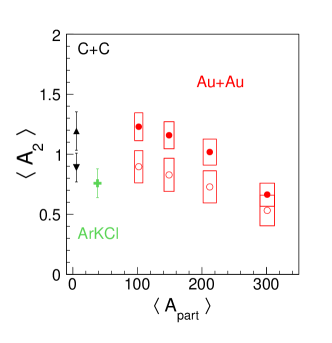
The solid curves in fig. 12 are the results of the fits. The extraction of the anisotropy parameters and their comparison with models is done within the HADES acceptance. The momentum dependence of the parameter for the most central (0-10) and the most peripheral (30-40) class is shown in fig. 13. The corresponding plots for 10-20 and 20-30 can be seen in fig. 19 of the appendix (section 6). The overall trend is that in the experimental data for the most central events (0-10), is compatible with zero at low momenta ( 50 MeV) and increases with momentum for both pion charges, saturating above 400 MeV at . In more peripheral collisions, the saturation value increases up to . We do not observe the pion energy dependence of peaking around = 200–300 MeV as seen in Ar+KCl data at 1.8 A GeV Brockmann et al. (1984). The system-size dependence of the mean (momentum-averaged over the interval 120–800 MeV) in nuclear collisions is illustrated in fig. 14. A weak but significant increase of with decreasing system size is observed for central Au+Au collisions towards Ar+KCl and C+C collisions. One can define the ratio of the anisotropic to isotropic fraction R=/(3+). In this way, for the most peripheral class measured by HADES (30-40), one obtains R=0.25, and for the most central R=0.14. Using a linear extraploation to the most central collisions with around 400 the anisotropic fraction is reduced to 8.
Concerning measurements of in p+p interactions at our beam energy, we found two inconsistent results. Reference Fickinger et al. (1962) reported measurement of of in in a bubble chamber experiment at 2 GeV which allows to determine an value in the range 0.8 - 1.6 which follows the trend given by our data in fig. 14. In reference Brockmann et al. (1984), higher than 3.0 is reported from an analysis of a counter experiment, which corresponds to R0.5. In view of these contradicting results we refrain from presenting a data point of for p+p interactions.
4 Comparison with transport models
| PHSD | IQMD | PHQMD | GiBUU | SMASH | EXP 4 | |
| 0-10 | 30 | 28 | 26 | 27 | 28 | 17.1 0.8 0.9 |
| 10-20 | 20 | 19 | 19 | 20 | 19 | 12.1 0.6 0.6 |
| 20-30 | 14 | 13 | 13 | 14 | 13 | 8.7 0.4 0.4 |
| 30-40 | 9 | 8 | 9 | 10 | 9 | 6.3 0.3 0.3 |
| 1.13 0.01 | 1.09 0.03 | 0.95 0.01 | 1.02 0.01 | 1.03 0.03 | 0.93 0.01 | |
| PHSD | IQMD | PHQMD | GiBUU | SMASH | EXP 4 | |
| 0-10 | 19 | 16 | 16 | 18 | 16 | 9.3 0.4 0.4 |
| 10-20 | 13 | 11 | 11 | 12 | 11 | 6.6 0.3 0.3 |
| 20-30 | 9 | 7 | 8 | 9 | 8 | 4.7 0.2 0.2 |
| 30-40 | 6 | 4 | 6 | 6 | 5 | 3.4 0.2 0.1 |
| 1.12 0.03 | 1.19 0.03 | 0.93 0.01 | 1.04 0.03 | 1.03 0.01 | 0.94 0.01 |
In the following the data will be compared to five state-of-the-art microspopic transport models: ”Isospin Quantum Molecular Dynamics” (IQMD vi.c8) Hartnack et al. (1998), ”Parton Hadron String Dynamics” (PHSD v.4) Cassing and Bratkovskaya (1999), ”Parton-Hadron-Quantum-Molecular Dynamics” (PHQMD v1) Aichelin et al. (2020), ”Simulating Many Accelerated Strongly-Interacting Hadrons” (SMASH) Petersen et al. (2019); Weil et al. (2016), and ”Giessen Boltzmann-Uehling-Uhlenbeck” (GiBUU, release 2019) Buss et al. (2012) 111During the preparation of the paper, we were contacted by the UrQMD authors and informed that they are revisiting and improving their code with respect to pion production at low energies. Therefore, we refrain from showing any results from this model.. We study the differences between model predictions as observed in the rapidity, transverse momentum, and polar angle distributions of charged pions, in the trends of the parameter as a function of and system size, and in the predicted abundance of resonances as well. In the models, the selection of four centrality classes is done by selecting the corresponding impact-parameter intervals (see table 2) according to the values estimated in Adamczewski-Musch et al. (2018a). We find that all models over-predict the pion yields for all centralities by factors ranging from 1.2 to 2.1 (see table 3, fig. 7 and fig. 15).
The yields of charged pions have already been shown as a function of in fig. 7 together with the results of the model calculations. Most of the model calculations give a linear or slightly stronger than linear dependence (), only PHQMD agrees with the significantly weaker scaling observed in our data (see table 3).
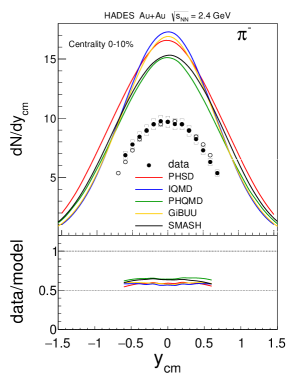
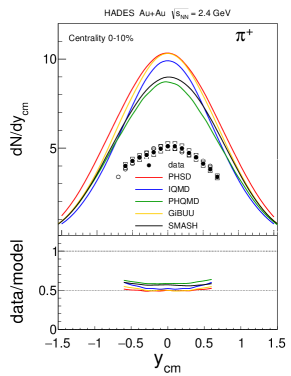
The yields and shapes of the rapidity distributions are compared in fig. 15. In the lower panels the ratio of the experimental and model data quantify both the yield excess and differences in shape. All models tend to have slightly wider (narrower) () distributions than observed in the experiment.
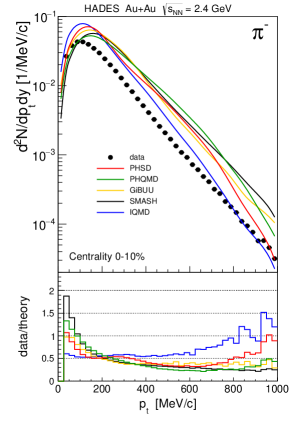
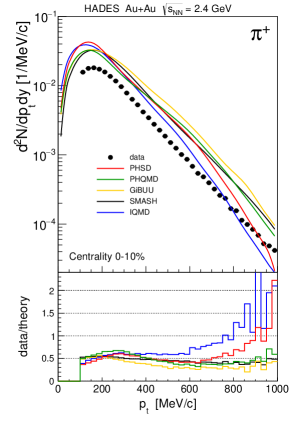
The transverse-momentum distributions are compared in fig. 16. In the case of negatively charged pions, all models besides IQMD show similar dependences. However, the slopes are clearly steeper than observed in the data, which is in particular evident from the ratio plot (lower panels). IQMD, on the other hand, predicts a dependence similar to the data and thus the data/theory ratio has a rather flat dependence on up to 600 MeV. For , a rather flat data/theory ratio is observed for all models. The high region resulting from IQMD and PHQMD calculations are steeper than those of the experimental data and from the other models. In all of the presented models, the bulk of the pion yield stems from the decays of resonances. Higher-mass states are incorporated at different levels, as specified in table 4 of the appendix (section 6). In the IQMD model, the is the only source of pions and, as discussed in Bass et al. (1998), all inelastic NN cross sections are projected onto the excitation of this particular resonance.
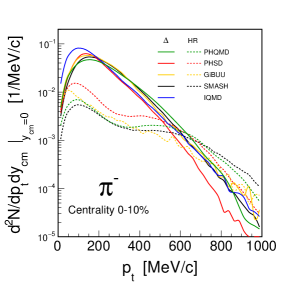
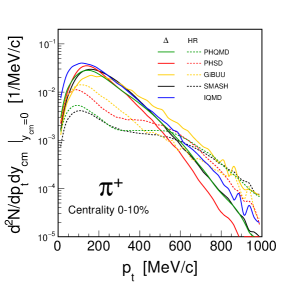
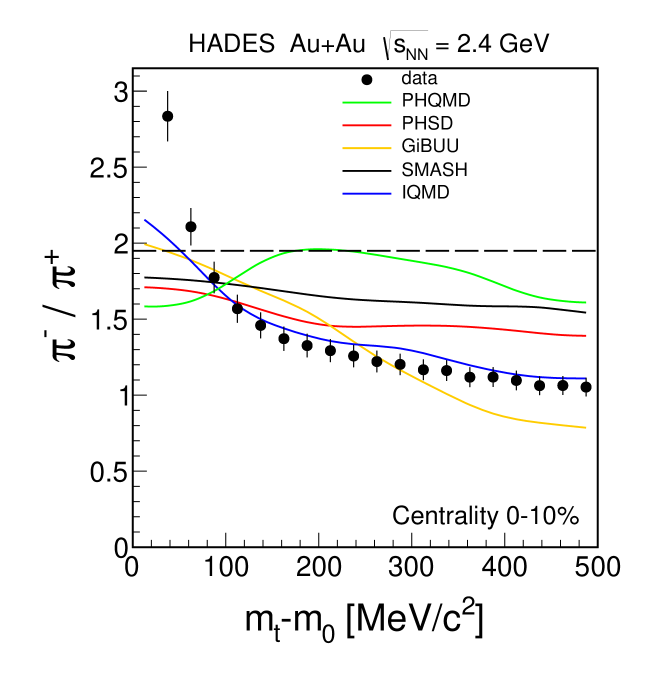
Since all models overpredict the pion multiplicity significantly, one may ask whether the treatment of the resonances is at the origin of this ”pion excess”. To this end, we have studied the resonance contributions to the transverse-momentum distributions of and mesons. The result of this investigation is shown in fig. 17. For both and , PHQMD and SMASH have very similar shapes of the component, but PHSD has a steeper slope than the two. Negative pions from in GiBUU are consistent with SMASH and PHQMD while positive pions have a less steep slope. In IQMD negative pions are shifted towards lower . Overall, heavy resonances are a minor source of pions at low while they contribute to about 50 to the yield above 600 MeV. Thus, both the pions from the and those from higher-lying resonances boost up the pion yield, although in different transverse-momentum regions. Comparing models to an analysis of exclusive channels in elementary reactions, as done e.g. in Agakishiev et al. (2014), might be a promising avenue to follow in order to scrutinize the different incorporations of higher-lying baryonic resonances in the models. In section 2, the mid-rapidity transverse-momentum distributions of both, and were found to deviate significantly from the Boltzmann shape (2) at low . These deviation were attributed to the Coulomb interaction with the central positive charge distribution. This subject is addressed again in fig. 18 which shows the reduced transverse-mass dependence of and ratio for data and model calculations. The ratio remains rather constant for PHSD and SMASH, but not for PHQMD. The small variations might be due to the different energy dependence of and inelastic cross sections, as pointed out in Bass et al. (1995). The experimental ratio exhibits a monotonic increase with decreasing and a steep rise below 100 MeV/c. A rise at low transverse momentum is also visible in IQMD and GiBUU, but much less pronounced. These two transport models are the only ones which have the Coulomb interaction implemented in their codes. The significant deviations from data at low pt could mean that the Coulomb potential assumed in the models is smaller than in the actual collision system.
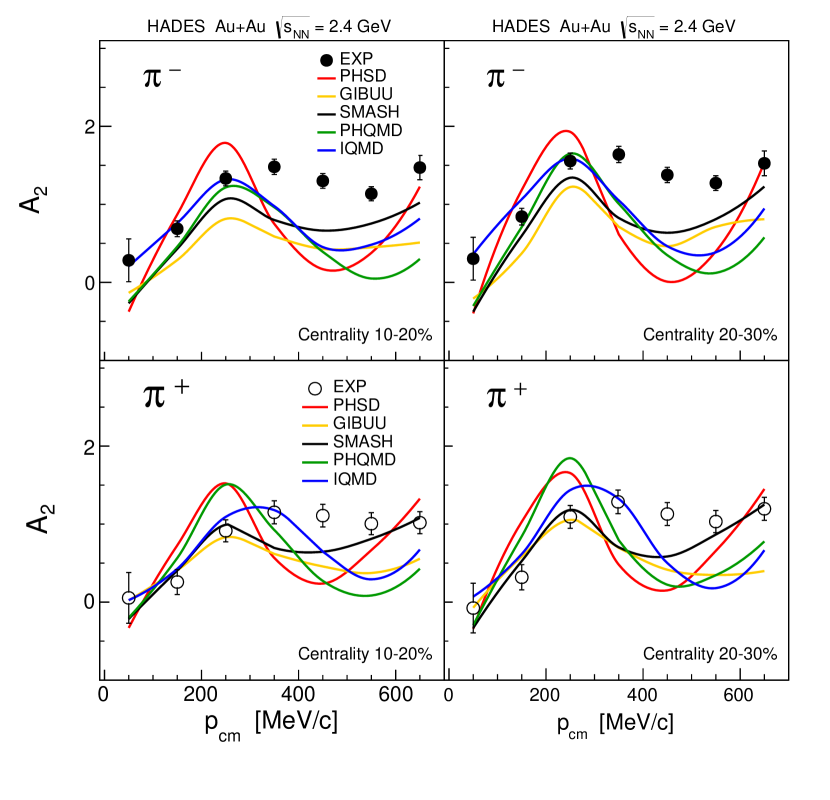
In section 3.2 the polar angle distributions of charged pions were characterized by the parameter . Its dependence on for four 10 centrality classes was shown in fig. 13, together with the results of the model calculations. For the most central (0-10 ) class (upper row) the differences between data and models are moderate except for PHSD which exhibits a significant variation with . The situation becomes more involved if one takes the other three centrality classes into account (see fig. 13). Here, the structures in the data have slightly higher amplitudes. The models, however, develop a strong single oscillation, whose amplitude increases with decreasing centrality.
5 Summary
In summary, we have presented a comprehensive study of emission in Au+Au collisions at GeV. The data is discussed as a function of the transverse momentum (reduced transverse mass) as well as the rapidity in four centrality classes covering the most central events. We find that our results on the pion multiplicity fit well into the overall systematic of the world data, but are lower by in yield when comparing to data from a FOPI experiment performed at a slightly lower collision energy. The pion multiplicity per participating nucleon increases as a function of decreasing centrality and system size from 0.13 in the most central Au+Au collisions to 0.14 at centrality and to 0.23 in minimum-bias C+C collisions with six participant nucleons only. The polar angular distributions are found to be non-isotropic even for the most central event class. The experimental data are compared to several state-of-art transport model calculations. All of the models substantially overestimate the absolute yields and only PHQMD is able to describe the moderate decrease of pion multiplicity per participating nucleon as a function of increasing centrality. While the shape of the rapidity distribution is fairly well reproduced by all models, the shape of the reduced transverse-mass spectra as well as the anisotropy parameter are, however, not described satisfactorily by any. Decomposing the contributions to the pion spectra of the various resonances implemented in the different models, we find significant variations in both relative yield and shape of these different pion sources. Data on pion-induced reactions on H2 and nuclear targets as well as new high-precision measurements of the collision system Ag+Ag at =2.55 GeV, taken as part of FAIR Phase0, will become available soon. These upcoming results will be used to further extend the world database on pion production and to constrain model calculations ever more stringently.
Acknowledgements.
The HADES collaboration thanks W. Reisdorf, N. Herrmann, Y. Leifels, J. Weil, E. Bratkovskaya, J. Aichelin, C. Hartnack, R. Stock, M. Gazdzicki, M. Bleicher, J. Steinheimer, Y. Nara, and K. Gallmeister for elucidating discussions. SIP JUC Cracow, Cracow (Poland), National Sience Center, 2017/25/N/ST2/00580, 2017/26/M/ST2/00600; TU Darmstadt, Darmstadt (Germany), VH-NG-823, DFG GRK 2128, DFG CRC-TR 211, BMBF:05P18RDFC1; Goethe-University, Frankfurt(Germany), HIC for FAIR (LOEWE), BMBF:06FY9100I, BMBF:05P19RFFCA, GSI FE; Goethe-University, Frankfurt(Germany) and TU Darmstadt, Darmstadt (Germany), ExtreMe Matter Institute EMMI at GSI Darmstadt (Germany); TU Muenchen, Garching (Germany), MLL Muenchen, DFG EClust 153, GSI TMLRG1316F, BMBF 05P15WOFCA, SFB 1258, DFG FAB898/2-2; NRNU MEPhI Moscow, Moscow (Russia), in framework of Russian Academic Excellence Project 02.a03.21.0005, Ministry of Science and Education of the Russian Federation 3.3380.2017/4.6; JLU Giessen, Giessen (Germany), BMBF:05P12RGGHM; IPN Orsay, Orsay Cedex (France), CNRS/IN2P3; NPI CAS, Rez, Rez (Czech Republic), MSMT LM2015049, OP VVV CZ.02.1.01/0.0/0.0/16 013/0001677, LTT17003.6 Appendix
Here supplementary information to the main text is provided. Figure 19 extends fig. 13, showing for two more centrality selections (10-20% and 20-30%) the dependence of the anisotropy parameter A2 on c.m. momentum for negatively and positevely charged pions, respectively. Table 4 lists the baryon and meson resonances which were included in the transport calculations discussed in section 4.
| Rating | PHSD/PHQMD | SMASH | GiBUU | Rating | PHSD/PHQMD | SMASH | GiBUU | ||
|---|---|---|---|---|---|---|---|---|---|
| (1232) | **** | ||||||||
| (1600) | **** | ||||||||
| (1620) | **** | ||||||||
| N(1440) | **** | (1700) | **** | ||||||
| N(1520) | **** | (1750) | * | ||||||
| N(1535) | **** | (1900) | *** | ||||||
| N(1650) | **** | (1905) | **** | ||||||
| N(1675) | **** | (1910) | **** | ||||||
| N(1680) | **** | (1920) | *** | ||||||
| N(1700) | *** | (1930) | *** | ||||||
| N(1710) | **** | (1940) | ** | ||||||
| N(1720) | **** | (1950) | **** | ||||||
| N(1860) | ** | (2000) | ** | ||||||
| N(1875) | *** | (1405) | **** | ||||||
| N(1880) | *** | (1520) | **** | ||||||
| N(1895) | **** | (1600) | *** | ||||||
| N(1900) | **** | (1670) | **** | ||||||
| N(1990) | ** | (1690) | **** | ||||||
| N(2000) | ** | (1710) | * | ||||||
| (1800) | *** | ||||||||
| (1810) | *** | ||||||||
| (1820) | **** | ||||||||
| (1830) | **** | ||||||||
| (1890) | **** | ||||||||
| (2000) | * |
References
- Stock (1986) R. Stock, Phys. Rept. 135, 259 (1986).
- Muntz et al. (1995) C. Muntz et al., Z. Phys. A 352, 175 (1995).
- Wagner et al. (1998) A. Wagner et al., Phys. Lett. B 420, 20 (1998), arXiv:nucl-ex/9712004 .
- Reisdorf et al. (2007) W. Reisdorf et al. (FOPI), Nucl. Phys. A 781, 459 (2007), arXiv:nucl-ex/0610025 .
- Pelte et al. (1997) D. Pelte et al. (FOPI), Z. Phys. A 357, 215 (1997).
- Wolf et al. (1998) A. Wolf et al., Phys. Rev. Lett. 80, 5281 (1998).
- Averbeck et al. (2003) R. Averbeck, R. Holzmann, V. Metag, and R. Simon, Phys. Rev. C 67, 024903 (2003), arXiv:nucl-ex/0012007 .
- Averbeck et al. (1997) R. Averbeck et al. (TAPS), Z. Phys. A 359, 65 (1997).
- Holzmann et al. (1997) R. Holzmann et al. (TAPS), Phys. Rev. C 56, 2920 (1997).
- Harris et al. (1987) J. Harris et al., Phys. Rev. Lett. 58, 463 (1987).
- Klay et al. (2003) J. Klay et al. (E-0895), Phys. Rev. C 68, 054905 (2003), arXiv:nucl-ex/0306033 .
- Nagamiya et al. (1981) S. Nagamiya, M. Lemaire, E. Moller, S. Schnetzer, G. Shapiro, H. Steiner, and I. Tanihata, Phys. Rev. C 24, 971 (1981).
- Adamczewski-Musch et al. (2019a) J. Adamczewski-Musch et al. (HADES), Phys. Lett. B 795, 446 (2019a), arXiv:1811.06213 [nucl-ex] .
- Adamczewski-Musch et al. (2019b) J. Adamczewski-Musch et al. (HADES), (2019b), arXiv:1910.07885 [nucl-ex] .
- Hartnack et al. (1998) C. Hartnack, R. K. Puri, J. Aichelin, J. Konopka, S. Bass, H. Stoecker, and W. Greiner, Eur. Phys. J. A 1, 151 (1998), arXiv:nucl-th/9811015 .
- Cassing and Bratkovskaya (1999) W. Cassing and E. Bratkovskaya, Phys. Rept. 308, 65 (1999).
- Buss et al. (2012) O. Buss, T. Gaitanos, K. Gallmeister, H. van Hees, M. Kaskulov, O. Lalakulich, A. Larionov, T. Leitner, J. Weil, and U. Mosel, Phys. Rept. 512, 1 (2012), arXiv:1106.1344 [hep-ph] .
- Petersen et al. (2019) H. Petersen, D. Oliinychenko, M. Mayer, J. Staudenmaier, and S. Ryu, Nucl. Phys. A 982, 399 (2019), arXiv:1808.06832 [nucl-th] .
- Weil et al. (2016) J. Weil et al., Phys. Rev. C 94, 054905 (2016), arXiv:1606.06642 [nucl-th] .
- Aichelin et al. (2020) J. Aichelin, E. Bratkovskaya, A. Le Fèvre, V. Kireyeu, V. Kolesnikov, Y. Leifels, V. Voronyuk, and G. Coci, Phys. Rev. C 101, 044905 (2020), arXiv:1907.03860 [nucl-th] .
- Adamczewski-Musch et al. (2019c) J. Adamczewski-Musch et al. (HADES), Nature Phys. 15, 1040 (2019c).
- Agakichiev et al. (2007) G. Agakichiev et al. (HADES), Phys. Rev. Lett. 98, 052302 (2007), arXiv:nucl-ex/0608031 .
- Agakishiev et al. (2011a) G. Agakishiev et al. (HADES), Phys. Rev. C 84, 014902 (2011a), arXiv:1103.0876 [nucl-ex] .
- Agakishiev et al. (2009a) G. Agakishiev et al. (HADES), Phys. Rev. C 80, 025209 (2009a), arXiv:0902.3487 [nucl-ex] .
- Agakishiev et al. (2009b) G. Agakishiev et al. (HADES), Eur. Phys. J. A 40, 45 (2009b), arXiv:0902.4377 [nucl-ex] .
- Agakishiev et al. (2009c) G. Agakishiev et al. (HADES), Phys. Rev. Lett. 103, 132301 (2009c), arXiv:0907.3582 [nucl-ex] .
- Agakishiev et al. (2010) G. Agakishiev et al. (HADES), Phys. Rev. C 82, 021901 (2010), arXiv:1004.2328 [nucl-ex] .
- Agakishiev et al. (2011b) G. Agakishiev et al. (HADES), Eur. Phys. J. A 47, 63 (2011b).
- Agakishiev et al. (2015) G. Agakishiev et al., Phys. Rev. Lett. 114, 212301 (2015), arXiv:1501.03894 [nucl-ex] .
- Adamczewski-Musch et al. (2018a) J. Adamczewski-Musch et al. (HADES), Phys. Lett. B 781, 735 (2018a), arXiv:1711.05559 [nucl-ex] .
- Agakishiev et al. (2009d) G. Agakishiev et al. (HADES), Eur. Phys. J. A 41, 243 (2009d), arXiv:0902.3478 [nucl-ex] .
- Adamczewski-Musch et al. (2018b) J. Adamczewski-Musch et al. (HADES), Eur. Phys. J. A 54, 85 (2018b), arXiv:1712.07993 [nucl-ex] .
- Bass et al. (1998) S. Bass et al., Prog. Part. Nucl. Phys. 41, 255 (1998), arXiv:nucl-th/9803035 .
- Brun et al. (1987) R. Brun, F. Bruyant, M. Maire, A. McPherson, and P. Zanarini, (1987).
- Barz et al. (1998) H. Barz, J. Bondorf, J. Gaardhoje, and H. Heiselberg, Phys. Rev. C 57, 2536 (1998), arXiv:nucl-th/9711064 .
- Fickinger et al. (1962) W. Fickinger, E. Pickup, D. Robinson, and E. Salant, Phys. Rev. 125, 2082 (1962).
- Hong et al. (1997) B. Hong et al. (FOPI), Phys. Lett. B 407, 115 (1997), arXiv:nucl-ex/9706001 .
- VerWest and Arndt (1982) B. VerWest and R. Arndt, Phys. Rev. C 25, 1979 (1982).
- Agakishiev et al. (2008) G. Agakishiev et al. (HADES), Phys. Lett. B 663, 43 (2008), arXiv:0711.4281 [nucl-ex] .
- Sandoval et al. (1980) A. Sandoval, R. Stock, H. Stelzer, R. Renfordt, J. Harris, J. Brannigan, J. Geaga, L. Rosenberg, L. Schroeder, and K. Wolf, Phys. Rev. Lett. 45, 874 (1980).
- Gazdzicki and Roehrich (1995) M. Gazdzicki and D. Roehrich, Z. Phys. C 65, 215 (1995).
- Reisdorf et al. (2010) W. Reisdorf et al. (FOPI), Nucl. Phys. A 848, 366 (2010), arXiv:1005.3418 [nucl-ex] .
- Brockmann et al. (1984) R. Brockmann et al., Phys. Rev. Lett. 53, 2012 (1984).
- Agakishiev et al. (2014) G. Agakishiev et al., Eur. Phys. J. A 50, 82 (2014), arXiv:1403.3054 [nucl-ex] .
- Bass et al. (1995) S. Bass, C. Hartnack, H. Stoecker, and W. Greiner, Phys. Rev. C 51, 3343 (1995), arXiv:nucl-th/9501002 .
- Olive et al. (2014) K. Olive et al. (Particle Data Group), Chin. Phys. C 38, 090001 (2014).