Nature of Compton-thick Active Galactic Nuclei in “Non-merging” Luminous Infrared Galaxies UGC 2608 and NGC 5135 Revealed with Broadband X-ray Spectroscopy
Abstract
We have analyzed the broadband X-ray spectra of active galactic nuclei (AGNs) in two “non-merging” luminous infrared galaxies (LIRGs) UGC 2608 and NGC 5135, utilizing the data of NuSTAR, Suzaku, XMM-Newton, and Chandra. Applying the X-ray clumpy-torus model (XCLUMPY: Tanimoto et al. 2019), we find that both sources have similar spectra characterized by Compton-thick (CT) absorption ( 5–7 cm-2) and small torus angular width (). The intrinsic 2–10 keV luminosities are erg s-1 (UGC 2608) and erg s-1 (NGC 5135). The [O IV]-to-nuclear-12 m luminosity ratios are larger than those of typical Seyferts, which are consistent with the torus covering factors ( 0.7) estimated from the torus angular widths and column densities by X-ray spectroscopy. The torus covering factors and Eddington ratios ( 0.1) follow the relation found by Ricci et al. (2017a) for local AGNs, implying that their tori become geometrically thin due to significant radiation pressure of the AGN that blows out some part of the tori. These results indicate that the CT AGNs in these “non-merger” LIRGs are just a normal AGN population seen edge-on through a large line-of-sight column density. They are in contrast to the buried CT AGNs in late-stage mergers that have large torus covering factors even at large Eddington ratios.
1 Introduction
Luminous111LIRGs: (8–1000 m) 1011L⊙ = 3.828 erg s-1 and ultraluminous222ULIRGs: (8–1000 m) 1012L⊙ = 3.828 erg s-1 infrared galaxies (U/LIRGs; see Sanders & Mirabel 1996 for a review) are key populations to understand the co-evolution of galactic bulges and their central supermassive black holes (SMBHs). They are powered by starburst and active galactic nucleus (AGN) activities hidden behind gas and dust. The integrated infrared (IR) luminosity of U/LIRGs constitutes a dominant fraction of the total radiation density at , which is much larger than that directly visible in the UV band (Madau & Dickinson, 2014). Hence, they trace major processes of star formation and SMBH growth in the cosmic history.
As a possible explanation for the cosmic “downsizing” of galaxies and SMBHs (Cowie et al., 1996; Ueda et al., 2003), it has been suggested that the triggering mechanisms of star formation and mass accretion onto SMBHs may have two channels: more massive galaxies and SMBHs are formed via “major mergers” at higher redshifts, while less massive galaxies and SMBHs are former via “secular processes” at lower redshifts (e.g., Kormendy et al., 2011; Draper & Ballantyne, 2012; Alexander & Hickox, 2012; Barro et al., 2013; Tadaki et al., 2014). In fact, morphological studies revealed that LIRGs were generally a mix of mergers and single isolated disk galaxies at (e.g., Wang et al., 2006; Kartaltepe et al., 2010). According to the above scenario, it is expected that the structure of AGNs in “merging” LIRGs and “non-merging” ones may be largely different because of the different AGN triggering mechanisms, even if their IR luminosities (hence star formation rates; SFRs) are similar. Previous studies of “merging” U/LIRGs revealed that at late merger stages the AGNs often became deeply “buried” with large torus covering factors by circumnuclear material of gas and dust (probed in the 1–80 keV broadband X-ray band; e.g., Ricci et al. 2017b) and also of dust (probed in the 1–60 m near-IR to far-IR band; e.g., Sanders et al. 1988; Imanishi et al. 2008; Yamada et al. 2019). It is thus essential to investigate the properties of AGNs in “non-merging” LIRG utilizing the X-ray and IR data, for a full understanding of whether or not they have distinct characteristics from those in “merging” LIRGs.
In this work, we focus on AGNs in U/LIRGs with no signs of mergers from a complete flux-limited sample of the Great Observatories All-sky LIRG Survey (GOALS; Armus et al. 2009), which consists of 22 ULIRGs and 180 LIRGs having (60 m) Jy in the local () universe. The GOALS sample contains 12 non-merging LIRGs (according to Stierwalt et al. 2013) that were observed with Nuclear Spectroscopic Telescope Array (NuSTAR; Harrison et al. 2013), the first focusing telescope in orbit operating at 10 keV, by Cycle-4. Among them, NGC 1068 and NGC 7130 are recently reported that they show features of past mergers (Davies et al., 2014; Tanaka et al., 2017), and thus are excluded. We also exclude NGC 1275 (a radio galaxy in the Perseus cluster) and NGC 1365 (showing variable absorption; e.g., Rivers et al. 2015) from our sample as exceptional sources. Performing the same data reduction in Section 2.1, we find that the 6 objects, UGC 2612, NGC 4418, IC 860, NGC 5104, NGC 6907, and NGC 7591 are either undetected or detected only below 10 keV with NuSTAR. Thus, we select UGC 2608 and NGC 5135 as the best targets for our study.
UGC 2608 ( 0.0233, log = 11.4) and NGC 5135 ( 0.0137, log = 11.3) are classified as nonmergers from the Spitzer/IRAC 3.6 m and the high resolution Hubble Space Telescope (HST) data (Stierwalt et al., 2013). Optically the sources were classified as Seyfert 2s (Véron-Cetty & Véron, 2003). AGN signatures were also detected at the mid-IR wavelengths on the basis of the 6.2 m polycyclic aromatic hydrocarbon (PAH) equivalent widths and the [Ne V] 14.32 m line luminosities (Inami et al., 2013). The properties of AGNs and starbursts are constrained in the IR band by spectral energy distribution (SED) fitting (e.g., Shangguan et al., 2019).
The nature of the AGNs in UGC 2608 and NGC 5135 are still unclear because of their heavily obscuration. Using XMM-Newton data, Guainazzi et al. (2005) suggested that UGC 2608 contains a heavily obscured AGN with cm-2, which is Compton-thick (CT) level (i.e., cm-2). With Chandra, Levenson et al. (2004) found that the AGN in NGC 5135 is heavily obscured with cm-2. However, their intrinsic luminosities were not accurately estimated only from the X-ray observations below 10 keV. Suzaku detected narrow Fe K lines of large equivalent widths (EWs), keV for UGC 2608 and keV for NGC 5135, which are possible evidence for CT AGNs (Fukazawa et al., 2011; Singh et al., 2012), whereas the flux uncertainties above 10 keV are large due to the limited photon statistics. The more sensitive hard X-ray data of NuSTAR observations enable us to characterize the properties of these AGNs.
In this paper, we analyze the best quality broadband X-ray spectra
of UGC 2608 and NGC 5135, utilizing the data of NuSTAR,
Suzaku, XMM-Newton, and Chandra. The
paper is organized as follows. In Section 2, we describe
the observations and data reduction. Section 3 reports
our results of the spectral analysis using two models: a baseline
model and a Monte Carlo-based model from a clumpy torus
(XCLUMPY; Tanimoto et al. 2019). We discuss the implications from our
results in Section 4. Our findings are summarized in
Section 5. Throughout the paper, we adopt the
cosmological parameters of = 70 km s-1 Mpc-1,
= 0.27, and = 0.73. All errors
correspond to the 90% confidence level for a single interesting
parameter.
| Object | Satellite | Instrument | ObsID | UT Observation Date | Net Exp. (ks) |
|---|---|---|---|---|---|
| UGC 2608 | NuSTAR | FPMA, FPMB | 60001161002 | 2014 Oct 08 17:06:07 | 22.1/22.2 |
| Suzaku | XIS-0, 1, 3 | 701007020 | 2007 Feb 04 18:21:52 | 39.5 | |
| XMM-Newton | EPIC/MOS1, 2, pn | 0002942401 | 2002 Jan 28 16:56:46 | 4.8/4.8/2.1 | |
| NGC 5135 | NuSTAR | FPMA, FPMB | 60001153002 | 2015 Jan 14 15:31:07 | 33.4/32.5 |
| Suzaku | XIS-0, 1, 3 | 702005010 | 2007 Jul 03 05:59:41 | 52.5 | |
| Chandra | ACIS-S | 2187 | 2001 Sep 04 15:22:37 | 29.3 |
2 Observations and Data Reduction
The observation logs of UGC 2608 and NGC 5135 are summarized in Table 1. The X-ray spectral analysis is carried out by combining the NuSTAR data (Section 2.1) with those of Suzaku (Section 2.2), XMM-Newton (Section 2.3), and Chandra (Section 2.4).
2.1 NuSTAR
NuSTAR (Harrison et al., 2013) is the first satellite capable of focusing hard X-rays above 10 keV, covering the 3–79 keV band. It consists of two co-aligned X-ray telescopes coupled with focal plane modules (FPMA and FPMB; FPMs). NuSTAR observed UGC 2608 for a net exposure of 22 ks on 2014 October 8 (ObsID = 60001161002) and NGC 5135 for 33 ks on 2015 January 14 (ObsID = 60001153002). The NuSTAR data were processed with the NuSTAR Data Analysis Software nustardas v1.8.0 included in heasoft v6.25, by adopting the calibration files released on 2019 May 13. The nupipeline script was used to produce calibrated and cleaned event files with the saamode=optimized and tentacle=yes options. The source spectra and light curves were extracted from a circular region with a radius of 50″ by using the nuproducts task. The background was taken from a nearby source-free circular region with a radius of 100″. We confirmed that the spectra and light curves showed good agreement between FPMA and FPMB, and then we coadded them to improve the photon statistics with the addascaspec and lcmath tasks, respectively. The 3–24 keV light curves of the sources show no evidence of significant flux variability on a time scale longer than 5820 s (the orbital period of NuSTAR). The spectral bins were grouped to contain at least 50 and 60 counts for UGC 2608 and NGC 5135, respectively, in order to facilitate the use of statistics and not to lose energy resolution by overbinning.
2.2 Suzaku
UGC 2608 and NGC 5135 were observed with Suzaku (Mitsuda et al., 2007) in 2007 February and July, respectively. Suzaku, the fifth Japanese X-ray satellite, carries four X-ray CCD cameras called the X-ray Imaging Spectrometer (XIS-0, XIS-1, XIS-2, and XIS-3), covering the energy band of 0.2–12 keV. XIS-0, XIS-2, and XIS-3 are frontside-illuminated cameras (XIS-FIs) and XIS-1 is a backside-illuminated one (XIS-BI). XIS-2 data were not available for both objects due to the malfunction that had occurred in 2006 November. We used the Suzaku calibration database released on 2018 October 23 for generating the cleaned event files with the recommended filtering options. Source photons were extracted from a circular region with a radius of 2.4′ centered on the source center, and the background was from two source-free circular regions with radii of 2.2′. We generated the XIS response matrix files (RMF) with xisrmfgen and ancillary response files (ARF) with xissimarfgen (Ishisaki et al., 2007). All the spectra of the XIS-FIs available in each observation were combined together. The XIS spectra of UGC 2608 and NGC 5135 were rebinned to contain at least 70 and 80 counts per energy bin, respectively. We decided not to use the data of the Hard X-ray Detector (HXD) in our analysis, due to the much poorer photon statistics than those of the NuSTAR data in these faint targets and possible systematic uncertainties in the HXD background model (Fukazawa et al., 2009).
2.3 XMM-Newton
The XMM-Newton (Jansen et al., 2001) observation of UGC 2608 was performed on 2002 January 28. We analyzed the data of two EPIC/MOS (MOS1, MOS2) and EPIC/pn reprocessed with the XMM-Newton Science Analysis System (sas: Gabriel et al. 2004) v17.0.0 and Current Calibration Files (CCF) of 2018 June 22. The raw MOS and pn data files were reduced with the emproc and epproc tasks, respectively. We selected good events with PATTERN 12 for MOS and PATTERN 4 for pn. To filter out the periods of background flares, we excluded data when the count rates exceeded 1.0 counts s-1 in the 10–12 keV band for MOS and 2.0 counts s-1 above 10 keV for pn. For both cameras, the source spectra were extracted from a circular region of 20″ radius, whereas the background ones were from a source-free region with a radius of 40″ in the same CCD chips. We created the RMF with rmfgen and ARF with arfgen. The source spectra, background spectra, RMFs, and ARFs of EPIC/MOS1 and MOS2 were combined by using addascaspec, and the spectral bins were merged to contain no less than 20 counts.
2.4 Chandra
Chandra (Weisskopf et al., 2002)
observed NGC 5135 with ACIS-S
on 2001 September 04 for a net exposure of 29.3 ks.
The data reduction was performed with the standard procedures, by using
Chandra Interactive Analysis of Observations (CIAO) v4.11 and
the Calibration Database (CALDB) v4.8.4.1. The event files were
reproduced by the chandra_repro tool. We extracted the source
spectrum from a circular region with a radius of 10.5″, and took the
background from a nearby source-free circular region with the same
radius. The spectrum was rebinned to have no less than 20 counts per bin.
| No. | Parameter | UGC 2608 | NGC 5135 | ||
|---|---|---|---|---|---|
| Baseline Model | XCLUMPY Model | Baseline Model | XCLUMPY Model | ||
| (1) | [ cm-2] | ||||
| (2) | [ cm-2] | ||||
| (3) | |||||
| (4) | [ keV-1 cm-2 s-1] | ||||
| (5) | [%] | ||||
| (6) | |||||
| (7) | |||||
| (8) | [degree] | ||||
| (9) | [degree] | ||||
| (10) | |||||
| (11) | T [keV] | ||||
| (12) | [10-5 cm-5] | ||||
| (13) | |||||
| (14) | |||||
| (15) | |||||
| (16) | |||||
| (17) | [ erg s-1 cm-2] | 2.1 | 2.1 | 3.8 | 3.7 |
| (18) | [ erg s-1 cm-2] | 3.0 | 3.1 | 4.2 | 4.1 |
| (19) | [1043 erg s-1] | ||||
| (20) | [1043 erg s-1] | ||||
| (21) | [1040 erg s-1] | 4.2 | 4.4 | 2.6 | 3.7 |
| (22) | |||||
| (23) | |||||
| /dof | 77.0/72 | 75.1/72 | 186.6/160 | 164.1/158 |
Note. — Columns: (1) hydrogen column density along the line of sight; (2) hydrogen column density along the equatorial plane (i.e., the maximum ); (3) power-law photon index of the AGN transmitted component; (4) power-law normalization of the AGN transmitted component at 1 keV; (5) scattering fraction; (6) power-law photon index of the scattering component including emission lines from photoionized plasma; (7) reflection strength () of the pexmon model; (8) torus angular width; (9) inclination angle of the torus; (10) relative normalization of the emission lines from the torus; (11) temperature of the apec model; (12) normalization of the apec model; (13) cross-calibration of Suzaku/XIS-FIs relative to NuSTAR/FPMs; (14) cross-calibration of Suzaku/XIS-BI relative to NuSTAR/FPMs; (15) cross-calibration of XMM-Newton EPIC/pn relative to NuSTAR/FPMs; (16) cross-calibration of Chandra/ACIS-S relative to NuSTAR/FPMs; (17–18) observed flux in the 2–10 keV and 15–50 keV band, respectively (normalized at the value of the NuSTAR observation); (19–20) intrinsic luminosity in the 2–10 keV and 10–50 keV band, respectively. The errors on luminosities are estimated by fixing the photon index at the best-fit value; (21) luminosity of the iron-K line; (22–23) torus covering factor derived from the equatorial column density and torus angular width through Equation (4) for Compton-thin ( cm-2) and Compton-thick ( cm-2) material, respectively.
3 X-ray Spectral Analysis
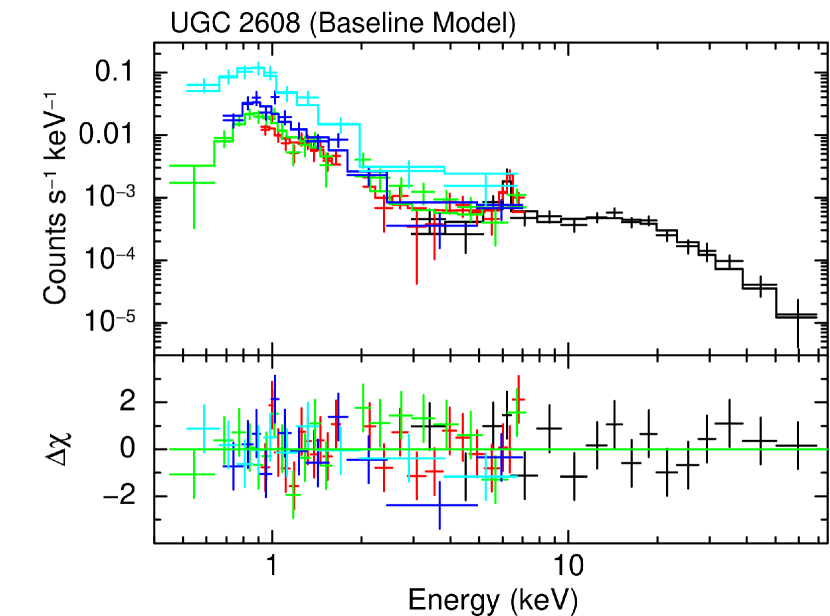
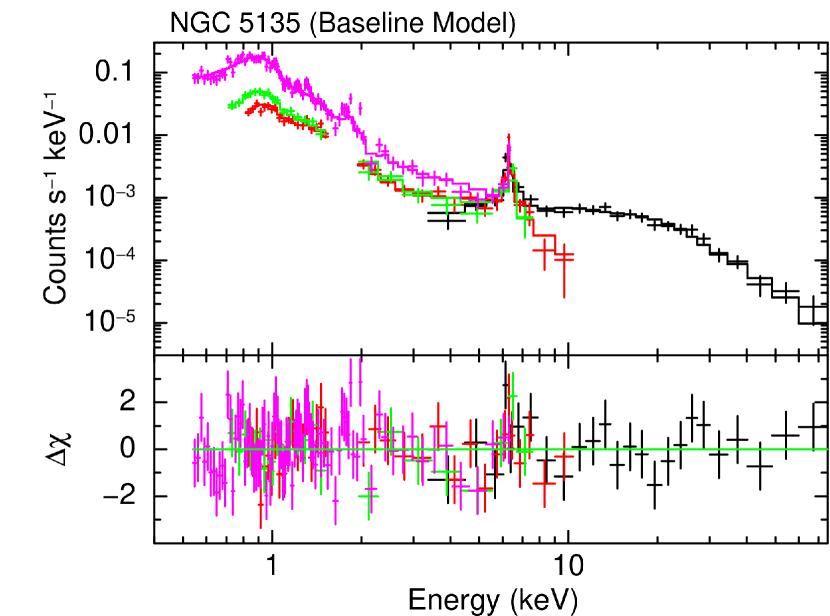
The broadband X-ray spectra of these sources (0.5–70 keV) consisting of multiple instrument data are simultaneously analyzed. Considering the signal-to-noise ratio of the spectra, we determine the energy band to be used as follows: for UGC 2608, NuSTAR/FPMs (3–70 keV), Suzaku/XIS-FIs (0.9–7 keV), XIS-BI (0.45–7 keV), XMM-Newton EPIC/MOS (0.7–7 keV), and EPIC/pn (0.5–7 keV); for NGC 5135, NuSTAR/FPMs (3–74 keV), Suzaku/XIS-FIs (0.8–10 keV), XIS-BI (0.7–8 keV), and Chandra/ACIS-S (0.5–6 keV). The data of XIS-FIs and XIS-BI in the 1.6–1.9 keV band are excluded to avoid the calibration uncertainty.333https://heasarc.gsfc.nasa.gov/docs/suzaku/analysis/abc/node8.html The observed spectra folded with the energy responses are plotted in the left panels of Figure 1 and 2.
In spectral fitting, we consider the Galactic absorption by multiplying phabs to intrinsic spectral models, and fix the hydrogen column densities at 2.03 cm-2 for UGC 2608 and 6.02 cm-2 for NGC 5135 (Willingale et al., 2013). We correct possible cross-calibration uncertainties among different instruments by introducing constant factors (const1; , , , and for XIS-FIs, XIS-BI, EPIC/pn, and ACIS-S, respectively). This value is set to unity for the NuSTAR/FPMs and XMM-Newton EPIC/MOS as calibration references, both of which are well cross-calibrated within a few percent (Madsen et al., 2015, 2017), and allowed the other constants to vary within a range of 0.8–1.2. The solar abundances by Anders & Grevesse (1989) are assumed. Possible time variability of the AGN emission is ignored because it is not significantly required from the data. All spectral fitting was carried out on xspec v12.10.1 (Arnaud, 1996) by adopting statistics.
3.1 Baseline Model
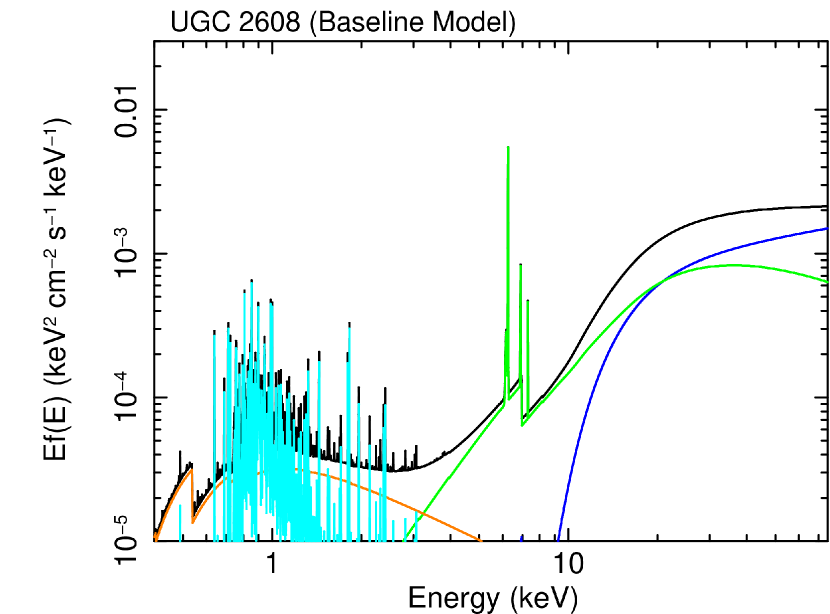
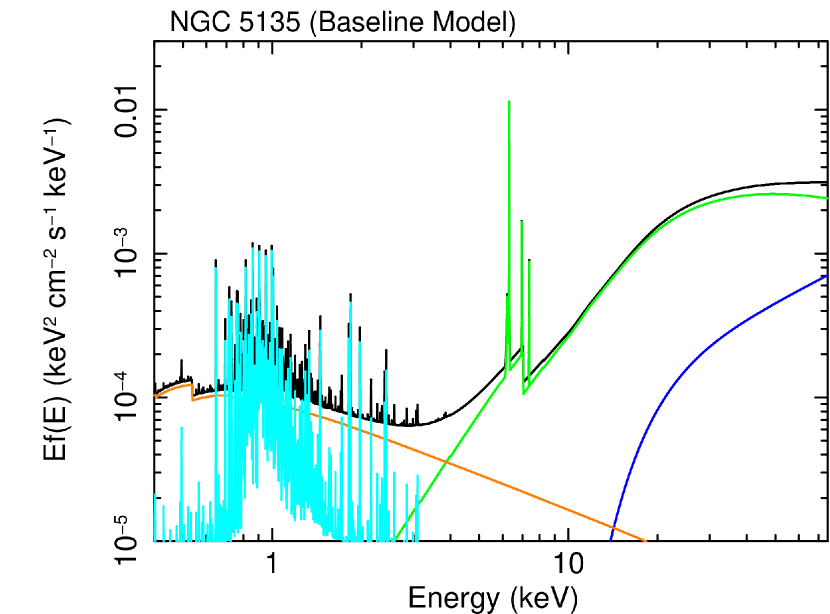
Previous X-ray studies suggested that UGC 2608 and NGC 5135 hosted CT AGNs (e.g., Guainazzi et al., 2005; Fukazawa et al., 2011; Singh et al., 2012), and therefore we start with a conventional model often applied for CT objects (e.g., Oda et al., 2017; Ricci et al., 2017c; Tanimoto et al., 2018). The model consists of four components: an absorbed direct component, an unabsorbed scattered component, a reflection component, and a soft thermal component. In the xspec terminology, it is described as
| (1) |
The first term represents the transmitted AGN component modeled by an absorbed power law with a high-energy cutoff of 300 keV (e.g., Dadina, 2008). We consider the Compton scattering effect to the primary component by multiplying the cabs model. For UGC 2608, the photon index () is fixed at 1.8 as a typical value (e.g., Ueda et al., 2014; Ricci et al., 2017c), since it cannot be well constrained due to the limited photon statistics. The second term is the component representing scattering by ionized material. The normalization and cutoff energy are linked to those of the primary component. The photon index () is set to vary between 1.5 and 3.0, because photoionized plasma often contains emission lines that cannot be resolved by CCD, making the apparent slope steeper than that of the primary component. We multiply the scattering fraction (const2, ) relative to the transmitted emission at 1 keV (e.g., Ueda et al., 2007). The third term describes the reflection component from the torus. For Compton-reflection continuum we use the pexmon model in XSPEC (Nandra et al., 2007), which calculates a reflection spectrum from optically-thick cold matter (pexrav; Magdziarz & Zdziarski 1995) including Fe K (6.4 keV), Fe K (7.1 keV), and Ni K (7.5 keV) fluorescence lines. The relative intensity, = /2 ( is the solid angle of the reflector), is allowed to vary within a range of in order to avoid unrealistic solutions, and the inclination angle is set to = 60°. The normalization, photon index, and cutoff energy are tied to those of the primary component. The last term accounts for optically-thin thermal emission from plasma in the host galaxy (apec; Smith et al. 2001), likely related to star-forming regions.
This analytic model well reproduces the broadband spectra of UGC 2608 (with the chi-squared statistic divided by the number of degrees of freedom, /dof = 77.0/72) and NGC 5135 (/dof = 186.6/160) in the 0.5–70 keV energy band. The best-fit parameters are summarized in Table 2. From the best-fit model, we calculate the observed fluxes, intrinsic AGN luminosities, and Fe K luminosities, which are also listed in Table 2. The line-of-sight column densities are estimated to be = cm-2 (UGC 2608) and 3.2 cm-2 (NGC 5135), classifying both objects as CT AGNs. The folded spectra and best-fit models are plotted in the upper panels of Figure 1 and 2.
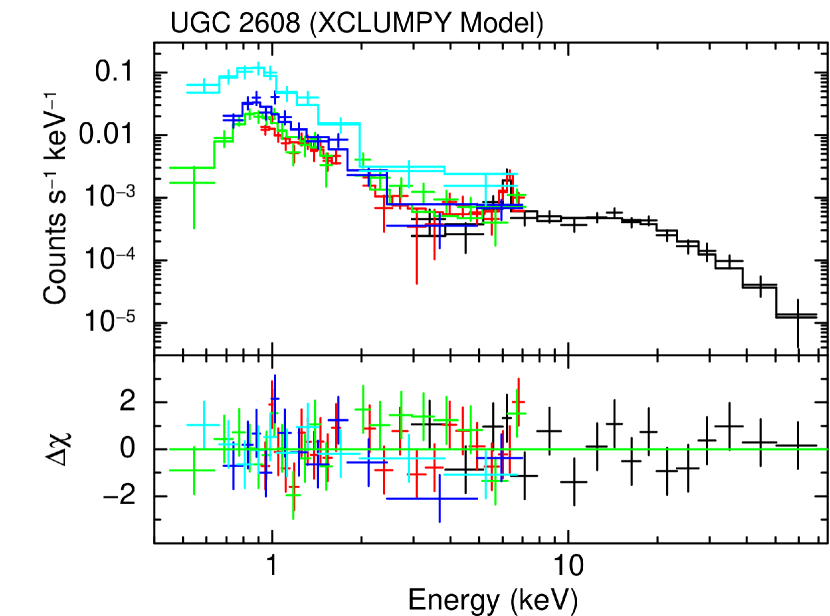
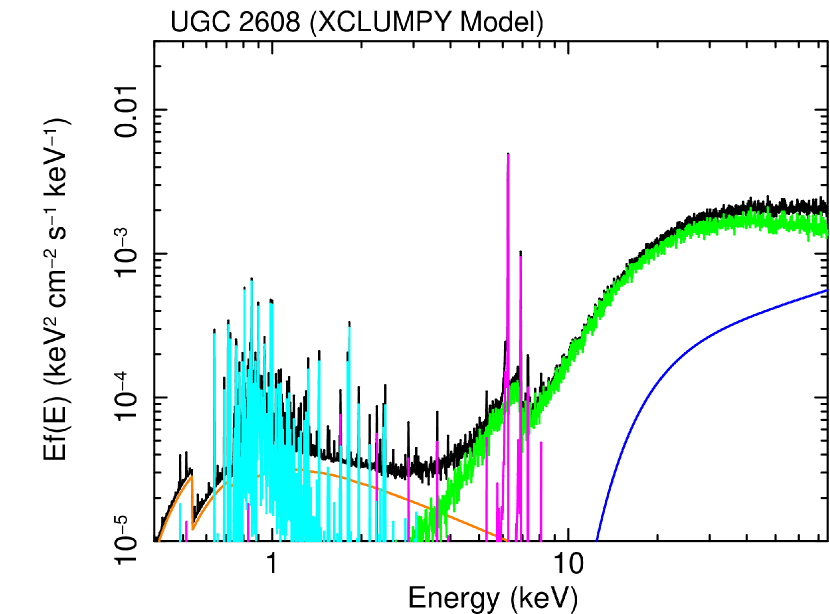
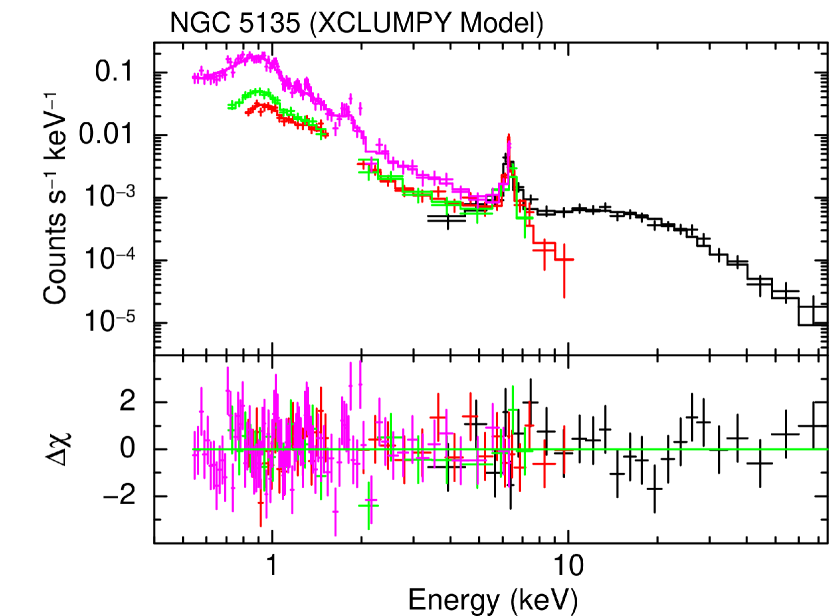
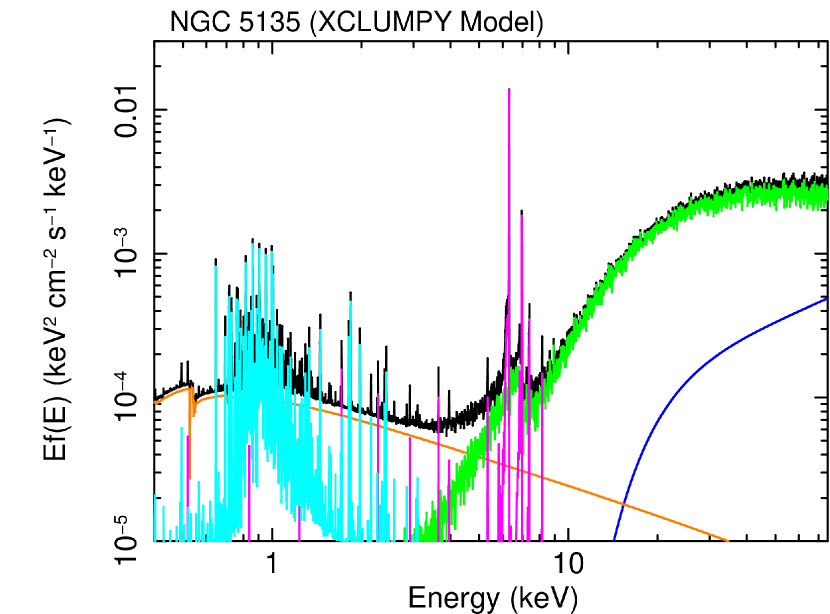
3.2 XCLUMPY Model
Next, we apply the XCLUMPY model (Tanimoto et al., 2019), a Monte Carlo-based spectral model from the clumpy torus in an AGN. Many observations in the IR band indicate that AGN tori must be composed of dusty clumps rather than of a smooth mixture of gas and dust (e.g., Krolik & Begelman, 1988; Wada & Norman, 2002; Hönig & Beckert, 2007). Moreover, X-ray works using smooth torus models often suggest a large amount of unabsorbed reflection components noticeable below the Fe K edge. These spectral features are interpreted to be caused by clumpy tori (e.g., Liu & Li, 2014; Furui et al., 2016; Tanimoto et al., 2018, 2019). Therefore, we regard it as one of the most physically realistic models currently available.
The biggest advantage of the XCLUMPY model is that the same model can be fitted to the X-ray and the IR data. In this model, the geometry of the torus is assumed to be the same as that in the CLUMPY model in the IR band (Nenkova et al., 2008a, b), where clumps are distributed according to power-law and normal distributions in the radial and angular directions, respectively. In reality, the gas and dust are not located in the same place.444Ichikawa et al. (2019) argued a possible presence of X-ray absorbing dust-free gas. Tanimoto et al. (2020) suggested that the IR spectrum of an AGN is largely affected by a dusty polar outflow. Then, a comparison between self-consistent X-ray and IR models provides more robust measures of the covering factors for the “gas” (probed in the X-ray band) and the “dust” (probed in the IR band).
The geometry in the XCLUMPY model is determined by the column density along the equatorial plane (), the torus angular width ( within a range of –), and the inclination angle ( within a range of –).555The other fixed parameters are the inner and outer radii of the torus (0.05 pc and 1.00 pc), the radius of each clump (0.002 pc), the number of clumps along the equatorial plane (10.0), and the index of radial density profile (0.5) (see Tanimoto et al., 2019). In XSPEC, the model is written as:
| (2) |
The first (transmitted component) and second (scattered component by ionized material) terms are the same as in the previous model. The third and fourth ones represent the two table models of XCLUMPY, the reflection continuum (xclumpy_R.fits) and fluorescence lines (xclumpy_L.fits), respectively. The parameters of the reflection continuum and lines are fixed to be the same. The relative normalization of the emission lines to the reflection continuum (; const3) is set to be a free parameter for NGC 5135, which significantly improves the fit ( 30.4 for 1 dof). This factor can take into account uncertainties caused by the assumption of geometry and possible non-solar abundances. The photon index, cutoff energy, and normalization of the power law are linked to those of the transmitted component. The inclination of UGC 2608 is fixed at 80°, which cannot be well determined with the data. The line-of-sight column density () in the first term is linked to the equatorial column density (), the inclination, and the torus angular width through Equation (3) in Tanimoto et al. (2019). The fifth term corresponds to the emission from optically thin thermal plasma in the host galaxy.
We find this model also well reproduces the spectra of UGC 2608
(/dof = 75.1/72) and NGC 5135 (/dof = 164.1/158). These
fits are statistically better compared with those by the baseline
model, although both models represent statistically
acceptable representations of the data. Table 2 lists
the best-fit parameters, observed fluxes, intrinsic X-ray luminosities, and
K luminosities. The lower panels of Figure 1 and
2 illustrate the folded spectra and best-fit models. The
line-of-sight column densities are found to be
= cm-2
and cm-2,
and the best-fit intrinsic 2–10 keV luminosities are
erg s-1 and
erg s-1 for UGC 2608 and
NGC 5135, respectively.
This confirms that both sources host CT AGNs.
4 Discussion
We have presented the best quality broadband X-ray spectra of UGC 2608 and NGC 5135 in the 0.5–70 keV band, observed with NuSTAR, Suzaku, XMM-Newton and Chandra. The sensitive hard X-ray data of NuSTAR have enabled us to best constrain the properties of the obscured AGNs. For both targets, the XCLUMPY model better reproduces the combined spectra than the baseline model, which are found to be dominated by the reflection component from the torus above 10 keV. The resultant line-of-sight column densities and intrinsic 2–10 keV luminosities are consistent between the two models. Hereafter, we refer to the results obtained with the XCLUMPY model, where a more realistic geometry is considered.
We have revealed that UGC 2608 and NGC 5135 contain heavily CT AGNs with column densities of = cm-2 and cm-2, respectively. The large Fe K EWs, 1.4 keV for UGC 2608 and 2.5 keV for NGC 5135 (see also Fukazawa et al. 2011), are characteristics of CT AGNs (Ghisellini et al., 1994; Ricci et al., 2014). Our results thus confirm the main conclusions of previous X-ray studies. Using the XMM-Newton spectra of UGC 2608, Guainazzi et al. (2005) obtained a photon index of , which is assumed to be common for the AGN and scattered components, and a hydrogen column density of cm-2. Analyzing the Suzaku 0.5–50 keV spectra of NGC 5135, Singh et al. (2012) obtained and with a column density of cm-2. This column density of NGC 5135 is smaller by a factor of 3 than our result. We infer that the difference may be due to a calibration issue and/or time variability in , since the Suzaku HXD/PIN flux in the 15–50 keV band666The error includes a systematic uncertainty of 3% in the HXD/PIN background model (Fukazawa et al., 2009). The best-fit photon index of 1.71 is assumed to convert from the observed count rate into the 15–50 keV flux., erg cm-2 s-1, was 3 times larger than the best-fit NuSTAR flux.
4.1 Luminosities and Eddington Ratios
In the IR band, the presence of the obscured AGNs in UGC 2608 and NGC 5135 was suggested by detections of high-excitation emission lines, in particular of [O IV] 25.89 m and [Ne V] 14.32 m (Inami et al., 2013); using the five diagnostics of Spitzer/IRS data777The diagnostics are following: the [Ne V]14.3/[Ne II]12.8 flux ratios; the [O IV]25.9/[Ne II]12.8 flux ratios; the equivalent width of the 6.2 m PAH; the / dust continuum slope; and the Laurent diagram (Laurent et al., 2000)., Díaz-Santos et al. (2017) estimated the AGN fractions in the mid-IR luminosities to be 62% for UGC 2608 and 36% for NGC 5135 (the average of the five methods). Spectral decomposition can constrain the physical properties of the AGN in more detail. From the broadband IR (1–500 m) SED fitting, Shangguan et al. (2019) estimated the stellar masses, log and , the SFRs, log(SFR/yr-1) = and , and the IR luminosities from the tori, log(/erg s-1) = and for UGC 2608 and NGC 5135, respectively. The intrinsic 2–10 keV luminosity of a normal Seyfert galaxy can be estimated from an IR AGN luminosity by using the relation by Mullaney et al. (2011):
| (3) |
where the X-ray and IR luminosities are in units of erg s-1. Assuming , the above equation yields X-ray luminosities of = erg s-1 (UGC 2608) and erg s-1 (NGC 5135). They are in good agreement with our results derived from the broadband X-ray spectral analysis.
The BH masses () of UGC 2608 and NGC 5135 are estimated as log() (Dasyra et al., 2011) and (Marinucci et al., 2012), respectively, on the basis of the - relation.888 These BH masses are consistent with those calculated from the stellar masses of the host galaxies by using the empirical relation of Reines & Volonteri (2015). Adopting a 2–10 keV-to-bolometric luminosity ratio of 20, a typical value for Seyferts (Vasudevan & Fabian, 2007), we can convert our best-fit X-ray luminosities to the bolometric ones as erg s-1 (UGC 2608) and erg s-1 (NGC 5135). Then, the Eddington ratios are calculated to be (UGC 2608) and (NGC 5135).
| Object | M | log | log | Ref |
|---|---|---|---|---|
| (1) | (2) | (3) | (4) | (5) |
| NGC 34 | D | 1 | ||
| NGC 235A | B | 1 | ||
| NGC 1068 | N | 1 | ||
| NGC 1365 | N | 1 | ||
| IRAS 05189–2524 | D | 1 | ||
| UGC 5101 | D | 2 | ||
| NGC 3690W | C | 1 | ||
| NGC 3690E | C | 1 | ||
| IC 883 | D | 43.90 | 3 | |
| MCG-03-34-064 | A | 1 | ||
| IC 4518W | B | 1 | ||
| ESO 286–19 | D | 1 | ||
| NGC 7130 | N | 1 | ||
| NGC 7469 | A | 1 | ||
| NGC 7674 | A | 1 | ||
| NGC 7679 | A | 1 | ||
| UGC 2608 | N | 43.63 ()b | 4 | |
| NGC 5135 | N | 4 |
Note. — Columns: (1) Object name; (2) merger stage (N = nonmerger, A = pre-merger, B = early-stage merger, C = mid-stage merger, and D = late-stage merger; see Yamada et al. 2019); (3) nuclear 12 m luminosity in erg s-1; (4) intrinsic 2–10 keV luminosity in erg s-1; (5) references for the intrinsic 2–10 keV luminosity. List of references: (1) Asmus et al. (2015); (2) Oda et al. (2017); (3) Romero-Cañizales et al. (2017); (4) this work.
These results () are in contrast to the AGNs in late-stage merging U/LIRGs, which often have large Eddington ratios of 0.5, such as Mrk 463E ( 0.4–0.8; Yamada et al. 2018), IRAS 05189–2524 (; Teng et al. 2015), and Mrk 231 (; Teng et al. 2015). Thus, the SMBHs in these “non-merging” U/LIRGs are not so rapidly growing as those in typical “merging” U/LIRGs.
4.2 Geometry of Narrow Line Region and Torus
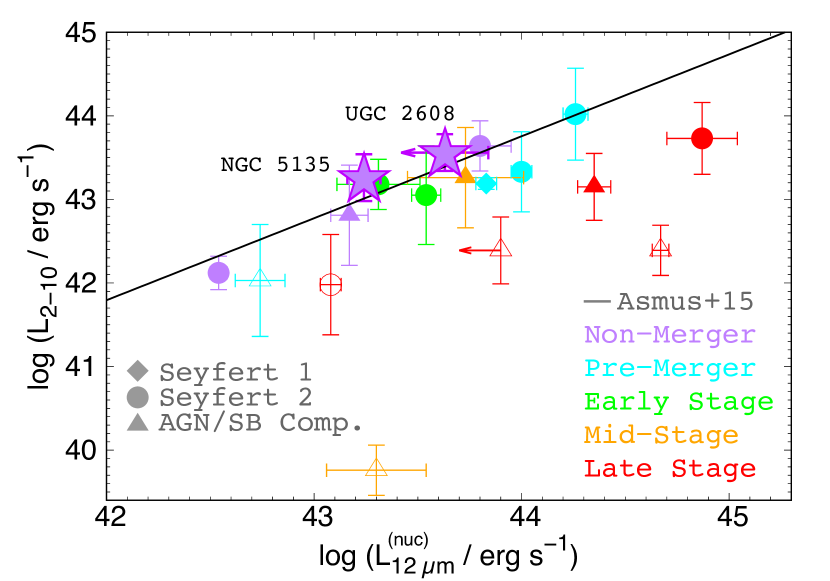
The comparison between intrinsic X-ray and nuclear (subarcsecond-scale) 12 m luminosities is useful to investigate the environment in the central regions. Nuclear 12 m luminosity originates mainly from hot dust heated by an AGN (e.g., Gandhi et al., 2009), which are obtained from high spatial-resolution observations in order to minimize the contamination by the host galaxy (Asmus et al., 2014). In fact, Asmus et al. (2015) found that the nuclear 12 m and intrinsic X-ray luminosities were well correlated for normal Seyferts, whereas they were not for AGN/starburst composites, uncertain AGNs (e.g., low-luminosity AGNs), and buried AGNs with large torus covering factors (Yamada et al., 2019).
The nuclear 12 m luminosities are obtained by Asmus et al. (2014) for 23 U/LIRGs in the GOALS sample. In Table 3, we select AGNs in various merging stages of these U/LIRGs (Yamada et al., 2019) whose intrinsic 2–10 keV luminosities are estimated. Figure 3 shows the relation between X-ray and nuclear 12 m luminosities. As shown in the figure, in the case of mid-/late-stage mergers, the X-ray to nuclear 12 m luminosity ratios are smaller than the typical relation found for normal Seyferts (Asmus et al., 2015). There are two possibilities that (1) the X-ray-to-bolometric luminosity ratio is small because of high Eddington ratios (Vasudevan & Fabian, 2007) and that (2) starburst contamination to the 12 m luminosity is significant even in the nuclear region. Whereas, UGC 2608999For UGC 2608, the “nuclear” 12 m luminosity is not available. Hence, we utilize the total 12 m luminosity [ erg s-1 obtained from the Spitzer/IRS spectra as a maximum value] by multiplying the mid-IR AGN fraction (62%; Díaz-Santos et al. 2017). and NGC 5135 show the ratios consistent with the typical relation found for normal Seyferts, indicating that they are neither AGNs with large Eddington ratios nor starburst-dominant objects in agreement with their SFRs.
The properties of the tori in non-merging LIRGs are still unclear. The IRAS 25–60 m flux ratios () of 0.43 for UGC 2608 and 0.34 for NGC 5135 (Sanders et al., 2003) show warm far-IR colors (0.2), supporting that they are not buried AGNs but normal edge-on CT AGNs with co-existing nuclear starbursts (Sanders et al., 1988; Imanishi et al., 2006, 2007). To confirm the torus geometry, the [O IV] 25.89 m and X-ray luminosity ratio provides the information of the spatial extent of the narrow line region (NLR). The [O IV] line is emitted from the NLR irradiated by UV light from an AGN. Hence, its luminosity should be roughly proportional to the AGN bolometric luminosity times the solid angle of the NLR (e.g., Kawamuro et al., 2016). However, this relation is also affected by the ratio of the bolometric luminosity to the X-ray one; for instance, AGNs with high Eddington ratio such as those in the late-stage merging U/LIRGs may have large ratios (i.e., X-ray weak; e.g., Teng et al. 2015; Yamada et al. 2018; Toba et al. 2019).
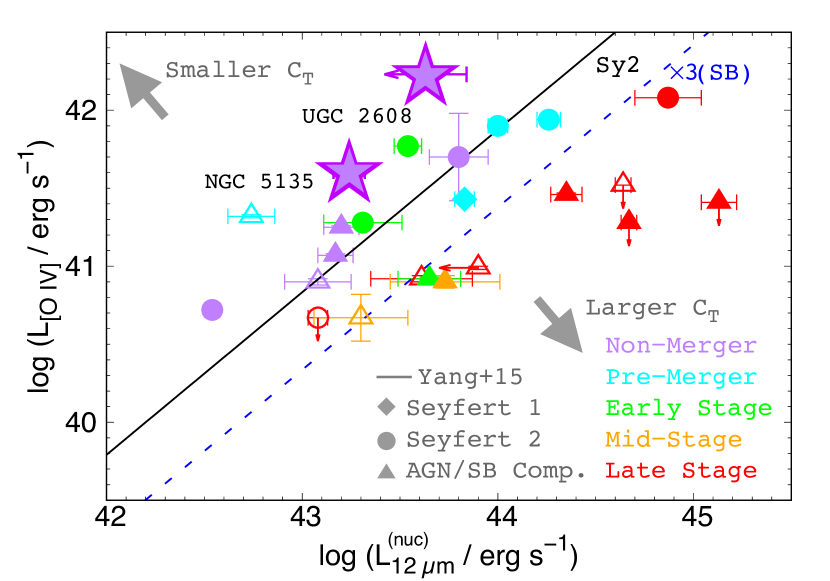
To avoid the uncertainty by this effect, we investigate the correlation between the [O IV] 25.89 m line and nuclear 12 m continuum luminosities. This would be a better tracer of covering factors because both are determined mainly by the UV luminosity dominating the total power of the intrinsic AGN radiation (Yamada et al., 2019). The sample is selected from our targets and the local U/LIRGs listed in Table 2 of Yamada et al. (2019), whose [O IV] and nuclear 12 m luminosities are both available. The result is shown in Figure 4. They reported that the AGNs in the mid- to late-stage mergers of U/LIRGs have small [O IV] luminosities relative to the 12 m ones, suggesting that their nuclei are deeply buried by tori with large covering factors. By contrast, the AGNs in UGC 2608 and NGC 5135 have larger [O IV] luminosities than those of typical Seyfert 2s (Yang et al., 2015) and the other U/LIRGs, indicating that the solid angles of their NLRs are large (i.e., the torus covering factors are small).
4.3 Covering factors in the X-ray and IR band
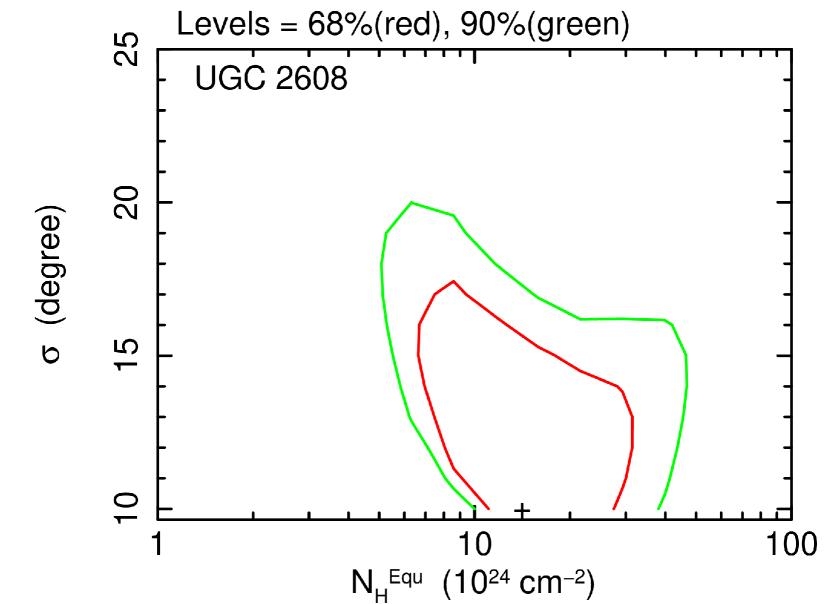
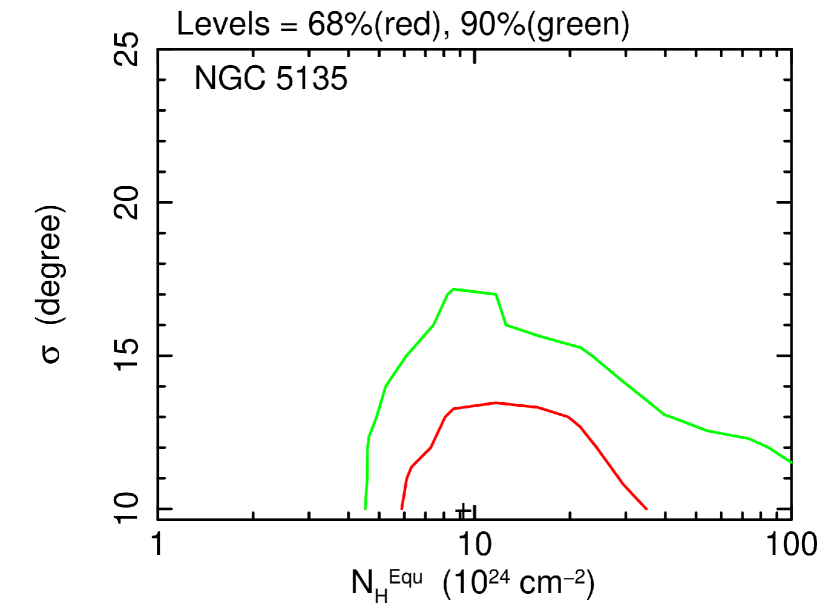
To reinforce our interpretation on the torus geometry of UGC 2608 and NGC 5135, we estimate the covering factor () from our X-ray spectral analysis results. With the XCLUMPY model, we have determined the torus angular widths to be 18.2° degrees and 14.5°, and the equatorial hydrogen column densities to be cm-2 and cm-2 for UGC 2608 and NGC 5135, respectively. These torus angular widths are smaller than the averaged value of the 10 local Seyfert 2s (<> ) analyzed by Tanimoto et al. (2020) with XCLUMPY. Figure 5 shows the confidence contours between and . In the geometry of XCLUMPY, the mean column density at a given elevation angle () can be calculated as
| (4) |
Defining as the angle for which cm-2, we find and 39.6°, which correspond to and 0.64 for UGC 2608 and NGC 5135, respectively. These results imply that these AGNs are not deeply buried.
Considering the mid-IR results in Section 4.2, the AGNs in UGC 2608 and NGC 5135 have small covering factors for both gas and dust. Ichikawa et al. (2015) analyzed the IR SED of NGC 5135 with the CLUMPY model and obtained a torus angular width of degrees and a covering factor of (the errors are 1). These estimates are larger than those of X-ray results ( and ). Similar trends are reported in case of local Seyfert 1s (Ogawa et al., 2019) and Seyfert 2s (Tanimoto et al., 2019, 2020) by comparing the results with the XCLUMPY and CLUMPY models. Tanimoto et al. (2020) and Ogawa et al. (2020) find a significant tendency that estimated by Ichikawa et al. (2015) and García-Bernete et al. (2019) is larger than , particularly in a high inclination system. They propose that the discrepancy can be explained by a contribution from “dusty” polar outflows in the IR flux (Tristram et al., 2014; Asmus et al., 2016; Asmus, 2019). These effects are not considered in the CLUMPY model, whereas the effects to the X-ray spectra are expected to be small (Tanimoto et al., 2020). Thus, the results from the X-ray spectra with XCLUMPY give more realistic estimates of the torus covering factors than those from the IR SED with CLUMPY.
Even if the nuclear 12 m luminosity ratio may contain the emission from the polar outflows, the [O IV] to nuclear 12 m luminosity ratio still represents the spatial extent of the NLR. Hence, we conclude that AGN tori in UGC 2608 and NGC 5135 are geometrically thin, on the basis of the X-ray spectra and the [O IV] to nuclear 12 m luminosity ratios.
4.4 Covering Factors vs. Eddington ratios
We investigate the relation between the covering factor and Eddington ratio. Utilizing local AGNs in the Swift/BAT 70-month catalog, Ricci et al. (2017a) report that AGNs with have obscurers of cm-2 with large covering factors (), whereas AGNs with have those with smaller covering factors (). They interpret that radiation pressure from the AGN expells dusty material when .
By adopting the estimated Eddington ratios (Section 4.1), the relation of Ricci et al. (2017a) predicts the covering factors with cm-2 to be 0.32–0.76 (UGC 2608) and 0.31–0.72 (NGC 5135), and that with cm-2 to be (both objects).101010The 1 uncertainties are 0.08 (UGC 2608) and 0.09 (NGC 5135) for , and 0.07 (both) for . These values match well with the obtained covering factors in the XCLUMPY model ( and 0.44, and and 0.26 for UGC 2608 and NGC 5135, respectively). The results suggest that the XCLUMPY model reproduces a realistic description of their compact AGN tori with cm-2 obscuration; foreground absorption by the host galaxy (typically cm-2), if any, is negligible. We infer that their tori become geometrically thin due to significant radiation pressure of the AGN as is the case of local AGNs with moderately high Eddington ratios.
Thus, our results indicate that the CT AGNs in these “non-merging” LIRGs are just a normal AGN population with moderate Eddington ratios seen close to edge-on through a large line-of-sight column density. We note that these two objects may have smaller covering factors than typical values in non-merging LIRGs because they have largest [O IV]-to-12 m luminosity ratios among the 24 local U/LIRGs in Figure 4. This may be due to a selection bias by the detections with NuSTAR for AGNs with high luminosities and hence with large Eddington ratios. It is thus important to confirm if all non-merging LIRGs follow the relation by (Ricci et al., 2017a), using a larger sample by more sensitive broadband X-ray spectroscopy.
By contrast, many studies suggest that AGNs in U/LIRGs of late-stage mergers
are deeply buried (i.e.,
having tori with large covering factors reaching almost unity;
Imanishi et al. 2006, 2007; Ricci et al. 2017b; Yamada et al. 2019)
even if they shine at large Eddington ratios (Teng et al., 2015; Oda et al., 2017; Yamada et al., 2018).
Then, the driver of these phenomena
would be not the Eddington ratio but the merger environment.
In such a “merging” system,
the column density in almost all directions becomes too large to be
blowed out by radiation pressure of the AGN.
Thus, we suggest that AGNs in “non-merging” LIRGs and those in “merging”
ones are distinct populations.
The former have small to moderate Eddington ratios and are not buried,
while the latter have moderate to high Eddington ratios
even though they are deeply “buried”.
This is probably because the AGN trigger mechanism in “non-merging”
LIRGs is less violent than major mergers,
such as minor mergers, fly-by companions, and/or secular evolution
(e.g., Alonso-Herrero et al., 2013).
5 Summary and Conclusions
In this paper, we study the best-quality broadband X-ray spectra of the two “non-merging” LIRGs UGC 2608 and NGC 5135, by combining the data of NuSTAR, Suzaku, XMM-Newton, and Chandra. Applying the XCLUMPY model (Tanimoto et al., 2019), we estimate the line-of-sight hydrogen column densities of = cm-2 and cm-2, and the intrinsic 2–10 keV luminosities to be erg s-1 and erg s-1 for UGC 2608 and NGC 5135, respectively. Thus, both objects are firmly classified as CT AGNs.
The Eddington ratios of both targets are estimated to be 0.1, by using the black hole masses (Dasyra et al., 2011; Marinucci et al., 2012) and the intrinsic 2–10 keV luminosities obtained from our careful analysis. From the X-ray spectra, we determine the torus angular widths of UGC 2608 and NGC 5135 to be , and the covering factors of material with cm-2 to be 0.7. The covering factors and Eddington ratios are consistent with the relation found for local Swift/BAT AGNs by Ricci et al. (2017a), implying that their tori are geometrically thin because of radiation pressure of the AGN to dusty material.
Our results indicate that the CT AGNs in these “non-merging” LIRGs are just a normal AGN population with moderate Eddington ratios seen close to edge-on through a large line-of-sight column density. By contrast, AGNs in U/LIRGs of late-stage mergers are deeply buried (Imanishi et al., 2006; Ishisaki et al., 2007; Ricci et al., 2017b; Yamada et al., 2019) despite of their large Eddington ratios (Teng et al., 2015; Oda et al., 2017; Yamada et al., 2018). This suggests that AGNs in “non-merging” LIRGs and those in “merging” ones are distinct populations.
References
- Alexander & Hickox (2012) Alexander, D. M., & Hickox, R. C. 2012, New A Rev., 56, 93, doi: 10.1016/j.newar.2011.11.003
- Alonso-Herrero et al. (2013) Alonso-Herrero, A., Pereira-Santaella, M., Rieke, G. H., et al. 2013, ApJ, 765, 78, doi: 10.1088/0004-637X/765/2/78
- Anders & Grevesse (1989) Anders, E., & Grevesse, N. 1989, Geochim. Cosmochim. Acta, 53, 197, doi: 10.1016/0016-7037(89)90286-X
- Armus et al. (2009) Armus, L., Mazzarella, J. M., Evans, A. S., et al. 2009, PASP, 121, 559, doi: 10.1086/600092
- Arnaud (1996) Arnaud, K. A. 1996, Astronomical Society of the Pacific Conference Series, Vol. 101, XSPEC: The First Ten Years, ed. G. H. Jacoby & J. Barnes, 17
- Asmus (2019) Asmus, D. 2019, MNRAS, 489, 2177, doi: 10.1093/mnras/stz2289
- Asmus et al. (2015) Asmus, D., Gandhi, P., Hönig, S. F., Smette, A., & Duschl, W. J. 2015, MNRAS, 454, 766, doi: 10.1093/mnras/stv1950
- Asmus et al. (2016) Asmus, D., Hönig, S. F., & Gandhi, P. 2016, ApJ, 822, 109, doi: 10.3847/0004-637X/822/2/109
- Asmus et al. (2014) Asmus, D., Hönig, S. F., Gandhi, P., Smette, A., & Duschl, W. J. 2014, MNRAS, 439, 1648, doi: 10.1093/mnras/stu041
- Barro et al. (2013) Barro, G., Faber, S. M., Pérez-González, P. G., et al. 2013, ApJ, 765, 104, doi: 10.1088/0004-637X/765/2/104
- Cowie et al. (1996) Cowie, L. L., Songaila, A., Hu, E. M., & Cohen, J. G. 1996, AJ, 112, 839, doi: 10.1086/118058
- Dadina (2008) Dadina, M. 2008, A&A, 485, 417, doi: 10.1051/0004-6361:20077569
- Dasyra et al. (2011) Dasyra, K. M., Ho, L. C., Netzer, H., et al. 2011, ApJ, 740, 94, doi: 10.1088/0004-637X/740/2/94
- Davies et al. (2014) Davies, R. L., Rich, J. A., Kewley, L. J., & Dopita, M. A. 2014, MNRAS, 439, 3835, doi: 10.1093/mnras/stu234
- Díaz-Santos et al. (2017) Díaz-Santos, T., Armus, L., Charmandaris, V., et al. 2017, ApJ, 846, 32, doi: 10.3847/1538-4357/aa81d7
- Draper & Ballantyne (2012) Draper, A. R., & Ballantyne, D. R. 2012, ApJ, 751, 72, doi: 10.1088/0004-637X/751/1/72
- Fukazawa et al. (2009) Fukazawa, Y., Mizuno, T., Watanabe, S., et al. 2009, PASJ, 61, S17, doi: 10.1093/pasj/61.sp1.S17
- Fukazawa et al. (2011) Fukazawa, Y., Hiragi, K., Mizuno, M., et al. 2011, ApJ, 727, 19, doi: 10.1088/0004-637X/727/1/19
- Furui et al. (2016) Furui, S., Fukazawa, Y., Odaka, H., et al. 2016, ApJ, 818, 164, doi: 10.3847/0004-637X/818/2/164
- Gabriel et al. (2004) Gabriel, C., Denby, M., Fyfe, D. J., et al. 2004, Astronomical Society of the Pacific Conference Series, Vol. 314, The XMM-Newton SAS - Distributed Development and Maintenance of a Large Science Analysis System: A Critical Analysis, ed. F. Ochsenbein, M. G. Allen, & D. Egret, 759
- Gandhi et al. (2009) Gandhi, P., Horst, H., Smette, A., et al. 2009, A&A, 502, 457, doi: 10.1051/0004-6361/200811368
- García-Bernete et al. (2019) García-Bernete, I., Ramos Almeida, C., Alonso-Herrero, A., et al. 2019, MNRAS, 486, 4917, doi: 10.1093/mnras/stz1003
- Ghisellini et al. (1994) Ghisellini, G., Haardt, F., & Matt, G. 1994, MNRAS, 267, 743, doi: 10.1093/mnras/267.3.743
- Guainazzi et al. (2005) Guainazzi, M., Matt, G., & Perola, G. C. 2005, A&A, 444, 119, doi: 10.1051/0004-6361:20053643
- Harrison et al. (2013) Harrison, F. A., Craig, W. W., Christensen, F. E., et al. 2013, ApJ, 770, 103, doi: 10.1088/0004-637X/770/2/103
- Hönig & Beckert (2007) Hönig, S. F., & Beckert, T. 2007, MNRAS, 380, 1172, doi: 10.1111/j.1365-2966.2007.12157.x
- Ichikawa et al. (2015) Ichikawa, K., Packham, C., Ramos Almeida, C., et al. 2015, ApJ, 803, 57, doi: 10.1088/0004-637X/803/2/57
- Ichikawa et al. (2019) Ichikawa, K., Ricci, C., Ueda, Y., et al. 2019, ApJ, 870, 31, doi: 10.3847/1538-4357/aaef8f
- Imanishi et al. (2007) Imanishi, M., Dudley, C. C., Maiolino, R., et al. 2007, ApJS, 171, 72, doi: 10.1086/513715
- Imanishi et al. (2006) Imanishi, M., Dudley, C. C., & Maloney, P. R. 2006, ApJ, 637, 114, doi: 10.1086/498391
- Imanishi et al. (2008) Imanishi, M., Nakagawa, T., Ohyama, Y., et al. 2008, PASJ, 60, S489, doi: 10.1093/pasj/60.sp2.S489
- Inami et al. (2013) Inami, H., Armus, L., Charmandaris, V., et al. 2013, ApJ, 777, 156, doi: 10.1088/0004-637X/777/2/156
- Ishisaki et al. (2007) Ishisaki, Y., Maeda, Y., Fujimoto, R., et al. 2007, PASJ, 59, 113, doi: 10.1093/pasj/59.sp1.S113
- Jansen et al. (2001) Jansen, F., Lumb, D., Altieri, B., et al. 2001, A&A, 365, L1, doi: 10.1051/0004-6361:20000036
- Kartaltepe et al. (2010) Kartaltepe, J. S., Sanders, D. B., Le Floc’h, E., et al. 2010, ApJ, 721, 98, doi: 10.1088/0004-637X/721/1/98
- Kawamuro et al. (2016) Kawamuro, T., Ueda, Y., Tazaki, F., Ricci, C., & Terashima, Y. 2016, ApJS, 225, 14, doi: 10.3847/0067-0049/225/1/14
- Kormendy et al. (2011) Kormendy, J., Bender, R., & Cornell, M. E. 2011, Nature, 469, 374, doi: 10.1038/nature09694
- Krolik & Begelman (1988) Krolik, J. H., & Begelman, M. C. 1988, ApJ, 329, 702, doi: 10.1086/166414
- Laurent et al. (2000) Laurent, O., Mirabel, I. F., Charmandaris, V., et al. 2000, A&A, 359, 887. https://arxiv.org/abs/astro-ph/0005376
- Levenson et al. (2004) Levenson, N. A., Weaver, K. A., Heckman, T. M., Awaki, H., & Terashima, Y. 2004, ApJ, 602, 135, doi: 10.1086/380836
- Liu & Li (2014) Liu, Y., & Li, X. 2014, ApJ, 787, 52, doi: 10.1088/0004-637X/787/1/52
- Madau & Dickinson (2014) Madau, P., & Dickinson, M. 2014, ARA&A, 52, 415, doi: 10.1146/annurev-astro-081811-125615
- Madsen et al. (2017) Madsen, K. K., Beardmore, A. P., Forster, K., et al. 2017, AJ, 153, 2, doi: 10.3847/1538-3881/153/1/2
- Madsen et al. (2015) Madsen, K. K., Harrison, F. A., Markwardt, C. B., et al. 2015, ApJS, 220, 8, doi: 10.1088/0067-0049/220/1/8
- Magdziarz & Zdziarski (1995) Magdziarz, P., & Zdziarski, A. A. 1995, MNRAS, 273, 837, doi: 10.1093/mnras/273.3.837
- Marinucci et al. (2012) Marinucci, A., Bianchi, S., Nicastro, F., Matt, G., & Goulding, A. D. 2012, ApJ, 748, 130, doi: 10.1088/0004-637X/748/2/130
- Mitsuda et al. (2007) Mitsuda, K., Bautz, M., Inoue, H., et al. 2007, PASJ, 59, S1, doi: 10.1093/pasj/59.sp1.S1
- Mullaney et al. (2011) Mullaney, J. R., Alexander, D. M., Goulding, A. D., & Hickox, R. C. 2011, MNRAS, 414, 1082, doi: 10.1111/j.1365-2966.2011.18448.x
- Nandra et al. (2007) Nandra, K., O’Neill, P. M., George, I. M., & Reeves, J. N. 2007, MNRAS, 382, 194, doi: 10.1111/j.1365-2966.2007.12331.x
- Nenkova et al. (2008a) Nenkova, M., Sirocky, M. M., Ivezić, Ž., & Elitzur, M. 2008a, ApJ, 685, 147, doi: 10.1086/590482
- Nenkova et al. (2008b) Nenkova, M., Sirocky, M. M., Nikutta, R., Ivezić, Ž., & Elitzur, M. 2008b, ApJ, 685, 160, doi: 10.1086/590483
- Oda et al. (2017) Oda, S., Tanimoto, A., Ueda, Y., et al. 2017, ApJ, 835, 179, doi: 10.3847/1538-4357/835/2/179
- Ogawa et al. (2020) Ogawa, S., Ueda, Y., Tanimoto, A., & Yamada, S. 2020, ApJ, submitted
- Ogawa et al. (2019) Ogawa, S., Ueda, Y., Yamada, S., Tanimoto, A., & Kawaguchi, T. 2019, ApJ, 875, 115, doi: 10.3847/1538-4357/ab0e08
- Reines & Volonteri (2015) Reines, A. E., & Volonteri, M. 2015, ApJ, 813, 82, doi: 10.1088/0004-637X/813/2/82
- Ricci et al. (2014) Ricci, C., Ueda, Y., Ichikawa, K., et al. 2014, A&A, 567, A142, doi: 10.1051/0004-6361/201322701
- Ricci et al. (2017a) Ricci, C., Trakhtenbrot, B., Koss, M. J., et al. 2017a, Nature, 549, 488, doi: 10.1038/nature23906
- Ricci et al. (2017b) Ricci, C., Bauer, F. E., Treister, E., et al. 2017b, MNRAS, 468, 1273, doi: 10.1093/mnras/stx173
- Ricci et al. (2017c) Ricci, C., Trakhtenbrot, B., Koss, M. J., et al. 2017c, ApJS, 233, 17, doi: 10.3847/1538-4365/aa96ad
- Rivers et al. (2015) Rivers, E., Risaliti, G., Walton, D. J., et al. 2015, ApJ, 804, 107, doi: 10.1088/0004-637X/804/2/107
- Romero-Cañizales et al. (2017) Romero-Cañizales, C., Alberdi, A., Ricci, C., et al. 2017, MNRAS, 467, 2504, doi: 10.1093/mnras/stx224
- Sanders et al. (2003) Sanders, D. B., Mazzarella, J. M., Kim, D. C., Surace, J. A., & Soifer, B. T. 2003, AJ, 126, 1607, doi: 10.1086/376841
- Sanders & Mirabel (1996) Sanders, D. B., & Mirabel, I. F. 1996, ARA&A, 34, 749, doi: 10.1146/annurev.astro.34.1.749
- Sanders et al. (1988) Sanders, D. B., Soifer, B. T., Elias, J. H., Neugebauer, G., & Matthews, K. 1988, ApJ, 328, L35, doi: 10.1086/185155
- Shangguan et al. (2019) Shangguan, J., Ho, L. C., Li, R., et al. 2019, ApJ, 870, 104, doi: 10.3847/1538-4357/aaf21a
- Singh et al. (2012) Singh, V., Risaliti, G., Braito, V., & Shastri, P. 2012, MNRAS, 419, 2089, doi: 10.1111/j.1365-2966.2011.19861.x
- Smith et al. (2001) Smith, R. K., Brickhouse, N. S., Liedahl, D. A., & Raymond, J. C. 2001, ApJ, 556, L91, doi: 10.1086/322992
- Stierwalt et al. (2013) Stierwalt, S., Armus, L., Surace, J. A., et al. 2013, ApJS, 206, 1, doi: 10.1088/0067-0049/206/1/1
- Tadaki et al. (2014) Tadaki, K.-i., Kodama, T., Tanaka, I., et al. 2014, ApJ, 780, 77, doi: 10.1088/0004-637X/780/1/77
- Tanaka et al. (2017) Tanaka, I., Yagi, M., & Taniguchi, Y. 2017, PASJ, 69, 90, doi: 10.1093/pasj/psx100
- Tanimoto et al. (2018) Tanimoto, A., Ueda, Y., Kawamuro, T., et al. 2018, ApJ, 853, 146, doi: 10.3847/1538-4357/aaa47c
- Tanimoto et al. (2020) Tanimoto, A., Ueda, Y., Odaka, H., et al. 2020, ApJ, submitted
- Tanimoto et al. (2019) —. 2019, ApJ, 877, 95, doi: 10.3847/1538-4357/ab1b20
- Teng et al. (2015) Teng, S. H., Rigby, J. R., Stern, D., et al. 2015, ApJ, 814, 56, doi: 10.1088/0004-637X/814/1/56
- Toba et al. (2019) Toba, Y., Ueda, Y., Matsuoka, K., et al. 2019, MNRAS, 484, 196, doi: 10.1093/mnras/sty3523
- Tristram et al. (2014) Tristram, K. R. W., Burtscher, L., Jaffe, W., et al. 2014, A&A, 563, A82, doi: 10.1051/0004-6361/201322698
- Ueda et al. (2014) Ueda, Y., Akiyama, M., Hasinger, G., Miyaji, T., & Watson, M. G. 2014, ApJ, 786, 104, doi: 10.1088/0004-637X/786/2/104
- Ueda et al. (2003) Ueda, Y., Akiyama, M., Ohta, K., & Miyaji, T. 2003, ApJ, 598, 886, doi: 10.1086/378940
- Ueda et al. (2007) Ueda, Y., Eguchi, S., Terashima, Y., et al. 2007, ApJ, 664, L79, doi: 10.1086/520576
- Vasudevan & Fabian (2007) Vasudevan, R. V., & Fabian, A. C. 2007, MNRAS, 381, 1235, doi: 10.1111/j.1365-2966.2007.12328.x
- Véron-Cetty & Véron (2003) Véron-Cetty, M. P., & Véron, P. 2003, A&A, 412, 399, doi: 10.1051/0004-6361:20034225
- Wada & Norman (2002) Wada, K., & Norman, C. A. 2002, ApJ, 566, L21, doi: 10.1086/339438
- Wang et al. (2006) Wang, J. L., Xia, X. Y., Mao, S., et al. 2006, ApJ, 649, 722, doi: 10.1086/506902
- Weisskopf et al. (2002) Weisskopf, M. C., Brinkman, B., Canizares, C., et al. 2002, PASP, 114, 1, doi: 10.1086/338108
- Willingale et al. (2013) Willingale, R., Starling, R. L. C., Beardmore, A. P., Tanvir, N. R., & O’Brien, P. T. 2013, MNRAS, 431, 394, doi: 10.1093/mnras/stt175
- Yamada et al. (2018) Yamada, S., Ueda, Y., Oda, S., et al. 2018, ApJ, 858, 106, doi: 10.3847/1538-4357/aabacb
- Yamada et al. (2019) Yamada, S., Ueda, Y., Tanimoto, A., et al. 2019, ApJ, 876, 96, doi: 10.3847/1538-4357/ab14f0
- Yang et al. (2015) Yang, H., Wang, J., & Liu, T. 2015, ApJ, 799, 91, doi: 10.1088/0004-637X/799/1/91