Response of a Li-glass/multi-anode photomultiplier detector to focused proton and deuteron beams
Abstract
The response of a position-sensitive Li-glass based scintillation detector to focused beams of 2.5 MeV protons and deuterons has been investigated. The beams were scanned across the detector in 0.5 mm horizontal and vertical steps perpendicular to the beams. Scintillation light was registered using an 8 8 pixel multi-anode photomultiplier tube. The signal amplitudes were recorded for each pixel on an event-by-event basis. Several pixels generally registered considerable signals at each beam location. The number of pixels above set thresholds were investigated, with the optimization of the single-hit efficiency over the largest possible area as the goal. For both beams, at a threshold of 50% of the mean of the full-deposition peak, 80% of the events were registered in a single pixel, resulting in an effective position resolution of 5 mm in X and Y.
keywords:
SoNDe thermal-neutron detector, GS20 scintillator, Li-glass, H12700A multi-anode photomultiplier, position-dependent response, protons, deuterons1 Introduction
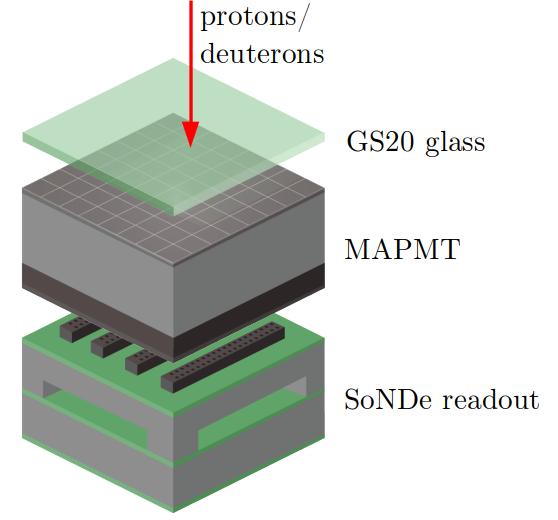
Position-sensitive 3He-free [1, 2, 3] thermal-neutron detectors with high counting-rate capability are essential to the scientific program to be carried out at the European Spallation Source (ESS) [4, 6]. Solid-state Neutron Detectors SoNDe (patent EP000003224652A1) [7, 8, 9] with two-dimensional position sensitivity will be employed for small-angle neutron-scattering experiments [10, 11, 12, 13, 14, 15, 16, 17, 19, 18]. The modular SoNDe concept will facilitate the instrumentation of large areas with a position reconstruction accuracy of 6 mm for the detected neutron. A SoNDe “module” consists of a thin Li-glass scintillator sheet (GS20) that is sensitive to thermal neutrons coupled to a 64-pixel multi-anode photomultiplier tube (MAPMT) used to collect the scintillation light. Signals are read out using custom electronics.
Laser light has previously been employed to study the responses of several different MAPMTs in detail [20, 21, 22, 23, 24, 25, 26, 27, 28]. Thermal neutrons have been used to perform first tests both on similar detectors [29] and on SoNDe modules [9, 30]. A thermal-neutron interaction with the 6Li of the Li-glass results in an -particle (2.05 MeV) and a triton 2.73 MeV). Scans of a collimated beam of 4 MeV -particles from a 241Am source have been used to study the position-dependent response of a SoNDe detector prototype [31]. Here, in the absence of tritium beams, beams of 2.5 MeV protons and deuterons have been scanned across the face of a SoNDe module. The goals were to:
-
1.
complement the existing -particle studies on the position-sensitive response of the detector for events triggering up to four pixels
- 2.
-
3.
investigate the areal response of the detector to events which trigger only one pixel
-
4.
determine the optimal threshold for such events
2 Apparatus
2.1 Proton and deuteron beams
The Lund Ion Beam Analysis Facility [32] of the Division of Nuclear Physics at Lund University employs a single-ended 3 MV (max) Pelletron electrostatic accelerator supplied by the National Electrostatics Corporation (NEC) [33]. This machine was used to deliver continuous beams of protons and deuterons with energies of 2.5 MeV to the module under investigation.
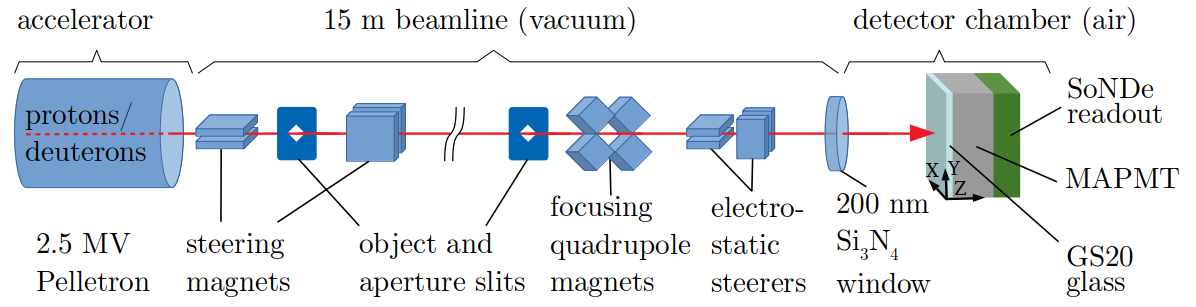
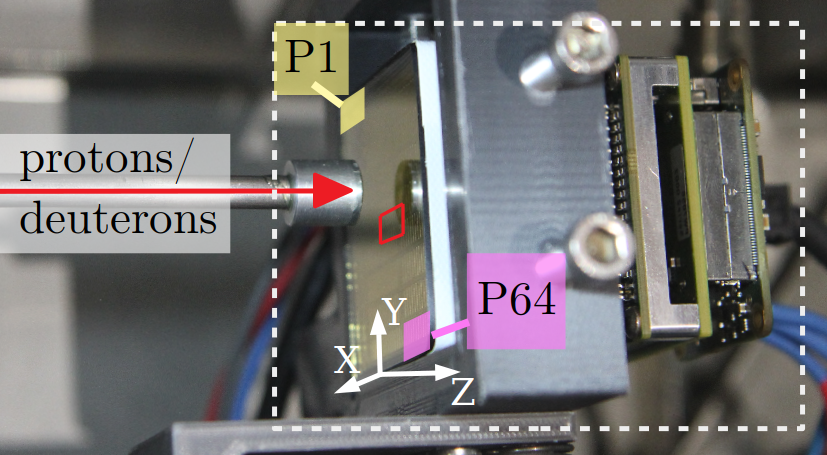
Figure 1 shows the experimental setup. A 15 m long beamline between the Pelletron and the end station consisted of dipole magnets for energy selection and steering, object and aperture slits for adjusting the beam size and intensity, quadrupole magnets for focusing, and electrostatic steerers for fine tuning of the beam position [34, 35]. A 200 nm thick Si3N4 vacuum window [36] separated the high-vacuum beamline from the detector chamber operated at room pressure and temperature. The detector chamber contained a motorized XYZ translator on which a SoNDe module (Fig. 3(b)) was mounted. The beam spots at the location of the SoNDe module were estimated to be in diameter using a fluorescent glass plate. The sizes of the beamspots were due largely to multiple scattering in the vacuum window. Beam intensity was adjusted using the aperture slits so that the average counting rate on the SoNDe module was 5 kHz.
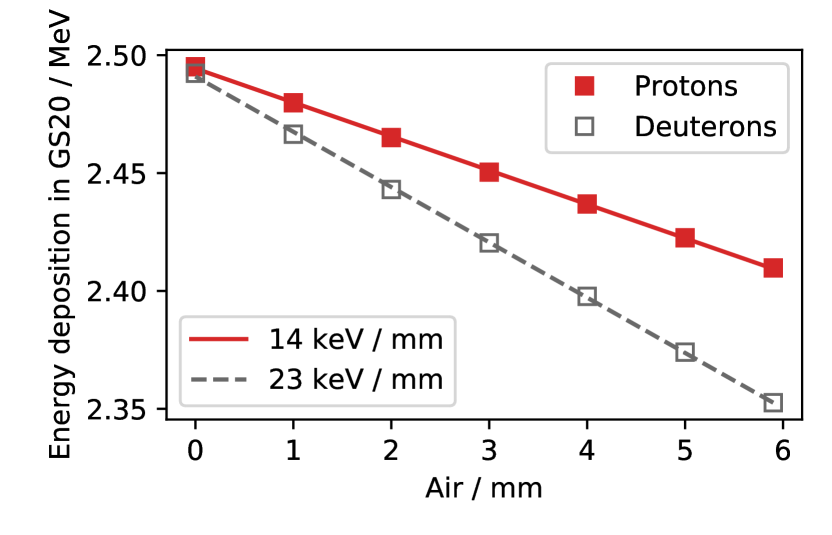
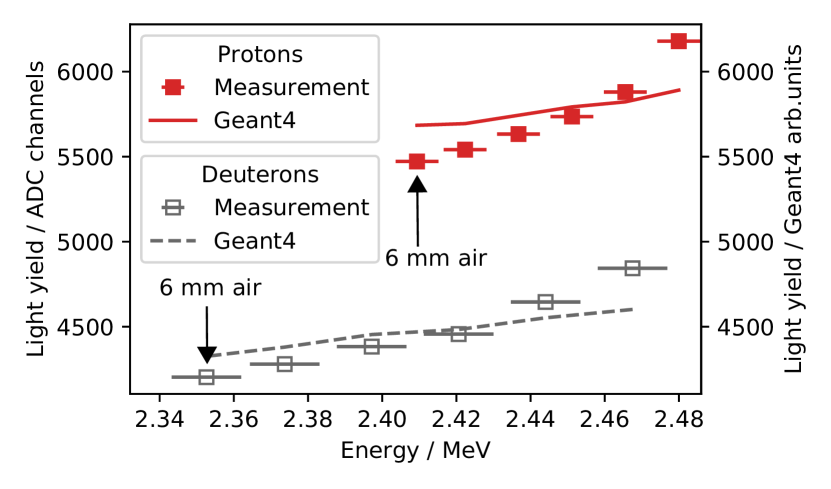
The amplitude of proton and deuteron signals was measured as the thickness of the traversed air gap between the vacuum window and the GS20 was increased in 1 mm steps up to 6 mm (Fig. 2). Figure 2(a) shows SRIM [37, 38] calculations of the proton and deuteron energy loss in the vacuum window and air. These predict that a 2.5 MeV proton loses 6 keV in the window and 14 keV/mm in air, while for deuterons the equivalent numbers are 10 keV and 23 keV/mm. Figure 2(b) shows the measured scintillation-light yield from the GS20 as the air gap is varied, along with a GEANT4 simulation [41]. The simulation, in addition to energy deposition, models scintillation emission and transport. It fits the data best when the Birks constant [42, 43] for GS20 is set to 0.021 mm/MeV. The light yield predicted by the simulation was normalized to the measured data so the deviation between measurements and simulations was minimized (at most 5%). The deviation could stem from a combination of uncertainty in the measured air gap (0.2 mm) and effects not yet covered in the simulation. The correlation between the data and simulations confirms that protons of all energies produce more scintillation light than deuterons of the same energy. This is because for a given energy, the specific ionization density of deuterons is higher than that of protons, resulting in a higher level of saturation of the local scintillation-production mechanisms.
2.2 SoNDe module
As described in the following sections, the core components of a SoNDe module (Fig. 3) are:
-
1.
a thin, lithium-silicate, scintillating-glass sheet
-
2.
a MAPMT
-
3.
purpose-built SoNDe readout electronics
2.2.1 Li-glass scintillator
GS20 [44, 45, 46, 47] is cerium-activated lithium-silicate glass scintillator developed for the detection of thermal neutrons. The 50 mm 50 mm 1 mm sheet from Scintacor [48], had polished front and rear surfaces and rough-cut 1 mm edges. The sheet was held in place on the MAPMT window using tape along the thin edges. Consistent with the planned configuration at ESS, no optical coupling medium was employed between the GS20 and MAPMT and no optical reflector was placed over the front face of the GS20. The density of 6Li in GS20 (assumed to be uniform) is 1.58 atoms/cm3. At thermal energies (25 meV), the n + 6Li 3H + capture cross section is 940 b, resulting in a detection efficiency of 75% for a 1 mm sheet. The capture process produces a 2.73 MeV 3H (average range in GS20 of ) and a 2.05 MeV -particle (average range in GS20 of ) [49]. The 6600 photon scintillation-light yield [9] corresponding to a thermal-neutron interaction (4.78 MeV) is quoted as 20-30% of anthracene and the emission spectrum peaks at 390 nm [50]. For 2.5 MeV protons and deuterons, the GEANT4 simulation predicts 125 and 100 scintillation photons reaching the photocathode, respectively. Light transport from the GS20 (refractive index 1.55 at 395 nm) through a thin air gap (refractive index 1) into the MAPMT borosilicate glass window (refractive index 1.53) is rather inefficient.
2.2.2 Multi-anode photomultiplier tube
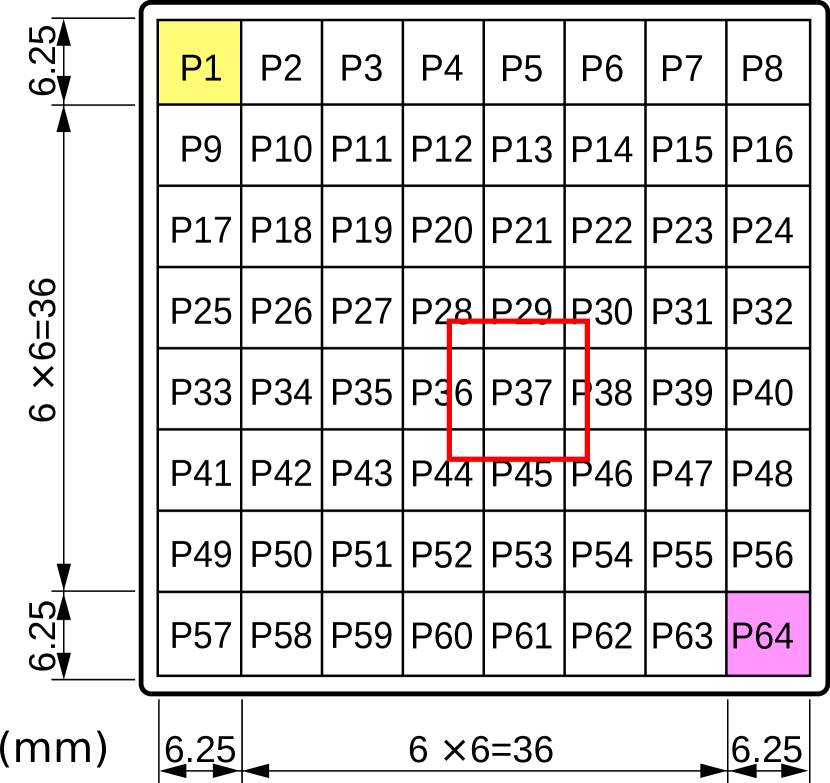
Figure 3(b) shows a photograph of the SoNDe module mounted in the detector chamber, while Fig. 3(c) shows a MAPMT pixel map. The 8 8 pixel Hamamatsu H12700A MAPMT chosen for the SoNDe module employs a borosilicate glass window. The outer dimensions of the MAPMT are 52 mm 52 mm, while the active area of the photocathode is 48.5 mm 48.5 mm. Thus 87% of the MAPMT surface is active. Each of the 64 pixels has an area of 6 mm 6 mm. The peak quantum efficiency of the bialkali photocathode, 33% at 380 nm, is well matched to the scintillation emission spectrum from GS20, which peaks at 390 nm. The Hamamatsu data sheet for the H12700A MAPMT used in this study gives a gain of 2.09 106 and a dark current of 2.67 nA at a cathode-to-anode voltage of 1000 V, and a factor 1.7 (worst-case) pixel-to-pixel gain difference.
2.2.3 Readout electronics
Produced by IDEAS [52], the readout electronics for the SoNDe module [9] consist of a front-end board and a controller board. The front-end board accomodates four 16-channel IDE3465 ASICs which digitize the MAPMT signals with 14 bit precision. The controller board houses an FPGA and a MiniIO port for communication via ethernet. Two modes of operation are “Time-of-flight” mode (TOF), envisioned for production running at ESS at average rates of 20 MHz/m2 and “All-channel Spectroscopy” mode (ACS), used in this work, with a rate limitation of 10 kHz for one SoNDe module, equivalent to 4 MHz/m2. In TOF mode, when any pixel-amplitude threshold is exceeded, the controller board is signaled to identify the trigger pixel (the pixel with the largest signal), perform the time stamping, and then pass the resulting data to the ethernet interface. In ACS mode, when any pixel-amplitude threshold is exceeded, the digitized signals from all 64 pixels are read out. In the ACS-mode investigations, a low hardware threshold of 750 ADC channels was employed, which corresponds to 12.5% of the mean channel of the distribution of the full energy deposition of 2.48 MeV protons (Fig. 4). Higher thresholds were applied offline, as were corrections for differing pixel gains.
3 Measurement
Proton and deuteron beams were used to systematically irradiate the SoNDe module at well-defined positions. After leaving the vacuum window, the beams passed through 1.0 mm of air before striking the upstream face of the GS20 sheet at normal incidence. The SoNDe module was translated with its face perpendicular to the direction of the beams using an XYZ-coordinate scanner instrumented with Physik Instrumente M-111 micro translation stages and C-862 motor controllers [53]. The scanning assembly was configured to allow for regular scans in two dimensions with a stepsize of 0.5 mm in both the X and Y directions. The assembly could also move in the Z direction away from the vacuum window. The temperature (25 °C), pressure (101.3 kPa), and humidity (30%) within the detector chamber that housed the scanning assembly were logged at the beginning and end of each scan.
The anode signals from each of the pixels in the MAPMT were processed using the purpose-built SoNDe electronics. The negative polarity analog pulses for each event with at least one pixel showing a signal above the threshold were measured. The threshold setting corresponded to an ADC value of about 750. The data were recorded on disk using an ESS Event Formation Unit (EFU) [54, 55, 56] running on a Centos 7 PC connected through the MiniIO port to Ethernet using the UDP protocol [57]. The EFU data-acquisition system is designed for use by ESS instruments and the acquisition closely resembles the mode of operation anticipated at ESS. Data were recorded for 2 s (10000 events) at each point on a scan, followed by a motor translation, so that a complete scan of 2 2 pixels with 0.5 mm spacing took several hours. The data were subsequently analyzed using the Python-based [58] pandas [59] analysis tools.
4 Results
Previous work [20, 21, 22, 23, 24, 25, 27, 31] clearly indicates that MAPMT pixel-gain maps are highly dependent upon the method of photon production. Thus, all of the results presented below have been pedestal and gain corrected with pixel-gain maps generated from the average of the proton- and deuteron-beam irradiations of the pixel centers.
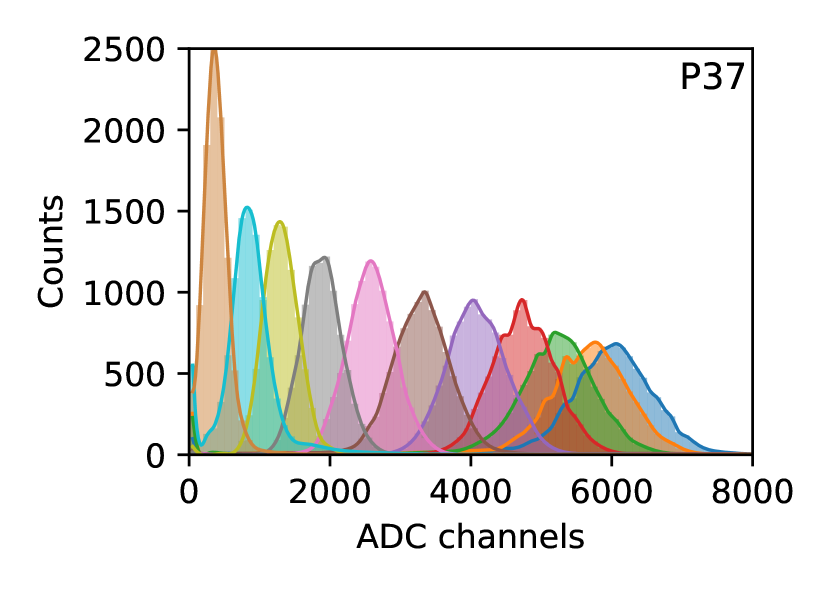
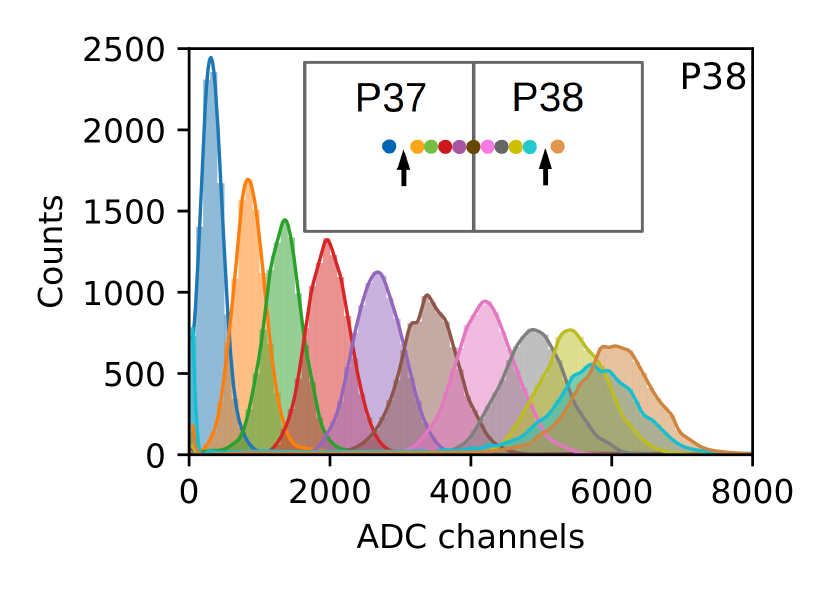
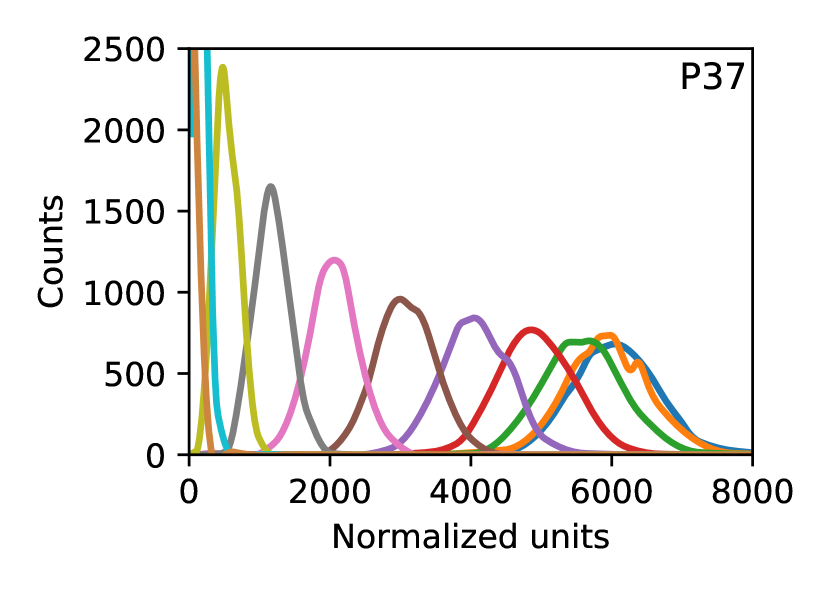
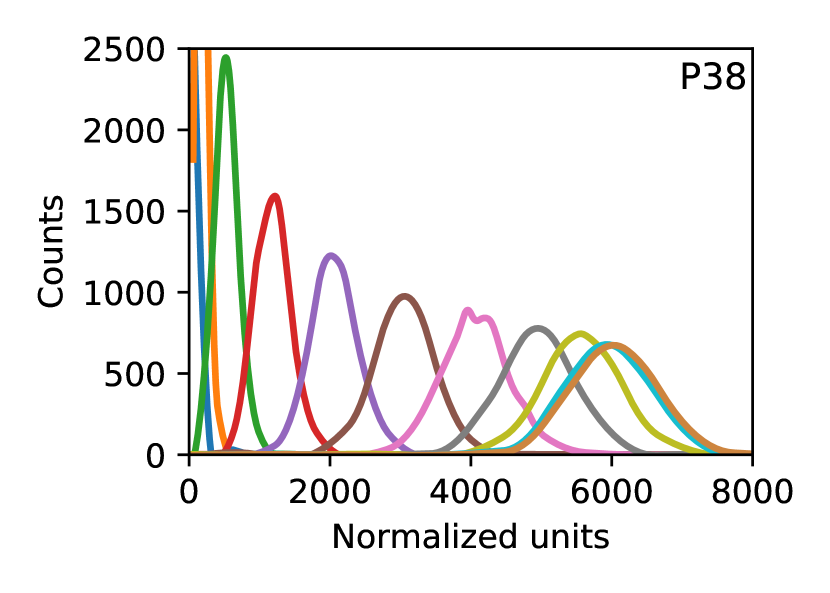
Figure 4 shows results from a horizontal scan of the SoNDe module across the proton beam from the center of P37 to the center of P38 in steps of 0.5 mm. Also shown are GEANT4 simulations. For 11 scan positions, the proton pulse-height spectra are displayed in Fig. 4(a) (P37) and Fig. 4(b) (P38) and the corresponding GEANT4-simulated scintillation-light yields are displayed in Fig. 4(c) (P37) and Fig. 4(d) (P38). The amount of scintillation light collected in a single pixel is clearly dependent upon the location of the proton beam. The amplitude of the signal is largest when scintillation light is produced at the center of the pixel and smallest when produced at the edge. Light produced at the boundary between two pixels is shared equally by both pixels. The simulations underestimate the amount of scintillation light spreading to the adjacent pixel closest to the particle interaction point by up to 15% depending on the beam position. Note that the GEANT4 simulation does not include the concavity of the MAPMT window but instead employs a constant air gap.
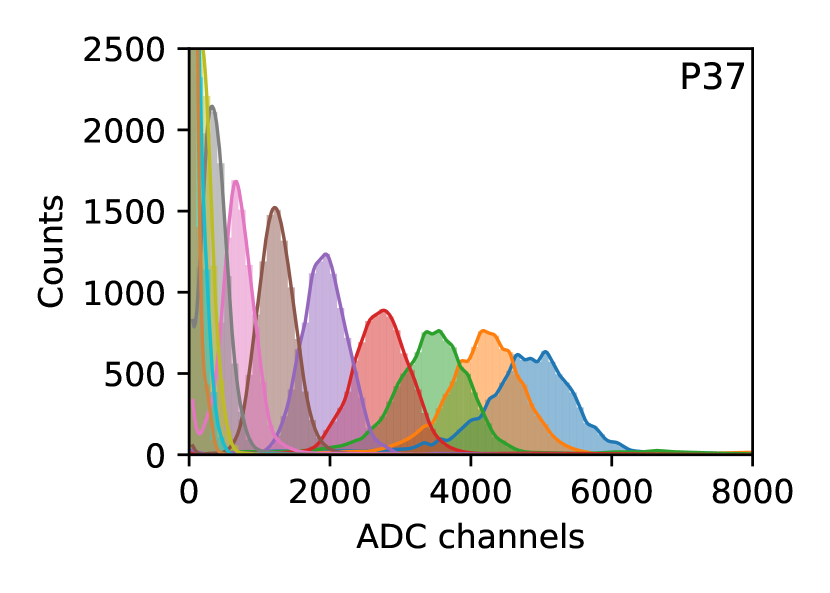
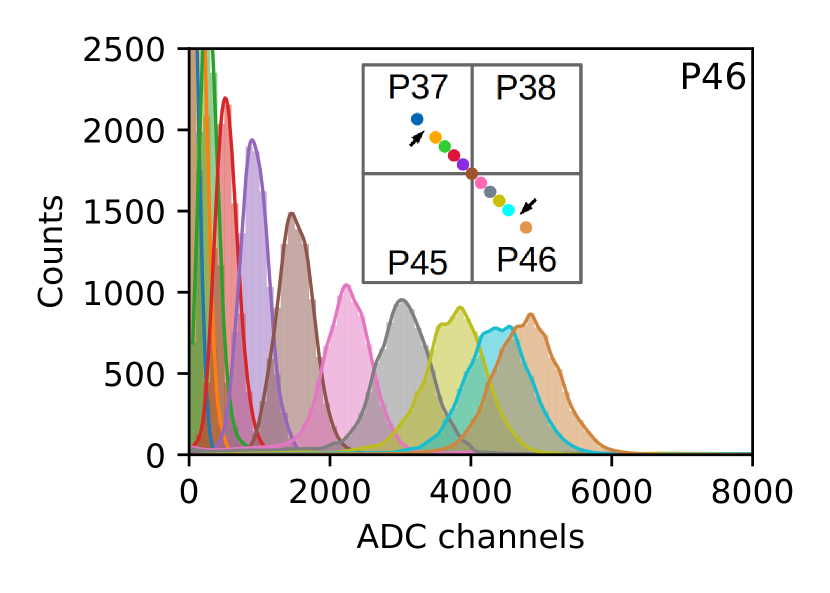
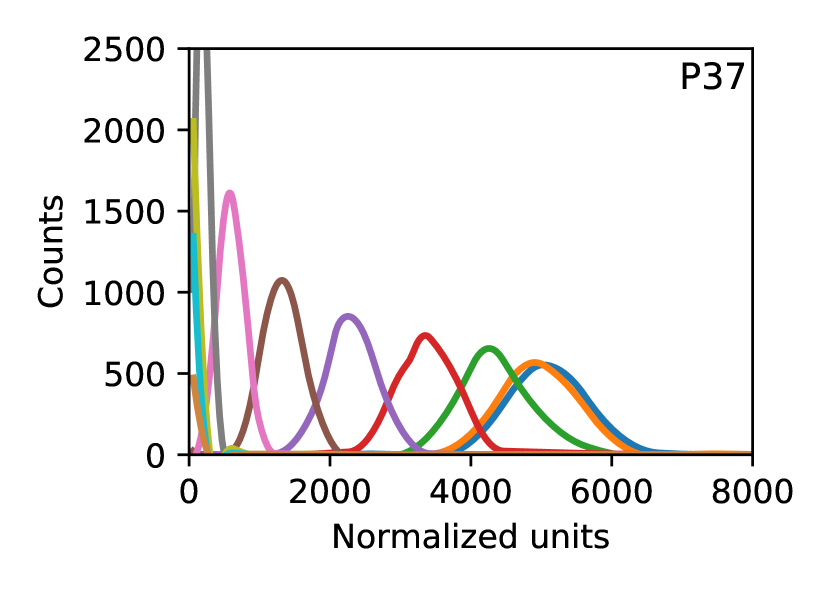
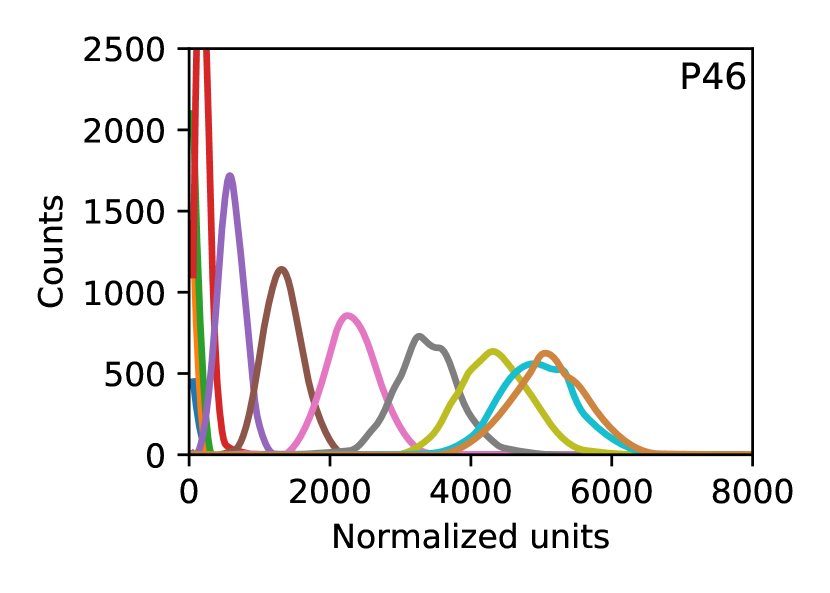
Figure 5 shows results from a diagonal scan of the SoNDe module across the 2.47 MeV deuteron beam from the center of P37 to the center of P46 together with GEANT4 simulations. The scan was performed in a series of 0.5 mm horizontal and vertical steps, for an effective diagonal stepsize of 0.71 mm. For 13 scan positions, the deuteron pulse-height spectra are displayed in Fig. 5(a) (P37) and Fig. 5(b) (P46) and the corresponding GEANT4-simulated scintillation-light yields are displayed in Fig. 5(c) (P37) and Fig. 5(d) (P46). As anticipated, for a given pixel, the amplitude of the signal is largest when scintillation light is produced at the center of the pixel, and smallest when produced at the corner. Light produced at the corner of four pixels is shared equally by all four pixels. As before, the simulations underestimate the amount of scintillation light spreading to the pixels in close vicinity.
Figure 6 shows how the scintillation light was shared by adjacent pixels P37 and P38 as the SoNDe module was scanned horizontally across the proton (Fig. 6(a)) and deuteron beams (Fig. 6(b)).
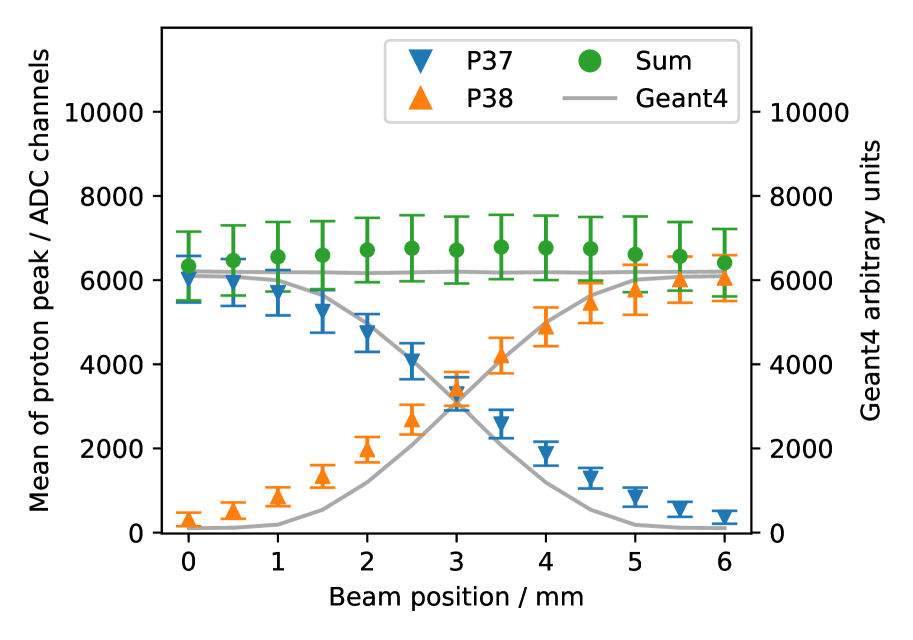
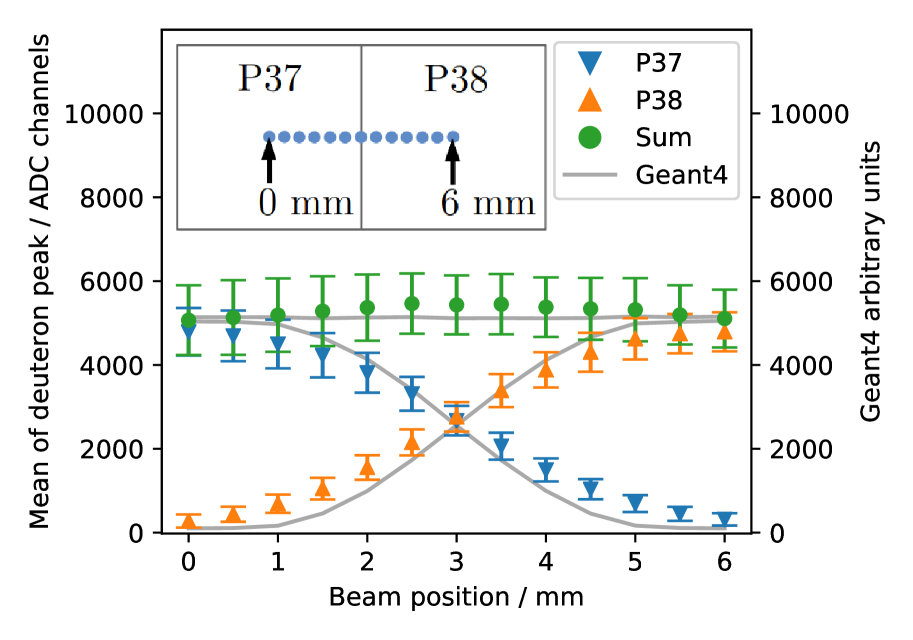
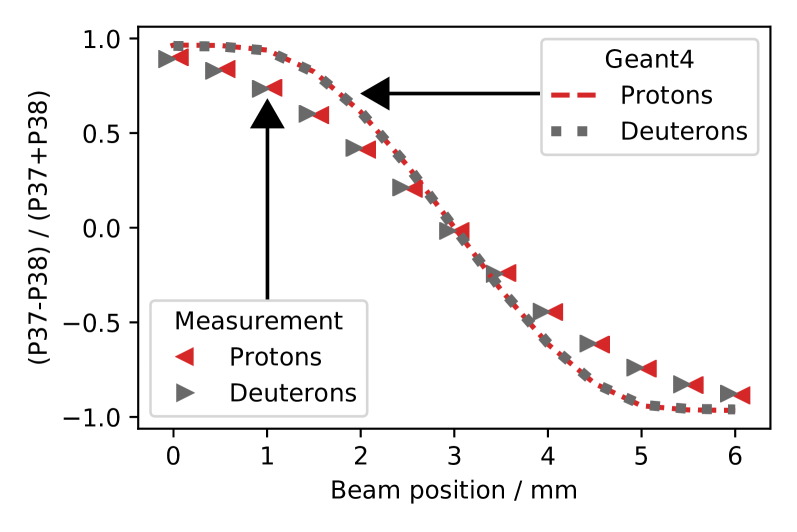
Figures 6(a) and 6(b) show the means of the pulse-height distributions displayed as a function of beam position. The curves are spline fits to the corresponding GEANT4 simulations. The sum distributions show that the proton beam produced a factor of 1.25 more scintillation light than the deuteron beam. The scan from P37 to P38 shows that light leakage to neighbouring pixels is relatively low close to pixel centers. Moving the particle beam from the center of P37 towards P38, 4% of the total light yield is lost to P38 in the first mm. Across the boundary between the pixels, the light-loss gradient increases to 35%/mm. Based upon the -particle scan results [31], it was anticipated that the sums of the gain-corrected charge distributions would be flat across the pixels and the boundary regions. Instead, the results have a slightly convex distribution centered at the pixel edge. This is because P37 and P38 together collect slightly more of the scintillation light produced from an event at the boundary between them than they collect from an event at the center of either pixel and the missing scintillation light is collected by the surrounding pixels (Fig. 7). Figure 6(c) shows the light-sharing ratio between P37 and P38 (defined as the difference between the means of the signal distributions in the pixels divided by the sum) for both protons and deuterons. The overlap between the proton and deuteron data indicates that the light spreading mechanism is very similar for both particles. The absolute difference between the data and the simulation is up to 20%, greatest in the region between the center of a pixel and the edge. This difference could be due to scintillation-light spreading mechanisms which are not yet addressed in the simulation or even electronic crosstalk.
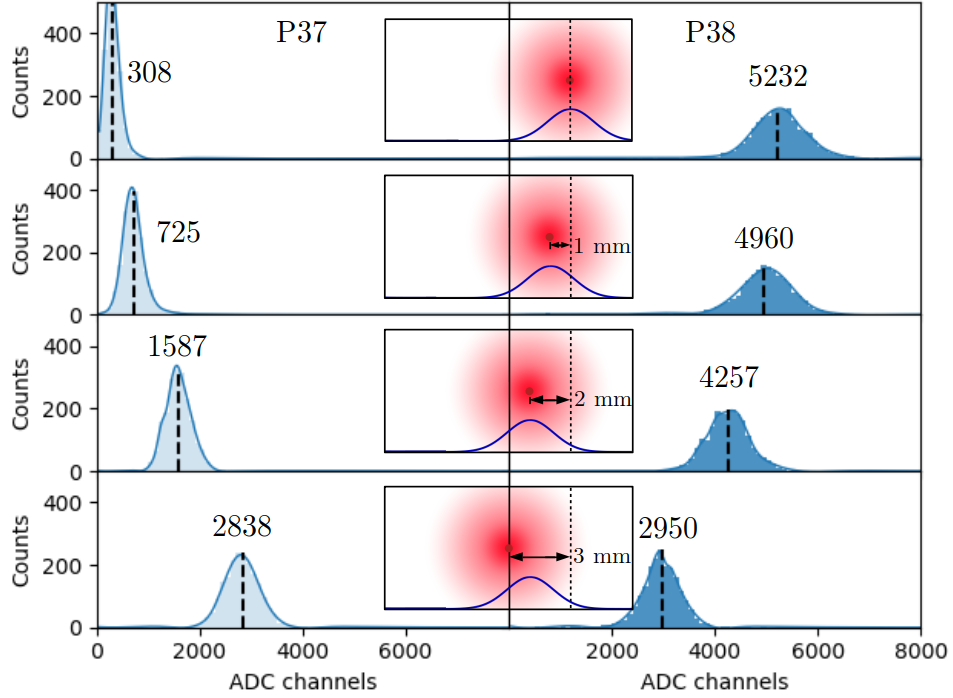
The standard mode of operation of SoNDe at ESS will be TOF mode in which every pixel exceeding its individual threshold will be time stamped, resulting in a data set of time-stamped pixel IDs without the underlying ADC information. Thus, knowledge of the behavior of adjacent pixels when the scintillation is registered in two or more of them is important. Figure 7 shows the division of the signal in the SoNDe module as the proton beam was stepped across the boundary between adjacent pixels. The diameter proton beam was simulated [41] using GEANT4to produce a distribution of scintillation light incident on the photocathode with a FWHM of 2 mm. Given the 0.5 mm mapping stepsize, this means that the majority of the scintillation light corresponding to irradiations at the center of a pixel or the first two horizontal steps towards a boundary is detected by the irradiated pixel. Due to the width of the photon distribution, an increasing amount of signal is registered by the adjacent pixel as the boundary is approached. In the top panel, the beam was centered on P38 resulting in a (94/6) P38/P37 division of the gain-corrected charge. In the second panel, the beam was translated 1 mm towards the boundary between P38 and P37, resulting in a (87/13) signal division. In the third panel, another 1 mm shift closer to the P38/P37 boundary resulted in a (73/27) division. In the bottom panel, the beam is incident on the boundary between pixels, resulting in a (49/51) signal division. It is thus possible that in the regions near the boundaries between pixels, a triggering event may result in a large amount of charge in adjacent pixels, especially near corners.
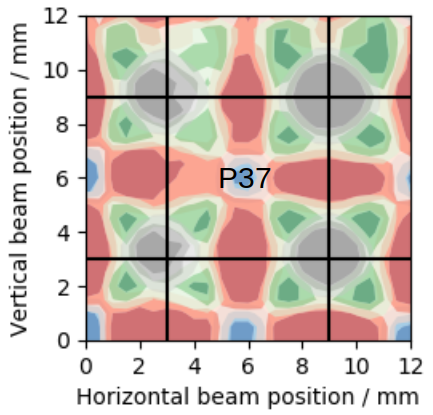
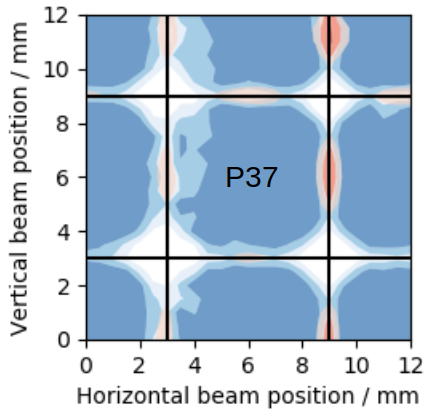
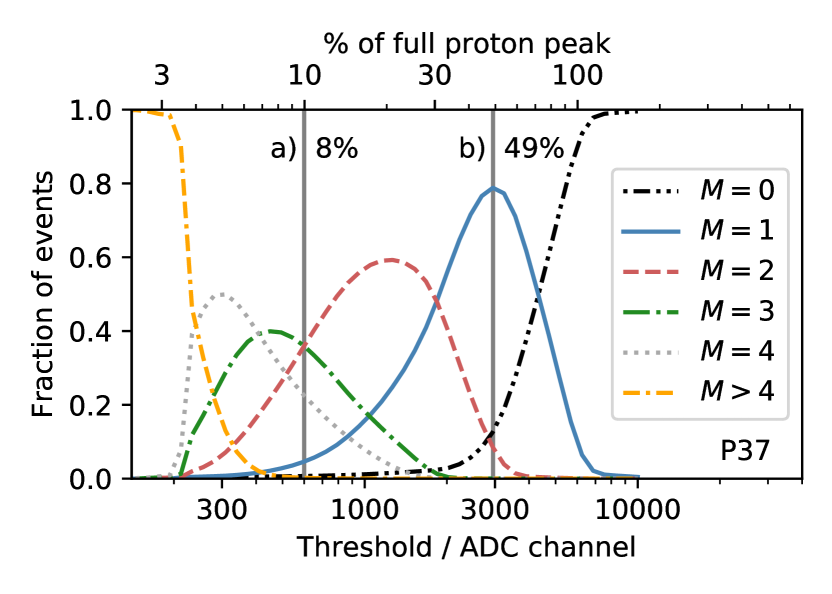
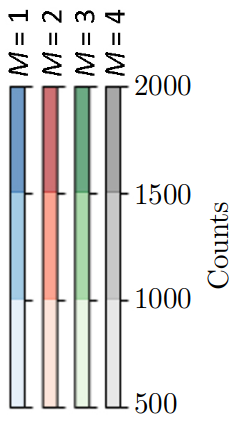
Knowledge of the behavior of the adjacent pixels as a function of threshold is important for the TOF mode of operation at ESS. In previous work [31] determining responses to scans of 1 mm FWHM beams of -particles, the hit multiplicity ( 1, 2, etc.) for adjacent pixels as a function of the beam-spot position was measured. A hit was registered if a pixel amplitude exceeded a threshold which was variable. Here, the procedure was repeated with the proton beam. A 26 26 grid of proton-beam irradiations with a stepsize of 0.5 mm in X and Y was performed. Figure 8 displays results in the neighborhood of P37. Spatial distributions of multiplicity for software thresholds of 600 (Fig. 8(a)) and 2950 (Fig. 8(b)) channels are shown. These thresholds correspond to 8% and 49% of the mean of the pixel-centered full-deposition proton peak, respectively. For a threshold of 600 channels, 1 events are tightly constrained to within 1 mm of pixel centers. Raising the threshold to 2950 channels results in the data being dominated by 1 events to within 1 mm of the pixel edges. The edges and corners are 0 zones. The threshold clearly affects the multiplicity-dependent efficiency, and the 2950 ADC channel threshold maximizes both the number of 1 events detected and the area of the detector where the 1 efficiency is high.
Figure 8(c) presents the threshold dependence of multiplicity for 14. Each of the curves demonstrate clear maxima so that the relative contribution of a given can be maximized by suitable choice of threshold. For example, for the threshold of 2950 ADC channels optimized for 1 events, 79% of the events have 1, 9% have 2, and a negligible number have 3,4. The tradeoff is that 12% of events have 0, so that the consequence of operating the SoNDe module in 1 mode is a loss of 12% of events. A corresponding analysis of the deuteron data demonstrates the same behavior. The 1 optimal threshold cut for deuterons is ADC channel 2300 corresponding to 47% of the mean of the pixel-centered full-deposition deuteron peak. Note that a threshold of at least 2500 ADC channels is necessary to completely discrimate against 1 MeV -rays from a 60Co source, which is indicative of possible background contributions.
5 Summary and Discussion
The position-dependent response of a SoNDe module, which consists of a 1 mm thick sheet of GS20 scintillating glass coupled to a 64 pixel H12700A MAPMT has been measured using highly focused beams of protons and deuterons. The signal amplitudes from individual pixels were investigated as a function of beam position by stepping the module through the beams using a precision XY coordinate translator. The diameter beams facilitated highly localized response mapping with a step size of 0.5 mm. A detailed GEANT4 model of the SoNDe module greatly aided in the interpretation of these data and facilitated the calibration of the scintillation-light yield in GS20 as a function of beam energy for both beams (Fig. 2).
Spectra were gain corrected on a pixel-by-pixel basis using the data obtained when the beams were positioned at the center of each pixel. The signal amplitudes were highly dependent on the beam position (Figs. 4 and 5). The single-pixel signal was strongest when the beam was located at the pixel center. Moving the beam by 1 mm from the center of a pixel towards a neighbouring pixel resulted in a 4% leakage of the scintillation light to that pixel. As the pixel boundary was approached, the leakage gradient increased to 25%/mm (Fig. 6). While the simulations underestimated the total amount of scintillation light shared across a pixel boundary, the overall agreement between the GEANT4 model and the data is very good. The amount of scintillation light produced in the GS20 sheet by 2.48 MeV protons was a factor of 1.25 greater than that produced by 2.47 MeV deuterons. The spreading of light from protons and deuterons was indistinguishable. The GEANT4 simulation produced a visualization of the scintillation-photon distributions as a function of beam position (Fig. 7). The proton beam directed towards the central pixel region resulted in little signal in an adjacent pixel. However, within 1 mm of the boundary, at least 40% of the scintillation light was registered in the adjacent pixel. When in use at ESS, SoNDe will record only the time-stamped pixel IDs for every pixel exceeding its individual threshold. Thus, in the pixel-boundary region, double counting can occur. The effect of the pixel threshold on double and even higher-order counting (the hit multiplicity) was studied as a function of beam position and threshold (Fig. 8). At a threshold of 50% of the mean of the proton full-deposition peak, 80% of the beam protons were registered in a single pixel. Of the remaining protons, 10% were double counted and 10% were not detected. The double-counted protons were confined to regions within 0.5 mm of pixel edges, while undetected protons were confined to regions within 1 mm of pixel corners. Thus, operated in this mode, the active area of the SoNDe module (87% of the MAPMT surface) provides a position resolution of 5 mm in X and Y and a detection efficiency of 80% for 2.49 MeV protons. Increasing the threshold further simply resulted in a further reduction in the single-pixel event-detection efficiency and sensitive area.
Acknowledgements
The support of the European Union via the Horizon 2020 Solid-State Neutron Detector Project, Proposal ID 654124, and the BrightnESS Project, Proposal ID 676548 is acknowledged. The support of the UK Science and Technology Facilities Council (Grant No. ST/P004458/1) and UK Engineering and Physical Sciences Research Council Centre for Doctoral Training in Intelligent Sensing and Measurement (Grant No. EP/L016753/1) are also acknowledged, as is Strategic Accelerator Support from the Engineering Faculty (LTH) of Lund University (Grant No. STYR 2019/1508).
References
- [1] R.T. Kouzes, PNNL-18388 Pacific Northwest National Laboratory, Richland, WA, (2009).
- [2] D.A. Shea, D. Morgan, Technical Report R41419, Congressional Research Service, (2010).
- [3] K. Zeitelhack, Neutron News, vol. 23, no. 4, pp. 10-13, (2012).
- [4] O. Kirstein et al., PoS Proc. Sci. (Vertex2014) 029 (2014), arXiv:1411.6194.
- [5] S. Peggs et al., ESS Technical Design Report (2013). ISBN 978-91-980173-2-8. https://europeanspallationsource.se/sites/default/files/downloads/2017/09/TDR_online_ver_all.pdf
- [6] The European Spallation Source, https://europeanspallationsource.se/
- [7] Solid-State Neutron Detector, https://cordis.europa.eu/project/rcn/194934_en.html
- [8] S. Jaksch et al., arXiv:1707.08679 [physics.ins-det].
- [9] S. Jaksch et al., Proc. Int. Conf. Neutron Optics (NOP2017), JPS Conf. Proc. 22 (2018) 011019. doi:10.7566/JPSCP.22.011019.
- [10] M. Heiderich et al., Nucl. Instr. and Meth. in Phys. Res. A 305 (1991) 423. doi:10.1016/0168-9002(91)90562-5.
- [11] R. Engels et al., IEEE Transactions on Nuclear Science, vol. 44, no. 3, June (1997) doi: 10.1109/23.603701
- [12] R. Engels et al., IEEE Transactions on Nuclear Science, vol. 45, no. 3, June (1998) doi: 10.1109/NSSMIC.1997.672706
- [13] R. Engels et al., IEEE Transactions on Nuclear Science, vol. 46, no. 4, Aug (1999) doi: 10.1109/23.790694
- [14] G. Kemmerling et al., IEEE Trans. Nucl. Sci. 48 (2001) 1114. doi:10.1109/23.958733.
- [15] R. Engels et al., IEEE Transactions on Nuclear Science, vol. 49, no. 3, June (2002) doi: 10.1109/23.790694
- [16] G. Kemmerling et al., IEEE Trans. Nucl. Sci. 51 (2004) 1098. doi:10.1109/TNS.2004.829576.
- [17] G. Kemmerling et al., IEEE Nucl. Sci. Symp. Conf. Rec 03CH37515 (2003) 722. doi:10.1109/NSSMIC.2003.1351801.
- [18] A.V. Feoktystov et al., J. Appl. Crystallogr. 48 (2015) 61. doi:10.1107/S1600576714025977.
- [19] S. Jaksch et al., Nucl. Instr. and Meth. in Phys. Res. A 762 (2014) 22. doi:10.1016/j.nima.2014.04.024.
- [20] S. Korpar et al., Nucl. Instr. and Meth. in Phys. Res. A 442 (2000) 316. doi:10.1016/S0168-9002(99)01242-5.
- [21] K. Rielage et al., Nucl. Instr. and Meth. in Phys. Res. A 463 (2001) 149. doi:10.1016/S0168-9002(01)00448-X.
- [22] T. Matsumoto et al., Nucl. Instr. and Meth. in Phys. Res. A 521 (2004) 367. doi:10.1016/j.nima.2003.11.384.
- [23] K. Lang et al., Nucl. Instr. and Meth. in Phys. Res. A 545 (2005) 852. doi:10.1016/j.nima.2005.02.041.
- [24] P. Abbon et al., Nucl. Instr. and Meth. in Phys. Res. A 595 (2008) 177. doi:10.1016/j.nima.2008.07.074.
- [25] R.A. Montgomery et al., Nucl. Instr. and Meth. in Phys. Res. A 695 (2012) 326, doi:10.1016/j.nima.2011.11.026.
- [26] R.A. Montgomery, Nucl. Instr. and Meth. in Phys. Res. A 732 (2013) 732, doi:10.1016/j.nima.2013.08.012.
- [27] R.A. Montgomery et al., Nucl. Instr. and Meth. in Phys. Res. A 790 (2015) 28. doi:10.1016/j.nima.2015.03.068.
- [28] X. Wang et al., Chinese Phys. C 40 (2016) 086003. doi:10.1088/1674-1137/40/8/086003.
- [29] F. Zai-Wei et al., Chinese Phys. C 36 (2012) 1095. doi:10.1088/1674-1137/36/11/010.
- [30] E. Rofors et al., to be submitted to Nucl. Instr. and Meth. in Phys. Res. A. in 2020.
- [31] E. Rofors et al., Nucl. Instr. and Meth. in Phys. Res. A. 929, (2019) 90, doi:10.1016/j.nima.2019.03.014.
- [32] Lund Ion Beam Analysis Facility, http://www.nuclear.lu.se/forskning/tillaempad-kaernfysik/libaf/
- [33] National Electrostatics Corporation, https://www.pelletron.com/
- [34] A. Shariff et al., Nucl. Instr. and Meth. in Phys. Res. B. 231, (2005) 7, doi: 10.1016/j.nimb.2005.01.027.
- [35] M. Elfman et al., Nucl. Instr. and Meth. in Phys. Res. B. 231 (2005) 14, doi: 10.1016/j.nimb.2005.01.028.
- [36] Silson Limited, http://silson.com/
- [37] J. F. Ziegler, Nucl. Instrum. Meth. in Phys. Res. B. 219 (2004) 1027, doi:10.1016/j.nimb.2004.01.208.
- [38] The Stopping and Range of Ions in Matter, http://www.srim.org/
- [39] S. Agostinelli et al., Nucl. Instr. and Meth. in Phys. Res. A. 506, (2003) 250, doi: 10.1016/S0168-9002(03)01368-8.
- [40] J. Allison et al., IEEE Trans. Nucl. Sci. 53, (2006) 270, doi: 10.1109/TNS.2006.869826.
- [41] J.R.M. Annand et al., to be submitted to Nucl. Instr. and Meth. in Phys. Res. A. in 2020.
- [42] J.B. Birks, Proc. Phys. Soc. A64 (1951) 874, doi:10.1088/0370-1298/64/10/303.
- [43] J.B. Birks, The Theory and Practice of Scintillation Counting, Pergamon Press, New York, U.S.A., 1964, ISBN:978-0-08-010472-0.
- [44] F.W.K. Firk et al., Nucl. Instr. and Meth. 13 (1961) 313, doi:10.1016/0029-554X(61)90221-X.
- [45] A.R. Spowart Nucl. Instr. and Meth. 135 (1976) 441, doi:10.1016/0029-554X(76)90057-4.
- [46] A.R. Spowart Nucl. Instr. and Meth. 140 (1977) 19, doi:10.1016/0029-554X(77)90059-3.
- [47] E.J. Fairley et al., Nucl. Instr. and Meth. 150 (1978) 159, doi:10.1016/0029-554X(78)90360-9.
- [48] Scintacor, https://scintacor.com/products/6-lithium-glass/
- [49] B. Jamieson et al., Nucl. Instr. and Meth. in Phys. Res. A 790 (2015) 6, doi:10.1016/j.nima.2015.04.022.
- [50] C.W.E. Van Eijk et al., Nucl. Instr. and Meth. in Phys. Res. A 529 (2004) 260. doi:10.1016/j.nima.2004.04.163.
- [51] Hamamatsu Photonics, https://www.hamamatsu.com/resources/pdf/etd/H12700_TPMH1348E.pdf
- [52] IDEAS Integrated Detector Electronics AS, https://ideas.no/
- [53] Physik Instrumente., https://www.physikinstrumente.com/.
- [54] A.H.C. Mukai et al., J. Instrum. 13 T10001 (2018) doi:10.1088/1748-0221/13/10/T10001
- [55] M.J. Christensen et al., J. Instrum. 13 T11002 (2018) doi:10.1088/1748-0221/13/11/T11002
- [56] M.J Christensen et al., 2018 Software neutron event data processing (2018) doi:10.17199/brightness.d5.6
- [57] M.J Christensen et al., arXiv:1706.00333 [physics.ins-det].
- [58] High level programming language. https://www.python.org/
- [59] Open source analysis tools for the Python programming language. https://pandas.pydata.org/