Precision measurement of 210Bi -spectrum
Abstract
The precision measurement of -spectrum shape for 210Bi (historically RaE) has been performed with a spectrometer based on semiconductor Si(Li) detector. This first forbidden non-unique transition has the transition form-factor strongly deviated from unity and knowledge of its spectrum would play an important role in low-background physics in presence of 210Pb background. The measured transition form-factor could be approximated as , that is in good agreement with previous studies and has significantly increased parameter precision.
I Introduction
Precision measurements of the -spectra are currently very important in neutron and nuclear -decay studies, as a means of searching for the effects beyond the Standard Model (SM) in the low energy region Herczeg (2001); Nico and Snow (2005). Accurate studies of nuclear -decays have been exploited for many years in various applications of fundamental physics problems, predominantly in neutrino physics.
In this paper we present the results of the measurement of 210Bi -spectrum performed with spectrometer based on Si(Li)-detectors Alexeev et al. (2018); Bazlov et al. (2018). The problems of 210Bi -decay such as strong deviation from the allowed energy distribution, prolonged lifetime and anomalous longitudinal electron polarization has has been investigated widely starting from 1930s in numerous experimental and theoretical works O’Conor (1937); Martin Leslie Harold and Howell (1939); Neary and Cockcroft (1940); Konopinski and Uhlenbeck (1941); Newby and Konopinski (1959); Fujita (1962); Kim and Rasmussen (1963); Spector (1963); Sodemann and Winther (1965); Damgaard et al. (1969); Fayans and A. (1970); R. Lohken and Schatz (1971); Morita et al. (1971); Ebert et al. (1975). The situation was clarified after the assumption that the ground state of 210Bi is the combination of several wave functions, calculation of nuclear matrix elements for -decay on the basis of the finite Fermi systems theory and extracting the nuclear wave functions directly from the experimental data (see Behrens and Szybisz (1974); Grau Carles and Grau Malonda (1996) and references quoted therein). The latest measurements of 210Bi -decay spectrum were performed in Plassmann and Langer (1954); Daniel (1962); Flothmann et al. (1969); Grau Carles and Grau Malonda (1996) via magnetic lens and solid state -spectrometers. The need for precise study of 210Bi -spectrum and improved of the shape factor continues to be an important task in nuclear physics.
The bismuth isotope 210Bi belongs to the natural radioactive decay chain of 238U. As a product of the radioactive gas 222Rn and the subsequent long-lived 210Pb, the isotope 210Bi is present inside or on the surface of almost all structural materials. At present, the precise measurement of 210Bi -spectrum remains a crucial task for background modeling of modern neutrino detectors, as well as for the dark matter searches or other low-background experiments. In particular, the shape of 210Bi -spectrum is very similar to the spectrum of recoil electrons originated from scattering of solar CNO-neutrinos Agostini et al. (2019), so in order to extract the CNO signal it is necessary to determine the shape of -spectrum with the sufficient accuracy.
II Experimental setup
Magnetic Bergkvist (1972); Tretyakov (1975) and electrostatic Lobashev and Spivak (1985); Aker et al. (2019) -spectrometers possess the superior energy resolution, but it comes at the cost of large scale and complexity of such experimental setup. Since the electron free path at MeV of kinetic energy (which is, basically, the maximum -transition energy for long-living isotopes) does not exceed g/cm3, solid state scintillation and ionization detectors were effectively employed for detection of -electrons Simpson (1985); Derbin et al. (1993). The main drawback of the solid state scintillators is their relatively poor energy resolution, which stands at approximately at MeV as well as non-linearity effects related with quenching and emission of Čerenkov radiation.
In case of semiconductor detectors, there is a significant probability of back-scattering from the detector surface that depends upon the detector material. The most widespread silicon-based semiconductors have the backscattering probability of the order of for keV electrons at normal incidence V. et al. (1997). In case of the electron energies above MeV and high detector materials, it also becomes important to take the bremsstrahlung into account. Still, good linearity of these detectors combined with high energy resolution gives them a lot of advantages with respect to other types of solid state detectors.
The layout of the -spectrometer used for our measurements was based on a simple “target-detector” geometry Alexeev et al. (2018); Bazlov et al. (2018). The Si(Li) detector with sensitive region diameter of mm and thickness of mm was produced by standard diffusion-drift technology Bazlov et al. (2019). Since the detector sensitive region did not cover the whole detector, it was fitted with a tungsten collimator ( mm diameter) that ensured that incident electrons were either backscattered or stopped in the i-region of the detector.
The whole setup was located in a vacuum cryostat and cooled down to liquid nitrogen temperature. The setup was equipped with a moderate passive shielding ( mm of iron and mm of copper) that allowed for reduction of the environmental backgrounds by a factor of 7, down to counts/s above keV.
The detector was operated with bias voltage of V. The readout was processed with a charge-sensitive preamplifier with resistive feedback and cooled FET transistor of the first cascade. The preamplifier signal was processed with a standard CR-3RC analogue shaper and digitized with a 14-bit ADC. The energy resolution determined for keV -line of 241Am turned out to be eV for the full width at half maximum.
In order to determine the main characteristics of the spectrometer, we used a 207Bi source, providing - and X-rays, conversion and Auger electrons. The 207Bi source with an activity of Bq was placed inside the vacuum cryostat at a distance of mm above the Si(Li) detector surface. The 207Bi spectrum, measured with the Si(Li) detector, is shown in Fig. 1 for the interval MeV Alexeev et al. (2018).
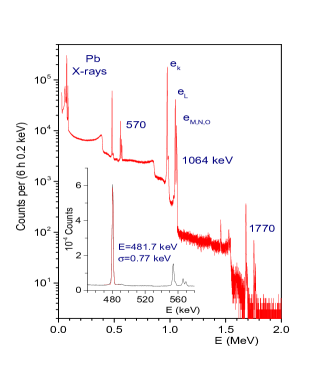
Three of the most intense 207Bi -lines had energies of keV, keV and keV and are emitted with probabilities of , and per single 207Bi decay, respectively Browne and Shirley (1978); Chu et al. (1999). The corresponding peaks of the conversion electrons from , and shells were clearly visible in the spectrum in Fig. 1. The electron energy resolution determined via keV line is keV. Energy calibration performed using Pb X-ray and -line with energies of keV and keV, correspondingly, predicts the position of keV conversion electrons peak with an accuracy better than keV.
The low-energy part of the 207Bi spectrum was used for evaluation of the thickness of the non-sensitive layer on the surface of Si(Li) detector. This area contained a set of peaks corresponding to Pb X-rays from and series and Auger electrons. The observed position of keV Auger peak () appeared to be at keV. Taking the Å the gold coating into account, the measured energy loss of eV for keV electrons corresponded to Å of the non-sensitive layer.
The planar source was prepared with the method of thermal oxidation Alekseev and Kuzmina (2016). The polished stainless steel foil with diameter of mm and thickness of m was used as substrate for application of . A water-alcohol -containing solution was deposited onto the oxidized surface of the foil. The solution was air-dried and then annealed for minutes at the temperature of in order to diffuse the radioactive isotope into the oxidized surface of the substrate.
This technique is capable of producing the source of negligibly small thickness, suppressing the effects caused by the attenuation and scattering of the electrons inside the bulk material of the source itself. The source produced in such a way decreases the systematic uncertainties of the measurement, since mentioned effects are usually difficult to simulate due to the complications with source geometry reconstruction.
III The results of measurements
The natural radioactivity of the 238U and 232Th families, along with the long-lived 40K isotope, are the main sources of background for neutrino physics and dark matter searches at energies below MeV. The main decay modes and half-life values of daughter nuclei produced by a long-lived 210Pb isotope are:
| (1) |
The end-point energies of the 210Pb and 210Bi -spectra are keV and keV, respectively, while the energy of 210Po -particles is MeV Browne and Shirley (1978); Chu et al. (1999). Since our 210Pb source was custom-made and intentionally purified from other lead isotopes, the equilibrium of the decay chain (1) had not yet been established at the time of measurement.
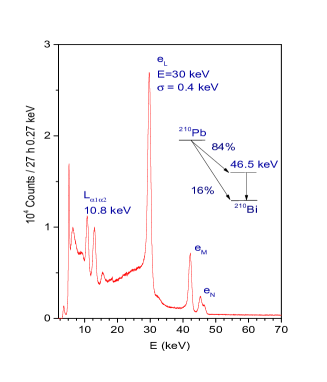
The Fig. 2 shows the low-energy region of the measured spectrum determined mainly by 210Pb decays. Transition from keV nuclear level of 210Bi has significant internal conversion coefficient (, Browne and Shirley (1978)). Therefore, the electron peaks corresponding to conversion from , and shells are clearly visible in the spectrum.
The energy resolution of Si(Li) detector determined for keV electron conversion line was determined to be keV and lower energy detection threshold was about keV. The kinetic energy of the recoil nucleus from -decay of 210Po is 100 keV. The wide peak that looks like the left shoulder of peak is probably associated with these events. The spectrum also shows the peaks of characteristic keV and keV and X-rays and the wider peak of keV Auger electrons.
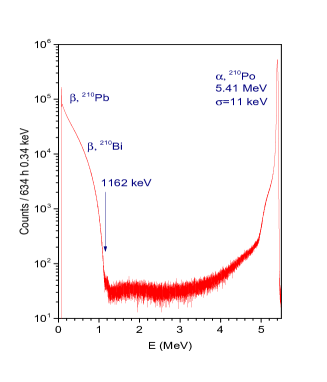
The whole spectrum in the energy range of MeV is shown in the Fig. 3. The energy resolution of keV 210Po -peak was determined to be keV. The peak is slightly asymmetric due to the final thickness of the target and possible other alpha impurities. The background level near the end-point energy of 210Bi -spectrum amounted to counts/h/keV and that was contributed mainly by Compton scattering of MeV -quanta of 40K passing through the passive shielding. The maximum energy of recoil electrons at the edge of Compton scattering is = 1243 keV that differs significantly from the 210Bi -decay endpoint energy.
The counting rate in the range from keV to MeV was 27 s-1, that with 1 s pile-up rejection time leads to negligible pile-up spectrum and dead time of the spectrometer.
The data was obtained during hours of data-taking in short 1-hour series used for stability control. To determine the energy calibration (where is a Si(Li) visible energy and is an ADC channel number), the position of keV -peak and the value of 210Bi end-point energy keV measured with high accuracy in other experiments Browne and Shirley (1978); Chu et al. (1999) were used.
During the fitting of the spectrum, the calibration slope equal to the analyzer channel width was free, while the value of the parameter was fixed by keV peak position. The differences of fitting parameters for the all 1-hour runs are in agreement with their statistical uncertainties. The fact that equilibrium in (1) was not achieved could not affect the fitting results for different series, if only because the contribution of the tail of -particles to the -spectrum region was very small. The total number of registered 210Bi decays was .
IV Data analysis
The energy distribution of -particles emitted in -decay process could be expressed as
| (2) |
where and are the electron momentum and energy, is full electron energy, is -spectrum end-point energy, is the electron Fermi function that takes into account electromagnetic interaction of the outgoing electron with the atom and is the transition nuclear form-factor that considers the effects of internal nuclear interactions.
The Fermi function is historically derived in approximation of a point-like nuclei without consideration of the atomic shells Fermi (1934) that means that comparison with experiments using this model needs application of the same approximation, while the -spectrum for practical applications would need a more profound calculation of the Fermi function that was performed according to Dzhelepov and Zyrianova (1956); Huber (2011); Hayen (1967).
The transition investigated in this work is of forbidden type and the nuclear form-factor is expected to deviate from unity and is the main subject of the measurement. Since the shape factor of first forbidden non-unique transition with such parity-momentum relations can be expressed with sufficient accuracy by a second degree polynomial, we choose the parametrization as in Grau Carles and Grau Malonda (1996):
| (3) |
with generic values of parameters and that were defined through maximum likelihood fit with likelihood function.
The final model of the experimental spectrum expresses as:
| (4) |
where is the spectrometer normalized response function obtained with Monte-Carlo simulation of electrons with energy exiting the source with uniform distribution within the source and uniform distribution of their momenta directions.
Since the setup in use has the classical “target-detector” geometry, it is quite important to take into account the detector response function that would contain a long low-energy tail caused by fraction of electrons backscattered from the detector as well as by bremsstrahlung exit from the detector crystal. The Si(Li) detector has i-region thickness exceeding the stopping range of an electron with endpoint energy of keV and thus the geometry of irradiated regions of the setup is quite well established. This allows to account for the detector energy response through a precise simulation with the Monte-Carlo method. We used Geant4.10.04 simulation package Agostinelli et al. (2003) with the standard G4EmStandardPhysics_option4 package of electromagnetic interactions.
The package choice was mainly motivated by the Single Scattering model for electrons, that is the most promising among standard ones according to Basaglia et al. (2016); Dondero et al. (2018). The simulation was including modeling of the detector entrance windows, collimator and holders according to the physical setup geometry.
As the response function model is based on the simplified interaction models used in the simulation, it is important to estimate the uncertainties concerning its imperfection. Consideration of these uncertainties was performed through analytical modification of the response function as:
| (5) |
where is the detector resolution at kinetic energy and , are free parameters. Eventually, six parameters were free in the fit: the common normalization coefficient, the slope of the energy calibration, the form factor parameters and , and response function parameters and .
The dependence used for the variation of the response function tail approximately corresponds to the uncertainties of the response function for different GEANT4 simulation packages Basaglia et al. (2016). The response function was renormalized to conserve detection efficiency of the original simulation.
The fit range has the lower bound that comes from presence of 210Pb in the source that covers the low-energy region. Considering that the nuclear form-factor depends only upon momenta of the electron and neutrino one should not expect sudden behavior in the lower tenth of the energy spectrum so this lower bound should not be important for the form-factor establishment.
The fit with canonical Fermi function was performed in the energy range keV with flat background approximation. The Fermi function was calculate according to Fermi (1934) as:
| (6) |
were and , is the fine-structure constant and is the nuclear radius defined as .
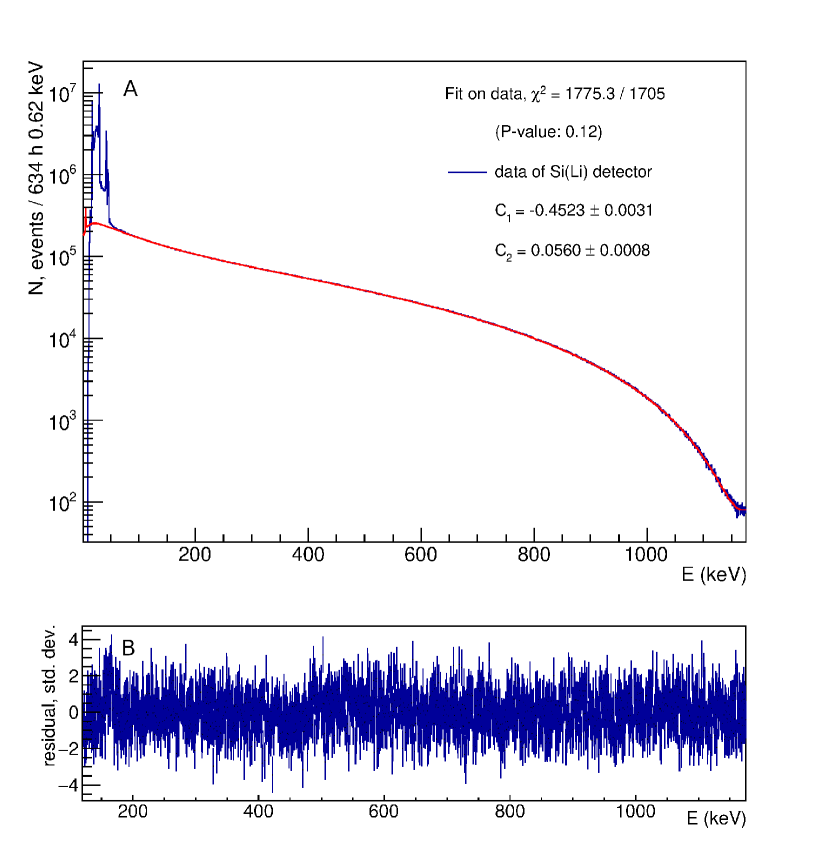
The fit results are shown on fig. 4. The obtained minimum of corresponds to Pearson and form-factor parameters and . The easily computed values of (6) together with obtained coefficients and allows to calculate the shape of the -spectrum that references to our measurements.
In order to have a fair comparison with results of Daniel (1962); Grau Carles and Grau Malonda (1996) we performed the fit with the Fermi function calculated in accordance with formalism presented in Dzhelepov and Zyrianova (1956), attempting to improve the precision of the analytical description. In this work was enhanced by including second and third terms of -power expansion of electron wave function at small values of ( is obtained by neglecting all but the first term). Also, additional corrections were included, taking the finite size of the nucleus and atomic shell screening into account Sliv (1947); Rose (1936). The values of used in the calculation were taken from the Table 14 of Dzhelepov and Zyrianova (1956) for and .
The fit range was increased with respect to the improved that takes into account the nucleus final size and the screening corrections. The same procedure gives the form-factor parameters as and . These values one can compare with and obtained in Grau Carles and Grau Malonda (1996). The errors of , obtained in the present work are more than five times less, however, the parameters , and , are consistent with each other within the .
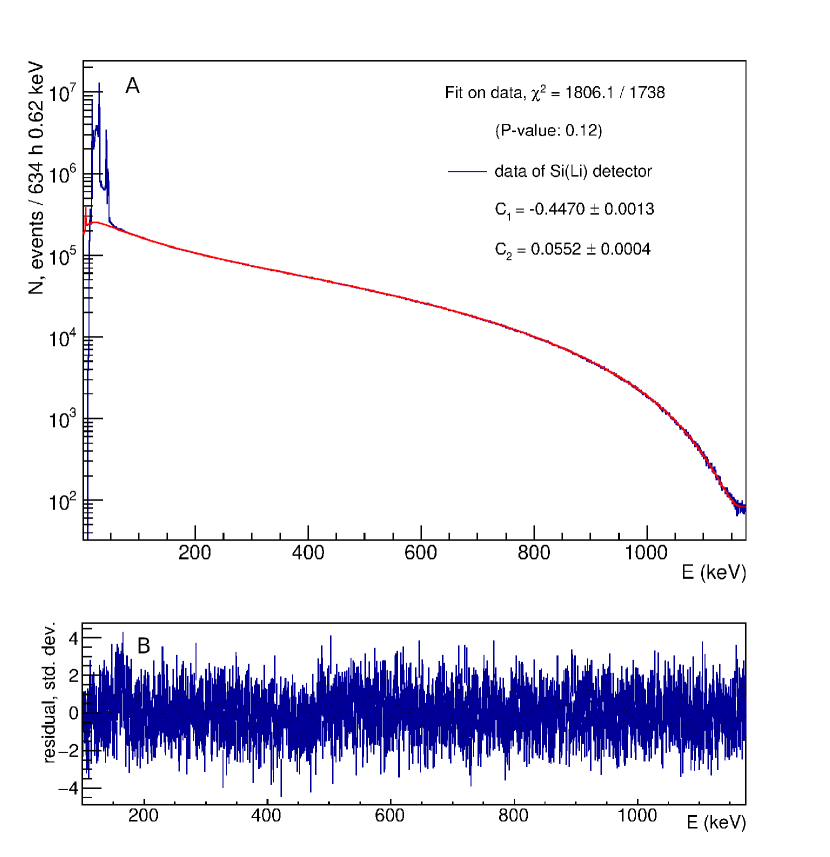
The final fitting procedure was repeated using the classic definition of the Fermi function with several corrections that included atomic shell screening effect Buhring (1984), finite size distribution of electromagnetic and weak charge inside nucleus Wilkinson (1990) and QED radiative corrections Sirlin (1967); Hayen (1967). The final had the following form:
| (7) | ||||
where is full electron energy, is the charge of a daughter nucleus, is Fermi function, screening correction, and are electromagnetic and weak finite size corrections and is radiative correction. The results of the final fitting procedure are given in Fig. 5
Implication of a more precise Fermi function allowed to lower energy threshold down to 100 keV, providing good P-value = 0.12 that is an evidence of better agreement of the corrected beta-spectrum with the experimental data. The minimum of = 1806.1 / 1738 corresponds to form-factor parameters and . These values and are obtained taking into account the most complete knowledge of the interactions emitted electron with atom. One should note that the parameters and have quite strong correlation in the fit of the experimental data, having the correlation coefficients of 0.987 (Fig. 4) and 0.96 (Fig. 5). The inclusion of quadratic term in the energy calibration and an additional pull term in the fitting procedure leads to increase of C1 and C2 errors by less than without changing the central values.
The fits performed have shown convergence of parameter to null, showing that with the current experimental statistics the Monte-Carlo simulation of the spectrometer response gives results consistent with the data. The conservative approach demonstrates the fact that inclusion of parameters A and B in the fit leads to increase errors of and by approximately a factor of three.
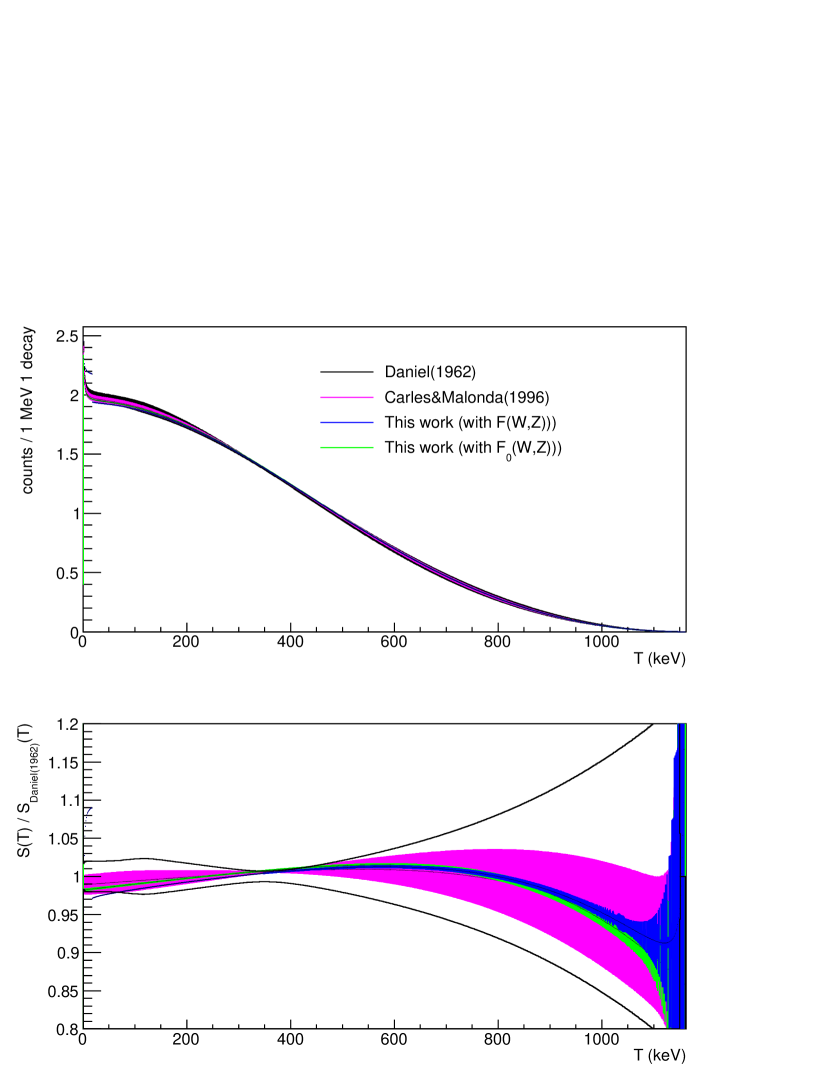
The present results are compared with obtained in works Daniel (1962) (Daniel (1962)) and Grau Carles and Grau Malonda (1996) (Carles & Malonda (1996)) in Fig. 6. The upper part of the figure shows the electron spectra. To determine the Daniel (1962) spectrum, we used the data from Table 2 Daniel (1962) and the Fermi function from Dzhelepov and Zyrianova (1956). The Carles & Malonda (1996) spectrum was calculated in accordance with the parameters and given in Grau Carles and Grau Malonda (1996). The figure shows two electron spectra obtained in the present work for and Fermi functions according to Fermi (1934) and Huber (2011); Buhring (1984). All -spectra were normalized to unity.
Fig. 6 shows also the ratio of Carles & Malonda (1996) and present work spectra to Daniel (1962) spectrum Daniel (1962). Daniel (1962) spectrum errors determined by fit are shown by solid black lines.
Because and have quite strong correlation, in order to estimate uncertainties on the form factor curve shown at Fig. 6 we applied the Monte-Carlo method sampling the form-factor parameters according to two-dimensional Gaussian distribution that includes the correlation coefficient obtained in the fit. One can see that both of our spectra are consistent with Daniel (1962) and Carles & Malonda (1996) spectra within uncertainties. The current study shows significantly increased precision with respect to the previous studies.
V Conclusions
The spectrometer based on the Si(Li) detector was used to precisely measure the -spectrum of 210Bi nuclei. As a result of the 634 hours measurements with a total number of of registered electrons it was established that the -spectrum is described by form-factor if the Fermi function is calculated according to formula (6) for a point-like nucleus. The obtained values of the parameters and together with (6) can be used for calculation of the electron spectrum of 210Bi.
When the additional above-mentioned corrections to the Fermi function are taken into account, the form-factor parameters are equal and , that can be useful for calculation of specific nuclear matrix elements. The obtained parameters of the form-factor are in agreement with the previous studies and have significantly increased precision.
VI Acknowledgments
This work was supported by the Russian Foundation for Basic Research (project nos. 19-02-00097 and 20-02-00571).
References
- Herczeg (2001) P. Herczeg. Beta decay beyond the standard model. Progress in Particle and Nuclear Physics, 46(2):413 – 457, 2001. ISSN 0146-6410. doi: 10.1016/S0146-6410(01)00149-1.
- Nico and Snow (2005) Jeffrey S. Nico and W. Michael Snow. Fundamental neutron physics. Annual Review of Nuclear and Particle Science, 55(1):27–69, 2005. doi: 10.1146/annurev.nucl.55.090704.151611.
- Alexeev et al. (2018) I. E. Alexeev, S. V Bakhlanov, N. V. Bazlov, E. A. Chmel, A. V. Derbin, I. S. Drachnev, I. M. Kotina, V. N. Muratova, N. V. Pilipenko, D. A. Semyonov, E. V. Unzhakov, and V. K. Yeremin. Beta-spectrometer with Si-detectors for the study of 144Ce-144Pr decays. Nuclear Instruments and Methods in Physics Research Section A: Accelerators, Spectrometers, Detectors and Associated Equipment, 890:64 – 67, 2018. ISSN 0168-9002. doi: 10.1016/j.nima.2018.02.031.
- Bazlov et al. (2018) N. V. Bazlov, S. V. Bakhlanov, A. V. Derbin, I. S. Drachnev, V. K. Eremin, I. M. Kotina, V. N. Muratova, N. V. Pilipenko, D. A. Semyonov, E. V. Unzhakov, and E. A. Chmel. A beta spectrometer based on silicon detectors. Instruments and Experimental Techniques, 61:323 – 327, 2018. ISSN 0168-9002. doi: 10.1134/S002044121803017X.
- O’Conor (1937) J. S. O’Conor. The beta-ray spectrum of Radium E. Phys. Rev., 52:303–314, Aug 1937. doi: 10.1103/PhysRev.52.303.
- Martin Leslie Harold and Howell (1939) Townsend Albert Alan Martin Leslie Harold and Laby Thomas Howell. The ОІ-ray spectrum of ra e. Proc. R. Soc. Lond. A, 170:190–205, 1939. doi: 10.1098/rspa.1939.0026
- Neary and Cockcroft (1940) G. J. Neary and J. D. Cockcroft. The beta-ray spectrum of Radium E. Proceedings of the Royal Society of London. Series A. Mathematical and Physical Sciences, 175(960):71–87, 1940. doi: 10.1098/rspa.1940.0044.
- Konopinski and Uhlenbeck (1941) E. J. Konopinski and G. E. Uhlenbeck. On the Fermi theory of -radioactivity. II. The “forbidden” spectra. Phys. Rev., 60:308–320, Aug 1941. doi: 10.1103/PhysRev.60.308.
- Newby and Konopinski (1959) Neal Newby and E. J. Konopinski. Nuclear states in the rae -decay. Phys. Rev., 115:434–444, Jul 1959. doi: 10.1103/PhysRev.115.434.
- Fujita (1962) Jun-Ichi Fujita. Conserved current hypothesis and the beta decay of rae. Phys. Rev., 126:202–210, Apr 1962. doi: 10.1103/PhysRev.126.202.
- Kim and Rasmussen (1963) Yeong E. Kim and John O. Rasmussen. Energy levels of bi210 and po210 and the shell-model residual force. Nuclear Physics, 47:184 – 206, 1963. ISSN 0029-5582. doi: 10.1016/0029-5582(63)90864-2.
- Spector (1963) Richard M. Spector. Shell model investigation of rae beta-decay. Nuclear Physics, 40:338 – 346, 1963. ISSN 0029-5582. doi: 10.1016/0029-5582(63)90277-3.
- Sodemann and Winther (1965) Jorgen Sodemann and Aage Winther. Nuclear matrix elements for the ОІ-decay of bi210(rae). Nuclear Physics, 69(2):369 – 383, 1965. ISSN 0029-5582. doi: 10.1016/0029-5582(65)90057-X.
- Damgaard et al. (1969) J. Damgaard, R. Broglia, and Claus Riedel. First-forbidden ОІ-decays in the lead region. Nuclear Physics A, 135(2):310 – 324, 1969. ISSN 0375-9474. doi: 10.1016/0375-9474(69)90165-1.
- Fayans and A. (1970) S. A. Fayans and Khodel V. A. Calculations of nuclear matrix elements for beta-decay of RaE. Physics Letters B, 31(3):99 – 102, 1970. ISSN 0370-2693. doi: 10.1016/0370-2693(70)90120-6.
- R. Lohken and Schatz (1971) H. Rebel R. Lohken and G. Schatz. A numerical method of analyzing beta decay measurements and its application to the 1в€’ в†’ 0+ transitions of170tm,186re and210bi. Zeitschrift for Physik A, 245(5):425, 1971. ISSN 0939-7922. doi: 10.1007/BF01395282X.
- Morita et al. (1971) Masato Morita, Masami Yamada, Jun-Ichi Fujita, Akihiko Fujii, Hisao Ohtsubo, Reiko Morita, Kiyomi Ikeda, Yoshimatsu Yokoo, Masahiko Hiro-Oka, and Kohji Takahashi. Nuclear Structure Studied from Weak and Related Processes†). Progress of Theoretical Physics Supplement, 48:41–100, 03 1971. ISSN 0375-9687. doi: 10.1143/PTP.48.41.
- Ebert et al. (1975) K. Ebert, W. Wild, and F. KrmpotiД‡. A nuclear structure study of the ОІ-decay of 210bi(rae). Physics Letters B, 58(2):132 – 134, 1975. ISSN 0370-2693. doi: 10.1016/0370-2693(75)90619-X.
- Behrens and Szybisz (1974) H. Behrens and L. Szybisz. On the ОІ-decay 210bi(rae) в†’ 210po(raf). Nuclear Physics A, 223(2):268 – 284, 1974. ISSN 0375-9474. doi: 10.1016/0375-9474(74)90414-X.
- Grau Carles and Grau Malonda (1996) A. Grau Carles and A. Grau Malonda. Precision measurement of the RaE shape factor. Nuclear Physics A, 596(1):83 – 90, 1996. ISSN 0375-9474. doi: 10.1016/0375-9474(95)00381-9.
- Plassmann and Langer (1954) E. A. Plassmann and L. M. Langer. Beta spectrum of Radium E. Phys. Rev., 96:1593–1598, Dec 1954. doi: 10.1103/PhysRev.96.1593.
- Daniel (1962) H. Daniel. Das -spektrum des rae. Nuclear Physics, 31:293 – 307, 1962. ISSN 0029-5582. doi: 10.1016/0029-5582(62)90745-9.
- Flothmann et al. (1969) D. Flothmann, W. Wiesner, R. Löhken, and H. Rebel. -Spektroskopie mit Halbleiterdetektoren beim Zerfall von 32P, 49Sc, 204Tl und 210Bi. Zeitschrift für Physik A Hadrons and Nuclei, 225:164–194, 1969. doi: 10.1007/BF01392517.
- Agostini et al. (2019) M. Agostini, K. Altenmüller, S. Appel, V. Atroshchenko, Z. Bagdasarian, D. Basilico, G. Bellini, J. Benziger, G. Bonfini, D. Bravo, B. Caccianiga, F. Calaprice, A. Caminata, L. Cappelli, S. Caprioli, M. Carlini, P. Cavalcante, F. Cavanna, A. Chepurnov, K. Choi, L. Collica, D. D’Angelo, S. Davini, A. Derbin, X. F. Ding, A. Di Ludovico, L. Di Noto, I. Drachnev, K. Fomenko, A. Formozov, D. Franco, F. Gabriele, C. Galbiati, M. Gschwender, C. Ghiano, M. Giammarchi, A. Goretti, M. Gromov, D. Guffanti, T. Houdy, E. Hungerford, Aldo Ianni, Andrea Ianni, A. Jany, D. Jeschke, S. Kumaran, V. Kobychev, G. Korga, T. Lachenmaier, M. Laubenstein, E. Litvinovich, P. Lombardi, L. Ludhova, G. Lukyanchenko, L. Lukyanchenko, I. Machulin, G. Manuzio, S. Marcocci, J. Maricic, J. Martyn, E. Meroni, M. Meyer, L. Miramonti, M. Misiaszek, V. Muratova, B. Neumair, M. Nieslony, L. Oberauer, V. Orekhov, F. Ortica, M. Pallavicini, L. Papp, Ö. Penek, L. Pietrofaccia, N. Pilipenko, A. Pocar, A. Porcelli, G. Raikov, G. Ranucci, A. Razeto, A. Re, M. Redchuk, A. Romani, N. Rossi, S. Rottenanger, S. Schönert, D. Semenov, M. Skorokhvatov, O. Smirnov, A. Sotnikov, L. F. F. Stokes, Y. Suvorov, R. Tartaglia, G. Testera, J. Thurn, E. Unzhakov, F. Villante, A. Vishneva, R. B. Vogelaar, F. von Feilitzsch, S. Weinz, M. Wojcik, M. Wurm, O. Zaimidoroga, S. Zavatarelli, K. Zuber, and G. Zuzel. Simultaneous precision spectroscopy of , , and solar neutrinos with Borexino Phase-II. Phys. Rev. D, 100:082004, Oct 2019. doi: 10.1103/PhysRevD.100.082004.
- Bergkvist (1972) Karl-Erik Bergkvist. A high-luminosity, high-resolution study of the end-point behaviour of the tritium -spectrum (I). Basic experimental procedure and analysis with regard to neutrino mass and neutrino degeneracy. Nuclear Physics B, 39:317 – 370, 1972. ISSN 0550-3213. doi: 10.1016/0550-3213(72)90376-8.
- Tretyakov (1975) E. F. Tretyakov. The high resolution toroidal beta spectrometer. Bull. Russ. Acad. Sci. Phys., 39:583–587, 1975.
- Lobashev and Spivak (1985) V.M. Lobashev and P.E. Spivak. A method for measuring the electron antineutrino rest mass. Nuclear Instruments and Methods in Physics Research Section A: Accelerators, Spectrometers, Detectors and Associated Equipment, 240(2):305 – 310, 1985. ISSN 0168-9002. doi: 10.1016/0168-9002(85)90640-0.
- Aker et al. (2019) M. Aker, K. Altenmüller, M. Arenz, M. Babutzka, J. Barrett, S. Bauer, M. Beck, A. Beglarian, J. Behrens, T. Bergmann, U. Besserer, K. Blaum, F. Block, S. Bobien, K. Bokeloh, J. Bonn, B. Bornschein, L. Bornschein, H. Bouquet, T. Brunst, T. S. Caldwell, L. La Cascio, S. Chilingaryan, W. Choi, T. J. Corona, K. Debowski, M. Deffert, M. Descher, P. J. Doe, O. Dragoun, G. Drexlin, J. A. Dunmore, S. Dyba, F. Edzards, L. Eisenblätter, K. Eitel, E. Ellinger, R. Engel, S. Enomoto, M. Erhard, D. Eversheim, M. Fedkevych, A. Felden, S. Fischer, B. Flatt, J. A. Formaggio, F. M. Fränkle, G. B. Franklin, H. Frankrone, F. Friedel, D. Fuchs, A. Fulst, D. Furse, K. Gauda, H. Gemmeke, W. Gil, F. Glück, S. Görhardt, S. Groh, S. Grohmann, R. Grössle, R. Gumbsheimer, M. Ha Minh, M. Hackenjos, V. Hannen, F. Harms, J. Hartmann, N. Haußmann, F. Heizmann, K. Helbing, S. Hickford, D. Hilk, B. Hillen, D. Hillesheimer, D. Hinz, T. Höhn, B. Holzapfel, S. Holzmann, T. Houdy, M. A. Howe, A. Huber, T. M. James, A. Jansen, A. Kaboth, C. Karl, O. Kazachenko, J. Kellerer, N. Kernert, L. Kippenbrock, M. Kleesiek, M. Klein, C. Köhler, L. Köllenberger, A. Kopmann, M. Korzeczek, A. Kosmider, A. Kovalík, B. Krasch, M. Kraus, H. Krause, L. Kuckert, B. Kuffner, N. Kunka, T. Lasserre, T. L. Le, O. Lebeda, M. Leber, B. Lehnert, J. Letnev, F. Leven, S. Lichter, V. M. Lobashev, A. Lokhov, M. Machatschek, E. Malcherek, K. Müller, M. Mark, A. Marsteller, E. L. Martin, C. Melzer, A. Menshikov, S. Mertens, L. I. Minter, S. Mirz, B. Monreal, P. I. Morales Guzmán, K. Müller, U. Naumann, W. Ndeke, H. Neumann, S. Niemes, M. Noe, N. S. Oblath, H.-W. Ortjohann, A. Osipowicz, B. Ostrick, E. Otten, D. S. Parno, D. G. Phillips, P. Plischke, A. Pollithy, A. W. P. Poon, J. Pouryamout, M. Prall, F. Priester, M. Röllig, C. Röttele, P. C.-O. Ranitzsch, O. Rest, R. Rinderspacher, R. G. H. Robertson, C. Rodenbeck, P. Rohr, Ch. Roll, S. Rupp, M. Ryšavý, R. Sack, A. Saenz, P. Schäfer, L. Schimpf, K. Schlösser, M. Schlösser, L. Schlüter, H. Schön, K. Schönung, M. Schrank, B. Schulz, J. Schwarz, H. Seitz-Moskaliuk, W. Seller, V. Sibille, D. Siegmann, A. Skasyrskaya, M. Slezák, A. Špalek, F. Spanier, M. Steidl, N. Steinbrink, M. Sturm, M. Suesser, M. Sun, D. Tcherniakhovski, H. H. Telle, T. Thümmler, L. A. Thorne, N. Titov, I. Tkachev, N. Trost, K. Urban, D. Vénos, K. Valerius, B. A. VanDevender, R. Vianden, A. P. Vizcaya Hernández, B. L. Wall, S. Wüstling, M. Weber, C. Weinheimer, C. Weiss, S. Welte, J. Wendel, K. J. Wierman, J. F. Wilkerson, J. Wolf, W. Xu, Y.-R. Yen, M. Zacher, S. Zadorozhny, M. Zbořil, and G. Zeller. Improved upper limit on the neutrino mass from a direct kinematic method by katrin. Phys. Rev. Lett., 123:221802, Nov 2019. doi: 10.1103/PhysRevLett.123.221802.
- Simpson (1985) J. J. Simpson. Evidence of heavy-neutrino emission in beta decay. Phys. Rev. Lett., 54:1891–1893, Apr 1985. doi: 10.1103/PhysRevLett.54.1891.
- Derbin et al. (1993) A. V Derbin, Egorov A. I., V. N. Muratova, et al. Search for 17-kev neutrinos in 63Ni beta-decay. JETP Lett., 58:1–4, 1993.
- V. et al. (1997) Derbin A. V., Egorov A. I., S. V. Bakhlanov, et al. Measurement of the 45Ca -spectrum in search of deviations from the theoretical shape. JETP Lett., 66:88–92, 1997. doi: doi.org/10.1134/1.567508.
- Bazlov et al. (2019) N. V. Bazlov, A. V. Derbin, I. S. Drachnev, G. E. Gicharevich, I. M. Kotina, O. I. Konkov, N. V. Pilipenko, E. A. Chmel, S. N. Abolmasov, E. I. Terukov, and E. V. Unzhakov. Si(li) detector with ultra-thin entrance window on the diffusive lithium side. Journal of Physics: Conference Series, 1400:055056, nov 2019. doi: 10.1088/1742-6596/1400/5/055056.
- Browne and Shirley (1978) E. Browne and V. S. Shirley. Table of isotopes. Wiley, New York, 1978. ISBN 0471041793.
- Chu et al. (1999) S. Y. F. Chu, L. P. Ekström, and R. B. Firestone. The Lund/LBNL Nuclear Data Search, 1999. URL http://nucleardata.nuclear.lu.se/toi/. Version 2.0, February 1999.
- Alekseev and Kuzmina (2016) I. Alekseev and T. Kuzmina. Determination of 241pu by the method of disturbed radioactive equilibrium using 2ПЂО±-counting and precision gamma-spectrometry. Applied Radiation and Isotopes, 110:212 – 217, 2016. ISSN 0969-8043. doi: 10.1016/j.apradiso.2016.01.029.
- Fermi (1934) E. Fermi. An attempt of a theory of beta radiation. 1. Zeitchrift für Physik, 88:161–177, 1934. doi: 10.1007/BF01351864.
- Dzhelepov and Zyrianova (1956) B. S. Dzhelepov and L. N. Zyrianova. The influence of the atomic electric field on beta-decay. USSR Acad. Sci, Leningrad, 1956.
- Huber (2011) P. Huber. Determination of antineutrino spectra from nuclear reactors. Phys. Rev. C, 84:024617, Aug 2011. doi: 10.1103/PhysRevC.84.024617.
- Hayen (1967) L. Hayen, N. Severijns, K. Bodek, D. Rozpedzik, and X. Mougeot High precision analytical description of the allowed spectrum shape. Rev. Mod. Phys, 90:015008, 2018. doi: 10.1103/RevModPhys.90.015008
- Agostinelli et al. (2003) S. Agostinelli et al. GEANT4: A Simulation toolkit. Nucl. Instrum. Meth., A506:250–303, 2003. doi: 10.1016/S0168-9002(03)01368-8.
- Basaglia et al. (2016) T. Basaglia, M. C. Han, G. Hoff, C. H. Kim, S. H. Kim, M. G. Pia, and P. Saracco. Quantitative test of the evolution of GEANT4 electron backscattering simulation. IEEE Transactions on Nuclear Science, 63(6):2849–2865, 2016.
- Dondero et al. (2018) Paolo Dondero, Alfonso Mantero, Vladimir Ivanchencko, Simone Lotti, Teresa Mineo, and Valentina Fioretti. Electron backscattering simulation in GEANT4. Nuclear Instruments and Methods in Physics Research Section B: Beam Interactions with Materials and Atoms, 425:18 – 25, 2018. ISSN 0168-583X. doi: 10.1016/j.nimb.2018.03.037.
- Sliv (1947) L. A. Sliv. On theory of forbidden beta-transitions. JETP, 17(12):1049–1058, 1947.
- Rose (1936) M. E. Rose. A note on the possible effect of screening in the theory of beta-disintegration. Phys. Rev., 49:727–729, May 1936. doi: 10.1103/PhysRev.49.727.
- Buhring (1984) Wolfgang Buhring. The screening correction to the Fermi function of nuclear -decay and its model dependence. Nuclear Physics A, 430(1):1 – 20, 1984. ISSN 0375-9474. doi: 10.1016/0375-9474(84)90190-8.
- Wilkinson (1990) D.H. Wilkinson. Evaluation of beta-decay: Ii. finite mass and size effects. Nuclear Instruments and Methods in Physics Research Section A: Accelerators, Spectrometers, Detectors and Associated Equipment, 290(2):509 – 515, 1990. ISSN 0168-9002. doi: 10.1016/0168-9002(90)90570-V.
- Sirlin (1967) A. Sirlin. General properties of the electromagnetic corrections to the beta decay of a physical nucleon. Phys. Rev., 164:1767–1775, Dec 1967. doi: 10.1103/PhysRev.164.1767.