Glassy dielectric anomaly and negative magneto-capacitance effect in electron-doped Ca1-xSrxMn0.85Sb0.15O3
Abstract
Manganites exhibit various types of electronic phenomena, and these electronic characteristics can be controlled by carrier doping. Herein, we report the dielectric and magnetic properties of electron-doped manganite Ca1-xSrxMn0.85Sb0.15O3 ( = 0, 0.1, 0.2, and 0.3). The temperature dependence of the real part of the dielectric constant exhibits a broad and large peak just below the kink temperature of magnetization and a sharp decrease at lower temperatures, accompanied by an anomaly of the imaginary part. Furthermore, isovalent Sr substitution enhances the temperature of the dielectric peak by more than 50 K. Interestingly, the dielectric peak exhibits a negative magnetic-field effect. For all measured samples, the low-temperature variation of the dielectric constant can be qualitatively explained based on the Maxwell-Wagner (MW) model that describes a system composed of grain boundaries and semiconducting grains. However, the observed peak and its negative magneto-capacitance effect at high temperatures cannot be reproduced by a combination of the MW model and magnetoresistance effect. The dielectric peak strongly indicates polaronic relaxation in the present system. These results suggest that polarons form clusters with a dipole ordering and magneto-electric coupling, which might be consistently understood by the charge-ordering scenario.
pacs:
77.22.-d, 75.85.+t, 75.25.DkI Introduction
Manganites exhibit various electronic phenomena such as charge-orbital ordering, colossal magnetoresistance, and phase separation because of the competition or cooperation between electron–electron interactions (for example, between ferromagnetic double exchange interaction and antiferromagnetic (AFM) super-exchange interaction) Tokura et al. (1996). Carrier doping is a powerful tool to control the electronic state of manganites. For example, electron-doped systems CaMn1-xMoxO3 and Ca1-xCexMnO3 change the ground state from a G-type AFM ordering to a charge/orbital-ordered C-type AFM ordering Zeng et al. (2001); Maignan et al. (2002); Caspi et al. (2004); Okuda and Fujii (2010). In another electron-doped system Ca1-xLaxMnO3, dielectric properties were reported Cohn et al. (2004, 2005). With respect to hole-doped systems, Pr1-xCaxMnO3 and Y1-xCaxMnO3 exhibit an interesting dielectric anomaly, which is sensitive to a magnetic field and is induced around the charge-ordering (CO) temperature Jardón et al. (1999); Mercone et al. (2004); Freitas et al. (2005); Serrao et al. (2007); Sahu et al. (2009).
With the aim to identify new phenomena in manganites, we investigated an electron-doped system CaMn1-ySbyO3 for Murano et al. (2010, 2011); Fujiwara et al. (2013, 2015). X-ray photoelectron spectroscopy proved that the valency of Sb is 5+ Fujiwara et al. (2013). Thus, the substitution of Sb5+ ions for Mn4+ sites causes one-electron doping with the chemical formula Ca2+MnMnSbO accompanied by a monotonic increase of unit-cell volume as a function of . From the magnetization and AC-susceptibility measurements, a canted AFM ordering is expected below the Neel temperature of 100 K Murano et al. (2010, 2011); Fujiwara et al. (2013, 2015). Interestingly, we revealed magnetization reversal after field-cooling for Murano et al. (2010, 2011)probably because the local lattice distortion of MnO6 octahedra induced by the Sb substitution changed the orbital state of the electron of Mn3+ and reversed the local easy axis of magnetization. For , the physical and chemical pressure effects were also reported Fujiwara et al. (2013, 2015).
Just recently, we started studying the dielectric properties of CaMn0.85Sb0.15O3 Taniguchi et al. (2018) because manganites provide interesting dielectric materials such as magnetoelectrics and relaxors. Interestingly, we found a broad and large peak in the temperature dependence of the dielectric constant, which exhibited a negative magnetic-field effect. Considering the broadness and large value of the peak, CaMn0.85Sb0.15O3 might be a dielectric glass. The magnetic-field-sensitive dielectric constant suggests that CaMn0.85Sb0.15O3 is a new magnetoelectric material. Four cases are known to be the origin of magnetoelectrics: magnetic exchange striction Fiebig et al. (2002); Lorenz et al. (2007), inverse Dzyaloshinskii-Moriya interaction Katsura et al. (2005); Sergienko and Dagotto (2006), - hybridization Arima (2007), and CO Ikeda et al. (2000); Efremov et al. (2004, 2005); Ikeda et al. (2005); Khomskii (2006); Nagano et al. (2007); Brink and Khomskii (2008); Giovannetti et al. (2009). For CaMn0.85Sb0.15O3, where both Mn3+ and Mn4+ ions exist, the formation of CO is expected suggesting a correlation between the CO and the observed magneto-capacitance effect. CO-originated magnetoelectrics can be realized under these two conditions: (1) the condition for macroscopic electric polarization—where the pattern of CO does not have an inversion symmetry; (2) the condition for magneto-electric coupling—where the CO accompanies a magnetic ordering with a one-to-one correspondence between the pattern of the CO and that of the magnetic ordering. In such a case, the direction of the electric polarization is also controlled by a magnetic field through a change in the pattern of magnetic ordering.
In this study, to clarify the origin of the magneto-capacitance effect of CaMn0.85Sb0.15O3, we compared the dielectric, conducting, and magnetic properties in detail. Moreover, to determine whether CaMn0.85Sb0.15O3 is a dielectric glass, we investigated the frequency dependence of the dielectric constant of CaSrMn0.85Sb0.15O3 ( = 0, 0.1, 0.2, 0.3).
II Experimental
Polycrystalline samples of Ca1-xSrxMn0.85Sb0.15O3 ( = 0, 0.1, 0.2, and 0.3) were prepared by a solid-state reaction method. The stoichiometric mixtures of CaCO3, SrCO3, Mn3O4, and Sb2O3 powders were calcined in air at 1000∘C for 48 h. The products were ground and pressed into disk-like pellets. The pellets were sintered at 1350∘C for 48 h. Single crystalline samples were grown by the floating zone method in Ar atmosphere using the polycrystal of CaMn0.85Sb0.15O3. We performed the quantitative composition analysis using the electron probe micro analyzer (JXA-8500F, JEOL). The compositions of the obtained polycrystalline samples are the same as those of the mixed samples, whereas that of single crystalline samples is found to be CaMn0.88Sb0.12O3. We also performed X-ray diffraction measurements at approximately 290 K using an Ultima IV diffractometer (Rigaku) with Cu K radiation.
We measured the dielectric constant under several frequencies and DC magnetic fields using the parallel mode of an LCR meter (Agilent, E4980A). Samples were cut into a parallel plate with an area of 3.2 6.0 mm2 and a thickness of 0.7 mm, and Au wires for electric lead were connected by Ag paint (Dupont, 4929N). To reduce the contact resistance, sample surfaces were polished to be flat using 9 m diamond slurry, and Ag paint was heated at 110∘C for 30 min. We performed measurements with an AC electric field of 1 V/mm and 10 - 500 kHz under 0 - 5 T (field cooling), obtained the capacitance and dielectric loss , and estimated the real and imaginary part of the relative dielectric constant and . To investigate the magnetic properties as well, we measured magnetization using a commercial SQUID magnetometer (Quantum Design, MPMS) under 10 mT after field cooling. DC resistivity and specific heat were measured using the Physical Property Measurement System (Quantum Design).
III Results
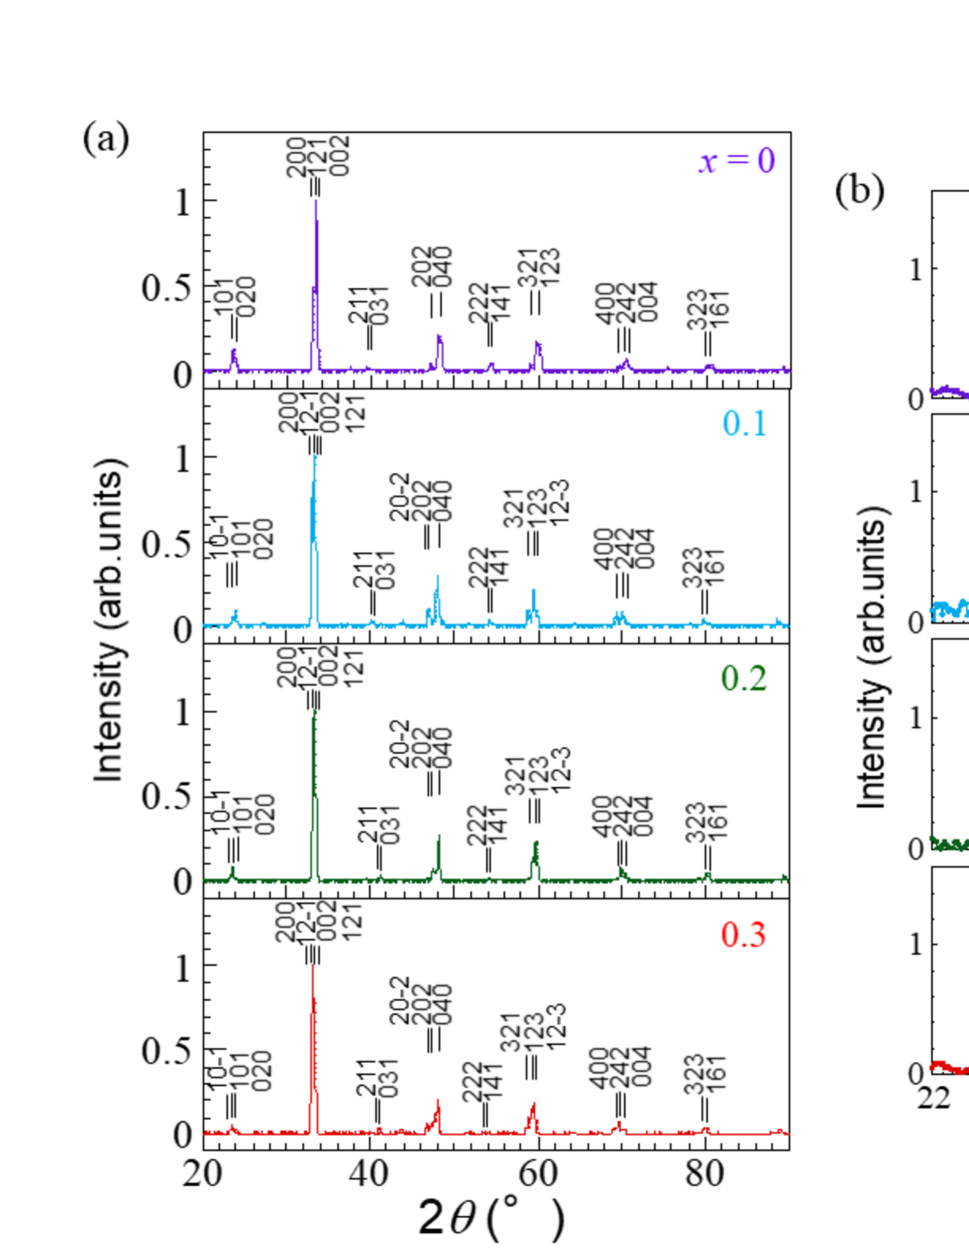
Figure 1 (a) presents the X-ray diffraction spectrum of Ca1-xSrxMn0.85Sb0.15O3 ( = 0, 0.1, 0.2, and 0.3). Based on the previous study on orthorhombic CaMn0.9Sb0.1O3 and monoclinic CaMn0.8Sb0.2O3 Poltavets et al. (2004), (101) and (020) peaks are expected at approximately in both the orthorhombic and monoclinic cases, and (10-1) peak appears at a slightly lower angle in the monoclinic case. As shown in Fig. 1 (b), all the samples exhibited a peak at approximately and , which suggests the (101) and (020) reflection, respectively. In addition, another peak appeared at approximately for , although the peak for = 0.1 was as small as background fluctuation. Therefore, we consider that the sample had a orthorhombic structure, whereas the samples were described by a monoclinic structure. The sample of might be located at the boundary between the orthorhombic and monoclinic phases. These results are similar to the structural variation in other partially substituted manganites CaMn1-xMoxO3 and Ca1-xCexMnO3 Maignan et al. (2002); Caspi et al. (2004); Okuda and Fujii (2010). A stronger intensity at approximately for = 0.1, compared with intensity of the other compositions, suggests that grinding was imperfect for the powder sample of = 0.1, and the distribution of the relative angle between the X-ray incidence and the crystallographic axis of the sample was not uniform. Consistently, the (040) peak at approximately was also relatively high at = 0.1, and similarly for the (020) peak at approximately . The obtained lattice parameters and unit cell volume are plotted in Fig. 1 (c). The values of , , and exhibit a monotonic increase with Sr substitution. This substitution effect is consistent with the fact that the ion radius of Sr2+ is larger than that of Ca2+.
| tolerance factor | ||||||||||||
|---|---|---|---|---|---|---|---|---|---|---|---|---|
| (cm) | (cm) | (meV) | (K) | (K) | ||||||||
| 0.0 | 0.9896 | 295.8 | 1.521 | 127 | 137 | 127 | ||||||
| 0.1 | 0.9933 | 1640 | 4.262 | 140 | 155 | 143 | ||||||
| 0.2 | 0.9969 | 2027 | 5.430 | 155 | 169 | 163 | ||||||
| 0.3 | 1.000 | 3622 | 7.041 | 161 | 189 | 178 |
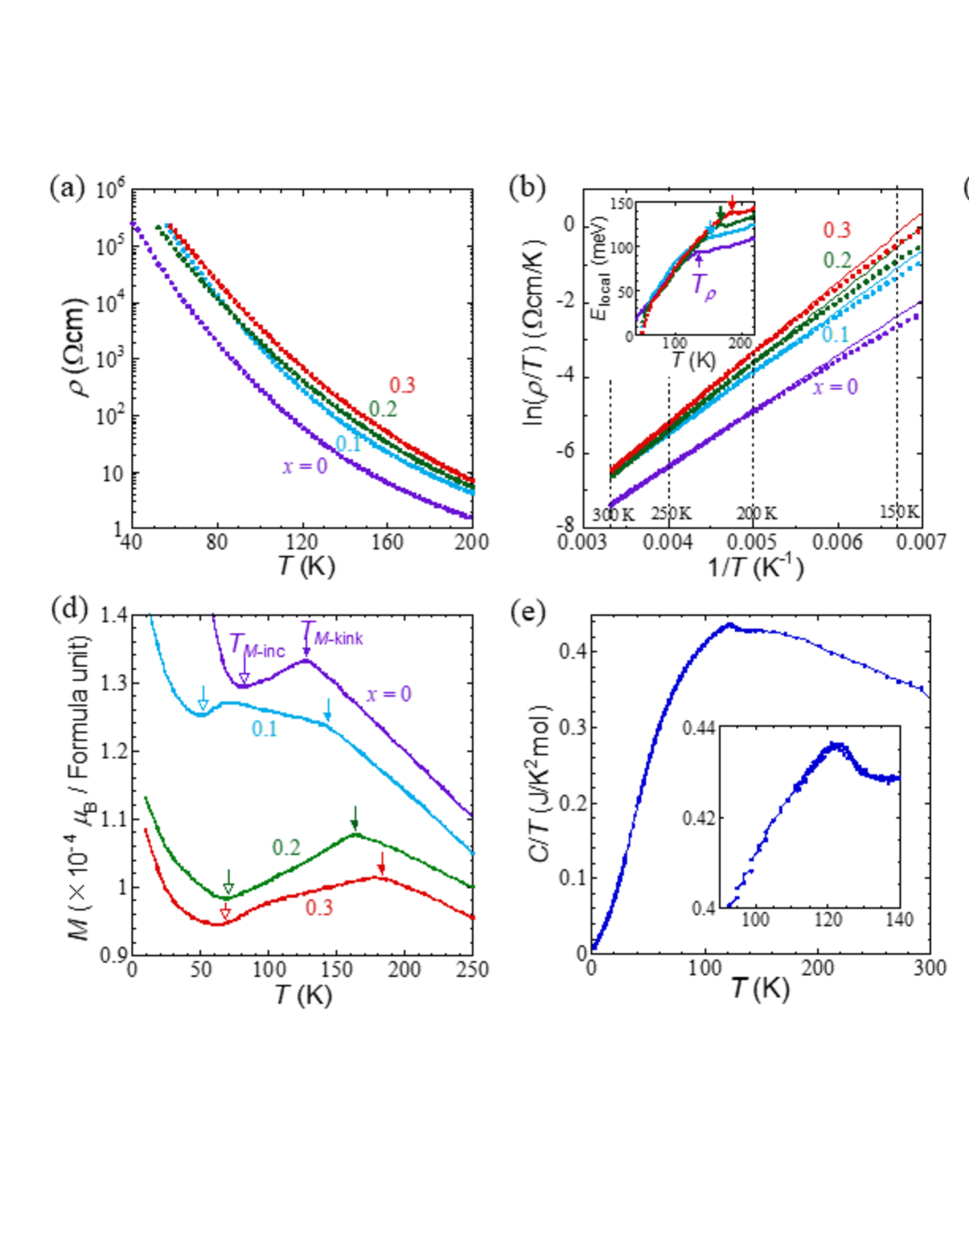
As shown in Fig. 2 (a), the value of the electrical resistivity of Ca1-xSrxMn0.85Sb0.15O3 is smaller than that of typical insulators by several orders of magnitude. We found that a value of above 190 K can be described by the small polaron hopping model . The values of the activation energy estimated from the fitting shown in Fig. 2 (b) are listed in Table 1. As shown in the inset of Fig. 2 (b), the temperature dependence of the local activation energy exhibits a small jump-like anomaly. The fact that both Mn3+ and Mn4+ ions exist in CaMn0.85Sb0.15O3makes CO a reasonable candidate for the transport anomaly. Because the anomaly is small, CO is expected to be realized only in several fractions in the sample not in the whole sample. This short-range cluster scenario is supported also by the fact that substituted Sb ions act as impurities in the Mn lattice as well as dope electrons and suppress the Mn-Mn interaction. The anomaly temperature is listed in Table 1. As shown in Fig. 2 (c), the magnetoresistance of CaMn0.85Sb0.15O3 at 1 T appears to be within the error margin.
As shown in Fig. 2 (d), the temperature dependence of magnetization exhibits a kink at a higher temperature and a remarkable increase at lower temperatures. The kink suggests a magnetic order accompanied by a CO because the kink temperature is near in Ca1-xSrxMn0.85Sb0.15O3. As shown in Fig. 2 (e), the specific heat of CaMn0.85Sb0.15O3 exhibits an anomaly near , suggesting phase transition. By analogy with Ca1-xCexMnO3 Caspi et al. (2004), in which CO is proved by a neutron diffraction and a similar magnetic kink is observed at the CO temperature Zeng et al. (2001), C-type AFM ordering is expected to be formed below in Ca1-xSrxMn0.85Sb0.15O3. The sharp increase in the magnetization below can be understood as the growth of the canted component of AFM ordering.
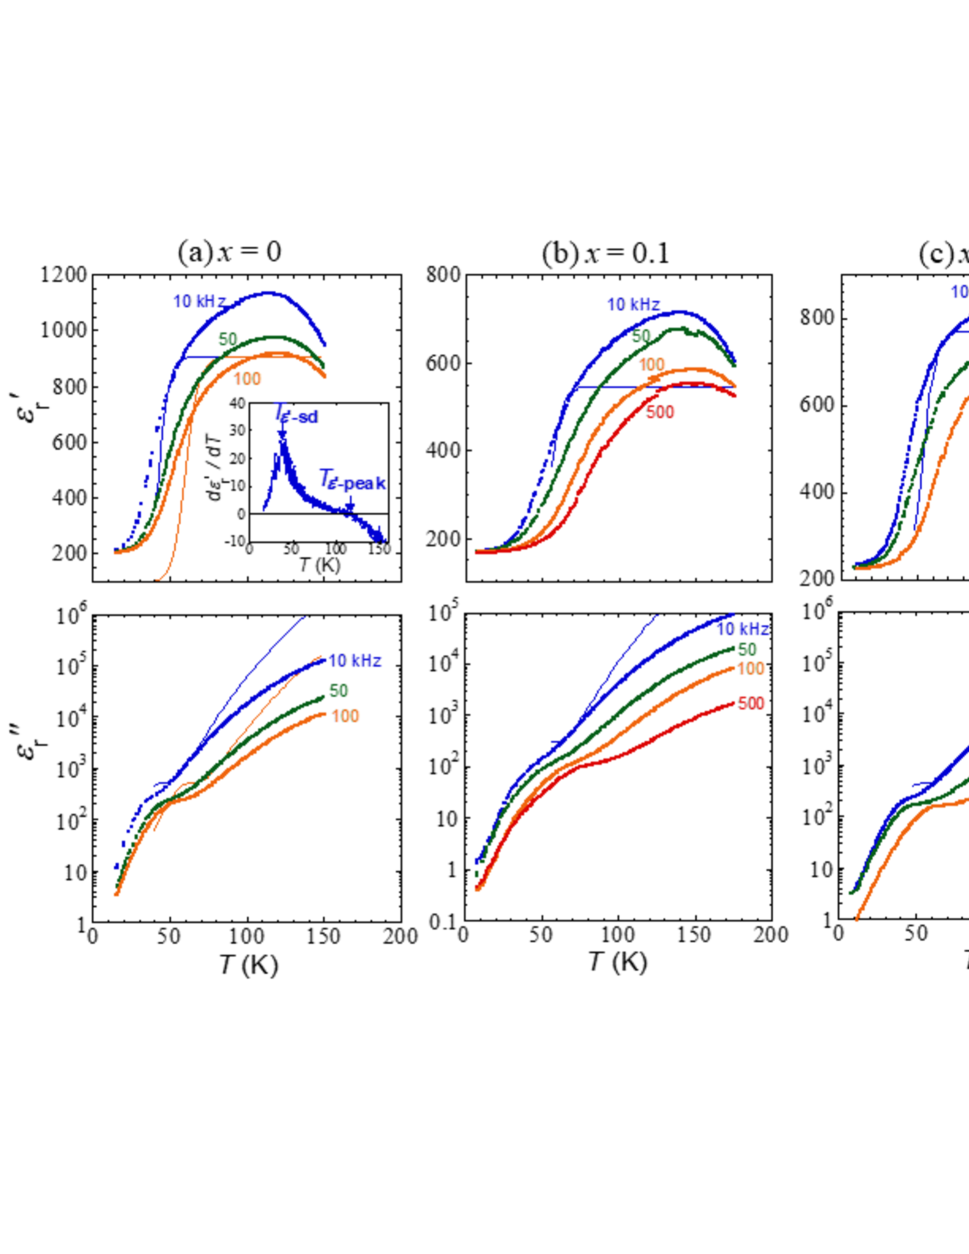
In Fig. 3, we show the temperature dependence of the relative dielectric constant of Ca1-xSrxMn0.85Sb0.15O3 ( = 0, 0.1, 0.2 and 0.3) for several frequencies (10, 50, 100 and 500 kHz). Interestingly, the real part of each sample exhibits a common broad peak at an intermediate temperature and then sharply decreases at low temperatures of approximately 50 K. Notably, the temperature of the peak in is near the temperatures of the anomaly in and the kink in . In the imaginary part , a shoulder structure appears at approximately 50 K. For understanding (), we should note that conductive charges as well as capacitive charges contribute to . Because of the small-polaron-hopping-type temperature dependence and the comparably low value of resistivity, the dielectric loss of CaMn0.85Sb0.15O3 is expected to exhibit an extremely large value at higher temperatures and is expected to be remarkably suppressed on cooling. Comparably large was observed in a similar low resistivity system Pr1-xCaxMnO3 Shukla et al. (2014), in which exhibited a broad peak around the CO temperature and the peak was sensitive to a magnetic field. Focusing on the frequency dependence, these three anomalies, the peak, the sharp decrease of , and the shoulder of , shift to higher temperatures with increasing frequency. The value of near the peak tends to be suppressed in the high frequency region.
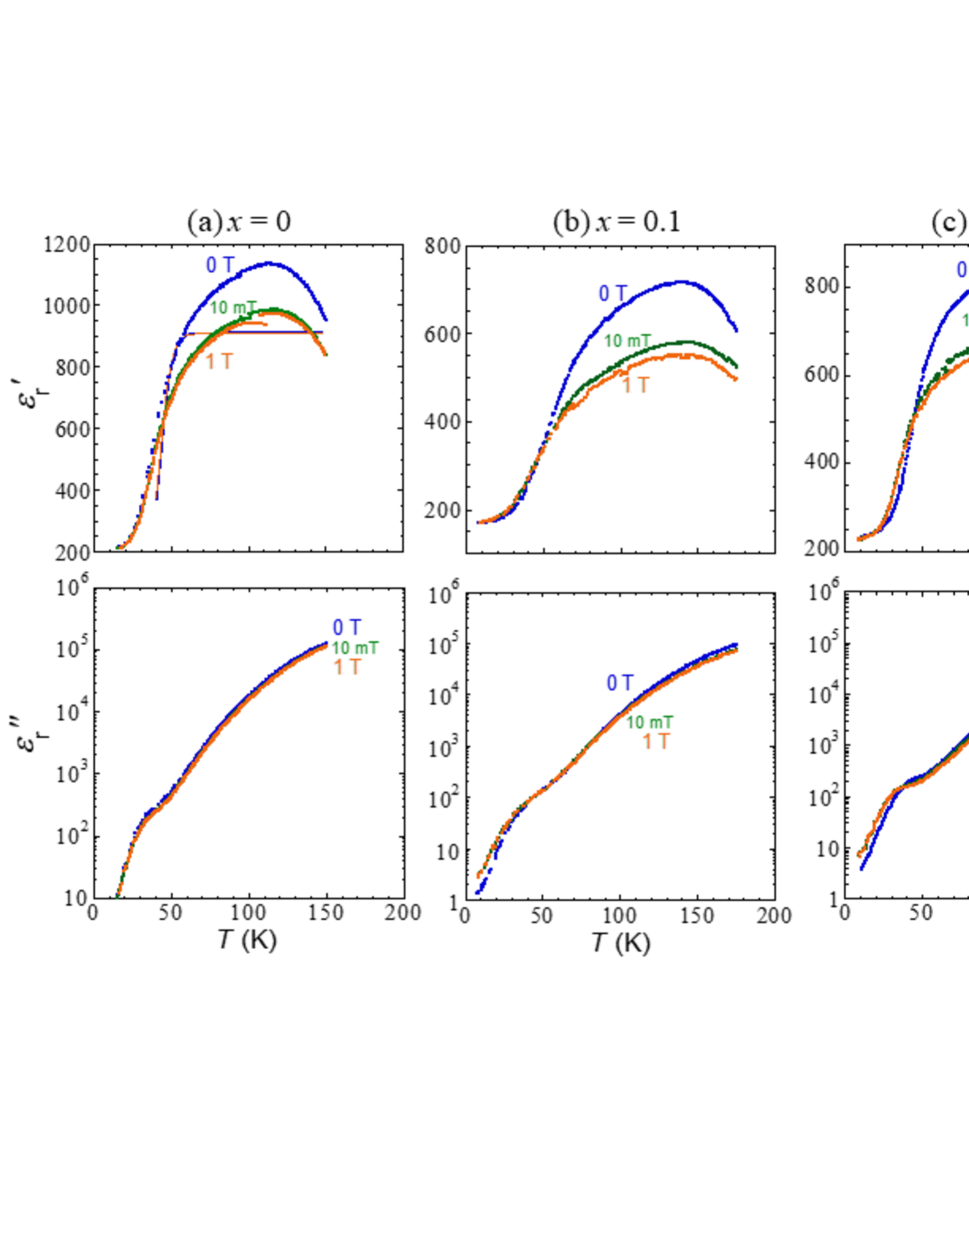
Figure 4 presents the effect of magnetic field on the dielectric properties of Ca1-xSrxMn0.85Sb0.15O3 ( = 0, 0.1, 0.2, and 0.3). We found a remarkable negative magneto-capacitance effect on the real part: the peak of was shifted by the magnetic field. The peak height was suppressed in all samples, and the peak temperature was enhanced for . The magnitude of the magneto-capacitance effect ((1 T) - (0 T)) / (0 T) at the peak temperature of 0 T was -14.4%, -23.0%, -17.1%, and -22.3% for = 0, 0.1, 0.2, and 0.3, respectively. The changes in the imaginary part seem small.
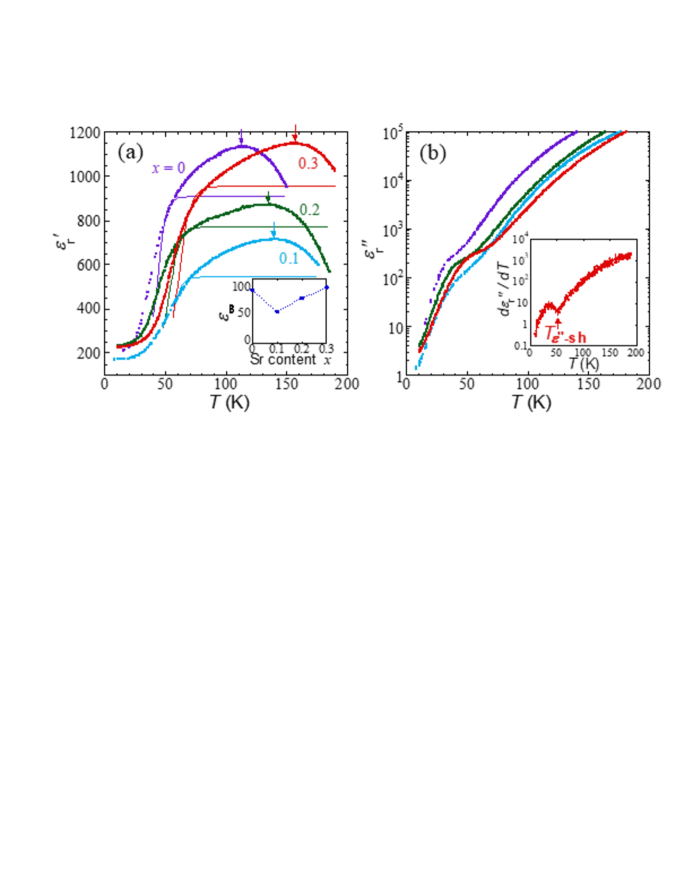
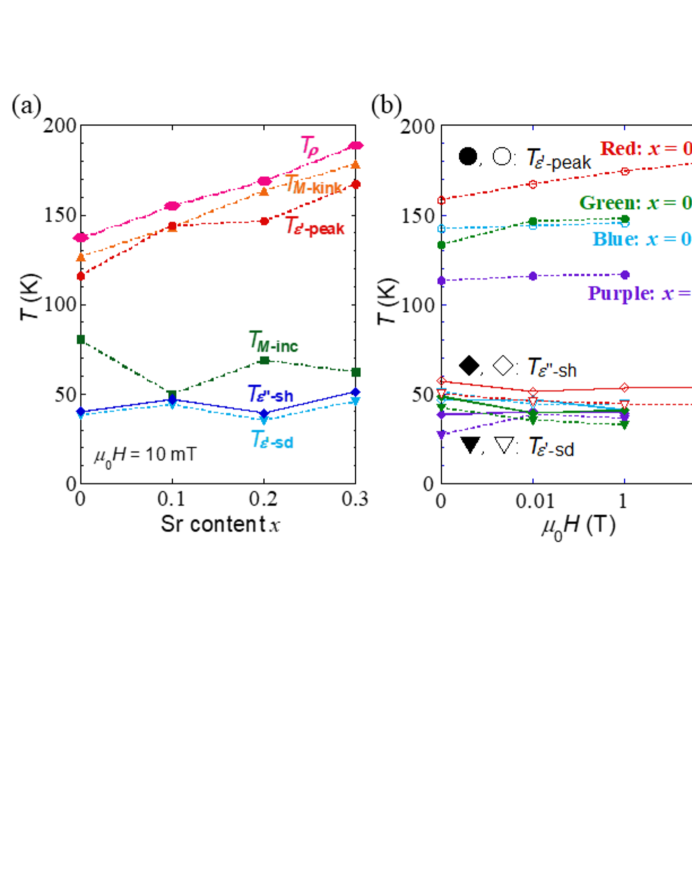
We estimate the characteristic temperatures of the three dielectric anomalies, one conductive anomaly, and two magnetic anomalies as follows, and plot them in Fig. 6 (a). (1) For the peak in the real part of the dielectric constant, the temperature at which becomes zero is defined as the characteristic temperature . The positions are shown by arrows in Fig. 5 (a). (2) For the sharp decrease in the real part of the dielectric constant, the temperature at which exhibits a sharp peak is defined as the characteristic temperature , an example of which is shown in the inset of Fig. 3. (3) For the shoulder structure in the imaginary part of the dielectric constant, the kink temperature at which exhibits the minimum value is defined as the characteristic temperature , an example of which is shown in the inset of Fig. 5 (b). (4) For the resistivity anomaly, the temperature is determined from the small jump-like anomaly in the local activation energy , as shown by an arrow in the inset of Fig. 2(b). (5 and 6) For the kink and remarkable increase in magnetization, which are shown by arrows in Fig. 2 (d), the characteristic temperatures and are determined from . For = 0.1 and 0.3, another kink is observed at approximately 70 K and 90 K, respectively. Concerning these additional kinks, we hope to obtain detailed information via specific heat measurements in future work. To summarize the tendency of the anomaly temperatures, we clarified that , , and exhibit a similar value and are enhanced together by Sr substitution ,as shown in Fig. 6 (a). Moreover, corresponds well to . They remain at almost the same value under isovalent Sr substitution.
IV Discussion
From the broad large-value dielectric peak that exhibits a frequency dependence, Ca1-xSrxMn0.85Sb0.15O3 seems to be a dielectric glass. However, we should carefully examine whether the observed dielectric characters are intrinsic. A large value of can also be caused by the MW effect at interfaces like grain boundaries von Hippel (1954); Lunkenheimer et al. (2002, 2010). In the MW model, the apparent relative dielectric constant is described as follows Catalan (2006):
| (1) |
| (2) |
Here, , : electric constant, : sample area, and : sample thickness. and : capacitance and resistance of the corresponding phase, respectively, index = 1 and 2: grain-boundary layers and semiconducting grains, respectively. , , . : angular frequencies. Notably, the values of and in this formula are determined by the ratio of the thickness, area, resistivity, and permittivity between the two phases. According to Catalan’s assumption Catalan (2006), in which , , , and (, , and : thickness, area, resistivity and intrinsic premittivity of the corresponding phase, respectively,), Eq. (1), Eq. (2), and the relaxation time are transformed as follows:
| (3) |
| (4) |
| (5) |
Here, . For fitting Eq. (3) and Eq. (4) into the observed and , we adopted the observed DC resistivity values as of semiconducting grains because the conducting paths of the majority phase 2 with higher electric conductivity determine the observed resistivity values in the case of the larger volume fraction . As shown in Fig. 3, although the sharp decrease of and the shoulder structure of are reproduced by the MW model, the peak of is not. Therefore, the peak structure of is expected to be intrinsic. Moreover, the calculation does not exhibit a frequency dependence at high temperatures, including . This result suggests that the frequency dependence of near is also intrinsic. The value of the fitting parameter , which is plotted in the inset of Fig. 5(a), is consistent with that of a similar system La1-xCaxMnO3 (about 20-100) Cohn et al. (2004).
| (=) | (=) | (low-) | (high-) | |||||||||||
| (K) | (%) | (K) | (K) | |||||||||||
| 0.0 | 113 | 1136 | -14.4 | 38 | 100 | 910 | 43 | |||||||
| 0.1 | 142 | 717 | -23.0 | 47 | 60 | 546 | 56 | |||||||
| 0.2 | 133 | 875 | -17.1 | 49 | 85 | 774 | 52 | |||||||
| 0.3 | 158 | 1151 | -22.3 | 58 | 105 | 956 | 61 |
In the low and high temperature limits for the MW model, we obtained (Low-) = and (high-) = 9.1 . At high temperatures, the apparent dielectric constant was enhanced by the reduced effective thickness because of the good conducting grains surrounded by the insulating grain boundaries. (Low-) and (high-) were responsible for the high and low frequency limits, and , respectively. Table 2 shows that the characteristic temperatures estimated from the expression of the MW-model-based relaxation agree well with the shoulder temperatures for all the measured samples. Here, is the characteristic temperature of the dielectric loss at which . For 10 kHz, we obtained the value of from Eq. (5) and estimated the corresponding temperature from the data in Fig. 2 (a).
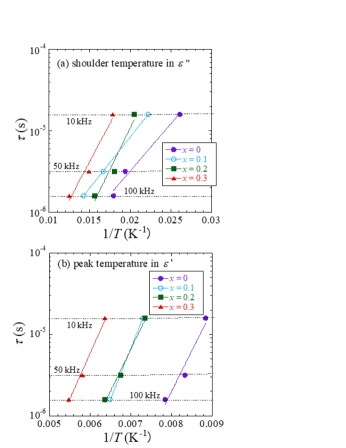
In Fig. 7, we show the Arrhenius plots from the dielectric-loss shoulder temperature and the dielectric peak temperature measured at three frequencies ( = 10, 50, and 100 kHz). In Table 3, the activation energy and relaxation time from the Arrhenius plots using are listed as a function of Sr content. The parameters, and , are related to the relaxation process of the heterogeneous material consisting of grain-boundaries and semiconducting grains. In contrast, and estimated from the dielectric peak temperature are associated with the relaxation process of localized charges. In particular, and are comparable to the typical values of polaronic relaxation in CaMnO3 and other perovskites Cohn et al. (2005). The values of estimated from the dielectric peak are also not very different from the small polaron hopping energies estimated from the resistivity data. Therefore, we suggest that the high-temperature dielectric and transport data strongly indicate the polaronic nature of the present system.
| (meV) | (s) | (meV) | (s) | |
|---|---|---|---|---|
| 0.0 | 23 | 198 | ||
| 0.1 | 25 | 248 | ||
| 0.2 | 41 | 204 | ||
| 0.3 | 37 | 264 |
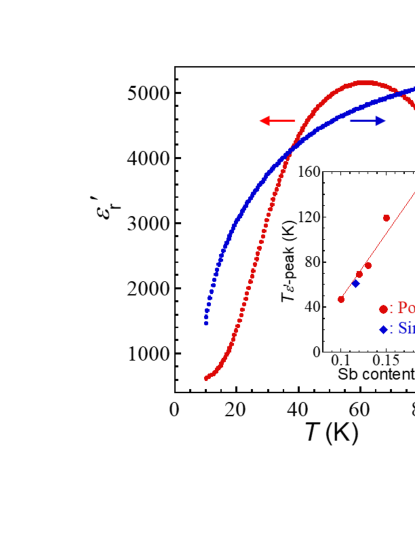
In addition to the above calculations, we also measured the dielectric constant of a single-crystalline CaMn0.88Sb0.12O3 (thickness: 0.75 mm, cross-sectional area: 13.0 mm2) to verify the influence of the MW effect Lunkenheimer et al. (2010), as shown in Fig. 8. The MW effect originating from grain boundaries can be excluded in single-crystalline samples. In the single crystal, exhibits a broad peak at a temperature that is consistent with of the polycrystal with the same chemical composition, as shown in the inset of Fig 8. This reproducibility of indicates that the large-value broad peak of in Ca1-xSrxMn0.85Sb0.15O3 is not the MW effect but an intrinsic phenomenon. In contrast, the sharp decrease of and the shoulder of were not observed in the single-crystalline sample, suggesting that these two anomalies at approximately 45 K are caused by the MW effect.
Regarding the magnetic-field dependence of , we should note that an apparent effect can be caused by the combination of magnetoresistance and MW effect Catalan (2006); Kamba et al. (2007). In addition, from this viewpoint, we can exclude the possibility that the dielectric peak is caused by the MW effect. When the combination of magnetoresistance and MW effect causes the apparent "magneto-capacitance effect", the sign of the "magneto-capacitance effect" changes depending on whether the magnetoresistance occurs at the sample core or at the interface Catalan (2006). First, for the core-dominated magnetoresistance, which is detectable in the high-frequency conductivity, the sign of "magneto-capacitance effect" is positive. In contrast, the sign of the observed magneto-capacitance effect is negative in Ca1-xSrxMn0.85Sb0.15O3. Thus, the origin of the magneto-capacitance effect in Ca1-xSrxMn0.85Sb0.15O3 is not core-dominated magnetoresistance. Second, for the interface-dominated magnetoresistance, which is detectable in the low-frequency conductivity, the magnetoresistance of CaMn0.85Sb0.15O3 seems to be within the error margin, as shown in Fig. 2 (c). Using the measured resistivity value, we calculated the dielectric constant of the MW effect for 0 T and 1 T based on Eq. (3). As shown in Fig. 4(a), the two calculation curves almost overlapped and could not explain the observed significant magnetic-field effect. Thus, the origin of the magneto-capacitance effect in Ca1-xSrxMn0.85Sb0.15O3 was not interface-dominated magnetoresistance. Therefore, we conclude that the magneto-capacitance effect in Ca1-xSrxMn0.85Sb0.15O3 which is significant at is an intrinsic phenomenon.
From the above discussion, the dielectric characters that are expected to be intrinsic are (1) the broad peak structure of , (2) the frequency dependence of this peak, and (3) the negative magnetic-field effect on this peak. Because the Arrhenius plots identified the dielectric peak as a phenomenon originating from polarons, the peak suggests that below the peak temperature , it becomes difficult for dipole moments consisting of polarons to change their direction following the plus-minus switching of an applied AC electric field. This behavior can be attributed to the spontaneous dipole ordering; the relaxation time and the activation energy suggest that polarons form the dipole ordering. In the charge-ordering system Pr1-xCaxMnO3 whose broad dielectric peak and high conductivity are similar to those of Ca1-xSrxMn0.85Sb0.15O3 Jardón et al. (1999); Mercone et al. (2004); Serrao et al. (2007), the electric polarization is directly proved by the positive-up-negative-down method Shukla et al. (2014). Thus, by analogy with Pr1-xCaxMnO3, it is reasonable to expect electric polarization in Ca1-xSrxMn0.85Sb0.15O3 below , at least microscopically.
A broad frequency-dependent peak is commonly observed in dielectric glasses Bokov and Ye (2006). Moreover, the ion arrangement of Ca1-xSrxMn0.85Sb0.15O3 in which different ions exist on crystallographically equivalent sites is favorable for some dielectric glasses. Therefore, we speculate that Ca1-xSrxMn0.85Sb0.15O3 is a dielectric glass consisting of clusters with a short-range dipole ordering: Because the substituted Sb ions induce disorder (inhomogeneity) into the Mn sites and curb the Mn-Mn interaction, the dipole ordering caused by an Mn-Mn interaction is of the short-range in Ca1-xSrxMn0.85Sb0.15O3. As a similar example, a spin-glass state is observed in CaMn1-ySbyO3 () Murano et al. (2011).
With respect to coupling between the dielectric and conducting properties, the similarities in values and the positive correlation in the Sr substitution between and suggest that the dielectric peak is related to CO in Ca1-xSrxMn0.85Sb0.15O3 ( = 0, 0.1, 0.2, and 0.3). It is expected that the peak of is not a secondary anomaly which accompanies changes in conductivity, but it is an intrinsic anomaly originating from capacitive charges. If a dielectric anomaly is dominated by conductivity, which contains the effect of conductivity as well as the dielectric loss will exhibit a more drastic anomaly than . However, of Ca1-xSrxMn0.85Sb0.15O3 does not exhibit an anomaly at ; an example is shown in the inset of Fig. 5 (b). Even the temperature derivative that can detect a subtle anomaly does not change at . Therefore, we consider that the dielectric peak in Ca1-xSrxMn0.85Sb0.15O3 is caused by the ordering of localized polarons. CO is a possible example of this ordering.
The magneto-capacitance effect in Ca1-xSrxMn0.85Sb0.15O3 can be understood by the hypothesis that a spontaneous dipole ordering along a certain direction is stabilized by a magnetic field. The suppression of the peak height of by a magnetic field suggests that the magnetic field fixes the direction of dipole moments in Ca1-xSrxMn0.85Sb0.15O3 and disturbs their response to an applied AC electric field. The enhancement of for shown in Fig. 6 (b) indicates that the magnetic field supports a dipole ordering.
The stabilization of the spontaneous dipole ordering along a certain direction by a magnetic field can be explained by the character of Ca1-xSrxMn0.85Sb0.15O3, i.e., the dipole ordering seems to accompany an AFM ordering. Under 0 T, in a system that has multi crystallographically equivalent axes, a magnetic/dipole ordering possesses several possible directions that are degenerated. A magnetic field introduces anisotropy into the system and fixes the direction of the magnetic ordering. Because a one-to-one correspondence is expected between the direction of the dipole ordering and that of the AFM ordering, the direction of the dipole ordering is also fixed by a magnetic field.
Next, we discuss why the substitution of Sr in this compound remarkably increases , and by more than 40 K from = 0 to 0.3. Because the Sr2+ ion is isovalent to the Ca2+ ion, the change of the electronic properties is expected to be caused by a lattice deformation. As shown in Table 1, the tolerance factor changes from 0.9896 at = 0 to 1.000 at = 0.3. (, , and are ionic radii of , , and O ion in the O3 perovskite, respectively.) The change of suggests that Mn-O-Mn angles approach 180∘. Therefore, we consider that Sr substitution enhances the AFM super-exchange interaction between Mn4+ ions and assists in the formation of an AFM ordering that is accompanied by a dipole ordering.
As the next issue, it would be important to clarify whether macroscopic electric polarization exists at low temperatures. Because Ca1-xSrxMn0.85Sb0.15O3 exhibits relatively high conductivity, the positive-up-negative-down method would be required Traynor et al. (1997); Yang et al. (2005); Fukunaga and Noda (2008); Naganuma et al. (2008); Shukla et al. (2014). It would also be interesting to investigate the anisotropy of the dielectric properties using single crystals.
V Summary
We measured the dielectric constant, resistivity, and magnetization of electron-doped manganite Ca1-xSrxMn0.85Sb0.15O3 ( = 0, 0.1, 0.2, and 0.3). The temperature dependence of the dielectric constant shows a broad and large peak above 110 K in the real part, followed by a sharp decrease at approximately 45 K, at which the imaginary part exhibits a shoulder structure. The sharp decrease in and the shoulder structure in can be understood by the MW scenario. The apparent colossal dielectric constant is partially explained by the reduced effective thickness due to the good conducting grains surrounded by the insulating grain boundaries at high temperatures. However, for the following three reasons, the peak in is expected to be intrinsic and suggests a dipole ordering of polarons: (1) the peak cannot be reproduced by calculations based on the MW model; (2) the values of the relaxation time and the activation energy that are estimated from the frequency dependence of the peak temperature are typical of polaronic relaxation; and (3) the peak is observed similarly in single-crystalline samples. The peak height is suppressed and the peak temperature is enhanced by increasing frequency. This frequency dependence suggests that Ca1-xSrxMn0.85Sb0.15O3 is a dielectric glass. This hypothesis is reasonable because Sb substitution introduces inhomogeneity in the Mn lattice, and dielectric glasses are often found in such inhomogeneous systems. Because the temperature of the dielectric peak is similar to that of the resistivity anomaly which suggests a CO, the dipole ordering in Ca1-xSrxMn0.85Sb0.15O3 might be driven by CO. This dipole ordering accompanies AFM ordering because a magnetization kink was observed near the peak temperature of . Notably, we revealed that the dielectric peak exhibits a negative magnetic-field effect, which cannot be explained by magnetoresistance. We consider that the AFM ordering in Ca1-xSrxMn0.85Sb0.15O3 is the glue between the magnetic field and dipole ordering and causes the magneto-capacitance effect. Substituting Ca2+ with isovalent Sr2+ remarkably enhances the temperature of the dielectric peak by 50 K probably because Mn-O-Mn buckling is released and the AFM super-exchange interaction between Mn4+ ions is enhanced.
Acknowledgments
We acknowledge Y. Ishii, H. Yamamoto, S. Sekikawa, and H. Kimura for fruitful discussions, T. Yajima for the technical support, and H. Fujishiro for the advice on scientific writing. This work is supported by Iwate University, JSPS KAKENHI Grant Number JP17K14101, and Visiting Researcher’s Program of the ISSP. One of the authors (T. W.) was supported by Hirosaki University Grant for Distinguished Researchers FY2017-2018. We would like to thank Editage (www.editage.com) for English language editing.
References
- Tokura et al. (1996) Y. Tokura, H. Kuwahara, Y. Moritomo, Y. Tomioka, and A. Asamitsu, Phys. Rev. Lett. 76, 3184 (1996).
- Zeng et al. (2001) Z. Zeng, M. Greenblatt, and M. Croft, Phys. Rev. B 63, 224410 (2001).
- Maignan et al. (2002) A. Maignan, C. Martin, C. Autret, M. Hervieu, B. Raveaua, and J. Hejtmanekb, J. Mater. Chem. 12, 1806 (2002).
- Caspi et al. (2004) E. N. Caspi, M. Avdeev, S. Short, J. D. Jorgensen, M. V. Lobanov, Z. Zeng, M. Greenblatt, P. Thiyagarajan, C. E. Botez, and P. W. Stephens, Phys. Rev. B 69, 104402 (2004).
- Okuda and Fujii (2010) T. Okuda and Y. Fujii, J. Appl. Phys. 108, 103702 (2010).
- Cohn et al. (2004) J. L. Cohn, M. Peterca, and J. J. Neumeier, Phys. Rev. B 70, 214433 (2004).
- Cohn et al. (2005) J. L. Cohn, M. Peterca, and J. J. Neumeier, J. Appl. Phys. 97, 034102 (2005).
- Jardón et al. (1999) C. Jardón, F. Rivadulla, L. E. Hueso, A. Fondado, M. A. López-Quintela, J. Rivas, R. Zysler, M. T. Causa, and R. D. Sánchez, J. Magn. Magn. Mater. 196, 475 (1999).
- Mercone et al. (2004) S. Mercone, A. Wahl, A. Pautrat, M. Pollet, and C. Simon, Phys. Rev. B 69, 174433 (2004).
- Freitas et al. (2005) R. S. Freitas, J. F. Mitchell, and P. Schiffer, Phys. Rev. B 72, 144429 (2005).
- Serrao et al. (2007) C. R. Serrao, A. Sundaresan, and C. N. R. Rao, J. Phys.: Condens. Matter 19, 496217 (2007).
- Sahu et al. (2009) J. R. Sahu, C. R. Serrao, A. Ghosh, A. Sundaresan, and C. N. R. Rao, Solid State Communications 149, 49 (2009).
- Murano et al. (2010) Y. Murano, M. Matsukawa, S. Kobayashi, S. Nimori, and R. Suryanarayanan, J. Phys.: Conf. Ser. 200, 012114 (2010).
- Murano et al. (2011) Y. Murano, M. Matsukawa, S. Ohuchi, S. Kobayashi, S. Nimori, R. Suryanarayanan, K. Koyama, and N. Kobayashi, Phys. Rev. B 83, 054437 (2011).
- Fujiwara et al. (2013) T. Fujiwara, M. Matsukawa, S. Ohuchi, S. Kobayashi, S. Nimori, and R. Suryanarayanan, J. Kor. Phys. Soc. 62, 1925 (2013).
- Fujiwara et al. (2015) T. Fujiwara, M. Matsukawa, T. Aoyagi, S. Kobayashi, H. Taniguchi, S. Nimori, and R. Suryanarayanan, J. Magn. Magn. Mater. 378, 451 (2015).
- Taniguchi et al. (2018) H. Taniguchi, H. Takahashi, A. Terui, S. Kobayashi, M. Matsukawa, and R. Suryanarayanan, J. Phys.: Conf. Ser. 969, 012094 (2018).
- Fiebig et al. (2002) M. Fiebig, T. Lottermoser, D. Frohlich, A. V. Goltsev, and R. V. Pisarev, Nature 419, 818 (2002).
- Lorenz et al. (2007) B. Lorenz, Y.-Q. Wang, and C.-W. Chu, Phys. Rev. B 76, 104405 (2007).
- Katsura et al. (2005) H. Katsura, N. Nagaosa, and A. V. Balatsky, Phys. Rev. Lett. 95, 057205 (2005).
- Sergienko and Dagotto (2006) I. A. Sergienko and E. Dagotto, Phys. Rev. B 73, 094434 (2006).
- Arima (2007) T. Arima, J. Phys. Soc. Jpn. 76, 073702 (2007).
- Ikeda et al. (2000) N. Ikeda, K. Kohn, N. Myouga, E. Takahashi, H. Kitoh, and S. Takekawa, J. Phys. Soc. Jpn. 69, 1526 (2000).
- Efremov et al. (2004) D. V. Efremov, J. Brink, and D. I. Khomskii, Nature Materials 3, 853 (2004).
- Efremov et al. (2005) D. V. Efremov, J. Brink, and D. I. Khomskii, Physica B 359, 1433 (2005).
- Ikeda et al. (2005) N. Ikeda, H. Ohsumi, K. Ohwada, K. Ishii, T. Inami, K. Kakurai, Y. Murakami, K. Yoshii, S. Mori, Y. Horibe, et al., Nature 436, 1136 (2005).
- Khomskii (2006) D. I. Khomskii, J. Magn. Magn. Mater. 306, 1 (2006).
- Nagano et al. (2007) A. Nagano, M. Naka, J. Nasu, and S. Ishihara, Phys. Rev. Lett. 99, 217202 (2007).
- Brink and Khomskii (2008) J. Brink and D. I. Khomskii, J. Phys.: Condens. Matter 20, 434217 (2008).
- Giovannetti et al. (2009) G. Giovannetti, S. Kumar, J. van den Brink, and S. Picozzi, Phys. Rev. Lett. 103, 037601 (2009).
- Poltavets et al. (2004) V. Poltavets, K. Vidyasagar, and M. Jansen, Solid State Chem. 177, 1285 (2004).
- Catalan (2006) G. Catalan, Appl. Phys. Lett. 88, 102902 (2006).
- Shukla et al. (2014) V. K. Shukla, S. Mukhopadhyay, K. Das, A. Sarma, and I. Das, Phys. Rev. B 90, 245126 (2014).
- von Hippel (1954) A. R. von Hippel, Dielectrics and Waves (Wiley, London, 1954).
- Lunkenheimer et al. (2002) P. Lunkenheimer, V. Bobnar, A. V. Pronin, A. I. Ritus, A. A. Volkov, and A. Loidl, Phys. Rev. B 66, 052105 (2002).
- Lunkenheimer et al. (2010) P. Lunkenheimer, S. Krohns, S. Riegg, S. G. Ebbinghaus, A. Reller, and A. Loidl, Eur. Phys. J. Special Topics 180, 61 (2010).
- Taniguchi et al. (2019) H. Taniguchi, H. Takahashi, A. Terui, S. Kobayashi, M. Matsukawa, and R. Suryanarayanan, IEEE Trans. Magn. 55, 1000104 (2019).
- Kamba et al. (2007) S. Kamba, D. Nuzhnyy, M. Savinov, J. Šebek, J. Petzelt, J. Prokleška, R. Haumont, and J. Kreisel, Phys. Rev. B 75, 024403 (2007).
- Bokov and Ye (2006) A. A. Bokov and Z.-G. Ye, J. Mater. Sci. 41, 31 (2006).
- Traynor et al. (1997) S. D. Traynor, T. D. Hadnagy, and L. Kammerdiner, Integr. Ferroelectrics 16, 63 (1997).
- Yang et al. (2005) S. Y. Yang, F. Zavaliche, L. Mohaddes-Ardabili, V. Vaithyanathan, D. G. Schlom, Y. J. Lee, Y. H. Chu, M. P. Cruz, Q. Zhan, T. Zhao, et al., Appl. Phys. Lett. 87, 102903 (2005).
- Fukunaga and Noda (2008) M. Fukunaga and Y. Noda, J. Phys. Soc. Jpn. 77, 064706 (2008).
- Naganuma et al. (2008) H. Naganuma, Y. Inoue, and S. Okamura, Appl. Phys. Express 1, 061601 (2008).