Infrared Dark Clouds and high-mass star formation activity in Galactic Molecular Clouds
Abstract
Ever since their discovery, Infrared dark clouds (IRDCs) are generally considered to be the sites just at the onset of high-mass (HM) star formation. In recent years, it has been realized that not all IRDCs harbour HM Young Stellar Objects (YSOs). Only those IRDCs satisfying a certain mass-size criterion, or equivalently above a certain threshold density, are found to contain HMYSOs. In all cases, IRDCs provide ideal conditions for the formation of stellar clusters. In this paper, we study the massive stellar content of IRDCs to re-address the relation between IRDCs and HM star formation. For this purpose, we have identified all IRDCs associated to a sample of 12 Galactic molecular clouds (MCs). The selected MCs have been the target of a systematic search for YSOs in an earlier study. The catalogued positions of YSOs have been used to search all YSOs embedded in each identified IRDC. In total, we have found 834 YSOs in 128 IRDCs. The sample of IRDCs have mean surface densities of 319 , mean mass of 1062 , and a mass function power-law slope , which are similar to the corresponding properties for the full sample of IRDCs and resulting physical properties in previous studies. We find that all those IRDCs containing at least one intermediate to high-mass young star satisfy the often-used mass-size criterion for forming HM stars. However, not all IRDCs satisfying the mass-size criterion contain HM stars. We find that the often used mass-size criterion corresponds to 35% probability of an IRDC forming a massive star. Twenty five (20%) of the IRDCs are potential sites of stellar clusters of mass more than 100 .
Subject headings:
ISM: YSOs — ISM: HII regions — ISM: infrared dark clouds — stars: formation1. Introduction
Infrared dark clouds (IRDCs) are dark silhouettes observed in the mid-infrared (MIR) due to the contrast of the absorption against the bright emission of the Galactic background in the MIR images first observed using the Infrared Space Observatory survey (Perault et al., 1996) and the Midcourse Space Experiment (Egan et al., 1998). These regions are associated to the densest regions of the Galactic molecular clouds (MCs) and have physical conditions such as low temperatures () and high densities () (Rathborne et al., 2009; Ragan et al., 2013). These conditions compare well with those present in high-mass star-forming (HMSF) regions (Rathborne et al., 2006; Simon et al., 2006; Beuther & Steinacker , 2007). Follow-up studies confirm IRDCs as birthplaces of high-mass (HM) stars and possibly stellar clusters as well (Kauffmann & Pillai, 2010; Henshaw et al., 2014; Wang et al., 2014). Thus, IRDCs offer an opportunity to understand the details of HMSF process, and particularly, the stellar cluster formation.
Stars form in compact sub-parsec sized cores usually embedded at the densest parts of the IRDCs. Results of Alves et al. (2007) and André et al. (2010) show that the form of the core mass function resembles well the Initial Mass Function (IMF) of stars. This suggests that the process driving the fragmentation of the progenitor cloud in to cores principally establishes the form of the stellar IMF. Given their compactness, cores can be detected only in nearby MCs. The densest structures seen in emission in farther MCs have sizes of 1 pc and are often referred to as clumps. These clumps have mass function that resembles the mass function of giant MCs with an index ranging from 1.8 Kramer et al. (1998) to 2.1 Simon et al. (2001).
The similarity in physical properties (size, density, mass, etc.) of IRDCs and the clumps (Rathborne et al., 2006; Ragan et al., 2013), makes the study the IRDC mass distribution of great importance. Studies so far have not found any noticeable differences in the power-law () indices for the IRDCs and the clumps with clustered around . The results of some of these studies are summarized here. Rathborne et al. (2006) reported for clumps embedded in IRDCs, whereas Simon et al. (2006) using observations in 13CO emission for an IRDCs sample, found . Ragan et al. (2009) reported a broken power law, with for masses greater than 40 . Peretto & Fuller (2010) (hereafter PF10) reported for masses greater than 100 for IRDCs. Recently, Gómez González (2012) using observations at 1.2 mm, reported in the mass range from 15 to 3000 , for massive clumps.
Theoretical studies have shown that the HMSF can occur only in regions that have gas densites above the threshold densities of 1 g cm-3 (4790 )(Krumholz & Mckee, 2008). Rathborne et al. (2009) found that the surface gas densities in IRDCs are often above this threshold density. Kauffmann et al. (2010) defined an empirical mass-size threshold relation to identify clouds that may contain HM star formation sites, by studying Galactic MCs with and without HM star formation. Kauffmann & Pillai (2010) found that 25% to 50% of the IRDCs in the samples from Rathborne et al. (2006) and Peretto & Fuller (2009) belong to clouds that are above the mass-size threshold relation. Star-forming clumps from Bolocam Survey also obey the threshold relation (Svoboda et al., 2016). Thus, there is overwhelming support to the idea that IRDCs are potential HMSF sites.
In a recent work, we (Retes-Romero et al., 2017, hereafter R17) studied the YSO populations in a sample of 12 Galactic MCs. Each chosen MC contains a CS clump associated to young luminous IRAS sources, as well as the presence of HMSF tracers such as a methanol, and OH maser emitting sources and SiO outflows. The Line-of-Sight (LoS) to each MC is devoid of any intervening molecular cloud as inferred from their 13CO profiles. We used the Galactic rotation curve model of Clemens (1985) to infer the kinematical distances to all our sample MCs, assigning in all cases the near distance, when there is distance ambiguity. The IRDCs catalogued in the present work are embedded in the MCs, and hence the MC distances also apply to the IRDCs. It is important to note that this association of our sample IRDCs to MCs eliminates the usual problem of determining distances to IRDCs. Hence, our distances to IRDCs only suffer from the error involved in the kinematical distance method, which is estimated to be 12% by Faúndez et al. (2004). This distance error is comparable to the 15% accuracy quoted by Simon et al. (2001) for molecular clouds from the Milky Way Galactic Ring Survey using 13CO data. However, the error in the distance can be much greater than the 12%-15% mentioned here and vary depending on longitude and near/far side, as found by Roman-Duval et al. (2009). The introduction of the error on distance is the main source of uncertainty on the physical parameters of the IRDCs.
In addition, stellar masses are available for all embedded YSOs. All these characteristics of our dataset, offers us an opportunity to study quantitatively the high mass star formation, as well as stellar cluster formation in IRDCs of wide ranging masses and sizes. The dataset also allows, for the first time, an exploration of whether a star formation rate-surface density relation, commonly referred to as the Kennicutt-Schimdt (K-S) law (Kennicutt, 1998), is applicable within the IRDCs. It may be noted that, K-S law though primarily applicable on kiloparsec scales in extragalactic objects with a power-law index of 1.4, is also applicable within individual Galactic molecular clouds (MCs). Willis et al. (2015) found the index to be varying between 1.77 to 2.86 for HMSF regions, whereas for our sample of 12 MCs, index is found to vary between 1.4 and 3.6.
The structure of the paper is the following. In §2, we describe our sample of IRDCs. Their mass and size distributions are given in §3. The SF properties in our sample of IRDCs are discussed in §4. We summarize our conclusions in §5.
2. IRDC sample and analysis
The sample of IRDCs in the present study consists of all IRDCs associated to the 12 MCs studied by R17, and are drawn from the Peretto & Fuller (2009) IRDC catalog (hereafter PF09). All MCs in this sample have at least one HMSF site, as characterized by a dense clump detected in CS(J=2–1) line emission and 1.2 mm dust continuum millimeter emission (Bronfman et al., 1996; Faúndez et al., 2004), associated to maser emitting towards to IRAS sources. The MCs were defined using the 13CO (J=1–0) line emission data from the Galactic Ring Survey (GRS) (Jackson et al., 2006). All the molecular gas that is above a column density of gas equivalent to mag and is within 5 of the CS peak velocity is considered to be part of the MC. In Table 1, we give the physical properties of these MCs. Our MCs are at distances (kinematical) of 1–5.4 kpc, have masses (LTE method) in the range 2.3–135 , and =1–27 (Retes-Romero et al., 2017).
| GMC | IRAS name | Lon | Lat | D | MLTE | N(YSOs) | N(IRDCs) | SFE | ||
|---|---|---|---|---|---|---|---|---|---|---|
| [deg] | [deg] | [kpc] | [] | [] | [] | [%] | ||||
| (1) | (2) | (3) | (4) | (5) | (6) | (7) | (8) | (9) | (10) | (11) |
| MC1 | 192301506 | 50.28 | 0.39 | 1.3 (0.2) | 0.33 (0.17) | 130 | 6 | 210 (114) | 3.3 (1.7) | 2.7 (0.3) |
| MC2 | 192361456 | 50.22 | 0.61 | 3.4 (0.4) | 3.07 (1.55) | 556 | 23 | 155 (79) | 2.1 (1.1) | 2.2 (0.1) |
| MC9 | 191391113 | 45.82 | 0.28 | 4.8 (0.6) | 2.56 (1.10) | 861 | 9 | 646 (332) | 19.1 (9.6) | 3.9 (0.2) |
| MC12 | 191321035 | 45.19 | 0.44 | 5.4 (0.6) | 2.24 (1.12) | 170 | 3 | 358 (179) | 1.1 (0.6) | 0.5 (0.1) |
| MC20 | 190740814 | 42.43 | 0.26 | 4.9 (0.6) | 2.44 (1.20) | 292 | 5 | 647 (320) | 6.4 (3.3) | 1.2 (0.1) |
| MC21 | 190740752 | 42.11 | 0.44 | 3.9 (0.5) | 3.52 (1.59) | 672 | 15 | 133 (60) | 2.3 (1.2) | 2.6 (0.2) |
| MC23 | 190480748 | 41.75 | 0.09 | 1.0 (0.1) | 0.30 (0.22) | 592 | 1 | 320 (240) | 26.8 (13.5) | 11.9 (0.7) |
| MC75 | 182321154 | 19.49 | 0.15 | 2.3 (0.3) | 2.32 (1.20) | 596 | 7 | 613 (320) | 5.6 (2.8) | 1.5 (0.1) |
| MC76 | 182361205 | 19.36 | 0.02 | 2.5 (0.3) | 3.14 (1.74) | 666 | 25 | 565 (310) | 7.5 (3.7) | 2.1 (0.1) |
| MC78 | 182231243 | 18.66 | 0.06 | 3.7 (0.4) | 13.52 (6.46) | 721 | 25 | 763 (365) | 4.6 (2.3) | 0.8 (0.1) |
| MC80 | 182051316 | 17.96 | 0.08 | 2.2 (0.3) | 9.57 (5.03) | 661 | 7 | 816 (410) | 5.6 (2.8) | 1.2 (0.1) |
| MC81 | 181901414 | 16.94 | 0.07 | 2.1 (0.3) | 0.23 (0.11) | 14 | 3 | 218 (64) | 1.0 (0.7) | 0.8 (0.3) |
Brief explanation of columns: (1) Name of the molecular cloud; (2) Name of the principal IRAS source in the MC; (3–4) Galactic longitude and latitude in degree; (5) Kinematical distance (with an error of 12%) to the dense clump associated to the IRAS source from Faúndez et al. (2004) ; (6) Mass of the MC obtained using the LTE method; (7-8) Number of YSOs and IRDCs spatially associated to the MC; (9) Surface gas density of the MC; (10) Surface density of star formation rate of the MC; (11) Star formation efficiency in % units in each cloud.
2.1. Selection of IRDCs associated to the molecular clouds
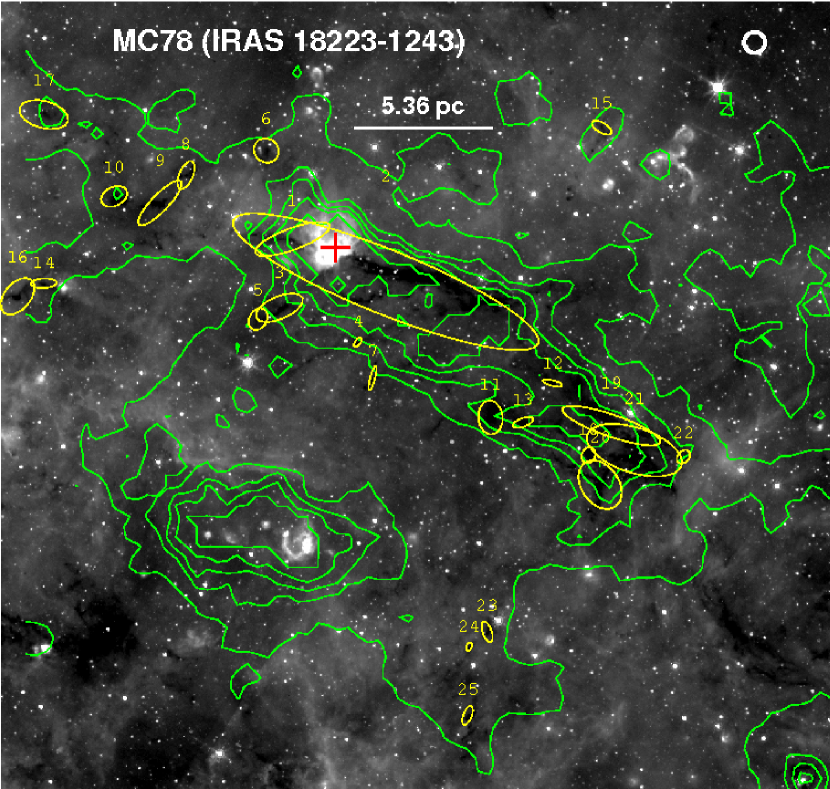
The PF09 catalog is the most complete source of IRDCs seen on Spitzer 8 m images. These authors defined an IRDC as a connected structure with a threshold opacity in Spitzer 8 m band () of 0.35 () and an angular size greater than 4″. A visual inspection of our cloud locations on the 8 m Spitzer images shows IRDCs. We selected all IRDCs from the PF09 catalog that are within the boundaries of our MCs, defined previously using a columnar gas threshold. In the 8 m images of the star-forming (SF) regions of our sample, intense emission and absorption zones coexist spatially. This hinders the identification of structures such as the IRDCs. Thus, we performed a visual inspection for spatial association of the positions of IRDCs and dark patches in the 8 m images. The IRDCs without spatial association were rejected from the sample. The column 8 of Table 1 gives the number of IRDCs associated to each MC. The complete IRDC sample contains 128 objects; their names, coordinates and observed/derived parameters are listed in Table 2. The printed version contains 10 sources to guide the reader and the complete table is given in the electronic version. The positions of IRDCs most often coincide with the densest 13CO contours of the MCs. This is illustrated for the IRAS 18223-1243 (MC78) region in Figure 1. IRDCs with major axis sizes larger than the 13CO beam size of 46″ are clearly associated to the densest contours of the MCs.
3. Physical properties of the IRDCs associated to the MCs
In order to obtain the masses of the IRDCs, we obtained the surface gas density () and physical area of each object. These parameters are obtained using the mean opacity () in the Spitzer 8 m band and the aparent size of the IRDCs, taken from the PF09 catalog. To compute the surface gas density of each IRDC, we used the expression (Butler & Tan, 2012),
| (1) |
where a gas-to-dust ratio of 156 (Ossenkopf & Henning, 1994; Butler & Tan, 2012), and an equivalence 1 = 4790 have been used, assuming a 1 pc depth.
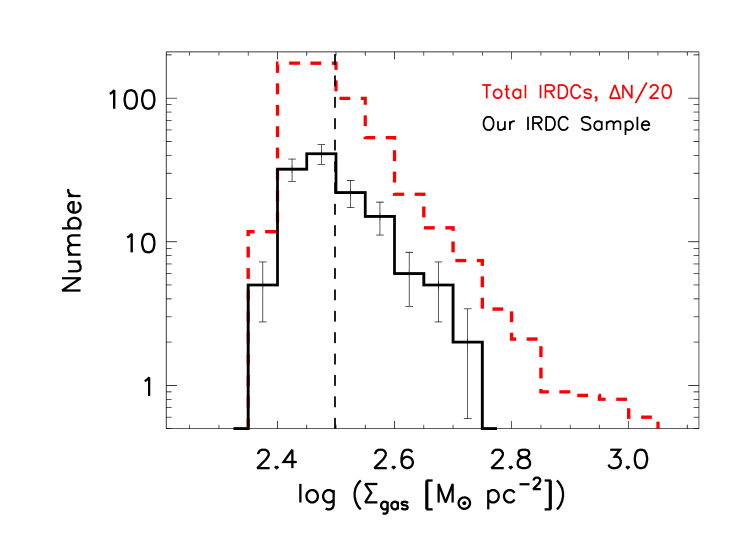
The distribution for our sample of IRDCs is shown in Figure 2, along with that for the full PF09 sample. The mean value of 319 (0.07 ) for our sample compares very well with the mean value for the PF09 sample of =320 . The distributions also have very similar ranges. This illustrates that our sample of IRDCs is representative of the full sample of IRDCs in PF09. The properties of our sample are also similar to that reported for Galactic dense clumps with or without star formation (Schisano et al., 2014; Ragan et al., 2013). Figure 2 shows there is a small range in gas surface densities (250 to 500 ) that likely arises from an observational limitation. IRDCs are selected in absorption against the galactic background light at 8 m. This technique is sensitive only for a small range of gas densities, as is shown in the Fig. 2 for the complete IRDC sample of PF09. At low densities, the absorption is not strong enough to be detected, whereas at high densities, the cloud becomes optically thick at 8 m. The technique underestimates the opacity when the region contains an 8 m emitting source. When the cloud starts forming stars, such sources are expected, and hence the true gas surface densities for star-forming clouds are likely to be higher than that infered by . Given that we use the mean value of from each IRDC to obtain its value, an agglomeration of values in a narrow dynamic range is expected, as observed in the Figures 2 and 9.
The masses of the IRDCs are obtained using the expression, , where the is the area of the ellipse associated to each IRDC (see the definition in PF09) and obtained from the major and minor axis angular sizes (see Table 2) and distance to the MC containing each IRDC (Table 1). The effective radius () is obtained assuming a circular symmetry and using the expresion, . We use this as a size indicator in the analysis of mass-size distribution. The values of , , , and other derived parameters of the clouds are listed in Table 2. The uncertainties in the derived parameters are obtained by propagating the distance errors.
However, uncertainty in can originate from several factors (which are considered beyond the scope of this work): a) the selection of the MIR opacity model pointed out by Butler & Tan (2012). The variation of opacity per unit gas mass, which is dependent on the model used, gives an uncertainty value of up to 30% in the , but in IRDCs typically is already 20%. b) The variation on the background intensity, which can lead to flux uncertainties of 10% ( 0.01 , for Galactic diffuse MIR emission; Butler & Tan (2012)). Another source of uncertainty is caused by foreground MIR emission along our line of sight to the IRDC. The effect is minimized by choosing IRDCs that are relatively nearby, which is the case for the IRDCs in the R17 MC sample.
| ID | Lon | Lat | a | b | Area | ||||||
| [deg] | [deg] | [”] | [”] | [ ∘ ] | [] | [pc] | [] | [] | [] | ||
| (1) | (2) | (3) | (4) | (5) | (6) | (7) | (8) | (9) | (10) | (11) | (12) |
| MC78-IRDC1 | 18.6810 | 0.0510 | 87.1 | 23.8 | 20 | 0.60 | 2.07(0.52) | 0.81(0.06) | 794(88) | 383(42) | 1.69(0.66) |
| MC78-IRDC2 | 18.6240 | 0.0700 | 361.5 | 70.3 | 22 | 0.71 | 25.39(6.35) | 2.84(0.20) | 11514(1267) | 453(50) | 1.40(0.55) |
| MC78-IRDC3 | 18.6890 | 0.0930 | 55.5 | 24.9 | 23 | 0.51 | 1.38(0.35) | 0.66(0.05) | 450(50) | 326(36) | 0.18(0.07) |
| MC78-IRDC4 | 18.6410 | 0.1140 | 12.0 | 5.9 | 52 | 0.42 | 0.07(0.02) | 0.15(0.01) | 19(3) | 268(30) | 3.52(1.38) |
| MC78-IRDC5 | 18.7020 | 0.1000 | 25.5 | 19.3 | 60 | 0.46 | 0.49(0.12) | 0.39(0.03) | 144(16) | 294(32) | 0.49(0.19) |
| MC78-IRDC6 | 18.6970 | 0.0030 | 28.5 | 26.0 | 35 | 0.46 | 0.74(0.19) | 0.48(0.03) | 218(24) | 294(32) | 0.32(0.13) |
| MC78-IRDC7 | 18.6320 | 0.1360 | 27.7 | 5.3 | 75 | 0.45 | 0.15(0.04) | 0.21(0.02) | 42(5) | 287(32) | 1.64(0.64) |
| MC78-IRDC8 | 18.7460 | 0.0120 | 32.9 | 14.9 | 67 | 0.58 | 0.49(0.12) | 0.39(0.03) | 181(20) | 370(41) | 0.49(0.19) |
| MC78-IRDC9 | 18.7620 | 0.0290 | 66.9 | 18.7 | 46 | 0.57 | 1.25(0.31) | 0.63(0.04) | 455(51) | 364(40) | 0.60(0.23) |
| MC78-IRDC10 | 18.7900 | 0.0250 | 30.5 | 20.9 | 26 | 0.70 | 0.64(0.16) | 0.45(0.03) | 285(32) | 447(49) | 5.10(1.98) |
| … | … | … | … | … | … | … | … | … | … | … | … |
A brief explanation of the columns: (1) ID of the IRDC; (2-3) Galactic coordinates of the IRDC centroid; (4-5) major (a) and minor (b) axes of the ellipse that best matches the IRDC; (6) orientation angle of the ellipse; (7) (mean) opacity in the Spitzer 8 m band; (8) area of the IRDC; (9) Effective radius of the IRDC; (10) Mass of the IRDC; (11) Surface gas density, and (12) Surface density of the star formation rate of the IRDC. The data for columns 2–7 are taken of PF09 catalog, and columns 8–12 are derived in this work. This table is available in its entirety in the electronic version.
The distribution of the mass and area of our IRDCs is shown in Figure 3. The vertical dotted lines at 2 and 50 indicate the limit of detection in mass, which is obtained using the definition of an IRDC in the Spitzer 8 m data (PF10) for a distance range from 1 kpc to 5.4 kpc, corresponding to our IRDC sample. For masses above this mass range, the distribution follows a power-law functional form given by,
| (2) |
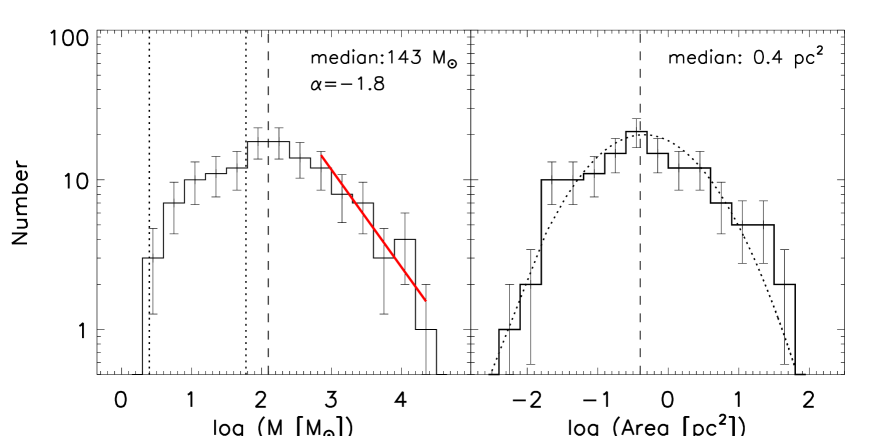
where M is the mass of the IRDC, and N is the number of the IRDCs in each mass bin. A linear regression (weighted by errors) in this regime gives . This index is consistent with the resulting index of 1.85 of Peretto & Fuller (2010) for IRDCs, and the values 2.1, 1.97 and 1.76 reported by Rathborne et al. (2006); Simon et al. (2006); Ragan et al. (2009), respectively, for clump mass distributions in IRDCs. It may be noted that a power-law functions with similar index values are also found for the prestellar and protostellar mass distributions (Knyves et al., 2010; André et al., 2010) and for stellar masses in young star clusters (see review of Bastian et al. (2010); §2.3.2).
In order to determine the surface density of the star formation rate () in the IRDCs, we obtained the spatial association of the young stellar objects (YSOs) within the ellipse defined for each IRDC. The positions and masses of the YSOs are taken from R17.
The method for obtaining the stellar masses and is fully detailed in R17 and briefly explained below. As a first step we determined the bolometric luminosity of each YSO, using a class-dependent conversion factor from the 24 m luminosity to bolometric luminosity. We used Spitzer MIR photometry dataset for determining the SED evolutionary phase (class I, II and III) and the 24 m fluxes. We used the pre-main sequence evolutionary tracks of Tognelli et al. (2011) to relate bolometric luminosities to stellar masses. We added masses of all YSOs within the ellipse defined in columns 4, 5 and 6 of Table 2 to determine the total stellar mass associated to each IRDC. We then divided this total mass by the the area of the ellipse and the typical timescale that stars spend in each evolutionary class from Hartmann & Kenyon (1996) and Evans et al. (2009) to obtain . For IRDCs without associated YSOs, we assigned a minimum stellar mass corresponding to one YSO of mass 0.5 to obtain a lower limit value of . The values are shown in column 12 of Table 2.
4. Analysis and discussion
4.1. The IRDCs as birth places of high-mass stars
The high-mass star formation process requires a high mass concentration in a relatively small volume. Beuther et al. (2007); Kauffmann et al. (2010); Svoboda et al. (2016) have suggested schemes to study the physical conditions required in the Galactic star-forming regions to form HM stars. Particularly, Kauffmann et al. (2010) (hereafter, K10) found that Galactic low-mass star-forming regions satisfy the relation , where . Kauffmann & Pillai (2010) studied the HM star-forming Orion region (Hillenbrand , 1997), and established the presence of massive stars in clouds more massive than that given by the above relation. For practical purposes, in the present work we redefine the K10 relation as,
| (3) |
In rest of this paper, we will refer this mass-size threshold criterion to form HM stars as K10 relation, in reference to the Kauffmann et al. (2010) paper. These authors had also suggested a slightly steeper (index 1.7) relation for a smaller range of sizes (). Considering that our sample covers the full range of sizes, we use the K10 criterion with index 1.33 in this work.
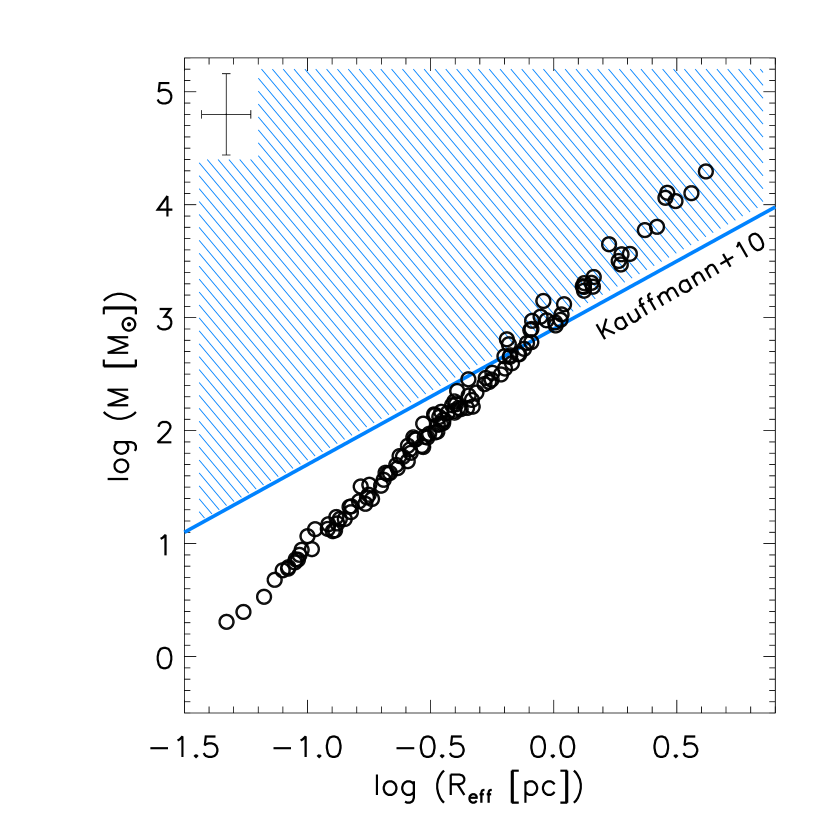
The mass-size diagram for our IRDCs is shown in Figure 4. In this Figure, the K10 criterion is traced with the solid blue line and striped area, while the distribution of the masses of the IRDCs as a function of their is plotted with the black circles. The masses and effective radii of the IRDCs were obtained as described in §3. A fit was performed on these data, resulting in a power-law relation of the form . In this relation, the constant has a value 300 , consistent with the median surface density value of the IRDCs sample.
In R17, we have tabulated masses of all YSOs embedded in our sample of IRDCs. In that study, YSOs classified as high luminosity YSO (HLYSOs; bolometric luminosities 10 ) are candidates for high mass YSOs. Typically, =10 corresponds to a star of 1.5 if it is Class I YSO, or 2 if it is Class II YSO. Given that YSOs in these early phases are still accreting, they are likely to end-up as high mass stars.
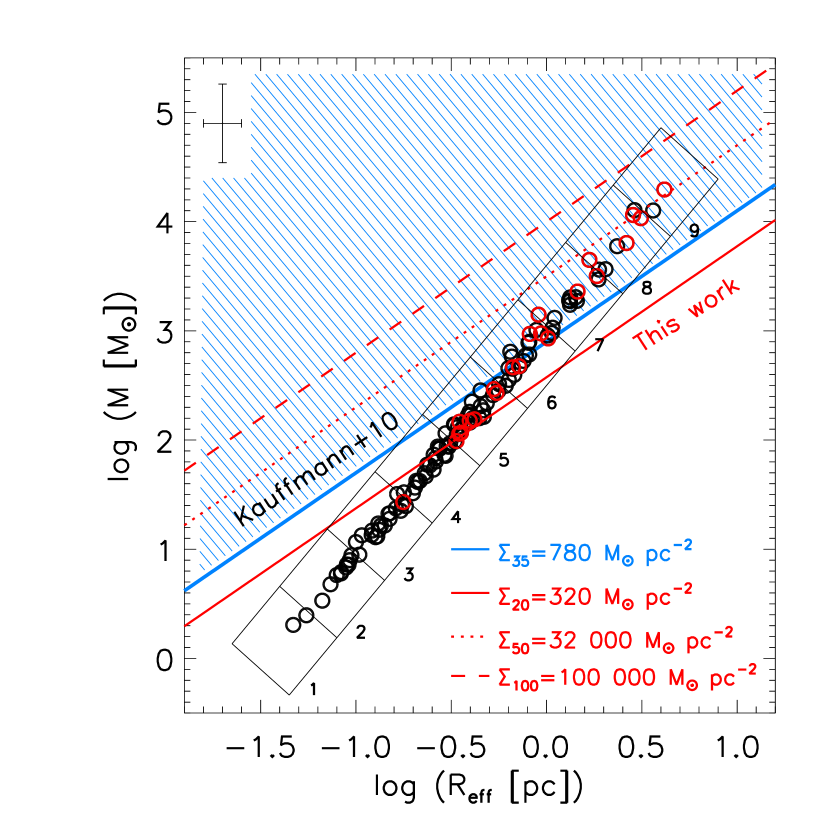
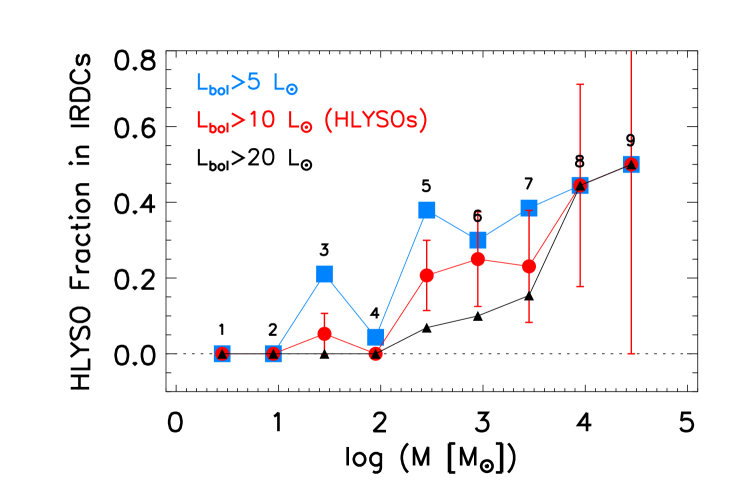
The availability of masses allows us to analyze the mass-radius relation for our sample of IRDCs. We started our analysis by identifying IRDCs that contain at least one HLYSO. These IRDCs are marked in red circles in Figure 5. Clearly there is a tendency for massive-large IRDCs to contain a HLYSO, as against lower values of mass-size of IRDCs. However, not all IRDCs satisfying the K10 criterion harbor a HLYSO. In order to understand the behavior in more detail, we analyze the fraction of IRDCs containing at least one HLYSO in small intervals of mass and radius along the mass-radius relation followed by our IRDCs. These intervals are shown as boxes in Figure 5. We characterize each box by the mean mass of IRDCs in that box. In Figure 6, we plot the fraction of IRDCs containing at least one HLYSO as a function of the mean mass for each bin (red line connecting circles). In the plot, we also show the fraction of IRDCs that contain at least one YSO of 5 (blue line connecting squares) and 20 (black line connecting triangles). The fraction of IRDCs containing high luminosity YSOs clearly increases with increasing IRDC mass. The frequency of finding high-mass YSOs in IRDCs of our sample that satisfy the K10 criterion is 26% for 500 , which increases monotonically to 50% for the most massive IRDCs (from 10000 to 20000 ).
IRDCs that satisfy the K10 criterion are usually considered as sites of massive star formation. 26% of our IRDCs satisfy the K10 criterion, but only one third of these contain massive YSOs. This suggests that not all IRDCs are currently forming massive stars. We further find that more massive an IRDC is, it has a higher probability of forming a massive star. In our sample, the probability is unity only for the IRDCs with mass . The statistics of the presence or not of massive YSOs in our sample of IRDCs allows us to generalize the K10 mass-size relation, by replacing the “constant” in Eq. 3 by :
| (4) |
where is the threshold surface gas density of IRDCs that have percentage probability of finding a massive YSO. We find that the K10 criterion refers to or . Our IRDCs have , .
4.2. Star formation efficiency in the IRDCs
The star formation activity in the IRDC sample can be measured through the star formation efficiency (SFE) and the star formation law. For IRDCs, the SFE is obtained using the simple expression, , where is the “stellar” mass obtained by adding the masses of the YSOs embedded in each IRDC and is the mass of the IRDC, obtained in §3. The masses of the YSOs were obtained from the R17 study. The SFE distribution (in percentage) for the IRDCs is shown in Figure 7 (solid histogram).


The IRDCs have SFE values between 0.01–30% with a median value of 1% (vertical dashed line), whereas the SFE values for IRDCs with HLYSOs (plotted with dashed line histogram) range from 0.5–16%, with similar median value as for the entire population. Thus, to form an intermediate to high mass star, the SFE of the IRDC should be higher than 0.5%. Below this efficiency IRDCs do not form HLYSOs.
Figure 8 shows the SFE as a function of IRDC mass. In this figure, the IRDCs harbouring massive stars are distinguished (solid circles) from the rest (open circles). Above 100 , IRDCs containing massive stars are the most efficient in every mass-range. At the same time, there is a systematic decrease in SFE as the cloud mass increases. Given the mass-radius relation (Figure 4), massive clouds are also larger. Hence, the most efficient HM star forming IRDCs are the most compact ones ( pc), whose mass happens to be 1000 in IRDC samples.
4.3. IRDCs and the formation of star clusters
The definition of star cluster varies widely and depends on our limited knoweledge to trace their members and their projected spatial distribution. From the literature, some definitions have physical motivation, while others are based on their data features. Lada & Lada (2003) define a star cluster as groups 35 YSOs with YSO surface densities () of 3 . In other hand, Carpenter (2000), using Ks band surface density maps identified clusters as regions with overdensities with . Megeath et al. (2012); Allen et al. (2007) used a similar criterion, but with threshold overdensity defined as .
Our IRDC sample have surface densities ranging from 0.1 to 100 , with a median value of 6 and one outlayer of 160 . Around 40% of our IRDCs can be considered as hosts of star clusters if we adopt 10 as the threshold surface density. If the IRDCs with HLYSOs are only considered, the surface density values vary from 0.1 to 40 , with a median of 2 , which curiously is lower than for our total IRDC sample. This trend can be explained as follow, IRDCs with HLYSOs have areas greater than (median value), as can seen in Figure 3 (right). These large clouds generally have longer distances. High values in these may be due to high numbers of HL and LLYSOs detected. Lower values may be due to few LLYSOs detected, as expected for clouds with far distances. For all IRDCs of the sample, the range of is greater and the median is higher, given the increment of the detection of YSOs in nearby clouds, in addtion to the fact that is possible to detect smaller IRDCs, achieving a most complete census of their stellar population.
Additionally, our IRDCs have a ranging from 200 to 400 , equivalent to 0.04 to 0.08 with a mean value of 0.07 . These values are one order of magnitude lower than HM threshold density given by Krumholz & Mckee (2008) of 1 , but similar to values founded by Kainulainen & Tan (2013) in IRDCs and Rathborne et al. (2009) for Galactic HMSF regions. Thus, our IRDCs could be considered potential sites to form star clusters.
4.4. Star formation law in the IRDCs
In order to study the surface density of the star formation rate () distribution as a function of gas surface density () in the IRDCs, first we obtained the using the stellar mass () of the YSOs embebded in the IRDC. The area used to compute the is obtained in §3. The and values for the IRDCs are shown in the Figure 9. In this figure, the open circles show all IRDCs, with those containing HLYSOs indicated by red circles. The IRDCs without YSO detection are plotted with the down-arrow symbols in the diagram. Our sample of IRDCs occupies a very small range of surface gas densities around a median 319 (vertical dashed line). Roughly, 92% of the IRDCs have values between 250 and 400 (vertical dotted lines). However, in this small range of , the values range over 4 orders of magnitudes ( to ). The lack of any - relation is in direct contrast with the well-known relation for star-forming clouds/galaxies established by Wu et al. (2005) (dotted line), and Kennicutt (1998) (solid line).
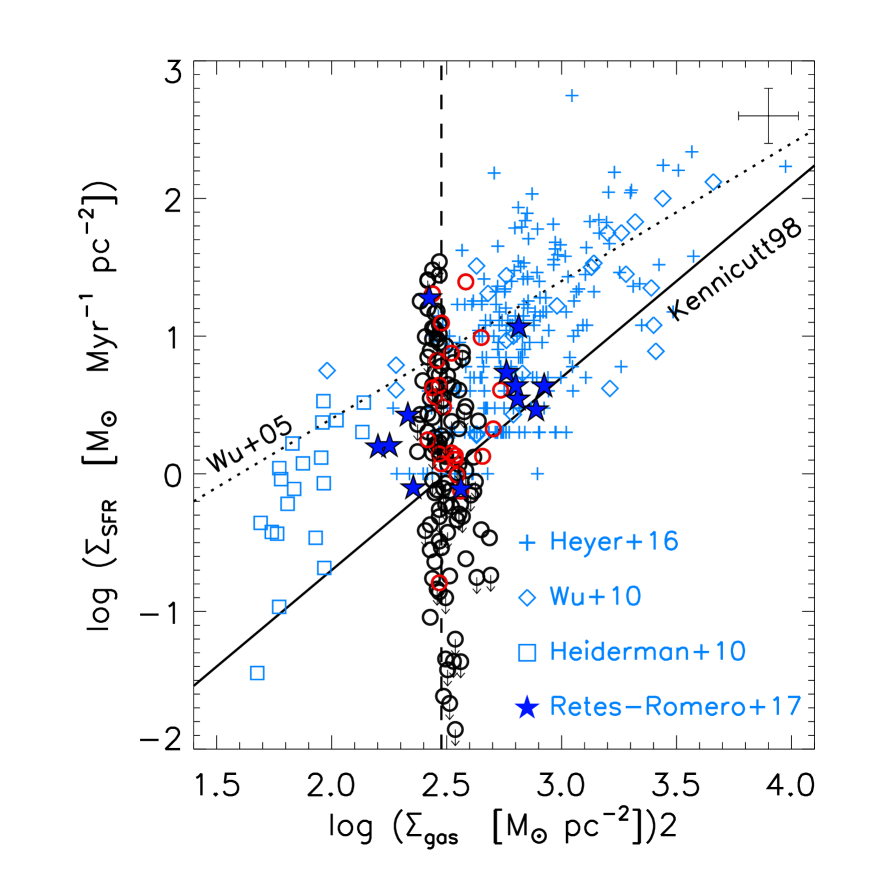
The large spread in is likely to be due to the following reasons. Those IRDCs with above the Wu et al. (2005) relation are likely to contain dense gas at small scales that is above the saturation limit at 8 m. Thus, the determined for these IRDCs is highly underestimated. On the other hand, IRDCs with below the Kennicutt (1998) relation could be far IRDCs with few locations having the gas surface density above the threshold density for star formation, as has been suggested in the literature (Retes-Romero et al., 2017; Heiderman et al., 2010). Additionally, these IRDCs may be in early star formation phase, associated to lower values from 0.02 to 5.0 , or/and their low mass YSO population don’t detected due to their large distances 3 kpc (ranging from 3.4 to 5.4 kpc).
The Figure 9 also shows the global and values for the molecular clouds that habour our sample of IRDCs, taken from R17. MCs cover a large range in , but a smaller range of . In this figure, we also show the - distribution for Galactic star-forming clumps. Almost all the clumps currently forming massive stars from Heyer et al. (2016); Wu et al. (2010) are denser than our IRDCs. However, our higher values are similar to the values for these clumps. Compared to nearby SF molecular clouds of Heiderman et al. (2010), our IRDCs have higher values by a factor 4, but with similar mean values of .
One of the characteristics of IRDCs is their small dynamic range in . This is likely to arising from the following two effects, the first one observational, derived from obtaining using Spitzer 8m data for the IRDCs. The use of the Galactic MIR background light to obtain is sensitive only for a small range of gas densities, then an agglomeration of values in a narrow dynamic range is expected, as was discussed earlier in section 3.0. The second reason is related to an intrinsic property. The fact that values to be clustered at 300 , may be due to the presence of an underlying mass-size relation , where L is the maximum linear dimension of the cloud, first proposed for molecular clouds by Larson (1981), and more recently revised by Lada et al. (2013). Indeed the mass-size relation described in S4.1 give us a relation for the IRDCs with a proportionality constant to be . Taking into account the above, both can origin the narrowing of the range, however the observational bias in the selection of the IRDCs is the most probable cause to produce the clustering of .
5. Conclusions
In this work, we studied the properties of IRDCs with and without massive YSOs, and
the relation between these properties and high-mass star formation.
The IRDCs were searched in molecular clouds harboring embedded
HM star formation activity. Physical and star formation properties of the IRDCs
are explored, focusing in the mass-size relation, HMSF threshold and the
star formation law. The main conclusions are summarized. In total,
we have found 835 YSOs in 128 IRDCs. From these, 108 are of intermediate-high mass,
representing the 13% of the stellar content embedded in the IRDCs.
-
•
Our sample of IRDCs have mean surface densities of 319 , mean mass of 1062 , and a mass function power-law with index , which are similar to the corresponding properties for the full sample of IRDCs. The index for the mass function is comparable to other studies in IRDCs and Galactic clumps with high mass star formation.
-
•
We find that a 33% of the IRDC sample contain at least one intermediate to massive YSO and satisfy the often-used mass-size criterion to forming massive stars. However, not all IRDCs satisfying the mass-size criterion contain massive stars. whilst that using the presence of HMYSOs in the IRDCs, its setting up a 20% probability for a mass-size relation containing HM young stars.
-
•
We find a clear tendency for more massive IRDCs to have a higher probability of containing a massive YSO. Twenty five (20%) of our IRDCs are potential sites to harbor stellar clusters with masses higher than 100 .
-
•
Our sample of IRDCs do not show a relation for the star formation law. This is understandable given the narrow range of gas surface densities of IRDCs.
References
- Allen et al. (2007) Allen, L., Megeath, S. T., Gutermuth, R. et al., 2007, Protostars and Planets V, B. Reipurth, D. Jewitt, and K. Keil (eds.), University of Arizona Press, Tucson, 951 pp., p.361-376
- Alves et al. (2007) Alves, J., Lombardi, M., & Lada, C. J., 2007, A&A, 462, 17
- André et al. (2010) André, Ph., Men’shchikov, A. & Bontemps, S., 2010, A&A, 518, 102
- Bastian et al. (2010) Bastian, N., Covey, K. R. & Meyer, M. R., 2010, ARA&A, 48, 339
- Beuther & Steinacker (2007) Beuther, H., & Steinacker, J. 2007, ApJ, 656, 85
- Beuther et al. (2007) Beuther, H., Churchwell, E. B., McKee, C. F., et al. 2007, Protostars and Planets V, Ed. B. Reipurth, D. Jewitt, & K. Keil (eds.), 165
- Bronfman et al. (1996) Bronfman, L., Nyman, L., May, J., 1996, A&A, 115, 81
- Butler & Tan (2012) Butler, M. J., & Tan, J. C. 2012, ApJ, 754, 5
- Carpenter (2000) Carpenter, J. M., 2000, AJ, 120, 3139
- Clemens (1985) Clemens, D. P., 1985, ApJ, 295, 422
- Egan et al. (1998) Egan, M. P., Shipman, R. F., Price, S. D., et al. 1998, ApJ, 494, 199
- Evans et al. (2009) Evans, N. J. II, Dunham, M. M. & Jorgensen, J. K. et al. 2009, ApJS, 181, 321
- Faúndez et al. (2004) Faúndez, S., Bronfman, L., Garay, G., et al. 2004, A&A, 426, 97
- Gómez González (2012) Gómez González, L., 2012, PhD thesis, University of Bonn
- Gutermuth et al. (2009) Gutermuth, R. A., Megeath, S. T., Myers, P. C. et al. 2009, ApJS, 184, 18
- Hartmann & Kenyon (1996) Hartmann, L. W. & Kenyon, S. J., 1996, ARA&A, 34, 207
- Heiderman et al. (2010) Heiderman, A., Evans, N. J. II, Allen, L. E. et al., 2010, ApJ, 723, 1019
- Henshaw et al. (2014) Henshaw, J. D., Caselli, P., Fontani, F., et al. 2014, MNRAS, 440, 2860
- Heyer et al. (2016) Heyer, M., Gutermuth, R., Urquhart, J. S., et al. 2016, A&A, 588, 29
- Hillenbrand (1997) Hillenbrand, L. A., 1997, AJ, 113, 1733
- Jackson et al. (2006) Jackson, J. M., Rathborne, J. M., Shah, R. Y. et al., 2006, ApJ, 163, 145
- Kainulainen & Tan (2013) Kainulainen, J., & Tan, J. C., 2013, A&A, 549, 53
- Kauffmann et al. (2010) Kauffmann, J., Pillai, T., Shetty, R. et al. 2010, ApJ, 716, 433
- Kauffmann & Pillai (2010) Kauffmann, J. & Pillai, T., 2010, ApJ, 723, 7
- Kennicutt (1998) Kennicutt, R. C., 1998, ApJ, 498, 541
- Knyves et al. (2010) Knyves, V., André, P., Men’shchikov, A., et al., 2010, A&A, 518, 106
- Kramer et al. (1998) Kramer, C., Stutzki, J., Rohrig, R., & Corneliussen, U. 1998, A&A, 329, 249
- Krumholz & Mckee (2008) Krumholz, M. R. & McKee, C. F., 2008, Nature, 451, 1082
- Lada & Lada (2003) Lada, C. J., Lada, E. A. 2003, ARA&A, 41, 57
- Lada et al. (2013) Lada, C. J., Lombardi, M., Román-Zúñiga, C., Forbrich, J., & Alves, J. F. 2013, ApJ, 778, 133
- Larson (1981) Larson, R. B., 1981, MNRAS, 194, 809
- Megeath et al. (2012) Megeath, S. T. Gutermuth, R. & Muzerolle, J. et al., 2012, AJ, 144, 192
- Ossenkopf & Henning (1994) Ossenkopft, V., & Henning, Th. 1994, A&A, 291, 943
- Perault et al. (1996) Perault, M., Omont, A., Simon, G. et al., 1996, A&A, 315, 165
- Peretto & Fuller (2009) Peretto, N., & Fuller, G. A. 2009, A&A, 505, 405
- Peretto & Fuller (2010) Peretto, N., & Fuller, G. A. 2010, ApJ, 723, 555
- Ragan et al. (2009) Ragan, S. E., Bergin, E. A., & Gutermuth, R. A. 2009, ApJ, 698, 324
- Ragan et al. (2013) Ragan, S. E., Henning, T. & Beuther, H., 2013, A&A, 559, 79
- Rathborne et al. (2006) Rathborne, J. M., Jackson, J. M., & Simon, R. 2006, ApJ, 641, 389
- Rathborne et al. (2009) Rathborne, J.M., Jackson, J.M., Simon, R. et al. 2009, Ap&SS, 324, 155
- Retes-Romero et al. (2017) Retes-Romero, R., Mayya, Y. D., Luna, A. & Carrasco, L., 2017, ApJ, 839, 113
- Roman-Duval et al. (2009) Roman-Duval, J., Jackson, J. M., Heyer, M. et al., 2009, ApJ, 699, 1153
- Simon et al. (2001) Simon, R., Jackson, J. M., Clemens, D. P., Bania, T. M., & Heyer, M. H. 2001, ApJ, 551, 747
- Simon et al. (2006) Simon, R., Rathborne, J. M., Shah , R. Y. et al., 2006, ApJ, 653, 1325
- Svoboda et al. (2016) Svoboda, B. E., Shirley, Y. L., Battersby, C., et al. 2016, ApJ, 822, 59
- Schisano et al. (2014) Schisano, E., Rygl, K. L. J., Molinari, S., et al. 2014, ApJ, 791, 27
- Tognelli et al. (2011) Tognelli, P., Prada Moroni, P. G., & Degl’Innocenti, S., 2011, A&A, 533, 109
- Wang et al. (2014) Wang, K., Zhang, Q., Testi, L., et al. 2014, MNRAS, 439, 3275
- Willis et al. (2015) Willis, S., Guzman, A., Marengo, M. et al. 2015, ApJ, 809, 87
- Wu et al. (2005) Wu, J., Evans, N. J., II, Gao, Y. et al., 2005, ApJ, 635, 173
- Wu et al. (2010) Wu, J., Evans, N, J., II, Shirley, Y. L. et al., 2010, ApJS, 188, 313