Improving Robustness using Joint Attention Network For Detecting Retinal Degeneration From Optical Coherence Tomography Images
Abstract
Noisy data and the similarity in the ocular appearances caused by different ophthalmic pathologies pose significant challenges for an automated expert system to accurately detect retinal diseases. In addition, the lack of knowledge transferability and the need for unreasonably large datasets limit clinical application of current machine learning systems. To increase robustness, a better understanding of how the retinal subspace deformations lead to various levels of disease severity needs to be utilized for prioritizing disease-specific model details. In this paper we propose the use of disease-specific feature representation as a novel architecture comprised of two joint networks – one for supervised encoding of disease model and the other for producing attention maps in an unsupervised manner to retain disease specific spatial information. Our experimental results on publicly available datasets show the proposed joint-network significantly improves the accuracy and robustness of state-of-the-art retinal disease classification networks on unseen datasets.
Index Terms— Retinal Degeneration, SD-OCT, Robust Convolutional Neural Networks, Attention Map
1 INTRODUCTION
Age-related neuroocular diseases cause irreversible vision loss in about 10% of the population in the United States and world-wide. It is estimated that blindness and vision loss increase threefold for each decade over 40 in developed countries. In particular, Age-related macular degeneration (AMD) affects over 8.7% of the population worldwide, and is among the leading causes of blindness [1]. Although, there have been notable advancements in the anti-angiogenesis therapy, providing patients with treatment options that can slow the progression of the disease [2], without early detection neuroocular diseases result in permanent vision loss.
Optical Coherence Tomography (OCT) is a technique used for imaging the retinal subspace and its different layer structures [3]. Using this technique, sub-retinal tissue formation is encoded and retrieved as data by using back-scattered light by spectral analysis [4]. OCT images are among tools used by ophthalmologists to diagnose a variety of age-related eye diseases. Due to human error and the lack of clinical consensus for certain eye disease criteria, mis-categorization is common. The major factor contributing to mis-categorization is the stark resemblance between AMD and other retinal degenerative neuroocular diseases [5]. For example, in chorodial neovascularization (CNV), the advance stage of AMD, new blood vessels sprouts up by breaking from the Bruch membrane into the sub–retinal pigment epithelium (sub-RPE) or sub-retinal space. Experts often find it troublesome to distinguish between the severity of AMD and CNV.
Machine learning and image processing techniques have been actively employed to develop expert systems for neurodegenerative ocular diseases to some degree of success. However, robustness and transferability of these procedures are still questionable. To address this problem, we propose a joint classification and segmentation architecture.
2 Related Work
To identify and predict retinal degenerative diseases simple yet rigorous image processing techniques were used by extracting features, contrast stretching, and thresholding [6]. One such approach for segmenting multiple retinal boundaries fuses recognition and delineation to detect degeneration, anomalies and diseases from cross sectional Retinal OCT images [7]. Similar techniques using global optimization methods such graph cuts and region based delineation are also developed to detect different anomalies and degeneration throughout the retina [8] and for diagnosing thickness of the chorodial maps and neovascularization [9, 10]. These early techniques achieved recall scores of around 80% for detecting Diabeitc Macular Edema (DME) [11, 12]. It has been suggested that expanding and enlarging layer density of retina is effective in identifying Diabetic Retinopathy (DR) [4]. Segmentation based approaches have been utilized for diagnosing underlying causes of liquid formation in the intra-retinal subspace by detecting abnormal retinal features and comparing the differences between healthy and the degenerated retinal tissue [13, 14, 15]. Although exploiting segmentation of retinal layers as an initial step to carry out identification of retinal degeneration has shown promise, this step results in severe inaccuracies when applied on OCT images in the wild - i.e., images acquired from different types of OCT systems [16].
Recently, architectures using convolutional neural networks (CNNs) have received the attention of the ophthalmology community, due to their achieving high degrees of precision in identifying different retinal degenerative diseases [17]. Fang et al. combined deep learning with graph search to automatically segment retinal layer boundaries and degeneration for patients having AMD[18], while Xu et al. developed a Dual-stage framework that exploits deep learning to segment pigment epithelium detachment [19]. Despite the use of large collection of images to learn, almost all deep learning architectures are notorious in lacking robustness to detect retinal degeneration in the wild. Therefore, an effective system capable of robustly retaining spatial information of different diseases for improving the detection accuracy in the wild is needed.
In this paper, we propose a novel joint-attention-network mechanism that can be attached to any classification architecture to improve its robustness and effectiveness for identifying retinal diseases in the wild. In order to accomplish this, we propose a novel dual adaptive loss that can be fine-tuned as a hyper-parameter to prioritize either of the loss values to further improve classification results from the spatial information identified by the attention network. Furthermore, the proposed work exploits both supervised and unsupervised learning by using the proposed dual loss for weight and gradient updates. Our experimental results provide evidence that the proposed joint-attention-network applied to a number of traditional architectures significantly improve the precision, recall, and accuracy of the architecture in the wild. This is clinically significant as ophthalmologists can add the proposed network to any CNN-based architecture trained on any dataset and utilize the overall network on their OCT images collected in their clinical practice without the need to retrain the network to avoid significant performance drops.
3 Methodology
The aim of recent CNN architectures for image classification, such as ResNet-50 [20], Xception [21], and MobileNet [22], is to increase accuracy while keeping the number of parameters low. Recent improvements on lowering the network parameters of these architectures have been proposed, including, Pre-activation [23], depth-wise convolution [24], and interspersed atrous separable convolution and regular convolution [25]. However, the robustness of these architectures to performing in the wild has not been fundamentally tackled. This is evident by the poor performance of these networks when presented by unseen data on which the network is not validated. The high dependency of supervised algorithms on training data leads to lower accuracy of the model in the wild. To address this problem we combine both supervised and unsupervised learning into a join network. The following section explains the architecture in detail.
3.1 Joint-network for Supervised and Unsupervised Learning
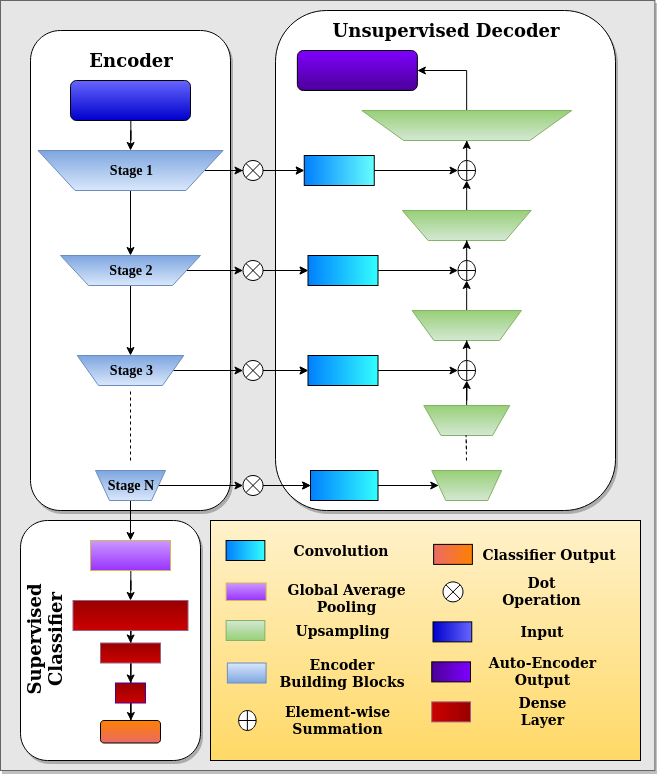
Fig. 1 shows the overall architecture of the proposed join-attention-network. Given any classification architecture comprised of an encoder pathway (top left in Fig. 1) and a supervised classifier module (bottom left in Fig. 1), we propose a decoder module (top right in Fig. 1) to be integrated with the architecture. The purpose of this module is to acts as an auto-encoder in order to generate attention maps in a latent space to preserve class-specific and domain-independent spatial information about the classification features throughout the network.
Because pooling and convolution layers in the supervised classifier pathway reduce the spatial resolution of feature maps prior to the fully connected (FC) layers, important spatial relations will be lost in the forward path of the encoder module of the network. The loss of this class-specific and domain-independent spatial salient information is an important contributing factor in low performance of the traditional encoder-based architectures in the wild.
The proposed decoder employs an unsupervised learning algorithm that is not presented with the ground truth or class labels of the training images. Salient information and spatial features are incorporated in the learning process by performing element-wise summation of the features from each stage of the encoder to the corresponding decoder stage. Eq. (1) shows the proposed element-wise operation:
| (1) |
where, are the output of each stages of the encoder, while symbolise the upsampling layers of the decoder. are the convolution operations and maintain the same depth as the output of the corresponding upsampling layer.
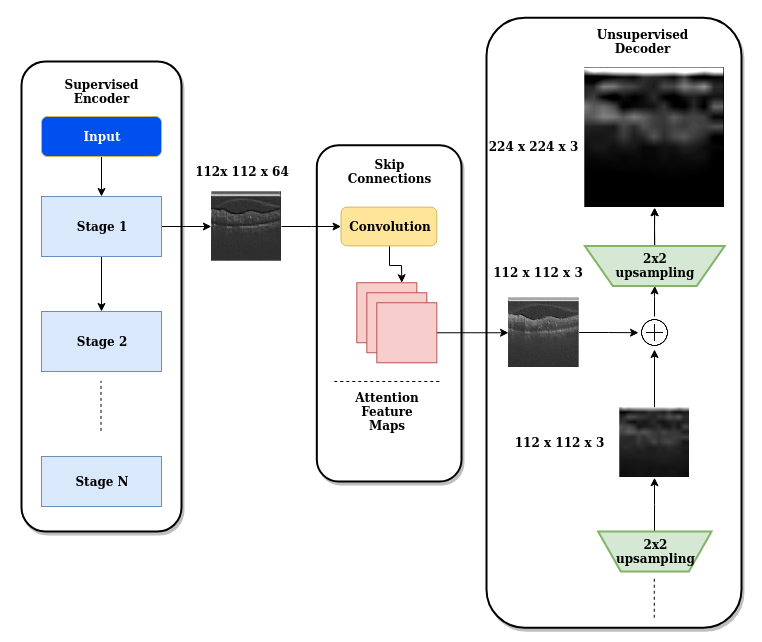
Given any classification architecture, such as ResNet-50 or Xception, Eq. (1) accounts for the variability of the number of stages to allow for appropriate element-wise operation. Fig. 2 shows the attention maps generated from these skip connections and the element-wise operation applied to the upsample layers. Spatial features important to different retina degenerations are amplified by fusing the spatial and depth information with output of the upsample layer. In order to retain this information, we back-propagate the loss for the unsupervised decoder and update gradients as a novel dual adaptive loss mechanism.
3.2 The Proposed Dual Adaptive Loss
The architecture exploits and incorporates two different loss schemes to make the learning robust and efficient. Categorical cross-entropy is used for the supervised classifier given by equation in Eq. (2). This loss function employs image labels . The second loss function employed in the unsupervised decoder pathway uses Mean-Squared Error (MSE) loss values given by the in Eq. (2), to calculate the difference of the input and reconstructed output.
| (2) |
In Equation. (2), signifies the true label or ground truth, symbolizes predicted output of the classifier, stands for the number of classes, is the input pixel value after normalization, is the reconstructed output, and is the number of pixels in the image.
For building the dual adaptive loss, we formulate an equation, given by Eq. (3), to adaptively interpolate between the supervised () and unsupervised () loss values. Here, is a user-specified hyper-parameter that can be tuned during training. The cumulative loss combines both and from equation (2), using a linear interpolation mechanism. The value of is between and . By default, and to evenly weight both the classifier and the unsupervised decoder output, we set to .
| (3) |
By leveraging this weighted loss, we can prioritize which intermediate loss has more importance to update the gradient throughout the architecture. Larger values result in more importance be given to the loss related to the supervised classifier, while smaller values will result in more importance on loss related to the unsupervised decoder. Therefore, the hyper-parameter needs to be tuned based on how much the intermediate losses are decreasing. If the error starts to increase we change the value to reverse its effect.
4 Experiments
4.1 Data-set and Preliminary Processing
Bench-marking for the proposed architecture was done on two separate data-sets, Srinivasan2014 [3] and OCT2017 [26]. The Srinivasan2014 dataset contains 3,231 images out of which 2,916 are use for training and 5-fold cross-validation and 315 are used for testing. The model with the best results for the test cases of the Srinivasan2014 data-set is used for further testing on the unseen second data-set, i.e., OCT2017. The OCT2017 consists of four distinct classes we take 250 cases of AMD and DME (in total 500 samples) for testing. We resize all samples for training and testing to resolution to adhere to the Srinivasan2014 dataset format.
Architectures Accuracy Specificity Sensitivity ResNet50-v1 [20] 94.92 97.46 94.92 MobileNet-v2 [22] 97.46 98.73 97.46 OpticNet-71 [25] 100 100 100 Joint-Attention-Network ResNet50-v1 100 5.08 100 2.54 100 5.08 Joint-Attention-Network MobileNet-v2 99.36 7.46 99.68 0.95 99.36 1.9 Joint-Attention-Network OpticNet-71 99.68 0.32 99.84 0.16 99.68 0.32
Architectures Accuracy Specificity Sensitivity ResNet50-v1 [20] 83.40 11.52 89.40 8.06 83.40 11.52 MobileNet-v2 [22] 93.80 3.66 96.70 2.03 93.80 3.66 OpticNet-71 [25] 74.40 25.60 85.60 14.40 74.40 25.60 Joint-Attention-Network ResNet50-v1 92.40 9.0 95.00 5.6 92.40 9.0 Joint-Attention-Network MobileNet-v2 95.60 1.8 97.1 0.4 95.60 1.8 Joint-Attention-Network OpticNet-71 77.40 3.0 89.00 3.4 77.40 3.0
4.2 Performance Metrics
For evaluation, we used three standard metrics on both the data-sets: Accuracy, Sensitivity and Specificity. Both True Positive Rate (TPR) and True Negative Rate (TNR) are reported for Srinivasan2014 and OCT2017 data-sets. Performance metrics are, Accuracy , Sensitivity , and Specificity .
4.3 Training and Validation
We worked with three different architectures to test and validate our results across two distinct data-set. First, we trained on the Srinivasan2014 data-set with the original version of ResNet50-V1 [20], MobileNet-V2 [22], and OpticNet-71 [25], using 5-fold cross validation. After choosing the best model we tested on the samples unseen by the architecture from a different dataset, i.e. OCT2017, consisting of 315 images. Next, we trained the Joint-Attention-Network of these three architectures on the Srinivasan2014 samples and further tested on test-cases from both datasets. Table 1 reports all the results in terms of three metrics: Accuracy, Specificity and Sensitivity. Among the aforementioned methods in Table 1 only supervised classifier was used for training and testing. While for Joint-Attention-Network both the supervised classifier and unsupervised decoder were used. The unsupervised decoder used reconstructed output to compare with the input to calculate the loss hence not requiring any supervision or label annotation for training.
In Table 2, we extensively compare our three Joint-attention-network architectures with their original counterparts when tested on the OCT2017 data-set. It should be noted that the OCT2017 or any of its samples were not used for training or validation. We tested on 250 cases of AMD and 250 cases of DME images from this data-set. Joint-Attention-Network outperformed the original architectures and improved accuracy, precision, and recall in all cases. Henceforth, it is evident that the proposed attention module is universally more robust across all scenario and setting.
4.4 Hyper-parameter Tuning
For training Joint-Attention-Network we used Adam optimizer for both the supervised classifier and unsupervised decoder, with the initial learning rate set to . We used an adaptive learning scheme of updating the weights if the validation loss doesn’t decrease for four consecutive epochs. The learning rate would change according to the equation , where . Mini-batch size of and training was done for 30 epochs.
5 Conclusions and Future Work
In this paper, we propose a joint attention network that combines both supervised and unsupervised learning to make classification of retinal degeneration more robust and effective in the wild. Moreover, by incorporating the dual adaptive loss, our architecture addresses the issue of retaining spatial information throughout the network and updates the weights and the gradients accordingly. In future, we wish to extend our current research by improving the overall architecture and establishing a more robust weight updating mechanism. Finally, we hope that more salient features and oddities can be identified through this architecture, so that it can be used by clinicians for complex differential diagnosis.
References
- [1] Wan Wong, Xinyi Su, Xiang Li, Chui Cheung, Ronald Klein, Ching-Yu Cheng, and Tien Wong, “Global prevalence of age-related macular degeneration and disease burden projection for 2020 and 2040: a systematic review and meta-analysis,” The Lancet Global Health, vol. 2, no. 2, pp. e106–e116, 2014.
- [2] Laurence S Lim, Paul Mitchell, Johanna M Seddon, Frank G Holz, and Tien Y Wong, “Age-related macular degeneration,” The Lancet, vol. 379, no. 9827, pp. 1728–1738, 2012.
- [3] Pratul P Srinivasan, Leo A Kim, Priyatham S Mettu, Scott W Cousins, Grant M Comer, Joseph A Izatt, and Sina Farsiu, “Fully automated detection of diabetic macular edema and dry age-related macular degeneration from optical coherence tomography images,” Biomed optics express, vol. 5, no. 10, pp. 3568–3577, 2014.
- [4] Khaled Alsaih, Guillaume Lemaitre, Mojdeh Rastgoo, Joan Massich, Désiré Sidibé, and Fabrice Meriaudeau, “Machine learning techniques for diabetic macular edema (dme) classification on sd-oct images,” Biomed Eng Online, vol. 16, no. 1, pp. 68, 2017.
- [5] Joanne WY Yau, Sophie L Rogers, Ryo Kawasaki, Ecosse L Lamoureux, Jonathan W Kowalski, Toke Bek, Shih-Jen Chen, Jacqueline M Dekker, Astrid Fletcher, Jakob Grauslund, et al., “Global prevalence and major risk factors of diabetic retinopathy,” Diabetes care, vol. 35, no. 3, pp. 556–564, 2012.
- [6] Ahmadreza Baghaie, Zeyun Yu, and Roshan M D’Souza, “State-of-the-art in retinal optical coherence tomography image analysis,” Quantitative imaging in medicine and surgery, vol. 5, no. 4, pp. 603, 2015.
- [7] Cabrera DeBuc, “A review of algorithms for segmentation of retinal image data using optical coherence tomography,” Image Seg, vol. 1, pp. 15–54, 2011.
- [8] KA Vermeer, J Van derSchoot, HG Lemij, and JF DeBoer, “Automated segmentation by pixel classification of retinal layers in ophthalmic oct images,” Biomed optics express, vol. 2, no. 6, pp. 1743–1756, 2011.
- [9] David Alonso-Caneiro, Scott A Read, and Michael J Collins, “Automatic segmentation of choroidal thickness in optical coherence tomography,” Biomed optics express, vol. 4, no. 12, pp. 2795–2812, 2013.
- [10] Ana-Maria Philip, Bianca S Gerendas, Li Zhang, Henrik Faatz, Dominika Podkowinski, Hrvoje Bogunovic, Michael D Abramoff, Michael Hagmann, Roland Leitner, Christian Simader, et al., “Choroidal thickness maps from spectral domain and swept source optical coherence tomography: algorithmic versus ground truth annotation,” British Journal of Ophthalmology, vol. 100, no. 10, pp. 1372–1376, 2016.
- [11] Clara I Sánchez, R Hornero, Maria I Lopez, and J Poza, “Retinal image analysis to detect and quantify lesions associated with diabetic retinopathy,” in The 26th Annual International Conference of the IEEE Engineering in Medicine and Biology Society. IEEE, 2004, vol. 1, pp. 1624–1627.
- [12] Bernhard M Ege, Ole K Hejlesen, Ole V Larsen, Karina Møller, Barry Jennings, David Kerr, and David A Cavan, “Screening for diabetic retinopathy using computer based image analysis and statistical classification,” Computer methods and programs in biomedicine, vol. 62, no. 3, pp. 165–175, 2000.
- [13] Xinjian Chen MeindertNiemeijer, Li Zhang Kyungmoo Lee, Michael D Abràmoff, and Milan Sonka, “3d segmentation of fluid-associated abnormalities in retinal oct: Probability constrained graph-search-graph-cut,” IEEE Transactions on Medical Imaging, vol. 31, no. 8, pp. 1521–1531, 2012.
- [14] Gwénolé Quellec, Kyungmoo Lee, Martin Dolejsi, Mona K Garvin, Michael D Abramoff, and Milan Sonka, “Three-dimensional analysis of retinal layer texture: identification of fluid-filled regions in sd-oct of the macula,” IEEE transactions on medical imaging, vol. 29, no. 6, pp. 1321–1330, 2010.
- [15] Kyungmoo Lee, Meindert Niemeijer, Mona K Garvin, Young H Kwon, Milan Sonka, and Michael D Abramoff, “Segmentation of the optic disc in 3-d oct scans of the optic nerve head,” IEEE transactions on medical imaging, vol. 29, no. 1, pp. 159–168, 2010.
- [16] Raheleh Kafieh, Hossein Rabbani, and Saeed Kermani, “A review of algorithms for segmentation of optical coherence tomography from retina,” Journal of medical signals and sensors, vol. 3, no. 1, pp. 45, 2013.
- [17] Cecilia S Lee, Doug M Baughman, and Aaron Y Lee, “Deep learning is effective for classifying normal versus age-related macular degeneration oct images,” Ophthalmology Retina, vol. 1, no. 4, pp. 322–327, 2017.
- [18] Leyuan Fang, David Cunefare, Chong Wang, Robyn H Guymer, Shutao Li, and Sina Farsiu, “Automatic segmentation of nine retinal layer boundaries in oct images of non-exudative amd patients using deep learning and graph search,” Biomed optics express, vol. 8, no. 5, pp. 2732–2744, 2017.
- [19] Yupeng Xu, Ke Yan, Jinman Kim, Xiuying Wang, Changyang Li, Li Su, Suqin Yu, Xun Xu, and Dagan David Feng, “Dual-stage deep learning framework for pigment epithelium detachment segmentation in polypoidal choroidal vasculopathy,” Biomed optics express, vol. 8, no. 9, pp. 4061–4076, 2017.
- [20] Kaiming He, Xiangyu Zhang, Shaoqing Ren, and Jian Sun, “Deep residual learning for image recognition,” in Proceedings of the IEEE conference on computer vision and pattern recognition, 2016, pp. 770–778.
- [21] François Chollet, “Xception: Deep learning with depthwise separable convolutions,” in Proceedings of the IEEE conference on computer vision and pattern recognition, 2017, pp. 1251–1258.
- [22] Mark Sandler, Andrew Howard, Menglong Zhu, Andrey Zhmoginov, and Liang-Chieh Chen, “Mobilenetv2: Inverted residuals and linear bottlenecks,” in Proceedings of the IEEE Conference on Computer Vision and Pattern Recognition, 2018, pp. 4510–4520.
- [23] Kaiming He, Xiangyu Zhang, Shaoqing Ren, and Jian Sun, “Identity mappings in deep residual networks,” in European conference on computer vision. Springer, 2016, pp. 630–645.
- [24] Lukasz Kaiser, Aidan N Gomez, and Francois Chollet, “Depthwise separable convolutions for neural machine translation,” arXiv preprint arXiv:1706.03059, 2017.
- [25] Sharif Amit Kamran, Sourajit Saha, Ali Shihab Sabbir, and Alireza Tavakkoli, “Optic-net: A novel convolutional neural network for diagnosis of retinal diseases from optical tomography images,” arXiv preprint arXiv:1910.05672, 2019.
- [26] Daniel S Kermany and et al., “Identifying medical diagnoses and treatable diseases by image-based deep learning,” Cell, vol. 172, no. 5, pp. 1122–1131, 2018.