Parity in Planck full-mission CMB temperature maps
Abstract
In the standard model of cosmology, Cosmic Microwave Background (CMB) sky is expected to show no symmetry preferences. Following our previous studies, we explore the presence of any particular parity preference in the latest full-mission CMB temperature maps from ESA’s Planck probe. Specifically, in this work, we will probe (a)symmetry in power between even and odd multipoles of CMB via it’s angular power spectrum from Planck 2015 data. Further we also assess any specific preference for mirror parity (a)symmetry, by analysing the power contained in =even or odd mode combinations.
1 Department of Physics, Utkal University, Bhubaneswar-751004, Odisha, India
2 Department of Physics, IIT(BHU), Varanasi-221005, Uttar Pradesh, India
3 School of Physics, Gangadhar Meher University, Sambalpur-768004, Odisha, India
4 Department of Physics, Khallikote (Autonomous) College, Berhampur University, Berhampur-760001, Odisha, India
1 Introduction
Isotropy of the universe via the Cosmological principle is one of the foundational assumptions of modern cosmology. CMB ushered in the precision era in cosmology. Consequently it facilitated tests of this otherwise simplifying assumption of isotropy of cosmos. Multiple studies of CMB data in that direction indicated instances of isotropy violation. These were also further validated by the WMAP and Planck CMB collaborations. See Ref. [1, 2, 3, 4] and also the references therein.
In this article, we study the anomalous odd power excess in CMB angular power spectrum, which corresponds to an odd inversion parity preference in the data [5, 6, 7, 8]. CMB anisotropies are conventionally expanded in terms of spherical harmonics as
| (1) |
where are the fluctuations in CMB temperature anisotropies around the mean sky temperature () and further removing the dipole () that is induced due to our relative motion through CMB rest frame. And are the coefficients of expansion in the spherical harmonic basis, . Under inversion, i.e., , the spherical harmonic coefficients transform as . Correspondingly the maps
| (2) |
contain only the even/odd modes respectively. Thus, mean power proportional to in some chosen multipole range can be decomposed as , where ( to ) is the angular power spectrum of CMB anisotropies, and is the power in even/odd multipoles respectively. Excess power in either of these modes will lead to an inversion parity symmetry/asymmetry preference in the data which is not expected in the standard cosmological model. This inversion (a)symmetry of CMB temperature anisotropies was first tested in Ref. [5] using NASA’s WMAP one year data. It was further studied in Ref. [6, 7, 8] using later data releases from WMAP observations. With new data from a different full-sky mission namely the ESA’s PLANCK probe, this anomaly was still found to persist. Planck collaboration analysed this phenomenon, among others, to find that its significance varied from 0.002 - 0.004 in the 2013 nominal data and 0.002 - 0.003 in the 2015 full-mission data depending on the CMB signal extraction method and galactic masks used [3, 4].
Alternatively it can be shown that the point parity asymmetry is related to antipodal correlations of CMB sky [9]. The two-point correlation function is defined as
| (3) |
where and . Taking corresponding to correlation between anti-podal points we get,
where and is the corresponding power in even/odd only multipoles up to some chosen maximum multipole. Here are the usual Legendre polynomials. The odd parity preference i.e., the excess power in odd multipoles compared to even multipoles in the data is also evident by the negative correlation seen in the data in the two-point correlation function, , for (see for example Fig. 2 (top left) in Ref.[4]).
Directional dependence of this even-odd multipole power asymmetry was explored in Ref. [9]. It was found that the minimum parity asymmetry i.e., maximum discrepancy in power between even and odd multipoles, was found in the CMB kinetic dipole direction i.e., (). A possible relation between this parity asymmetry in power and other large angular scale CMB anomalies or features were explored in Ref. [9, 10, 11].
Further, in the present paper, we also report on any presence of mirror parity (a)symmetry preference in the data. Presence of any mirror parity preference in CMB data were earlier pursued in Ref. [12, 14, 13], and their possible correlation with CMB large angle anomalies or features were explored in Ref. [15, 16]. Mirror parity was also studied by Planck collaboration in Ref. [3, 4]. Since mirror (a)symmetry is a statistic defined with respect to the co-ordinate system used, and we study the CMB maps, which are provided in Galactic co-ordinates, our results pertain to this choice of the co-ordinate system.
In Ref. [17], collective alignments among even/odd-only multipoles were studied. Those authors found that the alignments among even and odd only multipoles span two distinct, non-overlapping regions of the sky that contain previously known preferred axes corresponding to even/odd parity (a)symmetry or phenomena such as the axis of maximum mirror parity (a)symmetry, minimum of the even-odd multipole power asymmetry, hemispherical power asymmetry, and anisotropy axes of modes.
2 Statistics and Data used
Here we briefly describe the statistics, also the data sets and simulation ensemble used in the present study. The statistics described here will be applied to probe even-odd multipole power (a)symmetry preference and mirror parity properties of multipoles in the range in Planck full-mission CMB temperature maps i.e., the first 100 cosmological multipoles.
2.1 Point parity statistic
We employ the statistics previously defined in Ref. [6, 8], to probe the even-odd multipole power asymmetry.
In Ref. [6], the power in even multipoles compared to odd multipoles were analysed by computing the mean power in even and odd multipoles separately up to a chosen maximum multipole, , as
| (5) |
Here , and represents the mean power in even or odd only multipoles up to a chosen multipole ‘’. Also we take . A statistic is then defined by taking their ratio as
| (6) |
Following Ref. [8], we also use the statistic which is defined as the average ratio of the power in adjacent even over odd multlipoles up to that chosen maximum multipole. It is given by
| (7) |
where is the maximum odd multipole up to which the statistic is computed, which will ensure that there are equal number of even and odd multipoles in the multipole range used to compute the statistic. Evidently the summation is taken over only the odd multipoles and the multipole range involved in this computation is .
2.2 Mirror parity statistic
Mirror parity corresponds to reflection (a)symmetry with respect to a chosen plane. Just as even or odd ‘’ modes have point parity (a)symmetry properties, modes with even or odd ‘’ combinations correspond to mirror reflection (a)symmetry with respect to the equatorial plane of the chosen co-ordinate system in which the CMB map is represented.
The mirror (a)symmetry was studied first in Ref. [12] using WMAP one year data. The statistic defined there was adapted and further extended in Ref. [13], to find significant odd mirror parity preference in WMAP’s seven year data. Independently, this (a)symmetry was also probed in Ref. [14] to again find a significant odd mirror parity preference. The same was assessed using Planck data and an odd mirror parity was found to be present in it as well [3, 4].
The mirror parity statistics used in the present work are summarized below :
| (8) | |||||
where denotes the mean power in even or odd spherical harmonic coefficients for the combination =even/odd respectively. The and statistics separately probe excess/deficit of power in even/odd modes of a particular ‘’ in the data with respect to expected power in standard concordance model. and probe the ratio of and difference between the power in even mirror parity modes compared to odd mirror parity modes, respectively. All these statistics reveal in various ways how the power is distributed between even and odd mirror parity modes. Here is the fiducial power spectrum based on best fit CDM cosmological parameters from Planck 2015 data.
One can also define these mirror statistics with respect to the power seen in a particular realization in a multipole i.e., using instead of . In that case will be the only statistic that can be defined independently. The other statistics can be defined in terms of as and . The statistic will remain unaltered, and hence no new information will be furnished by it when we replace by . In this work, however, we will not pursue this.
2.3 Data
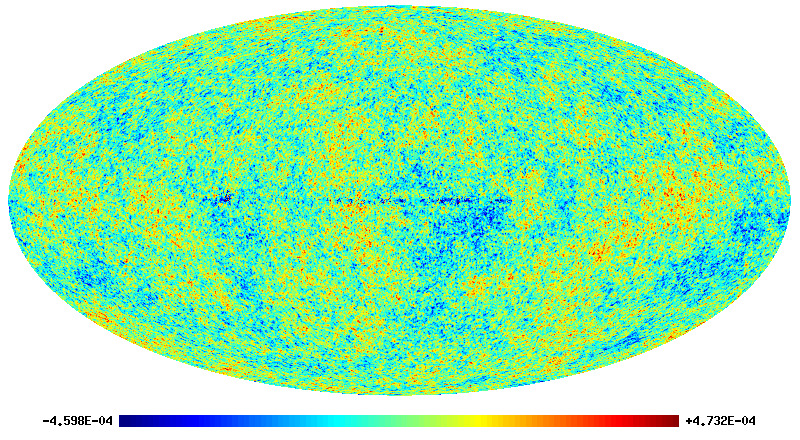
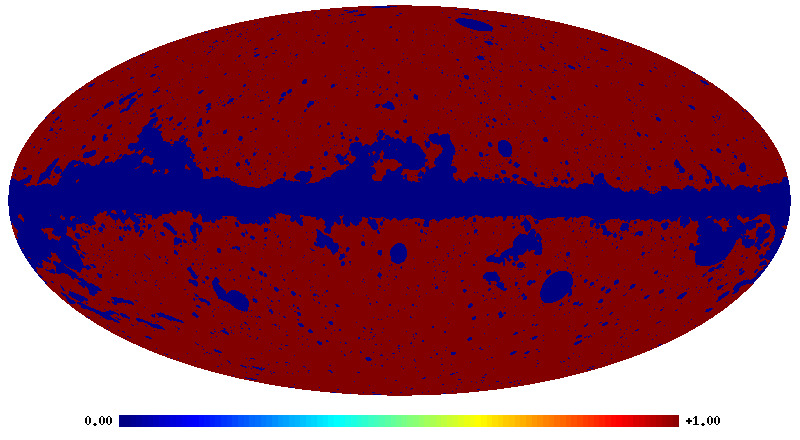
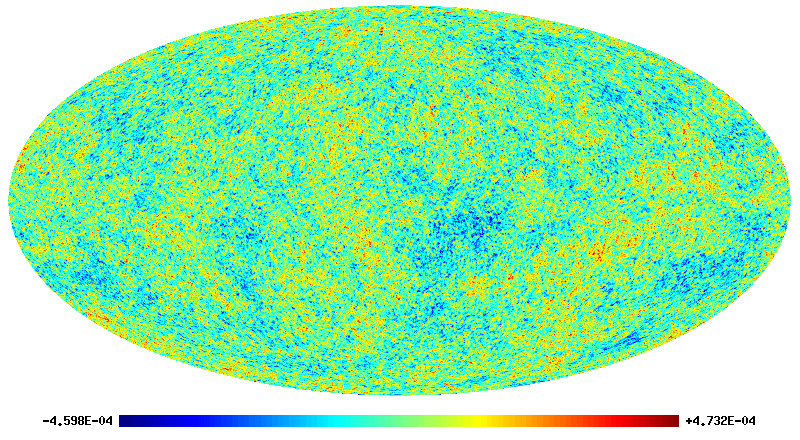


For the current study, we use the CMB data from Planck 2015 public release. Specifically we use the SMICA 2015 CMB map. The SMICA map as provided by the Planck 2015 Collaboration is shown in top panel of Fig. [1]. It is available at an , where is the HEALPix111https://healpix.jpl.nasa.gov/ map resolution parameter. Although one employs a cleaning procedure to recover the pristine cosmic signal of our interest i.e., CMB from the raw satellite data, there is still non-negligible contamination present in the recovered CMB map particularly in the galactic plane owing to strong foreground signal. Thus a portion of the recovered CMB sky is omitted i.e., masked, before undertaking any cosmological analysis, which can potentially bias our inferences.
In this work we use two masks viz., the UT78 common analysis mask and the SMICA mask. The UT78 mask is the most conservative mask to omit foreground residuals. Planck collaboration employed four different cleaning methods to recover cosmic CMB signal [18]. UT78 mask can be used with any of the four CMB maps thus derived using those four cleaning procedures. As the name suggests, it has a usable sky fraction (usually referred to as ) of approximately , and is the union of all the galactic masks specific to each component separation method. In addition, we also use the SMICA mask - specific to SMICA CMB recovery procedure - which defines the region of its efficiency in reducing foregrounds. Although it is sufficient to use SMICA mask, we use these two masks to compare the effect of various levels of galactic cut on our statistics, employed to study the power and mirror parity (a)symmetry in the present work. The UT78 and SMICA masks are shown in middle left and bottom left panels of Fig. [1].
To study the mirror parity (a)symmetry, we need the individual spherical harmonic coefficients (’s) of full-sky CMB map to compute power in any set of =even or odd modes separately. Thus we apply an inpainting method, which can be thought of as a interpolation on the sphere, on the data map to recover full-sky CMB map from a partial sky, left after masking for omitting foreground residuals. The ’s are thus extracted from the inpainted/pseudo full-sky SMICA CMB map, and tested for even/odd/no mirror parity preference in the data. Since inpainting takes a lot of time ( 180 minutes with a machine using Intel CORE M Processor, 4 CPUs (2 Threads per core) and 4 GB of RAM) to fill an map, and further since we are also only interested in studying the low multipole regime , we only apply inpainting on the data maps. These masked, inpainted maps are used to assess point parity preferences in the data i.e., we use obtained from these inpainted (pseudo) full-sky CMB maps. The inpainted SMICA CMB map as masked and inpainted using the two masks - UT78 and SMICA mask - are shown in middle right and bottom right panels of Fig. [1], respectively. We use the freely available iSAP222http://www.cosmostat.org/software/isap. The default options were used. software package to inpaint masked SMCIA CMB map.
The significance of our parity statistics is estimated by comparing the data estimated values (both cleaned map as provided and the two inpainted SMICA maps) with 1000 mock CMB maps added with appropriate noise. The random CMB realizations were generated as follows :
-
•
We first generate the best-fitting theoretical angular power spectrum () using Planck 2015 best-fit cosmological parameters [19] as input to CAMB software333https://camb.info/.
-
•
Using these theoretical , we generated 1000 random CMB realizations with a beam resolution of a Gaussian beam of (arcmin).
-
•
Each of these CMB maps are then added with 1000 SMICA-like noise realization obtained from Planck public release 2444http://crd.lbl.gov/cmb-data.
The significance of parity statistics defined in Eq. [6], [7] and [8] are estimated by comparing the data statistics with 1000 simulations generated as mentioned above. We compare the cleaned SMICA map as provided by the Planck team, and also after inpainting with the two masks. Thus we have three sets of values for each statistic from data, to compare with simulations.
3 Results
3.1 Power parity and it’s statistical significance
As mentioned before, we have three sets of data values for each statistic as obtained from the CMB map as is provided, inpainted SMICA map using the UT78 common mask, and finally the inpainted SMICA map obtained using the SMICA mask, both generated at .
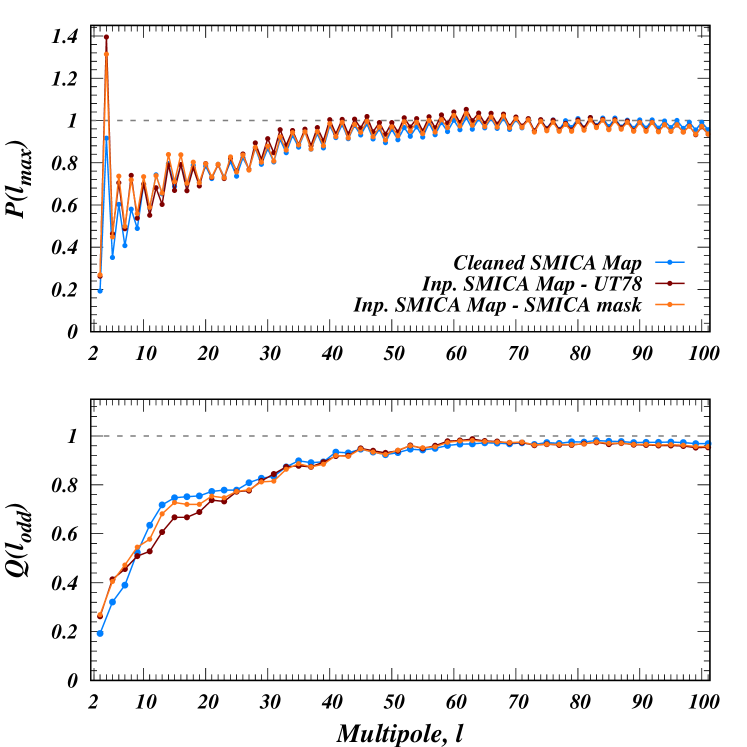
The parity statistic values from data, using and as defined in Eq. [6] and [7] are shown in top and bottom panels of Fig. [2], respectively. Note that the obtained from data are deconvolved with appropriate beam and pixel window functions in harmonic space, before computing the statistics. One can readily notice that, there is excess power in odd multipoles compared to even multipoles as both the statistics are in the range of multipoles we studied. This is also consistent with previous findings in Ref. [5, 6, 7, 8]. The three set of statistic values for each kind of data map generated as mentioned earlier, are displayed in each panel in different colours.
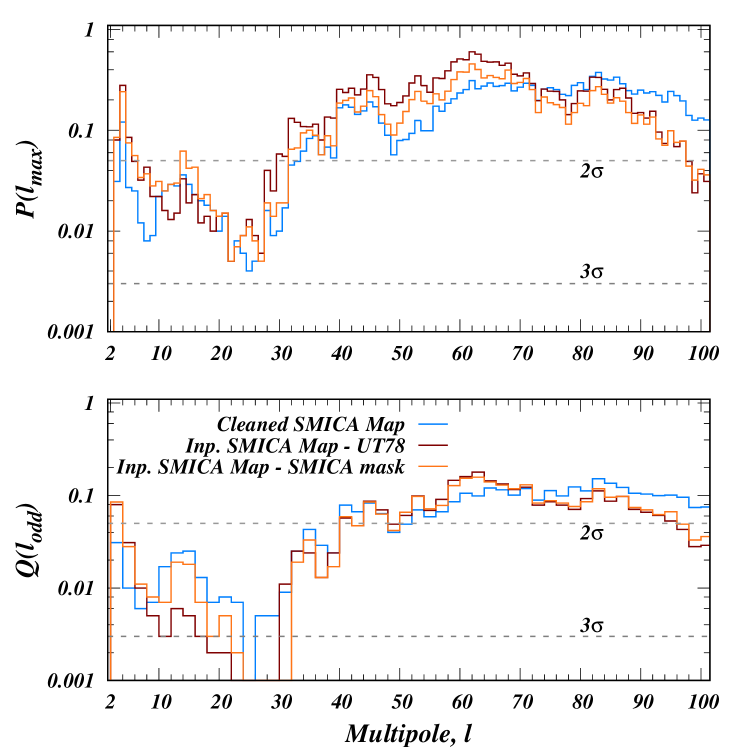
In order to compare the data statistic values, we compute the same quantities from our simulation ensemble of 1000 SMICA-like maps, in the same way as the data statistic values are obtained. The corresponding significances or -values are shown in Fig. [3]. The top panel of Fig. [3] corresponds to significances for the statistic , and bottom panel of the same figure corresponds to significances for the statistic . Again the significances corresponding to the three types of data maps generated for this study, are shown in the same way as Fig. [2].
These significance plots reveal that the -values found here are similar to those reported previously in Ref. [8]. The pattern and level of significance of excess power in odd multipoles compared to even multipoles for any of the statistics used, are almost the same as before. The significances of both and statistics reach a maximum at around or . However the statistic shows an almost significance compared to statistic which reveals only a discrepancy in the data at this maximum multipole . Further the statistic continues to have significances with probability up to , and beyond that. These trends are again similar to our findings in Ref. [8].
We also note that the three statistic values corresponding to the three types of data created for our study from PR2, have a similar level of significances. Furthermore, we used the more conservative UT78 mask as well as the SMICA CMB map specific component separation mask. This gives confidence to our study that the significances found here cannot be attributed to foreground residuals. The cumulative statistic values at low multipoles are low, that can be arising due to large cosmic variance resulting in wider excursion of statistics’ values.
The -values shown in Fig. [3] that lie below are those for which none of the corresponding statistic values computed from simulations are smaller than the data statistic value. So their -value should be treated as ‘ in ’ and not ‘’. Note that since both the statistics are symmetry based, they are as blind or a priori as one chooses to refer them to be.
3.2 Mirror parity and its statistical significance
The mirror parity (a)symmetry statistics as defined in Eq. [8] are coordinate dependent. In our analysis, we use the ’s from Planck CMB temperature maps in the same co-ordinate system as provided. Thus our probes of preference or no preference for mirror (a)symmetry from the significances eventually found, are specific to that coordinate system.
Under the assumption of isotropy of the standard cosmological model, the power distribution between even and odd modes should be same i.e., their ratio should be or difference should be . This assumption of isotropy further implies that the distribution of power between even and odd mirror parity modes should be statistically the same in any co-ordinate system we choose to represent the CMB maps. In the present work, we confine ourselves to the analysis of maps as provided in the galactic coordinate system. From the assumption of statistical isotropy, , and are expected to vary about , and about .
Thus large deviations about (or depending on the statistic) would then suggest a deviation from isotropy. How much ever the deviation, large or small, the statistic values may seem to be from ‘’ (or ), their significances have to be computed using appropriately generated corresponding simulations.
The mirror statistics’ values as found for the SMCIA 2015 CMB map are shown in Fig. [4]. All the three types of data viz., the cleaned SMICA map as provided, SMICA map inpainted using both the UT78 mask and SMICA component specific mask are shown in green, red and blue colours respectively. One can see that any of the statistics as defined in Eq. [8] has values fluctuating around the expected theoretical value that is shown by a horizontal gray solid line.
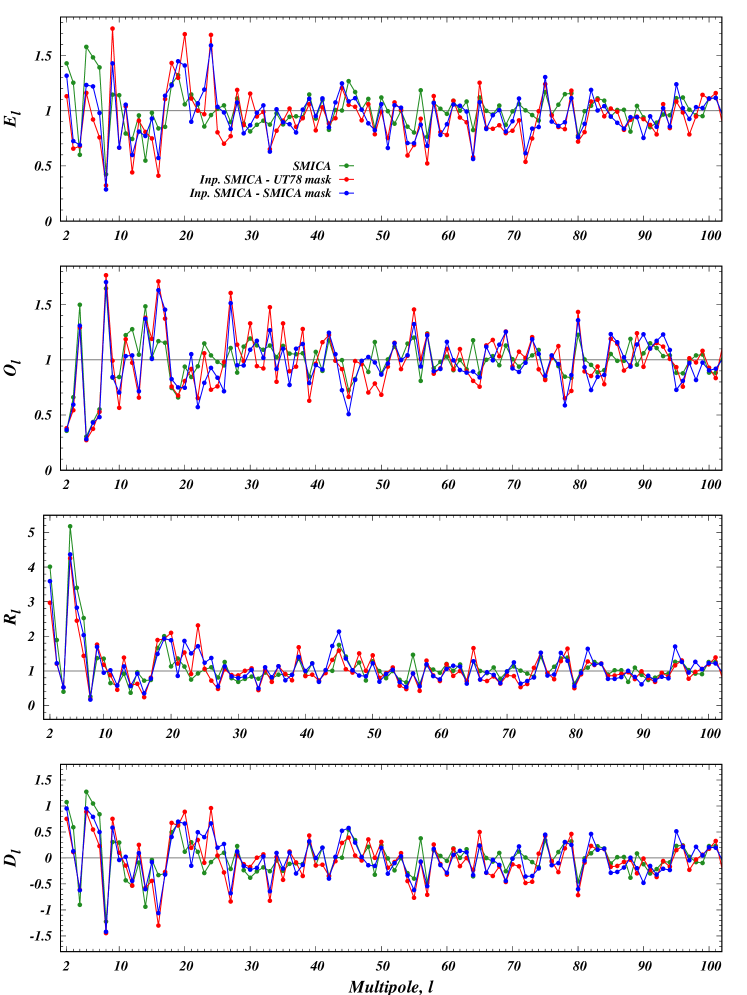
The significance of various Mirror parity statistics are calculated by comparing with 1000 simulated SMICA-like CMB maps. The observed significances are shown in Fig. [5] for each of the statistics , , and in first, second, third and fourth panels from the top respectively. Except for few multipoles, no significant mirror parity preference was found in the data with any of the statistics we used, in the range that we studied. We recall that these maps are in galactic coordinates, and the mirror parity statistics we used (as defined in Eq. [8]) are coordinate dependent. So these results are specific to that coordinate system.
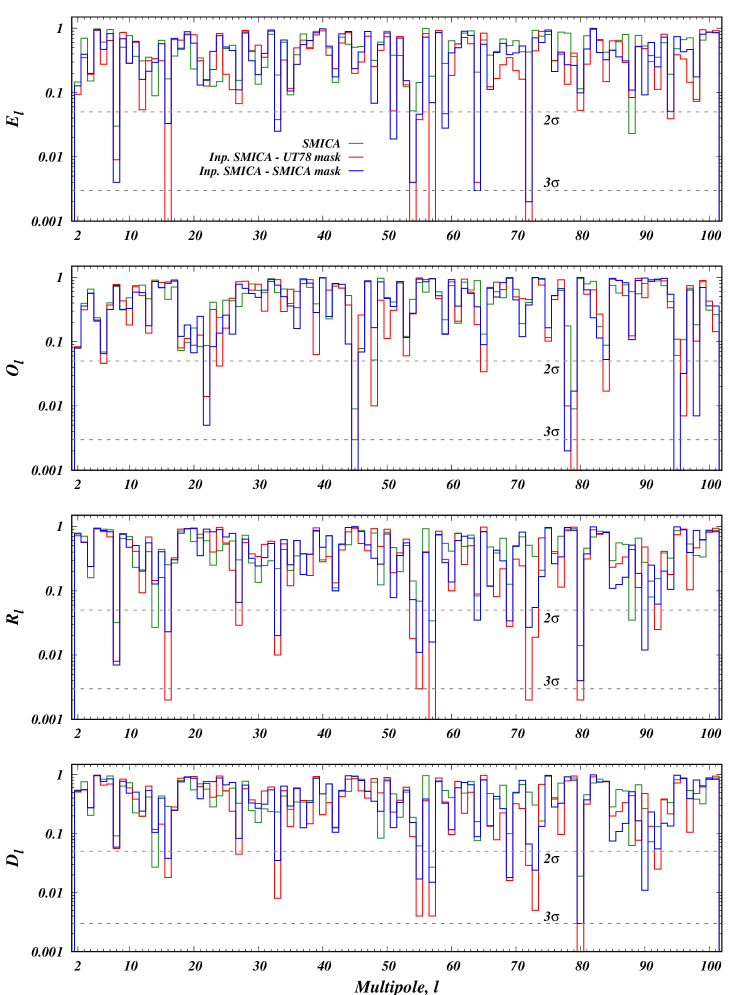
The fundamental assumption of the current standard model of cosmology, the Cosmological Principle, specifically isotropy, implies that there should not be any preference for mirror (a)symmetry independent of the coordinate system in which a CMB map is represented. However, in a given realization there will always be an axis along which more power is distributed in even or odd ‘’ modes. This observed level of discrepancy has to be compared with simulations. Indeed it was found that there is an anomalous odd mirror parity preference in the data with respect to the direction [13, 14] in the WMAP data at a significance of . It was also found to be anomalous in the Planck data as well, in almost the same direction with a significance of . We explore this anomalous nature of odd mirror parity preference in the data and its direction further lateron.
4 Conclusions
In this paper, we revisited our previous work [8] on the anomalous power excess in odd over even multipoles in WMAP data. Using two different statistics as before, we studied the CMB signal as recovered from Planck full-mission data, specifically using the SMICA CMB map. We also analysed the data for any mirror parity (a)symmetry preference in the CMB sky.
Our analysis was performed on the SMICA map as is provided in Galactic coordinates. Further, to understand the effect of foreground residuals vis-a-vis galactic cuts on our results, we also made use of pseudo full-sky SMICA maps obtained by inpainting using iSAP software, after masking with UT78 common mask and the component separation specific SMICA temperature mask at map. Mock CMB realizations numbering 1000 were generated with a resolution of Gaussian beam of (arcmin). Then, these maps were added with FFP8.1 SMICA noise maps that are made publicly available through Planck PR2.
The objective of our present work was to probe point and mirror parity (a)symmetry preferences or consistency with standard model expectations in the latest CMB data from Planck. Appropriate statistics were used to probe any presence of these (a)symmetries. The data is expected to show no preference for odd over even point or mirror parity and vice versa.
An odd point parity preference i.e., more power in odd multipoles compared to even multipoles, is found to persist even in the Planck full-mission data. Both the statistics, defined in Eq. [6] and [7], become maximally anomalous for the multipole range . The statistic values and their significances show the same pattern and level as found previously in Ref. [8] using WMAP data.
We then studied the full-mission SMICA CMB temperature map for the presence of any mirror parity preferences in the data using the statistics defined in Eq. [8]. Since these are coordinate dependent quantities, our results pertain to the CMB data represented in Galactic coordinates, as provided by Planck collaboration. We find no significant even or odd mirror parity preferences in the data at any multipole ‘’ except for few random modes. Thus with respect to the galactic plane, the SMICA CMB map from Planck PR2 doesn’t display any significant mirror parity (a)symmetry. In the future we plan to pursue the frame dependence of mirror parity in more detail.
Acknowledgements
Some of the results in the current work were derived using the publicly available HEALPix package [20]. We also acknowledge the use of CAMB555https://camb.info/, a freely available Boltzmann solver for CMB anisotropies. Part of the results presented here are based on observations obtained with Planck666https://www.cosmos.esa.int/web/planck, an ESA science mission with instruments and contributions directly funded by ESA Member States, NASA, and Canada. This work also made use of iSAP software [21]. SP acknowledges DST-INPIRE for financial support under the research grant DST/INSPIRE/03/2014/004358, and PKS acknowledges Utkal University for financial support under university seed research grant.
References
- [1] Bennett C. L., et.al., 2011, ApJS, 192, 17
- [2] Bennett C. L., et.al., 2013, ApJS, 208, 20
- [3] Planck Collaboration : Planck 2013 results. XXIII., Ade P. A. R., et.al., 2014, A & A, 571, A23
- [4] Planck Collaboration : Planck 2015 results. XVI., Ade P. A. R., et.al., 2016, A & A, 594, A16
- [5] Land K., and Magueijo J., 2005, Phys. Rev D, 72, 101302
- [6] Kim J., and Naselsky P., 2010, ApJL, 714, L265
- [7] Gruppuso A., et.al., 2011, MNRAS, 411, 1445
- [8] Aluri P. K., and Jain P., 2012, MNRAS, 419, 3378
- [9] Naselsky P., Zhao W., Kim J., and Chen S., 2012, ApJ, 749, 31
- [10] Kim J., and Naselsky P., 2011, ApJ, 739, 79
- [11] Gruppuso A., et.al., 2018, Physics of the Dark Universe, 20, 49
- [12] de Oliveira-Costa A, Tegmark M., Zaldarriaga M., and Hamilton A., 2004, Phys. Rev. D, 69, 063516
- [13] Finelli F., Gruppuso A., Paci F., and Starobinsky A. A., 2012, JCAP, 07, 049
- [14] Ben-David A., Kovetz E. D., and Itzhaki N., 2012, ApJ, 748, 39
- [15] Naselsky P., Hansen M., and Kim J., 2011, JCAP, 09, 012
- [16] Rassat A., Starck J. -L., Paykari P., Sureau F., and Bobin J., 2014, JCAP, 08, 006
- [17] Aluri P. K., Ralston J. P., and Weltman A., 2017, MNRAS, 472, 2410
- [18] Planck Collaboration : Planck 2015 results. IX., Adam R., et.al., 2016, A & A, 594, A9
- [19] Planck Collaboration : Planck 2015 results. XIII., Ade P. A. R., et.al., 2016, A & A, 594, A13
- [20] Gorski K. M., et.al., 2005, ApJ, 622, 759
- [21] Starck, J. -L.; Fadili, M. J.; Rassat, A., 2013, A & A, 550, A15