Experimental study of the reaction at –2.7 MeV
Abstract
Our understanding of the low-lying resonance structure in 12C remains incomplete. We have used the reaction at proton energies of –2.7 MeV as a selective probe of the excitation region above the threshold in 12C. Transitions to individual levels in 12C were identified by measuring the 3 final state with a compact array of charged-particle detectors. Previously identified transitions to narrow levels were confirmed and new transitions to broader levels were observed for the first time. Here, we report cross sections, deduce partial -decay widths and discuss the relative importance of direct and resonant capture mechanisms.
keywords:
12C , cross section , –2.7 MeV , decay , breakup , electromagnetic transition strengths1 Introduction
The reaction has been extensively used to study the excitation structure of the 12C nucleus. This includes measurement of proton widths , the partial widths and to the two lowest levels in 12C, and the partial widths and to the two lowest levels in 8Be [1, 2, 3]. The focus of the present work are the two isospin resonances occurring at proton energies of MeV and MeV which correspond to the levels and .111Throughout this paper the notation is used to denote excited nuclear levels, being the excitation energy in MeV and the spin and parity. The decay of these levels to lower-lying, unbound levels in 12C was studied by Hanna et al. [4] who identified two rather strong transitions feeding two narrow levels above the threshold: and .
Using the conventional approach of detecting the transitions with a large scintillator, Hanna et al. could not have identified weak transitions or transitions to broad levels. Recently, such transitions have been studied using a technique where the final level is identified by measuring the momenta of the three particles resulting from its breakup [5, 6, 7]. Here we wish to explore, first, if transitions from the levels and to broad, lower-lying levels similar to those observed in Ref. [7] can be identified, and second, if the strength of the transitions already observed by Hanna et al. can be confirmed with this indirect detection method.
2 Experiment
The experiment was performed at the 5 MV Van der Graaf accelerator at the Department of Physics and Astronomy at Aarhus University. The proton beam was directed on the target using electrostatic deflection plates and a magnetic bending stage. The beam size was defined by two variable apertures placed after the magnet both set at a separation of 2 mm and placed 0.5 m apart.
The ion energy was adjusted by means of a generating voltmeter, which was calibrated on an absolute scale using the and reactions. The energy spread of the beam was less than 1 keV. Beam intensities of several 100 nA can be delivered by the accelerator, but only beams of less than 1 nA were used for the experiment discussed here. The beam current was measured by a Faraday cup placed in a 1 m long beam pipe downstream of the target chamber, specially designed to reduce the amount of beam back-scattered from the Faraday cup to the detector setup.
Long measurements were performed at proton energies of MeV and MeV. At the lower energy, a total of 295 C was directed on the target over a period of 211 hours, which corresponds to an average current of 0.39 nA. For the higher energy setting, the corresponding numbers are 124 C, 77 hours, and 0.45 nA. Additionally, multiple, short measurements were performed across the energy range 0.5–3.5 MeV as reported in Ref. [8].
The target consisted of a layer of 12.6(1.2) g/cm2 isotope-enriched 11B deposited on a 4 g/cm2 carbon backing [8]. The target was manufactured from 99% enriched by slow evaporation in a Cu crucible. In addition to B, C, and Cu, the target was found to contain H and O impurities, likely due to condensation of water vapor. The presence of these impurities was inferred from the corresponding Rutherford scattering peaks in the singles spectra. Considering the known target constituents, the only open three-body channels at the beam energies used in this study are and .
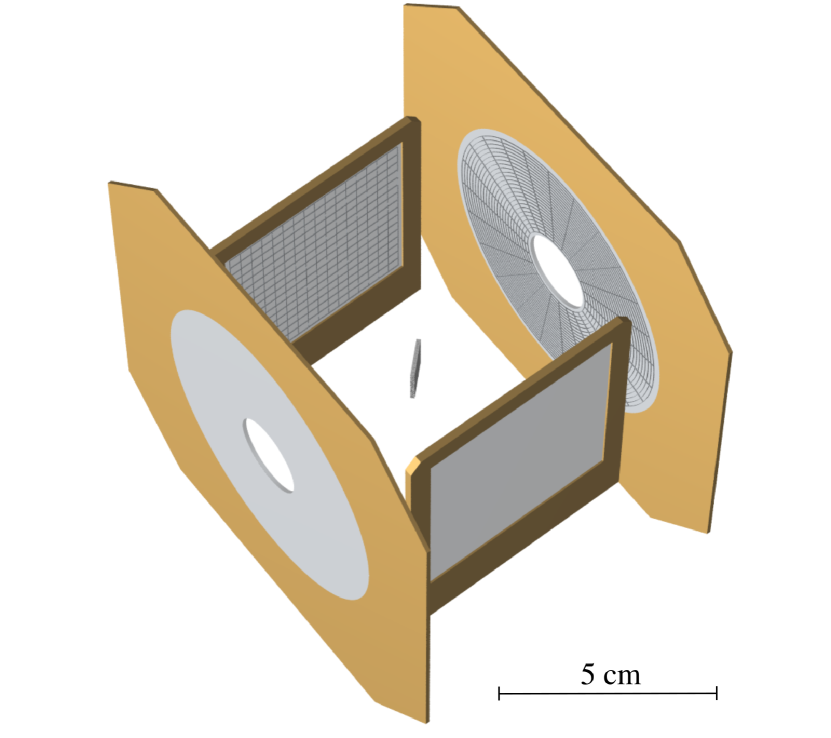
The target was placed in the middle of a compact array of double sided Si strip detectors (DSSDs) at an angle of 45∘ with respect to the axis defined by the beam, as shown in Fig. 1. Annular DSSDs with 24 ring strips and 32 annular strips were placed upstream and downstream of the target, and two square DSSDs with 16 horizontal strips and 16 vertical strips were placed on either side of the target orthogonal to the beam axis.
The electronics and data acquisition consisted of a VME based system with ADCs and TDCs fed by signals from a chain of preamplifiers and amplifiers. The dead time was around 10% with trigger rates of several kHz.
3 Event selection
The data is analyzed following an approach similar to that of Laursen et al. [7]. Particle energies and hit positions on the DSSDs are determined by requiring an energy difference of at most keV in front and back strips. Energy conservation cannot be used as a condition to reduce unwanted background because we are searching for events where some of the energy is carried away by a ray. However, the momentum carried away by the ray is sufficiently small that we can require momentum conservation of the three particles. Hence, events are identified as triple coincidence events fulfilling both a TDC cut of ns and momentum conservation, but not necessarily energy conservation.
Figures 2 and 3 show scatter plots of the total momentum in the centre of mass (c.m.) frame versus the 12C excitation energy calculated from the triple-coincidence events.
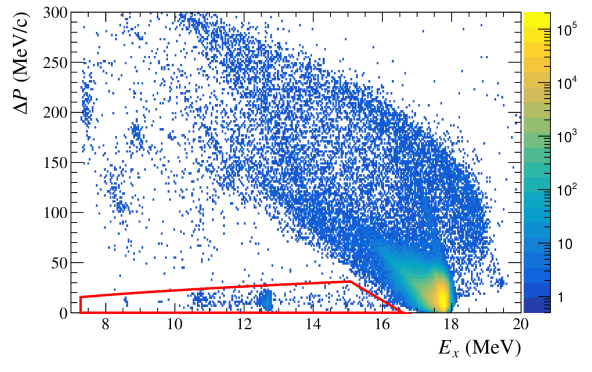
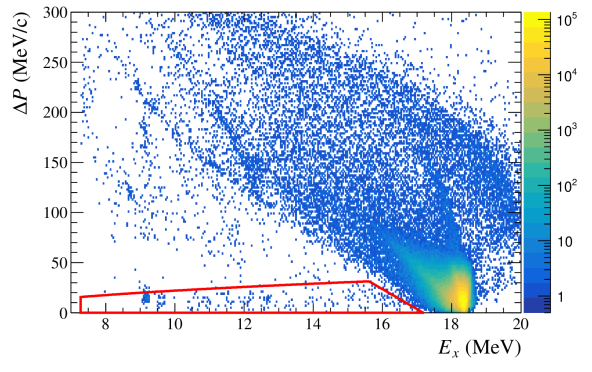
The intense groups of events just below and just above MeV in the two figures correspond to 3 decays directly from the levels and , respectively. These events fulfill both energy and momentum conservation. The events further to the left from these intense regions, enclosed by the red contours, are interpreted as events where some of the energy is carried away by a ray, and they are therefore the events of interest.
To assert that these events are in fact genuine triple- coincidences as opposed to, say, two particles in coincidence with a noise signal, the following checks were made: First, the energy distribution of the individual detections was inspected to ensure that the energies were comfortably above the ADC thresholds. Second, the spatial distribution of the detections across the surface of the DSSDs was inspected to verify that the events were not caused by a single or a few noisy strips. Third, the effect on the event rate of widening the TDC cut was studied. For genuine coincidences one expects the event rate to plateau once the width the TDC cut exceeds the experimental resolution, whereas for random coincidences one expects the event rate to continue increasing.
Looking at Figures 2 and 3 one notes the occurrence of a number of clusters of events at low excitation energy (–9 MeV) which exhibit a considerable momentum mismatch (–250 MeV/c). Each of these clusters was subject to a careful analysis, which revealed all but one of the clusters to be comprised of random coincidences, in most cases involving B coincidences or coincidences due to elastic scattering on H impurities in the target. A dedicated analysis followed to clarify the origin of the single cluster that could not be attributed to random coincidences. This cluster was found to be comprised of coicidences in which one of the protons, having penetrated into the active volume of one of the DSSDs, is backscattered into a second DSSD, thus producing two separate detections with a combined energy close to the original proton energy. Having identified and B coincidences as significant sources of background, dedicated kinematic cuts were implemented to selectively remove such events. As a result, the event density within the clusters was substantially reduced and some clusters were fully removed, leaving only the few clusters visible in Figures 2 and 3.
Figures 4 and 5 focus specifically on those events fulfilling momentum conservation, but not energy conservation. The upper panels show scatter plots of the excitation energy in 12C versus the individual energies of the three -particles in the 12C rest frame. These scatter plots show the different breakup mechanisms of the levels in 12C populated in the decays. The diagonal lines from the lower left to the upper right represent breakups that proceed by decay to the ground state of 8Be. Owing to parity and angular momentum conservation this decay mechanism is only allowed for natural-parity levels in 12C. The two particles from the subsequent breakup of 8Be, detected in coincidence with the primary particle, form a broad band running from left to right with half the slope of the upper diagonal. The positions of known levels in 12C are indicated on the scatter plots.
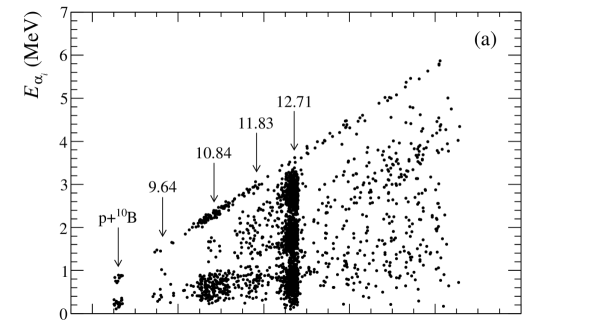
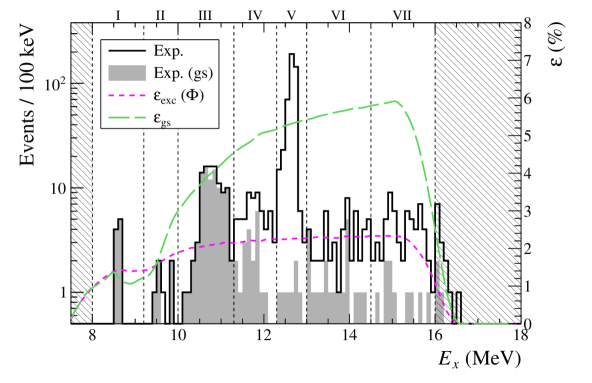
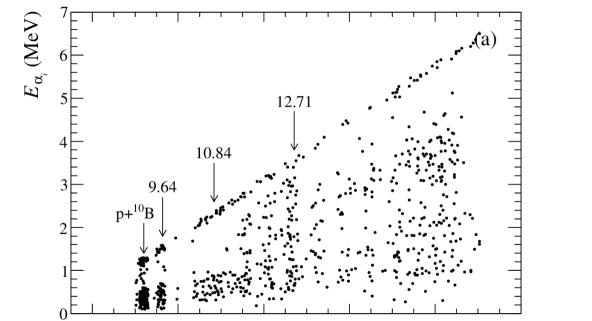
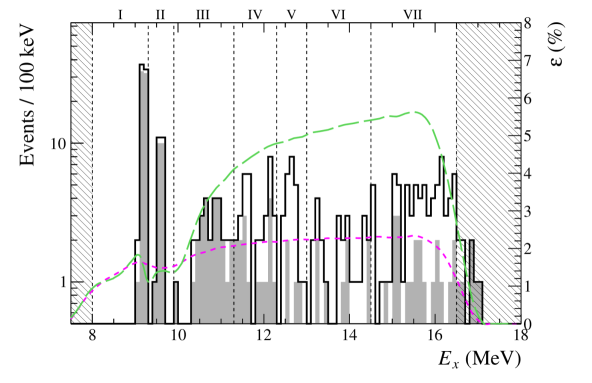
The lower panels of Figures 4 and 5 show the projections of the scatter plots on the excitation energy axes with the shaded histograms providing the projection selectively for the events on the diagonals, which fulfill the condition keV for at least one pair of particles, being the relative kinetic energy of the pair. The coloured curves on these plots will be discussed later. From the trigger rate and the width of the TDC gate we estimate the number of random coincidences to be 6 events in Figure 4 and 9 events in Figure 5.
4 Cross sections
We determine the capture cross section, , from the number of observed events in each excitation energy bin, taking into account the triple- detection efficiency, the target thickness, the integrated charge on the target, and the dead-time of the data acquisition system. The cross sections thus obtained at MeV and MeV are summarized in Table 1 and 2, respectively.
| Bin | (MeV) | (b) | |||
|---|---|---|---|---|---|
| gs | exc | tot | Ref. [4] | ||
| II | 9.2–10.0 | 0.005–0.11 | |||
| III | 10.0–11.3 | ||||
| IV | 11.3–12.3 | ||||
| V | 12.3–13.0 | ||||
| VI | 13.0–14.5 | ||||
| VII | 14.5–16.0 | ||||
| Bin | (MeV) | (b) | |||
|---|---|---|---|---|---|
| gs | exc | tot | Ref. [4] | ||
| II | 9.3–9.9 | 0.08–0.5 | |||
| III | 9.9–11.3 | 0.06–0.4 | |||
| IV | 11.3–12.3 | ||||
| V | 12.3–13.0 | ||||
| VI | 13.0–14.5 | ||||
| VII | 14.5–16.5 | ||||
The detection efficiency depends on the 3 breakup mechanism and differs significantly between breakups that do and do not proceed via the ground state (g.s.) of 8Be. The green and magenta (short- and long-dashed) curves in the lower panels of Figures 4 and 5 show the detection efficiencies determined from Monte-Carlo simulations. For the excited channel, phase-space () simulations were used to estimate the detection efficiency in all excitation energy bins, except the bins containing the and levels where more accurate models [10] were used. The error resulting from adopting the phase-space approximation is estimated to be at most %, which we include as an additional uncertainy on the detection efficiency for those energy bins where phase-space simulations were used. For the other bins, and for the g.s. channel where the angular distributions of Ref. [8] were used, we adopt a 5% model uncertainty.
We note that the ratio of triple-coincidence events to single events predicted by the simulation for the g.s. channel is 15% below the experimental ratio. We ascribe this to inaccuracies in the representation of the beam-target-detector geometry in the simulation and account for it by including an additional 15% uncertainty on our efficiency estimate. We find the detection efficiency to be insensitive to uncertainties in the ADC thresholds, except for the lowest excitation energy bin ( MeV) where ADC thresholds contribute an estimated 8% to the overall uncertainty. These uncertainty contributions are all added up in quadrature, and finally added linearly with the statistical counting uncertainty to obtain the overall uncertainty on the cross section in each excitation energy bin.
5 Deduced -ray widths
The excitation functions of the rays to the and levels have been measured in considerable detail in the energy range – MeV by Hanna et al. [4] by means of conventional -ray spectroscopy. Both excitation functions were found to be resonant, allowing the authors to attribute the rays to the transitions and , respectively. One drawback of the indirect experimental approach adopted in the present work, which involves detecting the three particles rather than the ray, is the reduced event rate compared to conventional -ray spectroscopy. Therefore, excitation functions could not be obtained in a reasonable amount of time and measurements were limited to a few selected beam energies. In the absence of excitation functions to support a resonant interpretation of the measured cross sections, we rely on the findings of Hanna et al. [4] concerning the resonant character of the rays to the and levels, as well as theoretical estimates of the direct-capture cross section, to justify a resonant interpretation of the new rays observed in this work. The theoretical estimates of direct-capture cross section will be discussed next.
5.1 Direct capture
For the purpose of estimating the (E1) direct-capture capture cross section, we adopt the model of Rolfs [11] which approximates the many-nucleon problem by a two-body problem in which the projectile and target are treated as inert cores and their interaction is described by a square-well potential with the depth adjusted to reproduce the binding energy of the final state. This simple model was found to yield accurate results for the capture reaction to the two bound levels in 17F, which both are well described by a simple, single-particle configurations involving only a single orbital [11].
Here, we apply the model to capture transitions to levels in 12C which are not well described by single-particle configurations and also are unbound with respect to decay to the final state. Therefore, we do not expect the model to be very accurate and will use its predictions merely as order-of-magnitude estimates, accurate only within a factor of 2–3 or so.
Estimates of the direct capture-cross section to four known levels in 12C computed with the model of Rolfs using the parameters listed in Table 3, are shown in Fig. 6. The computed cross sections are proportional to the assumed spectroscopic factor, which is not predicted by the model itself. For the level we take the spectroscopic factor from Ref. [12]. For the remaining levels we use the average values of the spectroscopic factors compiled in Ref. [13], noting that there is a substantial spread () in the spectroscopic factors obtained by different authors. In all cases, we assume a single-orbital configuration, with for the level and for the remaining levels. The channel radius was taken to be 4.38 fm.
| (MeV) | ||||
|---|---|---|---|---|
| 9.64 | 1,3 | 2 | 0.30 | |
| 10.84 | 1,3 | 2 | 0.23 | |
| 11.83 | 1,3 | 2 | 0.11 | |
| 12.71 | 0,2 | 1 | 0.86 |
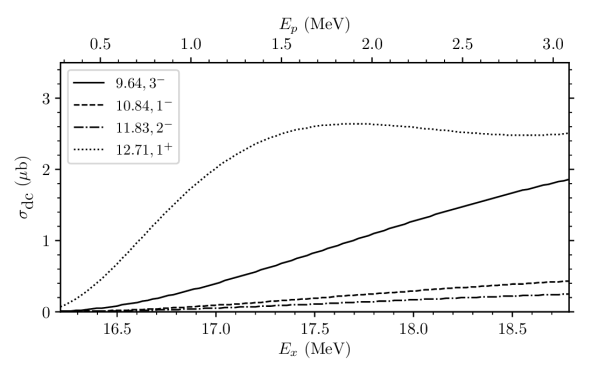
The excitation functions measured by Hanna et al. [4] (at 90∘) indicate that direct capture contributes at most to the total capture cross section to the level at MeV, corresponding to 1.4 b, which is within a factor of two of the cross section predicted by the model (2.6 b). Similarly, the direct-capture contribution to the cross section to the level can be estimated to be at most of the total capture cross section at 2.64 MeV, corresponding to 0.4 b, a factor of four below the model prediction (1.6 b). Thus, we conclude that our rather crude model provides reasonable estimates of the direct-capture cross section, with a tendency to overestimate the actual cross section by a factor of two to four. Comparing the predicted direct-capture cross sections (Fig. 6) to the measured total capture cross sections (Tables 1 and 2), we conclude that resonant capture is likely to be the dominant mechanism in most energy bins, but with a substantial contribution from direct capture.
5.2 Resonant capture
The goal of the analysis is to calculate the partial widths of the levels in 12C mediating the observed (resonant) capture transitions. For this we use the resonant cross section formula,
| (1) |
where is the spin statistical factor appropriate for B. Using this equation the partial decay widths can be determined from the measured cross sections, provided the partial proton decay widths () and the total widths () are known.
In Table 4, we list known levels in the excitation region – MeV, which can mediate resonant captures to lower-lying levels at the beam energies investigated in this work. The levels and their properties are obtained from the most recent TUNL compilation [13] with a few exceptions, as discussed below. Fig. 7 gives a schematic representation of the levels listed in Table 4. The quantity , shown on the abscissa, is calculated from the expression,
| (2) |
where the resonance shape is approximated as a Breit-Wigner distribution multiplied by the penetrability for the lowest possible relative orbital angular momentum,
| (3) |
We note that on resonance, .
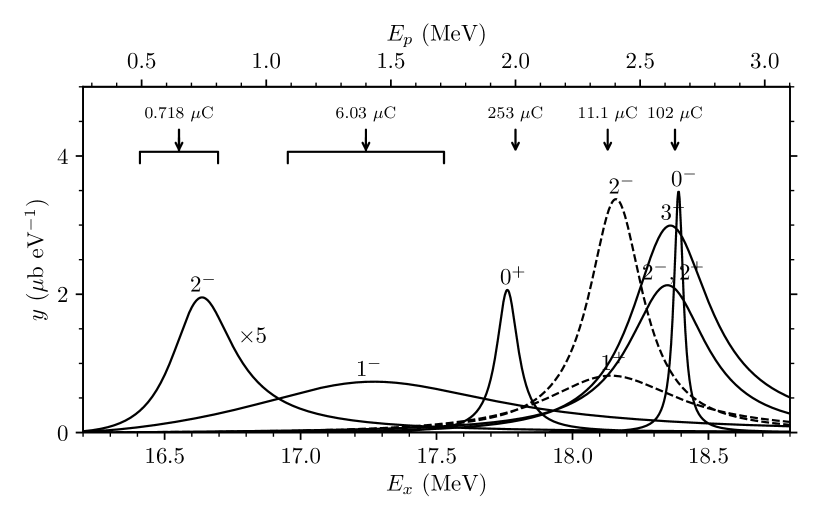
The energies () and total widths () of the levels listed in Table 4 are generally well constrained, whereas proton widths () are either missing or quoted without uncertainties. Proton widths have typically been determined by subtracting the widths (, ) from the total width. In particular, has been poorly constrained in previous experiments due to the complex correlations in this channel [2], and therefore the proton widths should be used with some caution. Also, the possibility should not be discounted that the excitation region – MeV contains broad levels with large widths ( MeV), which have not been clearly resolved in previous studies.
| (MeV) | (keV) | (keV) | ||
| 16.62(5) | 280(28) | 150 | 1 | |
| 17.23 | 1150 | 1000 | 1 | |
| 17.768 | 96(5) | 76 | 1 | |
| 18.13 | 600(100) | - | () | (0) |
| 18.16(7) | 240(50) | - | () | (0) |
| 18.35(5) | 350(50) | 68 | 1 | |
| 18.35(5) | 350(50) | - | ||
| (18.39) | 42 | 33 | (1) |
We proceed by briefly reviewing the available data for each of the levels in Table 4. Unless otherwise stated, the data is taken directly from the most recent TUNL compilation [13].
16.62, 2-
The properties of this level are well established, although the precision of is unclear. The level is clearly observed in , , and , as established already in the 1950s and 1960s, e.g., Refs. [14, 2]. There is also compelling evidence for smaller branches to the ground state and the and levels [15], but since the excitation functions were not measured the evidence is not conclusive.
17.23, 1-
Owing to its large width, the level is not easily resolved. It is most clearly seen in [2], while its precise contribution to , , and remains somewhat uncertain. There is compelling evidence for smaller branches to the , , , and levels [15], but since excitation functions were not measured the evidence is not conclusive.
17.76, 0+
The level is seen very clearly in , , and . The total width has been determined rather accurately by Hanna et al. and the proton width appears reliable. The level energy of 17.768 MeV was determined from the centroid of the resonance peak in the spectrum of Ref. [8].
18.13, 1+
Evidence for the existence of this level comes from a single study of [16]. There are no constraints on the proton width and the spin-parity and isospin assignments are not conclusive.
18.16, 2-
Evidence for the existence of this level also comes from a single study, in this case of [17]. There are no constraints on the proton width and the spin-parity and isospin assignments are not conclusive. It was suggested in Ref. [17] that the and levels might be one and the same level. Indeed, a spin-parity assignment of appears compatible with the data of Ref. [16]. In the TUNL compilation [13], the two levels are assumed to be one and the same, but here the 1+ spin-parity assignment of Ref. [16] is preferred, while the level energy and width is taken from Ref. [17]. However, the very different widths reported in the two studies contradict a single-level interpretation. Therefore, we assume the resonances reported in Refs. [16, 17] to correspond to distinct levels.
18.35, 3- & 2-,2+
A multidude of experimental probes provide evidence for the existence of at least two, if not three, levels at 18.35 MeV, cf. the discussion in Ref. [18]. One of these levels, which is observed both in the spectra of and and in the excitation curves of , , and , has been firmly assigned as and isospin , with additional evidence to support this assignment coming from and 11B data [18]. On the other hand, and data provide substantial evidence for the presence of an isospin-mixed level at 18.35 MeV with a width similar to that of the level, while data suggest a level at this energy with isospin [19]. rays to the and levels have also been observed at this energy [15], but in the absence of yield-curve measurements they cannot be attributed to the 18.35-MeV level(s) with certainty. Given the complicated situation with two or possibly three overlapping levels, the widths quoted in Table 4 should be used with some caution.
18.39, 0-
The level has only been observed in . Its spin-parity assignment appears firm although it is based solely on cross-section arguments [2], while the isospin remains unknown. The total width and proton width both appear reliable.
5.3 Partial widths
In the following, we provide a resonant interpretation of the observed capture cross sections that ignores the sub-dominant direct-capture component, i.e., . With this approximation, partial -decay widths can be deduced directly from Eq. 1. For those levels where the proton width is unknown, we adopt . This effectively renders the -ray widths deduced for these levels lower limits. For the purpose of estimating off-resonance contributions, we adopt the resonance shapes shown in Fig. 7, taking into account the energy-dependence of the -ray transition rate. We discuss the energy bins I–VII separately, starting with the lowest-energy bin. The deduced -ray widths are summarized in Table 5.
| (MeV) | Final level | Initial level111In those cases, where several initial levels can account for the observed feeding of the final level, all initial levels are given, and the widths are computed assuming that each transition accounts for the full cross section. | (eV) | (W.u.) | |
| 2.00, 2.64 | 9.64, | 18.35, | 222Some evidence for a smaller contribution from an isoscalar transition from the level. | ||
| 18.35, | 222Some evidence for a smaller contribution from an isoscalar transition from the level. | ||||
| 2.00 | 10.84, | 17.76, | 1.11(21)333A substantial contribution from an transition from the level cannot be ruled out. | 0.0093(18)333A substantial contribution from an transition from the level cannot be ruled out. | |
| 2.64 | 10.84, | 18.35, | 222Some evidence for a smaller contribution from an isoscalar transition from the level. | ||
| 18.39, | 222Some evidence for a smaller contribution from an isoscalar transition from the level. | ||||
| 2.00 | 11.83, | 17.23, | 444Contributions from transitions from the and levels cannot be ruled out. | 444Contributions from transitions from the and levels cannot be ruled out. | |
| 2.00 | 12.71, | 17.76, | 8.7(19) | 3.2(7) | |
| 2.64 | 12.71, | 18.35, | |||
| 18.39, |
I)
The yield in the lowest-energy bin is attributed entirely to , as confirmed by separate measurements performed on an isotope-enriched 10B target.
II)
At MeV, the level is observed very clearly in the 8Be channel. The inferred cross section is somewhat smaller than that of Hanna et al. [4], but consistent within uncertainties. The cross section may be accounted for by isovector transitions from the negative-parity levels at 18.35 MeV. An isoscalar transition from the level cannot by itself account for the full cross section, as this would require a strength of 0.0055(15) W.u., exceeding the upper limit of 0.002 W.u. recommended for such transitions [20]. However, it was noted by Hanna et al. that the angular distribution of the ray to the level is suggestive of mixing between two opposite parity levels, which provides some evidence for a sub-dominant contribution from the level. The two events observed in the 8Be channel may be attributed to decay of the level via the ghost of the 8Be ground state, which has been estimated to account for 2% of the -decay intensity [21]. In Table 5, we give the widths required for each of the two candidate transitions to produce the full observed cross section. The width of eV obtained for the transition agrees within uncertainties with the less precise width of eV reported by Hanna et al. [4]. Another estimate of this width can be obtained by combining eV from Ref. [2], with the intensity ratio from Ref. [15] measured at . This yields eV, in reasonable agreement with our value and that of Hanna et al. Finally, we note that the cross section at MeV is consistent with feeding of the level via the low-energy tails of the 18.35-MeV levels.
III)
Feeding to the level is observed both at MeV and 2.64 MeV. At the lower proton energy, where the level is seen very clearly, the cross section is most readily accounted for by an isovector transition from the level with a strength of W.u., which is typical for such transitions in light nuclei [20]. An isovector transition from the broad level is also a possibility, although the short measurements performed at MeV and 2.37 MeV indicate that such a transition could not be the dominant contribution at MeV. Assuming this were the case, we would expect to observe 3.0–3.5 events at MeV whereas only one event was observed ( discrepancy [22]) and 2.5–3.0 events at MeV whereas only one event was observed ( discrepancy). (We note that there is a slight mismatch between the energies of the two observed events, MeV and 11.25 MeV, respectively, and the energy of the level, leading to some uncertainty in their interpretation.) The feeding observed in the 8Be channel may be attributed to decay of the level via the ghost of the 8Be ground state, which has been esimated to account for 8% of the -decay intensity [21].
At MeV, where the feeding of the level is less pronounced, the cross section is consistent with isovector transitions from the level or the level, while an isoscalar transition from the level is ruled out because the required strength exceeds the recommended upper limit for such transitions [20].
Finally, we note that in the short measurement performed at MeV, a single event was detected in the 8Be channel. This event had an energy consistent with that of the level and could be accounted for by an isovector transition from the level with a strength of 0.070–1.00 W.u., which is typical for transitions of this kind in light nuclei [20].
IV)
At MeV, a peak occurs in the cross section at MeV in both the 8Be and 8Be channel. While the level provides a natural explanation for the peak in the 8Be channel, this level cannot account for the peak in the 8Be channel, which requires a level of natural parity. At MeV, strength is observed in both channels, but there is no clear indication of a peak at 11.8 MeV, suggesting that the level only makes a minor contribution to the cross section at this proton energy. The feeding to the level at MeV is most naturally accounted for by an isovector transition from the level with a strength of 1.4(4) W.u. An transition from the level could also be contributing, but cannot account for the entire feeding. If it did, we would expect to observe 43(7) events at MeV whereas only 19 events were observed in the 8Be channel (3.0 discrepancy). An isovector transition from the level provides yet another potential feeding mechanism, inconsistent only at the level of 2.2 with the low-statistics data collected at MeV, but requires a rather large strength of 5.4 W.u. to account for the entire cross section.
We now turn to the observation of a peak-like structure at MeV in the 8Be channel at MeV, which is intriguing since no narrow levels with natural-parity are known to exist at this energy in 12C. Unfortunately, the data provide few constraints on the quantum numbers of the level, only ruling out spins : Feeding of a level can be accounted for by an transition from the level; feeding of a level by transitions from the and levels or an transition from the level; feeding of a level by transitions from the and levels; and feeding of a level by an transition from the level. In all cases, the required strengths are within expectations for light nuclei [20] and consistent with the cross sections measured at the other beam energies.
The cross section measurement at MeV also provides limited insight into the properties of the final level: Any of the spin-parities , , , and can be accounted for by more than one transition. Only a assignment seems improbable as it requires an isoscalar transition from the level with a rather large strength of 18(6) W.u.
V)
Feeding to the level is observed very clearly at MeV and also at MeV albeit less clearly. Some cross section is also observed in the 8Be channel which cannot be accounted for by the level. The cross section obtained at the lower proton energy is about two times larger than that of Hanna et al. Even considering the substantial uncertainty on the value of Hanna et al., the discrepancy is significant. However, we note that Hanna et al. relied on the yield reported by Segel et al. [2] for normalizing their data, and this yield disagrees with other measurements by up to 50% as discussed in Ref. [2]. Also, the cross section reported by Segel et al. has recently been found to be underestimated by a factor of [8]. Taken together, these observations cast doubt on the accuracy of the normalization of the measurements of Hanna et al. indicating a potential % underestimation.
As already noted by Hanna et al., the feeding to the level at MeV can be accounted for by a rather strong isovector transition from the level. Indeed, the feeding cannot be accounted for in any other way. Adopting our larger cross section, the required strength is 4.4(9) W.u., making the transition one of the strongest of its kind [20]. The feeding observed at MeV cannot be accounted for by the high-energy tail of the level, but requires an isovector transition from either the or the level.
While the cross section observed in the 8Be channel is relatively small, it is of substantial interest since no natural-parity levels are known at MeV. There is, however, evidence for a broad ( MeV) level at MeV with spin-parity , the low-energy tail of which could potentially account for the observed cross section. This possibility will be explored further below.
VI)
The excitation region – MeV is known to contain a level at 13.32 MeV, which decays entirely via the 8Be channel, and a level at 14.08 MeV, which decays predominantly via the 8Be channel (78%). Recently, evidence has been found for a very broad ( MeV) level at 13.3 MeV. We observe relatively little feeding into this region, consistent with the expected inhibition of transitions that require large changes in spin. We note that the factor of enhancement of the cross section in the 8Be channel compared to the 8Be channel appears consistent with the known decay properties of the known levels, especially if the broad 13.3-MeV level is assumed to have a substantial decay component to the 8Be ground state.
Only isovector / transitions from the level can account for the feeding to the levels. However, this mechanism should produce a factor of enhancement of the cross section at MeV relative to 2.00 MeV, which is not observed. The discrepancy could potentially be reduced somewhat if the asymmetric shape of the 18.35-MeV level were taken into account, but it seems unlikely that this can fully explain the discrepancy. This suggests two possibilities: some of the cross section observed at the lower proton energy is to be attributed to (i) feeding to an unknown natural-parity level with –14 MeV and , or (ii) feeding from an unknown level with –18 MeV and .
VII)
At both MeV and 2.64 MeV, we observe substantial feeding to the excitation region above 14.5 MeV, especially in the 8Be channel. It seems natural to ascribe the majority of this cross section to the broad level at 15.44 MeV, tentatively assigned as although has also been proposed, but the feeding to this level is problematic:
Adopting the assignment, the cross section observed at MeV can only be accounted for by an isovector transition from the level, but we dismiss this possibility because the required strength of 2.5(8) W.u. exceeds the recommended upper limit of 0.5 W.u. [20] by a factor of five. (Transitions from the levels above 18 MeV can be dismissed because they overpredict the cross section at MeV.) Adopting instead the assignment, the conclusion is the same: no transition from any of the known levels can account for the observed feeding while conforming to the recommended upper limits of Ref. [20].
At MeV, the feeding can be accounted for by a rather strong transition from the level with a strength of (at least) 0.29(9) W.u., but only if the assignment is adopted for the 15.44-MeV level.
6 Summary and conclusions
We summarize our findings as follows: The cross sections measured at MeV and 2.64 MeV give clear evidence of feeding to the four known levels , , , and , but by themselves these levels cannot fully account for the observed cross sections. In particular, we find evidence for feeding to a natural-parity level near MeV. Evidence for natural-parity strength in this region was also found in a previous study of the de-excitations of the level [7] and in studies of the decays of 12B and 12N [23].
The feeding to the , , , and levels can be explained in terms of isovector and transitions from the known levels above the B threshold. The transitions proposed to account for the feeding to the and levels at MeV are of some interest, as they provide evidence for significant admixture in the level and/or the level. It is also worth noting that the larger and more precise width obtained for the transition makes this one of the strongest transition in any nucleus [20].
Higher-statistics measurements at MeV and 1.4 MeV would be highly desirable to confirm the tentative observation of transitions from the and levels, both feeding into the level. Such measurements would also yield improved constraints on the spin-parity of the natural-parity level observed at MeV. For these studies, it could prove advantageous to adopt a detector geometry similar to that of Ref. [7], which allows significantly larger beam currents at the cost of a substantial reduction of the detection efficiency in the 8Be channel.
The interpretation of the feeding observed into the excitation region above 13 MeV remains unclear, especially at MeV where the measured cross section could not be explained in terms of transitions between known levels. Here, too, additional measurements would be desirable.
An analysis of new complete-kinematics data on the 11B reaction, currently in progress, will provide an improved understanding of the channel. This, together with a multi-channel -matrix analysis that includes recent data on and as well as existing data on other channels, should lead to an improved understanding of the excitation region 16–18 MeV, which may require revision of some of the conclusions drawn from the present study.
While theoretical estimates suggest the resonant capture component to be dominant, the direct capture component is not negligible and could in some instances make a substantial contribution to the observed cross section. Such direct contributions were not considered in the derivation of the partial -ray widths given in Table 5. Improved theoretical calculations of the direct component would be of significant interest. Theoretical calculations of the radiative widths deduced in this work would also be of interest.
Finally, we remark that the and transitions in 8Be contribute only at the sub-nb level to the cross sections measured in this work, and hence can be safely ignored [24].
Acknowledgements
We would like to thank Folmer Lyckegaard for manufacturing the target. This work has been supported by the European Research Council under ERC starting grant LOBENA, No. 307447. OSK acknowledges support from the Villum Foundation through Project No. 10117.
References
- [1] G. Symons, P. Treacy, Nucl. Phys. 46 (1963) 93–107.
- [2] R. E. Segel, S. S. Hanna, R. G. Allas, Phys. Rev. 139 (1965) B818–B830.
- [3] H. W. Becker, C. Rolfs, H. P. Trautvetter, Zeitschrift für Physik A Hadrons and Nuclei 327 (3) (1987) 341–355.
- [4] S. S. Hanna, W. Feldman, M. Suffert, D. Kurath, Phys. Rev. C 25 (1982) 1179–1186.
- [5] M. Alcorta, et al., Nucl. Instrum. Meth. A 605 (2009) 318–325.
- [6] O. S. Kirsebom, et al., Phys. Lett. B 680 (2009) 44–49.
- [7] K. L. Laursen, H. O. U. Fynbo, O. S. Kirsebom, K. S. Madsbøll, K. Riisager, Eur. Phys. J. A 52 (12) (2016) 370.
- [8] M. Munch, O. S. Kirsebom, J. A. Swartz, H. O. U. Fynbo, Eur. Phys. J. A. 56 (2020) 17.
- [9] S. S. Hanna, W. Feldman, M. Suffert, D. Kurath, Phys. Rev. C 25 (3) (1982) 1179–1186.
- [10] H. O. U. Fynbo, et al., Phys. Rev. Lett. 91 (8) (2003) 082502.
- [11] C. Rolfs, Nucl. Phys. A 217 (1) (1973) 29–70.
- [12] E. G. Adelberger, R. E. Marrs, K. A. Snover, J. E. Bussoletti, Phys. Rev. C 15 (2) (1977) 484–497.
- [13] J. Kelley, J. Purcell, C. Sheu, Nucl. Phys. A 968 (2017) 71–253.
- [14] G. Dearnaley, G. A. Dissanaike, A. P. French, G. L. Jones, Phys. Rev. 108 (1957) 743–753.
- [15] F. Zijderhand, F. Jansen, C. Alderliesten, C. van der Leun, Nucl. Instrum. Meth. A 286 (3) (1990) 490–496.
- [16] M. Suffert, W. Feldman, S. S. Hanna, Part. Nucl. 4 (1972) 175.
- [17] P. Lewis, G. Shute, B. Spicer, V. Officer, P. Andrews, S. Banks, Nucl. Phys. A 474 (2) (1987) 499–517.
- [18] G. H. Neuschaefer, M. N. Stephens, S. L. Tabor, K. W. Kemper, Phys. Rev. C 28 (1983) 1594.
- [19] A. Kiss, C. Mayer-Boricke, M. Rogge, P. Turek, S. Wiktor, J. Phys. G: Nucl. Phys. 13 (8) (1987) 1067–1074.
- [20] P. Endt, Atom. Data Nucl. Data Tables 55 (1) (1993) 171–197.
- [21] M. Alcorta, et al., Phys. Rev. C 86 (2012) 064306.
- [22] W. A. Rolke, A. M. López, J. Conrad, Nucl. Instrum. Meth. A 551 (2) (2005) 493–503.
- [23] S. Hyldegaard, et al., Phys. Rev. C 81 (2) (2010) 024303.
- [24] V. M. Datar et al., Phys. Rev. Lett. 94 (2005) 122502.