Dielectric permittivity of deeply supercooled water according to the measurement data at the frequencies 7.6 GHz and 9.7 GHz
Abstract
Dielectric permittivity of supercooled volume water has been measured in the range of temperatures from C to C at the frequencies GHz and GHz. The measurements have been made using microwave resonators and wetted silicate sorbents. From the data obtained, the temperature dependences of the relaxation frequencies were updated for the Debye model with two relaxation frequencies. The updated formulae for dielectric permittivity of cold water may be applied to the frequency range GHz.
Introduction
The knowledge of dielectric permittivity of supercooled volume water (down to C) at microwaves is of interest for the study of the physical and chemical properties of water and of water solutions. There are numerous problems relating to the study of hydrosphere, biosphere, and atmosphere, where the knowledge of the microwave characteristics of water and their details is required Meissner and Wentz (2004); Rosenkranz (2015); Turner et al. (2016).
However, measuring the complex relative dielectric permittivity (), especially at the temperatures () below C, is a complicated task Rosenkranz (2015). In Bertolini et al. (1982), it was solved using microemulsion of water, when the researchers were able to cool the water samples down to C and to make measurements of the real () and imaginary () parts of near the frequency GHz.
In Bordonskii et al. (2019); Bordonskiy and Orlov (2019a) wetted nanoporous silicate materials were used for the purpose, in which water could be supercooled to C Limmer and Chandler (2012). Dependences were found in a broad range of frequencies () and temperatures. In those works, originally dependence of the attenuation constant for radiation intensity of wetted medium was measured. Further, to calculate , theoretical values were used, which, however, were not experimentally validated for the water temperature below C. The situation was complicated also by the fact that, according to the study results Bordonskiy and Orlov (2019b) of the dielectric permittivity models Meissner and Wentz (2004); Rosenkranz (2015); Ellison (2007), which were applied to the temperature range below C, it was found that the values of differed by several times.
To objective of the present study was to measure and to investigate the temperature dependence for pore water, close for its characteristics to supercooled metastable volume water. The study was conducted for the temperature range C near the frequencies and GHz.
The method used
As shown in Menshikov et al. (2017); Castrillon et al. (2011); Solveyra et al. (2011), water contained in nanometer-size pores of silicate sorbents has properties differing from the volume water only for layers of water molecules on the pore surface. The other layers are close for their characteristics to metastable volume water. This unique feature of the silicate sorbents was used for measuring of supercooled water.
It is known that in such media the phase transition temperature () decreases by the value , where degreesnm, – the pore radius in nm, nm Solveyra et al. (2011). In the case of pores having the radius nm, is C. In the case of incomplete filling of the pores, additional supercooling is observed, compared to by approximately C Gallo et al. (2016). In addition, in the cooling — heating process, the freezing — melting temperature hysteresis is formed, at which the freezing temperature is lower than the values found from the formula for . The hysteresis may exceed C and is determined by the value of the average water content and the cooling rate Gallo et al. (2016); Webber (2010).
To reach the temperature in the area of the “no man’s land” (C) Limmer and Chandler (2012); Gallo et al. (2016) low values of wetted sorbent materials with the gravity water content % were used. The cooling rate was selected not to exceed C/hr.
As the proportion of volume water in the medium is %, and its value goes down with the temperature decrease, the resonator method was used, in which complete filling of the resonator with the medium is achieved. Such a method was used, for example, in Mtzler and Wegmuller (1987) to measure of freshwater ice in determining the impact of small concentrations of liquid inclusions in it. In the course of our study, we discovered the ability of wetted disperse media to form macroscopic inhomogeneities due to migration of the liquid in the presence of a temperature gradient and at freezing of free water between the grains. This effect leads to distortion of the resonance curves and to essential reduction of the measurement accuracy. In Bordonskii et al. (2019), it was eliminated at measurement of , placing large–size samples in free space, which resulted in reduction of the impact of the medium inhomogeneities and of the spatial dispersion caused by them.
A similar approach was used in this study for resonator measurements. Resonators were used with higher numbers of the oscillation modes and hence of the resonator volume. Such a technique allows averaging by a large number of inhomogeneities. In addition, data averaging was performed at the frequency range % of the average frequency.
In our study, we used rectangular transmission-type resonators, connected to waveguide transmission lines with the waves of the type. The resonance frequencies of a rectangular resonator for loss-free medium are shown by the following formula:
| (1) |
where , , , , , — the resonator dimensions along the Cartesian fields of coordinate axes (, , ), — the velocity of electromagnetic waves in vacuum. For waves of type in a rectangular waveguide and for radiation propagation along axis , resonators with the mode of oscillations are used, where . In the proposed technique, modes for should be used, i.e. , etc. For this case, , and .
The respective resonance frequencies are:
| (2) |
From Eq. (2) for a certain mode of oscillations and based on the measurements of the resonance frequencies of an empty () and filled resonator, of wetted medium is found:
| (3) |
In case of losses to the medium, to the resonator walls and losses due to connection with the transmission waveguides, the value of the resonance frequency decreases, and is found by the formula:
| (4) |
where — the quality factor for the resonator filled with the medium. For , which was observed in the experiment, the error of estimate is less than %. Therefore, the value for wetted medium filling the resonator was derived from formula (3).
To determine the dielectric parameters of water, a refraction model was used for a mixture of different dielectrics Birchak et al. (1974), according to which:
| (5) |
where is related to volume water in pores, is related to the structure consisting of solid matrix, empty space in pores and between the material grains, — the relative volume of the medium, excluding liquid volume water.
Equation (5) contains complex variables and the unknown value and . To solve equation (5), additional information is introduced. It is assumed based on Limmer and Chandler (2012) that at temperature C free water freezes out. As its mass constitutes % of the total mass of the substance, and the dielectric permittivity of the formed ice is close to value of the silicate material, we find from the resonance frequency measurements at a temperature lower than C within the error margin of one per cent. The real part is found from its equivalence , where — the resonance frequency lower than C. The imaginary part: . Here — the effective loss factor, which takes into account losses to the dry medium and waveguide walls and losses due to connection with the waveguides, — resonance bandwidths at half power transmitting.
To find , a priori information was found of the values of dielectric permittivity of water at C from Meissner and Wentz (2004).
From (5) it follows:
| (6) |
is found from measurements at the temperature C. The real part is determined from (3). is found from the measurements of the resonator’s quality factor. Substituting the value for C in (6), we find and .
The is determined by the sum of two values:
| (7) |
where , refers to losses in volume water, is the quality factor determined by losses to the resonator walls, connection to the waveguides and dry sorbent material. , determined from the measurements at a temperature lower than C. From (7) we obtain:
| (8) |
Substituting the required values in (5), we find .
The procedure of measurements
The microwave parameters of the resonator were measured using the Micran frequency characteristics analyzer. The scanning time for the entire frequency range from to GHz was s, and the number of the measured points in the frequency band was . The obtained values were processed on the computer, with dependences smoothed, the resonance curves approximated with bell-like functions and the resonance frequencies and width determined. The temperature of the medium investigated was measured with a thermocouple embedded in the opening of the resonator’s wide wall.
The temperature measurements were made using a climate chamber Espec SU-261, which allowed cooling of the resonator with the medium temperature down to C. To obtain lower temperatures and complete freezing of volume water, the chamber was switched off as the temperature reached C, and the resonator was cooled down with liquid nitrogen, followed by its slow heating. During those changes, hysteresis of the resonator characteristics ( and ) was observed. With the used cooling mode C/hr, nanoporous silicate sorbent materials with the pore diameter nm and their water content %, the observed hysteresis of the resonator characteristics in the range of temperatures C was C. That allowed us to conclude that temperature of the supercooled water in the pores without water crystallization reached C. This conclusion was confirmed by the absence of the increase of at water cooling below C, at which ferroelectric ice is formed. This crystal modification of ice results in the increase of the loss factor due to emergence of a highly conductive layer at the ice — dielectric boundary Widom (1963).
In the experiment, a transmission resonator was used, with the dimensions mm, mm, mm. Diaphragms with holes mm in diameter was placed in the plane , , where the cross section of the transmission waveguides was mm2. The measured resonance frequencies of the empty resonators were found to be equal to: GHz, GHz, GHz.
Measurement results
The above technique was applied to measurements in the range of frequencies GHz at temperatures from C to C. Their choice was connected with the experimental work Bertolini et al. (1982), where at the frequency GHz water was supercooled to C. The data from this study presented in Meissner and Wentz (2004) were used to update our measurements in determining the volume concentration of metastable water.
In the experiment, KSKG silica gel made in Hong Kong with the average pore size nm and Acros silica gel manufactured in Belgium with the average pore size and nm were used. Measurements with a rectangular resonator were conducted simultaneously at two frequencies for the modes and . For KSKG with the gravity water content %, resonances for the modes and were near the frequencies GHz and GHz.
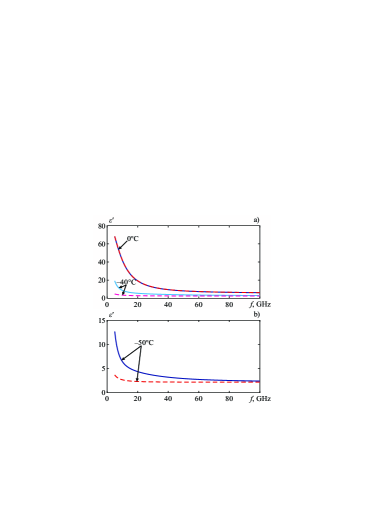
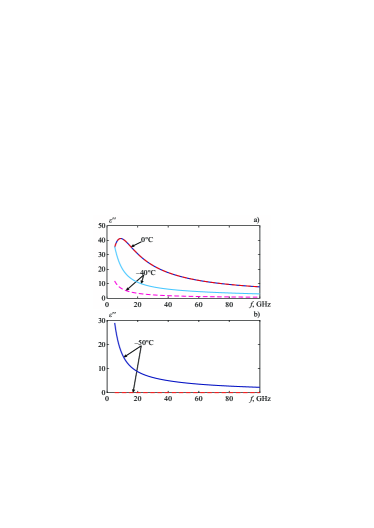
The results of measurements after computer processing are shown in Figs. 1–4. As the data were processed, their approximation was performed with analytic dependences in accordance with Meissner and Wentz (2004).
The formulae presented for the two-frequency Debye relaxation model look as follows for dielectric permittivity of pure water:
| (9) |
where is the interim constant of dielectric permittivity, is frequency, — static dielectric constant, and — the first and second relaxation frequencies. For , , , , , there are the following formulae Meissner and Wentz (2004):
| (10) | |||
where is expressed in GHz, — in degrees Celsius.
For the purpose of their use in the region of negative temperatures, dependences of two relaxation frequencies were specified. In Meissner and Wentz (2004), assuming the impact of the Widom line of water for the temperature of C Gallo et al. (2016); Widom (1963); Holten et al. (2012) parameter was chosen to be equal to . As was expressed in degrees Celsius, at that relaxation temperatures turned into zero. In our measurements, we observed an electromagnetic response at lower temperatures, too.
Based on the assumption that in cold water its vitrification occurs at the temperature of approximately C Holten et al. (2012), parameter was selected to be equal to . After adjustment of the coefficients in formulae (10) to achieve compliance of and with the experimental values at the temperatures below C, the following coefficient values were found: the table I contains coefficients in formulae (10).
| 0 | 5.6500E00 | 6 | 3.6143E00 |
| 1 | 1.6960E-02 | 7 | 2.8841E-02 |
| 2 | -1.4810E-04 | 8 | 3.9208E-01 |
| 3 | 1.4627E01 | 9 | -3.2094E-03 |
| 4 | -4.2926E-01 | 10 | 7.6578E-04 |
| 5 | 7.5714E-03 |
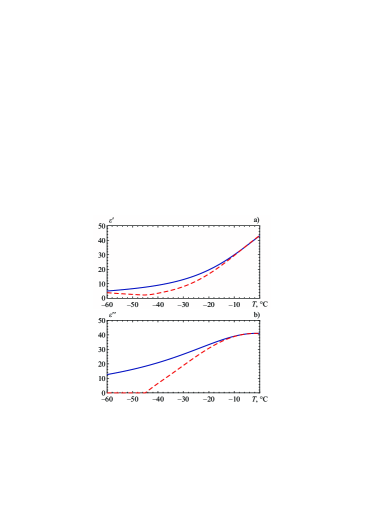
Shown in Fig. 1 are dependences and on temperature for frequency GHz. To compare, the results of computations using formulae Meissner and Wentz (2004) are provided. At the temperature below C, in Meissner and Wentz (2004) the values are not determined, therefore, they were taken to be equal to zero.
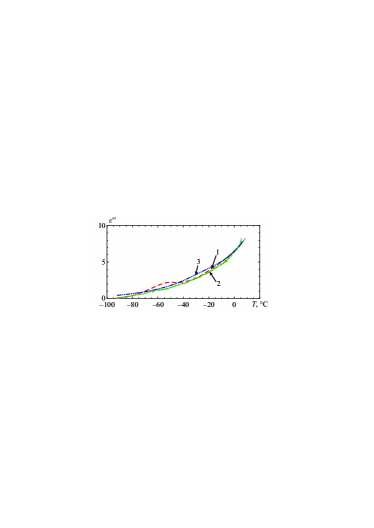
The obtained values of were used for adjusting the results for at the frequencies of the millimeter band by the measurements of the attenuation coefficient provided in Bordonskiy and Orlov (2019b). Fig. 4 demonstrates the temperature dependences from Bordonskiy and Orlov (2019b) for the frequency of GHz.
Discussion of results
The main difficulty in conducting measurements of consists in eliminating the distortions of resonance curves in the form of oscillations on the curve slopes. The distortions are related to inhomogeneities emerging in wetted micro disperse medium. In wetted medium with the water content above %, it is practically impossible to make measurements. This feature made computer calculations more difficult due to the difficulty of determining the precise values of the resonance frequency and of the width of the resonance curve. In smoothing of the measured resonance curves: 1 — by averaging of curves by neighboring points in the band of frequencies; 2 — by Gaussian curves; 3 — by the Lorentz dependence, variations of the final results were observed () % from the mean value. The smoothest dependences were obtained at averaging in the bandwidths MHz (at points), followed by approximation by the Gaussian function.
To obtain dependences on frequency, formulae from Meissner and Wentz (2004) were specified for the two-frequency Debye model for pure volume water. The main idea was in correct selection of the temperature dependence of relaxation frequencies on temperature. The application of the two-frequency model has certain reasons due to development of a two-structure model of water, which considers the fluctuating clusters of water of high-density (HDL) and of low-density (LDL) Gallo et al. (2016). These structures are in complex interaction. Their concentration is determined by temperature, and at cooling below C LDL begins to prevail. At temperature around C the relaxation time becomes equal to s (vitrification begins), hence, in Debye model near this temperature we can consider the relaxation frequencies to turn into zero.
Validation of formulae (9, 10) for the available measurement data of at millimeter frequencies Bordonskiy and Orlov (2019a, b) demonstrates good compliance of the experimental results obtained by using two different methods. A number of factors influence the accuracy of the results, apart from the measurement error. It is known that water density decreases as it is cooled from C to C Mallamace et al. (2007). This effect is compensated to a certain degree by selection of coefficients in the temperature dependence of the relaxation times. A more complicated issue consists in compliance of the parameters of pore water and of volume water (for macro volumes), as well as the error introduced by strongly bound water. For strongly bound water, the relaxation frequencies are in the range of GHz, but this water may influence the value of at the frequencies of the gigahertz order.
In certain cases, if crystallization begins at temperatures below C, not ice Ih or Ic but ice may be formed in wetted medium Quigley et al. (2014); Bordonskiy and Orlov (2017). The peculiar feature of this ice is that it is ferroelectric and has strong influence on the microwave characteristics of the medium Bordonskiy and Orlov (2017). Ice may be formed on the grain surface or in the space in-between the sorbent grains. It is likely that it caused the failure of the experiments in wetted media with the water content higher than %.
The accuracy of determining the values by formulae (10) for volume water at temperatures below C is approximately equal to %. In order to raise the degree of this accuracy, measurements are required to be made in a broader range of frequencies and the special relaxation and absorption mechanisms have to be investigated. For example, in Bordonskiy and Orlov (2019a, b) the increase of near C was investigated due to the impact of the specific behavior of water on the Widom line Holten et al. (2012). The Widom line is related to the existence of the second critical point of water. At it, fluctuations of water density and entropy drastically rise, and a number of the thermodynamic characteristics of water change (specific heat capacity at constant pressure, coefficients of volume expansion and of isothermal compressibility).
It is to be noted that the obtained results proved to be applicable, based on the comparison results, to the temperature C and the frequency GHz.
Conclusions
1. A method is proposed for measuring relative dielectric permittivity of supercooled water in the microwave range for temperatures from C to C. It is based on the special properties of water contained in nanoporous silicate materials, in which water is close to metastable volume water for its parameters. In this technique, in order to eliminate the impact of inhomogeneities resulting from emergence of clusters at migration of water due to temperature gradients and phase transitions, measurements are conducted in resonators which have relatively large volumes and a low degree of wetting of the materials. In this case, the impact of the inhomogeneities is averaged, and distortions in the measured electromagnetic characteristics of the media under study become eliminated. The values and near the frequencies GHz and GHz were measured, and analytical dependence in the range of C was obtained. The obtained dependence may be spread to the range of frequencies GHz and temperatures C, which the comparison results showed.
2. The technique proposed may ensure approximately % accuracy of measuring dielectric permittivity of supercooled water. However, a question remains regarding correspondence of the parameters of water contained in the pores of a material to those of the ideal volume water. The accuracy of determining the dielectric characteristics of water depends on a number of parameters: the proportion of bound water and the breakdown of its characteristics by the water layers adjacent to the surfaces of the medium boundaries; the specific details of the sample cooling techniques; the physical-chemical characteristics of the sorbent matrix; the values of electric conductivity of the layers at the medium interfaces and certain other parameters. Therefore, the expected accuracy of determining the values of dielectric permittivity in relation to ideal volume water may significantly vary in any method of measurement. This relates also to the previously conducted measurements using microemulsions of water Bertolini et al. (1982). In our experiments involving two different types of silica gels, the difference between the values of reached %.
3. The measurements performed refer to cold water in the region of “no man’s land”. This region is interesting due to the most conspicuous anomaly of water, decrease of its density when temperature changes from C to C Mallamace et al. (2007). In its turn, this anomaly is related to the structural features of liquid water: interaction and mutual transformations of clusters LDL and HDL, and the existence of the second critical point. The specific features of the dielectric permittivity of supercooled water in porous media may be used in microwave spectroscopy of the processes of water freezing (melting) in closed space. For example, it has been found that at freezing of water below C, ferroelectric ice is formed. Its appearance results in the rise of electromagnetic losses, which may be used for the study of the chemical processes in cooling of natural disperse media due to the change of the chemical potential of the inclusions. Equally interesting is the issue of investigating the microwave characteristics of water near the Widom line using the proposed technique (at the temperatures C and the pressure MPa). At present, there are little experimental results on this issue.
References
- Meissner and Wentz (2004) T. Meissner and F. J. Wentz, IEEE Trans. Geosci. Remote Sens. 42, 1836 (2004).
- Rosenkranz (2015) P. W. Rosenkranz, IEEE Trans. Geosci. Remote Sens. 53, 1387 (2015).
- Turner et al. (2016) D. D. Turner, S. Kneifel, and M. P. Cadeddu, J. Atmos. Oceanic Technol. 33, 33 (2016).
- Bertolini et al. (1982) D. Bertolini, M. Cassettari, and G. Salvetti, J. Chem. Phys. 76, 3285 (1982).
- Bordonskii et al. (2019) G. S. Bordonskii, A. O. Orlov, and S. D. Krylov, Journal of Communications Technology and Electronics 64, 375 (2019).
- Bordonskiy and Orlov (2019a) G. S. Bordonskiy and A. O. Orlov, Preprint arXiv: 1901.03979 [cond-mat.soft] , 8 (2019a).
- Limmer and Chandler (2012) D. T. Limmer and D. Chandler, J. Chem. Phys. 137, 044509/1 (2012).
- Bordonskiy and Orlov (2019b) G. S. Bordonskiy and A. O. Orlov, Izvestiya, Atmospheric and Oceanic Physics 55, 1005 (2019b).
- Ellison (2007) W. J. Ellison, J. Chem. Phys. Ref. Data 36, 1 (2007).
- Menshikov et al. (2017) L. I. Menshikov, P. L. Menshikov, and P. O. Fedichev, Journal of Experimental and Theoretical Physics 125, 1173 (2017).
- Castrillon et al. (2011) S. R.-V. Castrillon, N. Giovambattista, I. A. Arsay, and P. G. Debenedetti, J. Phys. Chem. C 115, 4624 (2011).
- Solveyra et al. (2011) E. G. Solveyra, E. Llave, D. A. Scherlis, and V. Molinero, J. Phys. Chem. B 115, 14196 (2011).
- Gallo et al. (2016) P. Gallo, K. Amann-Winkel, C. A. Angell, M. A. Anisimov, F. Caupin, C. Chakravarty, E. Lascaris, T. Loerting, A. Z. Panagiotopoulos, J. Russo, J. A. Sellberg, H. E. Stanley, H. Tanaka, C. Vega, L. Xu, and L. G. M. Pettersson, Chem. Rev. 116, 7463 (2016).
- Webber (2010) J. B. W. Webber, Progress in Nuclear Magnetic Resonance Spectroscopy 56, 78 (2010).
- Mtzler and Wegmuller (1987) C. Mtzler and U. Wegmuller, J. Phys. D: Appl. Phys. 20, 1623 (1987).
- Birchak et al. (1974) J. R. Birchak, L. G. Gardner, J. W. Hipp, and J. M. Victor, Proc. IEEE 62, 93 (1974).
- Widom (1963) B. Widom, J. Chem. Phys. 39, 2808 (1963).
- Holten et al. (2012) V. Holten, C. E. Bertrand, M. A. Anisimov, and J. V. Sengers, J. Chem. Phys. 136, 094507 (2012).
- Mallamace et al. (2007) F. Mallamace, C. Branca, M. Broccio, C. Corsaro, C.-Y. Mou, and S.-H. Chen, Proceedings of the National Academy of Sciences 104, 18387 (2007).
- Quigley et al. (2014) D. Quigley, D. Alf, and B. Slater, J. Chem. Phys. 141, 161102/1 (2014).
- Bordonskiy and Orlov (2017) G. S. Bordonskiy and A. O. Orlov, JETP Letters 105, 492 (2017).