Can The Crowd Identify Misinformation Objectively?
The Effects of Judgment Scale and Assessor’s Background
Abstract.
Truthfulness judgments are a fundamental step in the process of fighting misinformation, as they are crucial to train and evaluate classifiers that automatically distinguish true and false statements. Usually such judgments are made by experts, like journalists for political statements or medical doctors for medical statements. In this paper, we follow a different approach and rely on (non-expert) crowd workers. This of course leads to the following research question: Can crowdsourcing be reliably used to assess the truthfulness of information and to create large-scale labeled collections for information credibility systems? To address this issue, we present the results of an extensive study based on crowdsourcing: we collect thousands of truthfulness assessments over two datasets, and we compare expert judgments with crowd judgments, expressed on scales with various granularity levels. We also measure the political bias and the cognitive background of the workers, and quantify their effect on the reliability of the data provided by the crowd.
1. Introduction
The information we are exposed to influences our decision making processes. Thus, understanding what information should be trusted and which should not be trusted is key for democracy processes to function as supposed to. The research community has been focusing on developing techniques and datasets to automatically classify the credibility of information (Wang, 2017; Conroy et al., 2015). Key approaches to automatically differentiate between false and valid claims also include neural models (Wang et al., 2018; Singhania et al., 2017; Ruchansky et al., 2017). Information credibility assessment (also known under the name of fact checking) is a task that has gained popularity due to the spread of misinformation online. This is often done with the intended mean of deceiving people towards a certain political agenda. The task of checking the veracity of published information has been traditionally performed by expert fact checkers, that is, journalists who perform the task by verifying information sources and searching for evidence that supports the claims made by the document or statement they are verifying. On the other hand, the need for manual fact checking is rapidly growing also due to the increasing volume of misleading and false information online (Vo and Lee, 2018). Because of this, it becomes infeasible for journalists to provide fact checking results for all news which are being continuously published. Moreover, relying on fact checking results requires trusting those who performed the fact checking job. This is something the average web user may not be willing to accept. Thus, a more scalable and decentralized approach would allow fact checking to be more widely available.
In this paper, we study the limitations of non-expert fact checkers identifying misinformation online. We run a very large crowdsourcing experiment where we ask crowd workers to fact check statement given by politicians and search for evidence of statement validity using a custom web search engine that we control. Previous work has looked at the effect of workers’ cognitive bias on the quality of crowdsourced relevance judgments (Eickhoff, 2018) and subjectivity labels (Hube et al., 2019). In this work we look at human bias on fact checking tasks where the effect may be even stronger given the opinionated dimension of the analyzed content. In our experiments we collected data on the assessors’ political background and cognitive abilities, and control for the political standing of the statements to be fact checked, the geographical relevance of the statements, the assessment scale granularity, and the truthfulness level. We use one dataset with statements given by US politicians and one dataset with statements given by Australian politicians and ask US-based crowd workers to perform the fact checking task. For each dataset we also used available expert assessments to compare crowd assessments against. In this way, we are able to observe how each crowd worker bias is reflected in the data they generated as we assume US-based workers might have knowledge of US politics but less likely would have knowledge of Australian politics in terms of political figures and topics of discussion.
We investigate the following Research Questions:
-
RQ1:
Are the used assessment scales suitable to gather, by means of crowdsourcing, truthfulness labels on political statements?
-
RQ2:
Which is the relationship and the agreement between the crowd and the expert labels? And between the labels collected using different scales?
-
RQ3:
Which are the sources of information that crowd workers use to identify online misinformation?
-
RQ4:
Which is the effect and the role of assessors’ background in objectively identify online misinformation?
Our results show that the scale used to collect the judgments does not affect their quality; the agreement among workers is low, but when properly aggregating workers’ answers and merging truthfulness levels crowdsourced data correlates well with expert fact checker assessments. The crowd assessors’ background has an impact on the judgments they provide. To the best of our knowledge, the dataset used for this paper (https://github.com/KevinRoitero/crowdsourcingTruthfulness) is the first dataset containing truthfulness assessments produced by the crowd on multiple scales.
The rest of the paper is structured as follows. Section 2 presents a summary of the relevant recent work. In Section 3 we present our study setup discussing the used datasets, the fact checking task design, and the assessment scales we consider. Section 4 presents our observations on the quality of the data provided by crowd workers, the agreement between crowd workers and experts, and how workers’ bias impact their data. Finally, in Section 5 we discuss our key findings and draw our conclusions.
2. Related Work
In the last few years, the research community has been looking at automatic check-worthiness predictions (Gencheva et al., 2017; Vasileva et al., 2019), at truthfulness detection/credibility assessments (Popat, 2019; Mihaylova et al., 2019; Atanasova et al., 2019; Nakov et al., 2018; Elsayed et al., 2019; Kim et al., 2019), and at developing fact-checking URL recommender systems and text generation models to mitigate the impact of fake news in social media (Vo and Lee, 2018, 2019; You et al., 2019). In this section we focus on the literature that explored crowdsourcing methodologies to collect truthfulness judgments, the different judgment scales that have been used so far, and the relation between assessors’ bias and the data they produce.
Crowdsourcing Truthfulness. Crowdsourcing has become a popular methodology to collect human judgments and has been used in the context of information credibility research. For example, Kriplean et al. (2014) analyzed volunteer crowdsourcing when applied to fact-checking. Zubiaga and Ji (2014) looked at disaster management and asked crowd workers to assess the credibility of tweets. Their results show that it is difficult for crowd workers to properly assess information truthfulness, but also that the source reliability is a good indicator of trustworthy information. Related to this, the Fact Checking Lab at CLEF (Nakov et al., 2018; Elsayed et al., 2019) addressed the task of ranking sentences according to their need to be fact-checked. Maddalena et al. (2018) looked at assessing news quality along eight different quality dimensions using crowdsourcing. Roitero et al. (2018a) and La Barbera et al. (2020) recently studied how users perceive fake news statements. As compared to previous work that looked at crowdsourcing information credibility tasks, we look at the impact of assessors’ background and rating scales on the quality of the truthfulness judgments they provide.
Judgment Scales. Fact-checking websites collect a large number of high-quality labels generated by experts. However, each fact-checking site and dataset defines its own labels and rating system used to describe the authenticity of the content. Therefore, to integrate multiple datasets, converging to a common rating scale becomes very important. Vlachos and Riedel (2014) aligned labels from Channel 4 and PolitiFact to a five-point scale: False, Mostly False, Half True, Mostly True, and True. Nakov et al. (2018) retrieve evaluations of different articles at factcheck.org to assess claims made in American political debates. They then generate labels on a three-level scale: False, Half True, and True. Vosoughi et al. (2018) check the consistency between multiple fact-checking websites on three levels: False, Mixed, and True. Tchechmedjiev et al. (2019) look at rating distributions over different datasets and define a standardized scoring scheme using four categories: False, Mixed, True, and Other. For these works, we can conclude that different datasets have been using different scales and that meta-analyses have tried to merge scales and aggregate ratings together. While no clear preferred scale has yet emerged, there seems to be a preference towards coarse-grained scales with just a few (e.g., three or four) levels as they may be more user-friendly when labels need to be interpreted by information consumers. In our work we use the original dataset scale at six levels and compare ratings collected with that scale against a more coarse-grained scale (i.e., three levels) and a more fine-grained scale (i.e., a hundred levels).
The Impact of Assessors’ Bias. Human bias is often reflected in manually labeled datasets and therefore in supervised systems that make use of such data. For example, Otterbacher et al. (2017) showed that human bias and stereotypes are reflected in search engine results. In the context of crowdsourced relevance judgments, Eickhoff (2018) showed how common types of bias can impact the collected judgments and the results of Information Retrieval (IR) evaluation initiatives. Previous studies have found a positive correlation between cognitive skills (measured by means of the cognitive reflection test or CRT (Frederick, 2005)) and the ability to identify true and false news (Pennycook and Rand, 2018, 2019b, 2019a). In our work we collect assessors’ background and bias data to then identify patterns in their assessment behaviors.
3. Experimental Setting
In this section we first introduce the two datasets that we used in our experiments. We then present the task design we created and the different rating scales we used to collect truthfulness assessments from crowd workers. In our experiments we use two datasets (i.e., two sets of statements made by politicians), eight judgment collections (i.e., three sets of crowd judgments per dataset and one expert judgment set per dataset), and three different judgment scales (i.e., with three, six, and one hundred levels).
3.1. Datasets
Statement Speaker, Year PolitiFact Label: mostly-true “Florida ranks first in the nation for access to free prekindergarten.” Rick Scott, 2014 ABC Label: in-between “Scrapping the carbon tax means every household will be $550 a year better off.” Tony Abbott, 2014
PolitiFact. This dataset (constructed by Wang (2017)) contains statements given by US politicians with truthfulness labels produced by expert fact-checkers on a 6-level scale (detailed in Section 3.3). In this work, we selected a subset of 20 statements for each truth level from the original dataset covering the time span 2007 to 2015. The sample includes statements by politicians belonging to the two main US parties (Democratic and Republican).
ABC. This dataset published by RMIT ABC Fact Check111https://www.abc.net.au/news/factcheck/ consists of 407 verified statements covering the time span 2013 to 2015. To create this dataset, professional fact checkers seek expert opinions and collect evidence before a team makes a collective decision on how to label each claim. To this aim, a fine-graded scale is used and verdicts are labeled as: ‘Correct’, ‘Checks out’, ‘Misleading’, ‘Not the full story’, ‘Overstated’, ‘Wrong’, among others. These verdicts are then grouped in a three-level scale: Positive, In-Between, and Negative. In our experiments, the latter three-level scale is used as ground truth. Our sample includes 60 randomly selected statements (20 statements for each truth level) by politicians belonging to the two main Australian parties (i.e., Liberal and Labor). For both PolitiFact and ABC datasets, a balanced number of statements per class and per political party was included in the sample. Table 1 shows an example of PolitiFact and ABC statements.
3.2. Crowdsourcing Task Design
We collect truthfulness judgments using the crowdsourcing platform Amazon Mechanical Turk (MTurk).222The experimental setup was reviewed and approved by the Human Research Ethics Committee at The University of Queensland. Each worker accepting our Human Intelligence Task (HIT) receives a unique input token, which identifies uniquely both the MTurk HIT and the worker, and is redirected to an external website where to complete the task. The task is designed as follows: in the first part the workers are asked to provide some details about their background, such as age, family income, political views, the party in which they identifies themselves, their opinion on building a wall along the southern border of United States, and on the need for environmental regulations to prevent climate change. Then, to assess their cognitive abilities, workers are asked to answer three modified Cognitive Reflection Test (CRT) questions, which are used to measure whether a person tends to overturn the incorrect “intuitive” response, and further reflect based on their own cognition to find the correct answer. Psychologist Shane Frederick firstly (Frederick, 2005) proposed the original version of the CRT test in 2005. These modified questions are:
-
•
If three farmers can plant three trees in three hours, how long would it take nine farmers to plant nine trees?[correct answer = 3 hours; intuitive answer = 9 hours]
-
•
Sean received both the 5th highest and the 5th lowest mark in the class. How many students are there in the class? [correct answer = 9 students; intuitive answer = 10 students]
-
•
In an athletics team, females are four times more likely to win a medal than males. This year the team has won 20 medals so far. How many of these have been won by males? [correct answer = 4 medals; intuitive answer = 5 medals]
After this initial survey, workers are asked to provide truthfulness values for 11 statements: 6 from PolitiFact, 3 from ABC, and 2 which serve as gold questions –one obviously true and the other obviously false– written by the authors of this paper. All the PolitiFact statements we use come from the most frequent five contexts (i.e., the circumstance or media in which the statement was said / written) available in the dataset; to avoid bias, we select a balanced amount of data from each context. To assess the truthfulness of statements, workers are presented with the following information about each statement:
-
•
Statement: the statement.
-
•
Speaker: the name and surname of whom said the statement.
-
•
Year: the year in which the statement was made.
We asked each worker to provide both the truthfulness level of the statement, and a URL that serves both as justification for their judgment as well as a source of evidence for fact checking. In order to avoid workers finding and using the original expert labels (which are available on the Web) as primary source of evidence, we ask workers to use a provided custom web search engine to look for supporting evidence. The custom search engine uses the Bing Web Search API,333https://azure.microsoft.com/services/cognitive-services/bing-web-search-api/ and filters out from the retrieved results any page from the websites that contain the collection of expert judgments we used in our experiment. After workers assess all 11 statements they can submit the HIT. In order to increase the quality of collected data, we embedded the following quality check in the crowdsourcing task:
-
•
Gold Questions: the worker must assign to the obviously false statement a truthfulness value lower than the one assigned to the obviously true statement.
-
•
Time Spent: the worker must spend at least two seconds on each statement and cognitive question.
We performed several small pilots of the task, and after measuring the time and effort taken to successfully complete it, we set the HIT reward to $1.5. This was computed based on the expected time to complete it and targeting to pay at least the US federal minimum wage of $7.25 per hour. Given the aims of the experiment, we publish the task allowing only US-based workers to participate. During the experiment, we logged all worker behaviors using Javascript code in the HIT that sends log messages to our server at each worker action (e.g., clicking on a truthfulness level, submitting a search query, selecting a URL, or moving to the next statement). To avoid learning effects, we choose to allow each worker to complete only one of our HITs for only one experimental setting (i.e., one judgment scale). Overall, not including pilot runs whose data was then discarded, we collected assessments for 120 (PolitiFact) 60 (ABC) = 180 statements each judged by 10 distinct workers. We repeated this over 3 different assessment scales, so, in total, we collected (for each scale) * 3 = assessments. If we consider also the assessments of the two gold questions we embedded in the task, workers provided a total of assessments.
3.3. Assessment Scales and Collections
In our experimental design we consider three truthfulness scales and generated five collections: two ground truths labeled by experts (for PolitiFact and ABC), and three created by means of our crowdsourcing experiments (S3, S6, and S100):
-
•
PolitiFact: uses a six-level scale, with labels pants-on-fire, false, barely-true, half-true, mostly-true, and true.
-
•
ABC: uses a three-level scale, with labels negative, in-between, and positive.
-
•
S3: uses a three-level scale, with the same labels as the ABC scale.
-
•
S6: uses a six-level scale, with the same labels as the PolitiFact scale, but replacing pants-on-fire with lie (we felt that “Lie” would be more clear than the colloquial “Pants on Fire” expression).
-
•
S100: uses a one-hundred-and-one level scale, with values in the range.444The number of levels of this scale is 101 but we call it S100 for simplicity.
The nature and usage of these scales deserve some discussion. The scales we use are made of different levels, i.e., categories, but they are not nominal scales: they would be nominal if such categories were independent, which is not the case because they are ordered. This can be seen immediately by considering, for example, that misclassifying a true statement as mostly-true is a smaller error than misclassifying it as half-true. Indeed all of them are ordinal scales. However, they are not mere rankings, as the output of an information retrieval systems, since statements are assigned to categories, besides being ranked: given two statements having as ground truth, say, true and mostly-true respectively, misclassifying them as half-true and barely-true is an error, and it is a smaller one than misclassifying them as false and pants-on-fire, but in all cases the original ranking has been preserved. These scales are sometimes named Ordinal Categorical Scales (Agresti, 2010).
For ordinal categorical scales it cannot be assumed that the categories are equidistant. For example, a misclassification from pants-on-fire to false cannot be assumed to be a smaller error than a misclassification from barely-true to true, in principle. Again, to be rigorous, taking the arithmetic mean to aggregate individual worker judgments for the same statement into a single label is not correct, since this would assume equidistant categories. On the contrary, the mode (called ‘majority vote’ by the crowdsourcing community), which is the right aggregation function for nominal scales, even if correct, would discard important information. For example, the aggregation of four pants-on-fire with six false judgments should be rather different from –and lower than– six false and four true, though the mode is the same. The orthodox correct aggregation function for this kind of scale is the median.
However, the situation is not so clear cut. In the last example, the median would give the exact same result than the mode, thus discarding useful information. A reasonably defined ordinal categorical scale would feature labels which are approximately equidistant. This is particularly true for S100, since: (i) we used numerical labels for the categories, and (ii) the crowd workers had to use a slider to select a value. This makes S100 (at least) very similar to an interval scale, for which the usage of the mean is correct –and indeed it has been already used for S100 (Roitero et al., 2018b). Also, in information retrieval we are well used to interpreting ordinal scales as interval ones (e.g., when we assign arbitrary gains in the NDCG effectiveness metrics) and/or (ab)using the arithmetic mean (e.g., when we take the mean of ranks in the Mean Reciprocal Rank metric) (Fuhr, 2018). In many practical cases, using the arithmetic mean turns out to be not only adequate but even more useful than the correct aggregation function (Graham et al., 2015; Mathur et al., 2017; Aletras et al., 2017). Even worse, there are no metrics for tasks defined on an ordinal categorical scales, like predicting the number of “stars” in a recommendation scenario. Sometimes accuracy is used, like in NTCIR-7 (Kando, 2008), but this is a metric for nominal scales; in some other cases, like in RepLab 2013 (Amigó et al., 2013a), Reliability and Sensitivity (Amigó et al., 2013b) are used, which consider only ranking information and no category membership; even metrics for interval scales, like Mean Average Error (MAE), have been used (Ghosh et al., 2015).
For these reasons, in the following we sometimes use the (aggregated) truthfulness labels expressed by workers as if they where on an interval scale. Another reason to do so is to treat the various scales in a homogeneous way, and thus use the same aggregation used for S100 also for S3, S6, PolitiFact, and ABC. Accordingly, in the following we denote the labels of ABC and S3 with 0, 1, and 2, as if they where in the range. Moreover, we denote the labels of PolitiFact and S6 with 0, 1, …, 5 –as if they where expressed in the range. Finally, we denote the truthfulness labels of S100 with 0, 1, , 100.
We take these as working assumptions for our setting, and we leave an exhaustive study of the perceived distance between the truthfulness levels for future work; furthermore, we perform our initial analyses aggregating by means but then discuss the effects of using alternative aggregation functions in Section 4.4.
4. Results
4.1. Worker Background and Behavior
About six hundred US resident555MTurk workers based in the US must provide evidence they are eligible to work. crowd workers participated to this study on MTurk. Across all experiments, the majority of workers (46.33%) are between 26 and 35 years old. Second, workers in our study are well-educated as more than 60.84% of workers have a four years college degree at least. Third, around 67.66% of workers earn less than $75,000 a year.
Nearly half (47.33%) of the workers think their views are more democratic and only about 22.5% of workers selected the Republican Party as voting preference. As for political views, Liberal and Moderate accounted for the most substantial proportion of workers, 29.5% and 28.83% respectively, while Very Conservative accounted for the least, only 5.67%. In response to the border issue, 52.33% of US-based workers are against the construction of a wall on the southern border, while 36.5% of the workers supported the building. For environmental protection, 80% of the workers supported the government to strengthen environmental regulation to prevent climate change, while 11.33% of the workers objected.
Based on the behavioral actions we logged as workers went through the HITs, Table 2 shows the ratio of workers who completed the task, abandoned the task, and failed the quality checks. Abandonment numbers are in line with previous studies (Han et al., 2019a). We can observe a higher failure and lower completion rate for S100. This may show a slight lack of comfort for workers in using the most fine-grained scale. We also logged worker behavior in terms of going back to previously seen statement (less than 5% over all scales).
| Completion | Abandonment | Failure | |
|---|---|---|---|
| S3 | 35 | 53 | 12 |
| S6 | 33 | 52 | 14 |
| S100 | 25 | 53 | 22 |
4.2. Crowdsourced Score Distributions
 |
 |
 |
 |
 |
 |
 |
 |
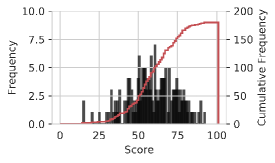 |
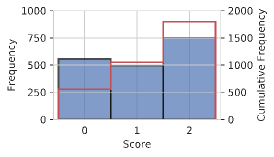
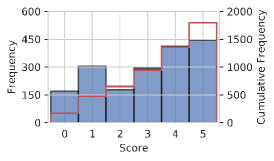
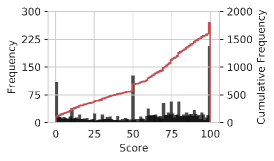
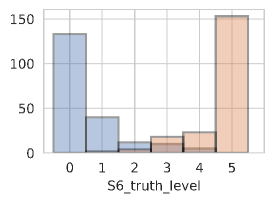
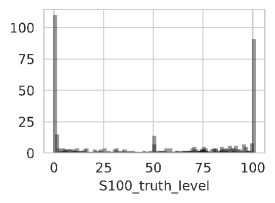
This section presents an analysis of score distributions obtained by the crowd for the statements used in our experiment. Figure 1 shows the distribution (and the cumulative distribution in red) for the individual scores provided by workers over the three crowd collections (i.e., S3, S6, and S100) for all the statements considered in the experiment; the behavior is similar across PolitiFact and ABC statements (not shown because of space limitations).
The first row of the figure shows the raw score distributions for the three collections. As we can see from the plots, for all S3, S6, and S100 the distribution is skewed towards the right part of the scale representing higher truthfulness values; this can be also seen by looking at the cumulative distribution, which is steeper on the right hand side of the plots. It can also be seen that all three distributions are multimodal. Looking at S100 we can see a mild round number tendency, that is, the tendency of workers to provide truthfulness scores which are multiple of 10 (35% of S100 scores are multiple of 10; 23% are 0, 50, or 100); such behavior was already noted by Maddalena et al. (2017a), Roitero et al. (2018a), and Roitero et al. (2018b). Also in this case, this behavior is consistent when considering separately PolitiFact and ABC documents (not shown).
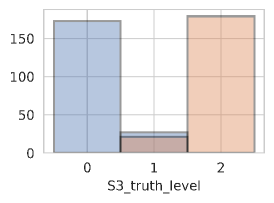
We now turn to gold scores distribution, i.e., the special statements H and L that we used to perform quality checks during the task. The second row of Figure 1 shows the scores distribution for the three crowd collections we considered. As we can see from the plots, the large majority of workers (44% for L and 45% for H in S3, 34% for L and 39% for H in S6, and 27% for L and 24% for H in S100) provided as truthfulness level for these gold statements the extreme value of the scales (respectively the lower bound of the scale for L and the upper bound of the scale for H). This can be interpreted as a signal that the gathered data is of good quality. However, some workers provided judgments inconsistent with the gold labels.
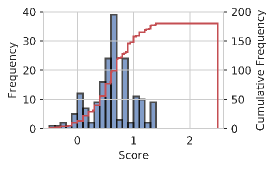
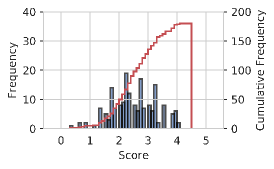
Finally, we discuss aggregated scores. The third row of Figure 1 shows the score distributions of S3, S6, and S100 judgments aggregated by taking the average of the 10 scores obtained independently for each statement. As we can see from the plots, the distribution of the aggregated scores for all S3, S6, and S100 are similar, they are no longer multimodal, and they are roughly bell-shaped. It is worth noting that, while the aggregated scores for S3 (bottom-left plot in Figure 1) are skewed towards lower/negative –i.e., negative and in-between– scores, S3 and S100 (bottom-mid and bottom-right plots in Figure 1) are skewed to higher/positive scores. This shows how different scales are used differently by the crowd. As expected (Maddalena et al., 2017a; Roitero et al., 2018a, b), for S100 the round number tendency effect also disappears when judgments from different workers are aggregated together. In the following we discuss how truthfulness scores gathered from the crowd compare to expert labels.
4.3. External and Internal Agreement
We now discuss the external agreement between the crowd judgments and the expert labels as well as the internal agreement among workers, addressing RQ2.
 |
 |
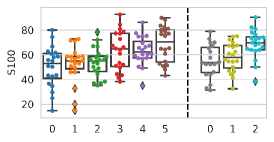 |
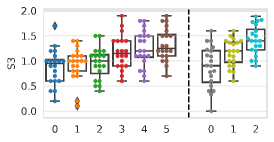
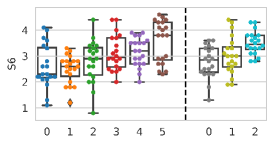
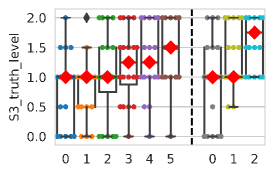
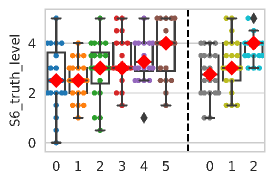
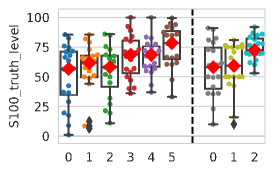
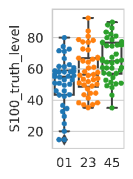
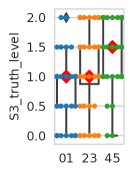
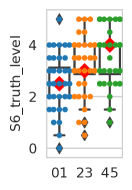
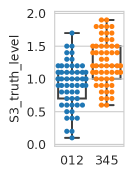
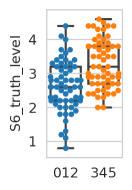
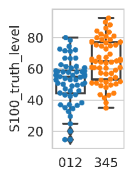
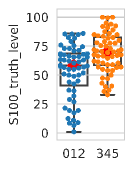
External Agreement. Figure 2 shows the agreement between the aggregated crowd judgments and the ground truth (i.e., the expert labels provided for PolitiFact and ABC), for the S3, S6, and S100 crowd collections. As we can see from the plots, the behavior over all the three scales is similar, both on PolitiFact and ABC statements. If we focus on PolitiFact documents (shown in the first panel of each plot), we can see that it is always the case that the 0 and 1 boxplot are very similar. This can point out a difficulty from workers to distinguish between the pants-on-fire and false labels. The same behavior, even if less evident, is present between the false and barely-true labels; this behavior is consistent across all the scales. On the contrary, if we focus on the rest of the PolitiFact labels, and on the ABC ones, we can see that the median lines of each boxplot are increasing while going towards labels representing higher truth values (i.e., going towards the right hand side of each chart), indicating that workers have higher agreement with the ground truth for those labels. Again, this behavior is consistent and similar for all the S3, S6, and S100 scales.
We measured the statistical significance of the differences between the ratings aggregated by mean for categories of the S6, S3, and S100 collections according to the Mann-Whitney rank test and the t-test. Concerning ABC, adjacent categories are significantly different in 5 cases out of 12, while the difference between non adjacent categories are all significant to the p level. Concerning PolitiFact, the differences between the ratings aggregated by mean for adjacent categories and not adjacent ones by distance of 2 (e.g., 0 and 2) are never significant with only one exception (distance 2); differences for not adjacent categories of distance 3 are significant in 4/18 cases, and differences for categories of distance 4 are significant in 5/12 of the cases. Finally, categories of distance 5 (i.e., 0 and 5) are significant in 4/6 cases. Although there is some signal, it is clear that the answer to RQ1 cannot be positive on the basis of this results. We will come back on this in Section 4.5.
 |
 |
 |
 |
 |
 |
 |
 |
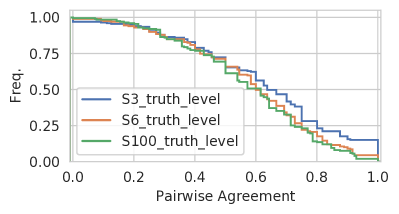
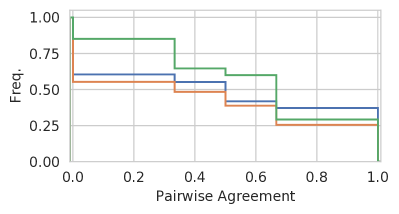
We now turn on inspecting the agreement between the workers and the ground truth by looking at each HIT. To do so, we computed, for all the S3, S6, and S100 collections the pairwise agreement (Maddalena et al., 2017b) between the truthfulness scores expressed by workers and the ground truth labels, with a breakdown over PolitiFact and ABC statements. We considered a slightly modified version of the pairwise agreement measure defined by Maddalena et al. (2017b): in the attempt to make the pairwise agreement measure fully comparable across the different scales, we removed all the ties. Intuitively, pairwise agreement as described in Maddalena et al. (2017b) measures the fraction of pairs in agreement between a “ground truth” scale and a “crowd” scale. Specifically, a pair of crowd judgments (crowd-judgment1, crowd-judgment2) is considered to be in agreement if crowd-judgment1 crowd-judgment2 and the ground truth for crowd-judgment1 is the ground truth for crowd-judgment2. In our measurement666The code used to compute the pairwise agreement as defined by us can be found at https://github.com/KevinRoitero/PairwiseAgreement. we removed all the ties (i.e., crowd-judgment1 crowd-judgment2), and we used in place of . Figure 3 shows the CCDF (Complementary Cumulative Distribution Function) of the relative frequencies of the HIT agreement. As we can see from the charts, the S3, S6, and S100 scales show a very similar level of external agreement; such behavior is consistent across the PolitiFact and ABC datasets. Again, this result confirms that all the considered scales present a similar level of external agreement with the ground truth, with the only exception of S100 for the ABC dataset: this is probably due to the treatment of ties in the measure, that removes a different number of units for the three scales.
Internal Agreement. We now turn to investigate the internal agreement (i.e., the agreement measured among the workers themselves), and in particular we also compare workers using different scales. We computed a metric used to measure the level of agreement in a dataset, the Krippendorff’s (Krippendorff, 2011) coefficient. All values within each of the three scales S3, S6, S100 and on both PolitiFact and ABC collections are in the – range. These results show that there is a rather low agreement among the workers (Krippendorff, 2011; Checco et al., 2017).
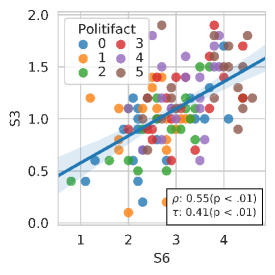
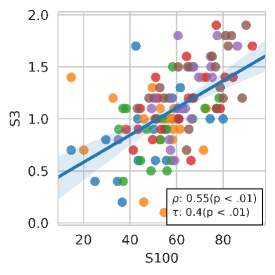
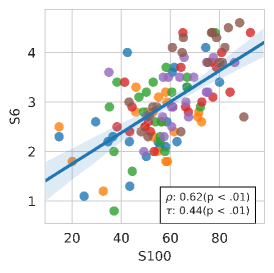
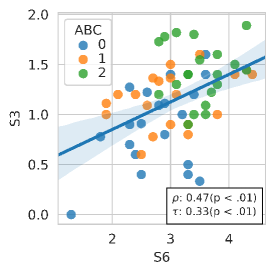
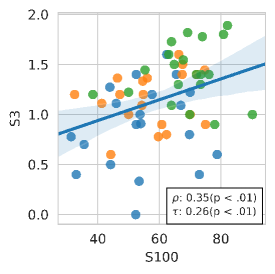
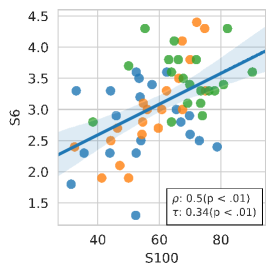
To further investigate if the low agreement we found depends on the specific scale used to label the statements, we also performed all the possible transformations of judgments from one scale to another, following the methodology described by Han et al. (2019b). Figure 4 shows the scatterplots, as well as the correlations, between the different scales on the PolitiFact and ABC statements. As we can see from the plots, the correlation values are around – for PolitiFact and – for ABC, for all the scales. The rank correlation coefficient is around for PolitiFact and for ABC. These values indicate a low correlation between all the scales; this is an indication that the same statements on different scales tend to be judged differently, both when considering their absolute value (i.e., ) and their relative ordering (i.e., ).
 |
 |
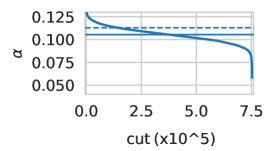 |
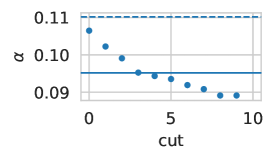
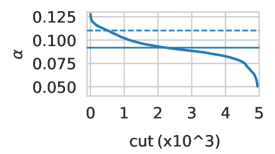
Figure 5 shows the distribution of the values when transforming one scale into another.777Note that the total number of possible cuts from S100 to S6 is 75,287,520, thus we selected a sub-sample of all the possible cuts. We tried both stratified and random sampling, getting indistinguishable results. The dotted horizontal line in the plot represents on the original dataset, the dashed line is the mean value of the (sampled) distribution. As we can see from the plots, values on the y-axis are very concentrated and all values are close to zero ( range). Thus, we can conclude that across all collections there is low level of internal agreement among workers, both within the same scale and across different scales.
4.4. Alternative Aggregation Functions
 |
 |
 |
 |
 |
 |
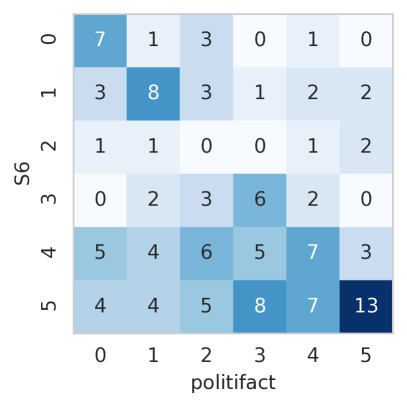 |
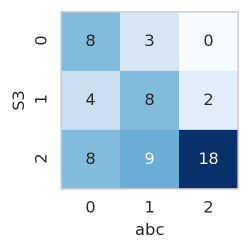
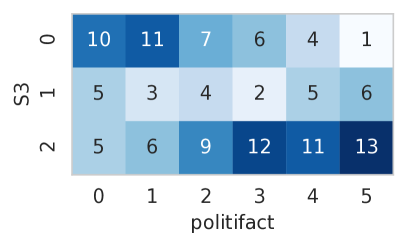
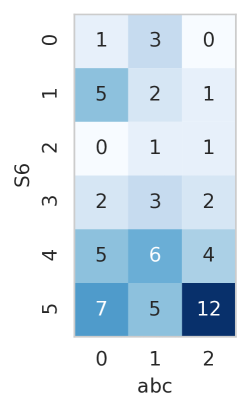
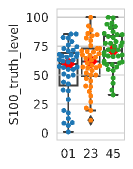
As anticipated in Section 3.3, we also study the effect of aggregation functions alternative to the arithmetic mean. Figure 6 shows the results of using the median: in this case the final truthfulness value for each statement has been computed by considering the median of the scores expressed by the workers. By comparing the charts to those in Figure 2 it is clear that the median produces worst results. The heatmaps in Figure 7 show the results of using the majority vote (i.e., the mode) as the alternative aggregation function. The mode is more difficult to compare with the mean, but it is again clear that the overall quality is rather low: although the squares around the diagonal tend to be darker and contain higher values, there are many exceptions. These are mainly in the lower-left corners, indicating false positives, i.e., statements whose truth value is over-evaluated by the crowd; this tendency to false positives is absent with the mean (see Figure 2). Overall these results confirm that the choice of mean as aggregation function seems the most effective.
4.5. Merging Assessment Levels
Given the result presented so far in Sections 4.3 and 4.4 (especially Figures 2, 6, and 7, but also the rather low agreement and correlation values), the answer to RQ1 cannot be completely positive. There is a clear signal that aggregated values resemble the ground truth, but there are also several exceptions and statements that are mis-judged. However, there are some further considerations that can be made. First, results seem better for ABC than PolitiFact. Second, it is not clear which specific scale should be used. The two expert collections used as ground truth use different scales, and we have experimented with the crowd on S3, S6, and S100. Also, comparisons across different scales are possible, as we have shown above. Finally, a binary choice (true/false) seems also meaningful, and in many real applications it is what may really be needed. Third, the above mentioned possible confusion between pants-on-fire and false suggest that these two categories could be fruitfully merged. This has been done, for example, by Tchechmedjiev et al. (2019).
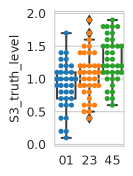
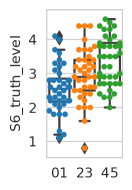
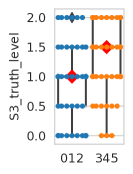
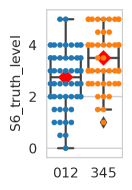
All these remarks suggest to attempt some grouping of adjacent categories, to check if by looking at the data on a more coarse-grained ground truth the results improve. Therefore, we group the six PolitiFact categories into either three (i.e., 01, 23, and 45) or two (i.e., 012 and 345) resulting ones, adopting the approach discussed by Han et al. (2019b). Figure 8 shows the results. The agreement with the ground truth can now be seen more clearly. The boxplots also seem quite well separated, especially when using the mean (the first three charts on the left). This is confirmed by analyses of statistical significance: all the differences in the boxplots on the bottom row are statistically significant at the p level for both t-test and Mann–Whitney, both with Bonferroni correction; the same holds for all the differences between 01 and 45 (the not adjacent categories) in the first row; for the other cases, i.e., concerning the adjacent categories, further statistical significance is found at the p¡ level in 8 out of 24 possible cases.
These results are much stronger than the previous ones: we can now state that the crowd is able to single out true from false statements with good accuracy; for statements with an intermediate degree of truthfulness/falsehood the accuracy is lower.
 |
 |
 |
 |
 |
 |
 |
 |
 |
 |
 |
 |
4.6. Sources of Evidence
| Wikipedia | Youtube | The | Factcheck | Smh | Cleveland | Washington | News | Blogspot | On the | Quizlet | NY | CBS | Forbes | House | Madison | The | Milwaukee | Yahoo | |
| Guardian | Post | Issues | Times | News | Australian | Journal | |||||||||||||
| S3 | 17 | 13 | 11 | 8 | 6 | 6 | 6 | 5 | 5 | 4 | 4 | 3 | 3 | 3 | 3 | 3 | 0 | 0 | 0 |
| S6 | 19 | 13 | 12 | 8 | 3 | 6 | 6 | 4 | 6 | 0 | 3 | 3 | 4 | 3 | 3 | 0 | 4 | 3 | 0 |
| S100 | 23 | 12 | 13 | 9 | 6 | 5 | 6 | 5 | 5 | 0 | 4 | 0 | 5 | 0 | 3 | 0 | 0 | 0 | 3 |
Table 3 shows the distribution of websites used by workers to justify the truthfulness label they chose for each statement. As we can see, the most used sources are, for all the scales, “Wikipedia” and “YouTube”, followed by popular news websites such as “The Guardian” and “The Washington Post”. Furthermore, we can see that among the most popular sources there is one fact checking website (i.e., FactCheck). Noting that we intentionally removed abc.com.au and politifact.com URLs from those which could be selected, this shows that workers, supported by the search engine, tend to identify trustworthy information sources to support their judgment decisions.
| 1 | 2 | 3 | 4 | 5 | 6 | 7 | 8 | 9 | 10 | 11 | |
|---|---|---|---|---|---|---|---|---|---|---|---|
| S3 | 17 | 12 | 13 | 14 | 12 | 9 | 7 | 6 | 4 | 3 | 1 |
| S6 | 13 | 13 | 16 | 12 | 11 | 9 | 8 | 7 | 5 | 4 | 1 |
| S100 | 15 | 15 | 15 | 12 | 8 | 12 | 7 | 6 | 5 | 2 | 1 |
| avg | 15 | 13 | 15 | 11 | 10 | 10 | 7 | 6 | 5 | 3 | 1 |
Table 4 shows the distribution of the ranks within the search engine results of the URLs chosen by workers to justify their judgments (without considering the gold questions), for S3, S6 and S100. As we can see from the table, the majority of workers tend to click on the first results shown by the search engine, as expected (Kelly and Azzopardi, 2015; Craswell et al., 2008; Joachims et al., 2005). Nevertheless, the results also show that workers explore the first ten documents as ranked by the search engine and do not simply click on the first returned URL, thus putting some effort to find a reliable source and/or justification. Finally, we note that over all the scales, all the workers stopped at the first page of results as returned by the search engine, and no one investigated search results with rank greater than 10.
4.7. Effect of Worker Background and Bias
| Dataset |
|
Age |
|
||||
|---|---|---|---|---|---|---|---|
| PolitiFact | Pants-on-fire | ∗ | |||||
| False | |||||||
| True | ∗ | ||||||
| Discernment | ∗∗ | ∗∗ | |||||
| ABC | Negative | ||||||
| Positive | ∗∗ | ||||||
| Discernment | ∗ | ∗∗ | |||||
| Total | Discernment | ∗∗ | ∗∗ |
-
•
∗∗: , ∗: .
CRT Test. To answer RQ4, we aim to assess the relationships that exists between workers’ background and their performance. In terms of workers’ cognitive skills, we measure CRT performance as the percentage of correct answers given by them. Thus, a higher CRT score is associated to higher analytical thinking ability (Frederick, 2005). We compare worker performances across the three scales by means of the standardized calculation of the -score for each worker and each assessment level. The -score for each statement represents the performance of crowd workers as compared to others. The lower the -score for false statements, the stronger the ability of the crowd to identify lies and the higher the -score for true statements, the higher the ability to identify accurate information. “Discernment” is then calculated by deducting the -score for false statements from the -score for true statements. This represents the ability of the crowd to distinguish the true from the false (Pennycook and Rand, 2019b). In this analysis we focus on statements with extreme true or false ground truth labels and discard the ‘in-between’ statements as they do not provide additional evidence on the ability of the crowd to distinguish between true/false information.
Table 5 shows the results. First, there is a statistically significant (Spearman’s rank-order test), moderate positive correlation between Discernment and CRT score on statements from PolitiFact and ABC (, and , respectively). This shows that workers who reflect more perform better in identifying pants-on-fire statements of US (local) politicians (, ), and identifying true statements of AU (not local) politicians (, ). In general, people with strong analytical abilities (as determined by the CRT test) can better recognize true statements from false(, ). Besides, the ability to distinguish true from false increases with age (, ). Older workers perform better in recognizing true statements by US politicians (, ). The level of education and income do not have statistically significant correlation with their judgments.
Political Background. As a Shapiro-Wilk test (Shapiro and Francia, 1972) confirms that discernment scores are normally distributed () for groups with diverse political views, we can conducted a one-way ANOVA analysis to determine if the ability to distinguish true from false statements was different across groups.888As a Levene’s Test (Schultz, 1985) showed that the homogeneity of variances was violated () we used the Welch-Satterthwaite correction (Satterthwaite, 1946) to calculate the degrees of freedom and a Games-Howell post-hoc test (Ruxton and Beauchamp, 2008) to show multiple comparisons. Discernment score is statistically significantly different between different political views (Welch’s , ). A Games-Howell post-hoc test confirms that the increase of discernment score (, 95% CI ( to )) from conservative ( ± ) to liberal ( ± ) is statistically significant (). Given these results, we can conclude that crowd workers who have liberal views can better differentiate between false and true statements. Furthermore, there is no statistically significant difference (we use a Kruskal-Wallis H tests (Kruskal and Wallis, 1952) as Shapiro-Wilk test (Shapiro and Francia, 1972) ) in discernment scores based on the political party in which crowd workers explicitly identified themselves with (, ). This shows there is no difference in judgment quality based on their explicit political stance. However, an analysis of their implicit political views rather than their explicit party identification shows a different result.
From the above results we can see that while the explicit party identification does not have a significant impact on the judgment quality for true and false statements, their implicit political orientation does. The partisan gap on the immigration issue is apparent in the US. According to the survey conducted by Pew Research Center in January 2019, about 82% of Republicans and Republican-leaning independents support developing the barrier along the southern border of the United States, while 93% of Democrats and Democratic leaners oppose it. Therefore, asking workers’ opinion on this matter can be a way to know their implicit political orientation.
We use a Kruskal-Wallis H tests (Kruskal and Wallis, 1952) as Shapiro-Wilk test (Shapiro and Francia, 1972) () in assessor’s discernment between immigration policy groups defined based on their answer to the wall question. We observed statistically significant differences on Politifact statements () and on all statements (). A post-hoc analysis using Dunn’s procedure with a Bonferroni correction (Dunn, 1964) revealed statistically significant differences in discernment scores on PolitiFact statements between agreeing () and disagreeing () () on building a wall. Similar results are obtained when discernment scores are compared on all statement, there were statistically significant differences in discernment scores between agreeing () and disagreeing () () on building a wall along the southern border of the United States. These results show how, in our experiment, crowd workers who do not want a wall on the southern US border perform better in distinguishing between true and false statements. We did not observe significant differences based on their stance on climate issues.
5. Discussion and Conclusions
In this paper, we present an extensive crowdsourcing experiment that aims at studying the overview of crowd assessor identifying misinformation online. The dataset we employed in the research includes statements given by US and Australian politicians. The experiment asks US-based crowd workers to perform the fact-checking task by using the customized Internet search engine under our control to find evidence of the validity of the statements. We collect and analyze data on the assessors’ political background and cognitive abilities, and control for the politically-consistent statements to be fact-checked, the geographical relevance of the statements, the assessment scale granularity, and the truthfulness level.
Addressing RQ2, in terms of agreement w.r.t. the ground truth, the behavior over all the three scales is similar, both on PolitiFact and ABC statements. Across all the annotation created using crowdsourcing, there is low level of internal agreement among workers, on all the S3, S6, and S100 scales. However, addressing RQ1, we found that the grouping of adjacent categories reveals that crowd sourced truthfulness judgments are useful to accurately single out true from false statements. Addressing RQ3, we found that workers put effort to find a reliable source to justify their judgments, and tend to choose a source found in the first search engine result page, but not necessarily the first search result. Finally, concerning RQ4, we found that assessors’ background affects in objectively identify online misinformation.
Future work includes a thorough study of the perceived distance between the truthfulness scales, which would inform more sophisticated ways for aggregating and merging crowdsourced judgments. The resource we created can also be used to better understand –via user studies– how the agreement obtained in crowdsourced judgments can assist experts in better identifying statements that need more attention. We envisage that a collaborative process between automatic credibility systems, crowd workers, and expert fact checkers would provide a scalable and decentralized hybrid mechanism to cope with the increasing volume of online misinformation.
Acknowledgements.
This work is partially supported by a Sponsor Facebook Research https://research.fb.com/programs/research-awards/proposals/the-online-safety-benchmark-request-for-proposals/ award and by an Sponsor Australian Research Council Discovery Project (DP190102141) http://purl.org/au-research/grants/arc/DP190102141. We thank Devi Mallal from RMIT ABC Fact Check for facilitating access to the ABC dataset.References
- (1)
- Agresti (2010) Alan Agresti. 2010. Analysis of Ordinal Categorical Data (2nd ed.). Wiley.
- Aletras et al. (2017) Nikolaos Aletras, Timothy Baldwin, Jey Han Lau, and Mark Stevenson. 2017. Evaluating Topic Representations for Exploring Document Collections. Journal of the Association for Information Science and Technology 68, 1 (2017), 154–167.
- Amigó et al. (2013a) Enrique Amigó, Jorge Carrillo de Albornoz, Irina Chugur, Adolfo Corujo, Julio Gonzalo, Tamara Martín, Edgar Meij, Maarten de Rijke, and Damiano Spina. 2013a. Overview of RepLab 2013: Evaluating Online Reputation Monitoring Systems. In Proceedings of CLEF. 333–352.
- Amigó et al. (2013b) Enrique Amigó, Julio Gonzalo, and Felisa Verdejo. 2013b. A General Evaluation Measure for Document Organization Tasks. In Proceedings of SIGIR. 643–652.
- Atanasova et al. (2019) Pepa Atanasova, Preslav Nakov, Lluís Màrquez, Alberto Barrón-Cedeño, Georgi Karadzhov, Tsvetomila Mihaylova, Mitra Mohtarami, and James Glass. 2019. Automatic Fact-Checking Using Context and Discourse Information. J. Data and Information Quality 11, 3, Article 12 (2019), 27 pages.
- Checco et al. (2017) Alessandro Checco, Kevin Roitero, Eddy Maddalena, Stefano Mizzaro, and Gianluca Demartini. 2017. Let’s Agree to Disagree: Fixing Agreement Measures for Crowdsourcing. In Proceedings of HCOMP. 11–20.
- Conroy et al. (2015) Niall J Conroy, Victoria L Rubin, and Yimin Chen. 2015. Automatic Deception Detection: Methods for Finding Fake News. Proceedings of the Association for Information Science and Technology 52, 1 (2015), 1–4.
- Craswell et al. (2008) Nick Craswell, Onno Zoeter, Michael Taylor, and Bill Ramsey. 2008. An Experimental Comparison of Click Position-Bias Models. In Proceedings of WSDM. 87–94.
- Cuzzocrea et al. (2019) Alfredo Cuzzocrea, Francesco Bonchi, and Dimitrios Gunopulos (Eds.). 2019. Proceedings of the CIKM 2018 Workshops co-located with 27th ACM CIKM. CEUR Workshop Proceedings, Vol. 2482. CEUR-WS.org.
- Dunn (1964) Olive Jean Dunn. 1964. Multiple Comparisons Using Rank Sums. Technometrics 6, 3 (1964), 241–252.
- Eickhoff (2018) Carsten Eickhoff. 2018. Cognitive Biases in Crowdsourcing. In Proceedings of WSDM. 162–170.
- Elsayed et al. (2019) Tamer Elsayed, Preslav Nakov, Alberto Barrón-Cedeño, Maram Hasanain, Reem Suwaileh, Giovanni Da San Martino, and Pepa Atanasova. 2019. Overview of the CLEF-2019 CheckThat! Lab: Automatic Identification and Verification of Claims. In Proceedings of CLEF. 301–321.
- Frederick (2005) Shane Frederick. 2005. Cognitive Reflection and Decision Making. Journal of Economic Perspectives 19, 4 (December 2005), 25–42.
- Fuhr (2018) Norbert Fuhr. 2018. Some Common Mistakes In IR Evaluation, And How They Can Be Avoided. SIGIR Forum 51, 3 (2018), 32–41.
- Gencheva et al. (2017) Pepa Gencheva, Preslav Nakov, Lluís Màrquez, Alberto Barrón-Cedeño, and Ivan Koychev. 2017. A Context-Aware Approach for Detecting Worth-Checking Claims in Political Debates. In Proceedings of the International Conference Recent Advances in Natural Language Processing, (RANLP’17). 267–276.
- Ghosh et al. (2015) Aniruddha Ghosh, Guofu Li, Tony Veale, Paolo Rosso, Ekaterina Shutova, John Barnden, and Antonio Reyes. 2015. SemEval-2015 Task 11: Sentiment Analysis of Figurative Language in Twitter. In Proceedings of SemEval. 470–478.
- Graham et al. (2015) Yvette Graham, Timothy Baldwin, and Nitika Mathur. 2015. Accurate Evaluation of Segment-level Machine Translation Metrics. In Proceedings of NAACL-HLT. 1183–1191.
- Han et al. (2019a) Lei Han, Kevin Roitero, Ujwal Gadiraju, Cristina Sarasua, Alessandro Checco, Eddy Maddalena, and Gianluca Demartini. 2019a. The Impact of Task Abandonment in Crowdsourcing. IEEE Transactions on Knowledge and Data Engineering (2019), 1–1.
- Han et al. (2019b) Lei Han, Kevin Roitero, Eddy Maddalena, Stefano Mizzaro, and Gianluca Demartini. 2019b. On Transforming Relevance Scales. In Proceedings of CIKM. 39–48.
- Hube et al. (2019) Christoph Hube, Besnik Fetahu, and Ujwal Gadiraju. 2019. Understanding and Mitigating Worker Biases in the Crowdsourced Collection of Subjective Judgments. In Proceedings of CHI. 12.
- Joachims et al. (2005) Thorsten Joachims, Laura Granka, Bing Pan, Helene Hembrooke, and Geri Gay. 2005. Accurately Interpreting Clickthrough Data as Implicit Feedback. In Proceedings of SIGIR. 154–161.
- Kando (2008) Noriko Kando (Ed.). 2008. Proceedings of the 7th NTCIR Workshop Meeting on Evaluation of Information Access Technologies: Information Retrieval, Question Answering and Clross-Lingual Information Access, NTCIR-7. NII.
- Kelly and Azzopardi (2015) Diane Kelly and Leif Azzopardi. 2015. How Many Results per Page? A Study of SERP Size, Search Behavior and User Experience. In Proceedings of SIGIR. 183–192.
- Kim et al. (2019) Jooyeon Kim, Dongkwan Kim, and Alice Oh. 2019. Homogeneity-Based Transmissive Process to Model True and False News in Social Networks. 348–356.
- Kriplean et al. (2014) Travis Kriplean, Caitlin Bonnar, Alan Borning, Bo Kinney, and Brian Gill. 2014. Integrating On-demand Fact-checking with Public Dialogue. In Proceedings of CSCW. 1188–1199.
- Krippendorff (2011) Klaus Krippendorff. 2011. Computing Krippendorff’s Alpha-Reliability. (2011).
- Kruskal and Wallis (1952) William H Kruskal and W Allen Wallis. 1952. Use of Ranks in One-criterion Variance Analysis. Journal of the American statistical Association 47, 260 (1952).
- La Barbera et al. (2020) David La Barbera, Kevin Roitero, Damiano Spina, Stefano Mizzaro, and Gianluca Demartini. 2020. Crowdsourcing Truthfulness: The Impact of Judgment Scale and Assessor Bias. In Proceedings of ECIR. 207–214.
- Maddalena et al. (2018) Eddy Maddalena, Davide Ceolin, and Stefano Mizzaro. 2018. Multidimensional News Quality: A Comparison of Crowdsourcing and Nichesourcing, See Cuzzocrea et al. (2019).
- Maddalena et al. (2017a) Eddy Maddalena, Stefano Mizzaro, Falk Scholer, and Andrew Turpin. 2017a. On Crowdsourcing Relevance Magnitudes for Information Retrieval Evaluation. ACM Transactions on Information Systems 35, 3, Article 19 (2017), 32 pages.
- Maddalena et al. (2017b) Eddy Maddalena, Kevin Roitero, Gianluca Demartini, and Stefano Mizzaro. 2017b. Considering Assessor Agreement in IR Evaluation. In Proceedings of ICTIR. 75–82.
- Mathur et al. (2017) Nitika Mathur, Timothy Baldwin, and Trevor Cohn. 2017. Sequence Effects in Crowdsourced Annotations. In Proceedings of EMNLP. 2860–2865.
- Mihaylova et al. (2019) Tsvetomila Mihaylova, Georgi Karadjov, Pepa Atanasova, Ramy Baly, Mitra Mohtarami, and Preslav Nakov. 2019. SemEval-2019 Task 8: Fact Checking in Community Question Answering Forums. In Proceedings of SemEval. 860–869.
- Nakov et al. (2018) Preslav Nakov, Alberto Barrón-Cedeño, Tamer Elsayed, Reem Suwaileh, Lluís Màrquez, Wajdi Zaghouani, Pepa Atanasova, Spas Kyuchukov, and Giovanni Da San Martino. 2018. Overview of the CLEF-2018 CheckThat! Lab on Automatic Identification and Verification of Political Claims. In Proceedings of CLEF. 372–387.
- Otterbacher et al. (2017) Jahna Otterbacher, Jo Bates, and Paul Clough. 2017. Competent Men and Warm Women: Gender Stereotypes and Backlash in Image Search Results. In Proceedings of CHI. 6620–6631.
- Pennycook and Rand (2018) Gordon Pennycook and David G Rand. 2018. Who Falls for Fake News? The Roles of Bullshit Receptivity, Overclaiming, Familiarity, and Analytic Thinking. Journal of Personality (2018), 63.
- Pennycook and Rand (2019a) Gordon Pennycook and David G Rand. 2019a. Fighting Misinformation on Social Media Using Crowdsourced Judgments of News Source Quality. Proceedings of the National Academy of Sciences 116, 7 (2019), 2521–2526.
- Pennycook and Rand (2019b) Gordon Pennycook and David G Rand. 2019b. Lazy, Not Biased: Susceptibility to Partisan Fake News Is Better Explained by Lack of Reasoning than by Motivated Reasoning. Cognition 188 (2019), 39–50.
- Popat (2019) Kashyap Kiritbhai Popat. 2019. Credibility Analysis of Textual Claims with Explainable Evidence. Ph.D. Dissertation. Saarland University.
- Roitero et al. (2018a) Kevin Roitero, Gianluca Demartini, Stefano Mizzaro, and Damiano Spina. 2018a. How Many Truth Levels? Six? One Hundred? Even More? Validating Truthfulness of Statements via Crowdsourcing, See Cuzzocrea et al. (2019).
- Roitero et al. (2018b) Kevin Roitero, Eddy Maddalena, Gianluca Demartini, and Stefano Mizzaro. 2018b. On Fine-Grained Relevance Scales. In Proceedings of SIGIR. 675–684.
- Ruchansky et al. (2017) Natali Ruchansky, Sungyong Seo, and Yan Liu. 2017. CSI: A Hybrid Deep Model for Fake News Detection. In Proceedings of CIKM. 797–806.
- Ruxton and Beauchamp (2008) Graeme D Ruxton and Guy Beauchamp. 2008. Time for Some A Priori Thinking About Post Hoc Testing. Behavioral ecology 19, 3 (2008), 690–693.
- Satterthwaite (1946) Franklin E Satterthwaite. 1946. An Approximate Distribution of Estimates of Variance Components. Biometrics bulletin 2, 6 (1946), 110–114.
- Schultz (1985) Brian B Schultz. 1985. Levene’s Test for Relative Variation. Systematic Zoology 34, 4 (1985), 449–456.
- Shapiro and Francia (1972) Samuel S Shapiro and RS Francia. 1972. An Approximate Analysis of Variance Test for Normality. J. Amer. Statist. Assoc. 67, 337 (1972), 215–216.
- Singhania et al. (2017) Sneha Singhania, Nigel Fernandez, and Shrisha Rao. 2017. 3HAN: A Deep Neural Network for Fake News Detection. In Proceedings of the International Conference on Neural Information Processing (ICONIP’17). Springer, 572–581.
- Tchechmedjiev et al. (2019) Andon Tchechmedjiev, Pavlos Fafalios, Katarina Boland, Malo Gasquet, Matthäus Zloch, Benjamin Zapilko, Stefan Dietze, and Konstantin Todorov. 2019. ClaimsKG: A Knowledge Graph of Fact-Checked Claims. In Proceedings of the International Semantic Web Conference. 309–324.
- Vasileva et al. (2019) Slavena Vasileva, Pepa Atanasova, Lluís Màrquez, Alberto Barrón-Cedeño, and Preslav Nakov. 2019. It Takes Nine to Smell a Rat: Neural Multi-Task Learning for Check-Worthiness Prediction. In Proceedings of Recent Advances in Natural Language Processing (RANLP’19). 1229–1239.
- Vlachos and Riedel (2014) Andreas Vlachos and Sebastian Riedel. 2014. Fact Checking: Task Definition and Dataset Construction. In Proceedings of the ACL 2014 Workshop on Language Technologies and Computational Social Science. 18–22.
- Vo and Lee (2018) Nguyen Vo and Kyumin Lee. 2018. The Rise of Guardians: Fact-checking URL Recommendation to Combat Fake News. In Proceedings of SIGIR. 275–284.
- Vo and Lee (2019) Nguyen Vo and Kyumin Lee. 2019. Learning from Fact-Checkers: Analysis and Generation of Fact-Checking Language. In Proceedings of SIGIR. 335–344.
- Vosoughi et al. (2018) Soroush Vosoughi, Deb Roy, and Sinan Aral. 2018. The Spread of True and False News Online. Science 359, 6380 (2018), 1146–1151.
- Wang (2017) William Yang Wang. 2017. “Liar, Liar Pants on Fire”: A New Benchmark Dataset for Fake News Detection. In Proceedings of ACL. 422–426.
- Wang et al. (2018) Yaqing Wang, Fenglong Ma, Zhiwei Jin, Ye Yuan, Guangxu Xun, Kishlay Jha, Lu Su, and Jing Gao. 2018. EANN: Event Adversarial Neural Networks for Multi-modal Fake News Detection. In Proceedings of KDD. 849–857.
- You et al. (2019) Di You, Nguyen Vo, Kyumin Lee, and Qiang LIU. 2019. Attributed Multi-Relational Attention Network for Fact-Checking URL Recommendation. In Proceedings of CIKM. 1471–1480.
- Zubiaga and Ji (2014) Arkaitz Zubiaga and Heng Ji. 2014. Tweet, but Verify: Epistemic Study of Information Verification on Twitter. Social Network Analysis and Mining 4, 1 (2014), 1–12.