Microscale Marangoni Surfers
Abstract
We apply laser light to induce the asymmetric heating of Janus colloids adsorbed at water-oil interfaces and realize active micrometric ”Marangoni surfers”. The coupling of temperature and surfactant concentration gradients generates Marangoni stresses leading to self-propulsion. Particle velocities span four orders of magnitude, from microns/s to cm/s, depending on laser power and surfactant concentration. Experiments are rationalized by finite elements simulations, defining different propulsion regimes relative to the magnitude of the thermal and solutal Marangoni stress components.
Microscale active materials constituted by ensembles of self-propelling colloidal particles offer tremendous opportunities for fundamental studies on systems far from equilibrium and for the development of disruptive technologies Bechinger et al. (2016). Central to their functions is the ability to convert uniformly distributed sources of energy, i.e. under the form of chemical fuel or external driving fields, into net motion thanks to built-in asymmetry in their geometry or composition. Both from a modeling and a control perspective, minimalistic designs are particularly appealing. In such designs, the complexity of the particles is kept to a minimum, while still enabling functionality and the emergence of novel physical behaviors. The simplest case is the one of active Janus microspheres, i.e. colloidal beads equipped with a surface patch of a different material, which exploit their broken symmetry to self-propel and yet reveal a broad range of complex phenomena, including dynamic clustering Buttinoni et al. (2013); Palacci et al. (2013), swarming Yan et al. (2016) and guided motion Simmchen et al. (2016).
Self-motility in Janus particles can derive from various mechanisms, from catalytic reactions Sanchez et al. (2015) to bubble propulsion Wang et al. (2017) and electrokinetic effects Gangwal et al. (2008). Among the available propulsion schemes, self-phoretic mechanisms have emerged as a standard Moran and Posner (2017). In self-phoresis, a particle propels with a velocity that is proportional to a self-generated gradient via a phoretic mobility coefficient Anderson (1989). Self-thermophoresis, whereby motion is induced by the asymmetric heating of light-absorbing Janus particles Jiang et al. (2010), is particularly interesting due to the unique properties of light as a source of self-propulsion Zemánek et al. (2019). Here, the propulsion velocity is , where both the thermophoretic mobility Braibanti et al. (2008) and the self-generated thermal gradient are independent of particle size Bregulla and Cichos (2015). The propulsion speed simply scales with incident illumination in a linear fashion, enabling robust possibilities for spatial and temporal motion control by light modulation Ilic et al. (2016); Qian et al. (2013); Bregulla et al. (2014).
However, direct self-thermophoresis in bulk liquids is not an efficient propulsion mechanism. Its molecular origin stems from particle-solvent interactions and the magnitude of is set by the temperature dependence of the particle(solid)-liquid interfacial energy Parola and Piazza (2004). Because the latter quantity depends weakly on temperature, thermophoretic mobilities are small. Typical values of are , leading to speeds of , i.e. just a few body-lengths per second for micrometric colloids, for an increase of the cap temperature () of , as confirmed by experiments Jiang et al. (2010); Bregulla and Cichos (2015); Bregulla et al. (2014) and theoretical predictions Bickel et al. (2013). A powerful way to improve the efficiency of thermal gradients for self-propulsion relies on coupling them to other gradients, such as asymmetric chemical gradients Buttinoni et al. (2012); Gomez-Solano et al. (2017).
In this Letter, by employing Janus particles at fluid-fluid interfaces, we couple thermal gradients to gradients of interfacial tension. Upon heating, controlled surface tension differences across the particle can lead to self-propulsion velocities up to staggering body-lengths per second, a vast increase over direct self-thermophoresis in bulk. This enhancement follows the fact that, in the presence of surface tension gradients, momentum conservation at the interface prescribes the existence of tangential stresses, called Marangoni stresses, defined as:
| (1) |
where is the interfacial tension, which is a function of temperature and surface excess concentration of a surface-active species . is the surface gradient operator, with the unit tensor and the normal to the interface. Here, we identify two sources of stress: temperature and surface excess concentration gradients, whose magnitude is set by and , respectively Ha and Lai (2001). Imposing a force balance on the particle’s surface and contact line yields
| (2) |
where is the bulk stress tensor, is the unit vector normal to the particle surface and is the unit vector tangential to the interface and normal to the contact line. Together with a no-slip boundary condition at the particle surface, Eq. (2) allows solving for the particle velocity imposed by the Marangoni stress Sup . For a characteristic interfacial tension difference , simple dimensional arguments lead to predicting a propulsion speed , where is an effective viscosity experienced by the particle straddling the interface. Considering thermal Marangoni effects (aka thermocapillarity) alone, the predicted self-propulsion speed is given by Würger (2014). Typical values of for oil-water interfaces are , leading to speeds , independent of particle size and indeed corresponding to body-lengths per second for microparticles, for and Würger (2014). The magnitude of is then able to set macroscopic objects in motion, as for instance shown for the propulsion of centimeter-sized objects Okawa et al. (2009) and the rotation of micro-gears suspended at a water-air interface Maggi et al. (2015). Similar considerations can be made for solutal Marangoni propulsion Lauga and Davis (2012); Masoud and Stone (2014), as popularized by camphor or soap “boats” releasing surfactant at one end Strutt (1890); Sur et al. (2019), or for the motion of active droplets Maass et al. (2016).
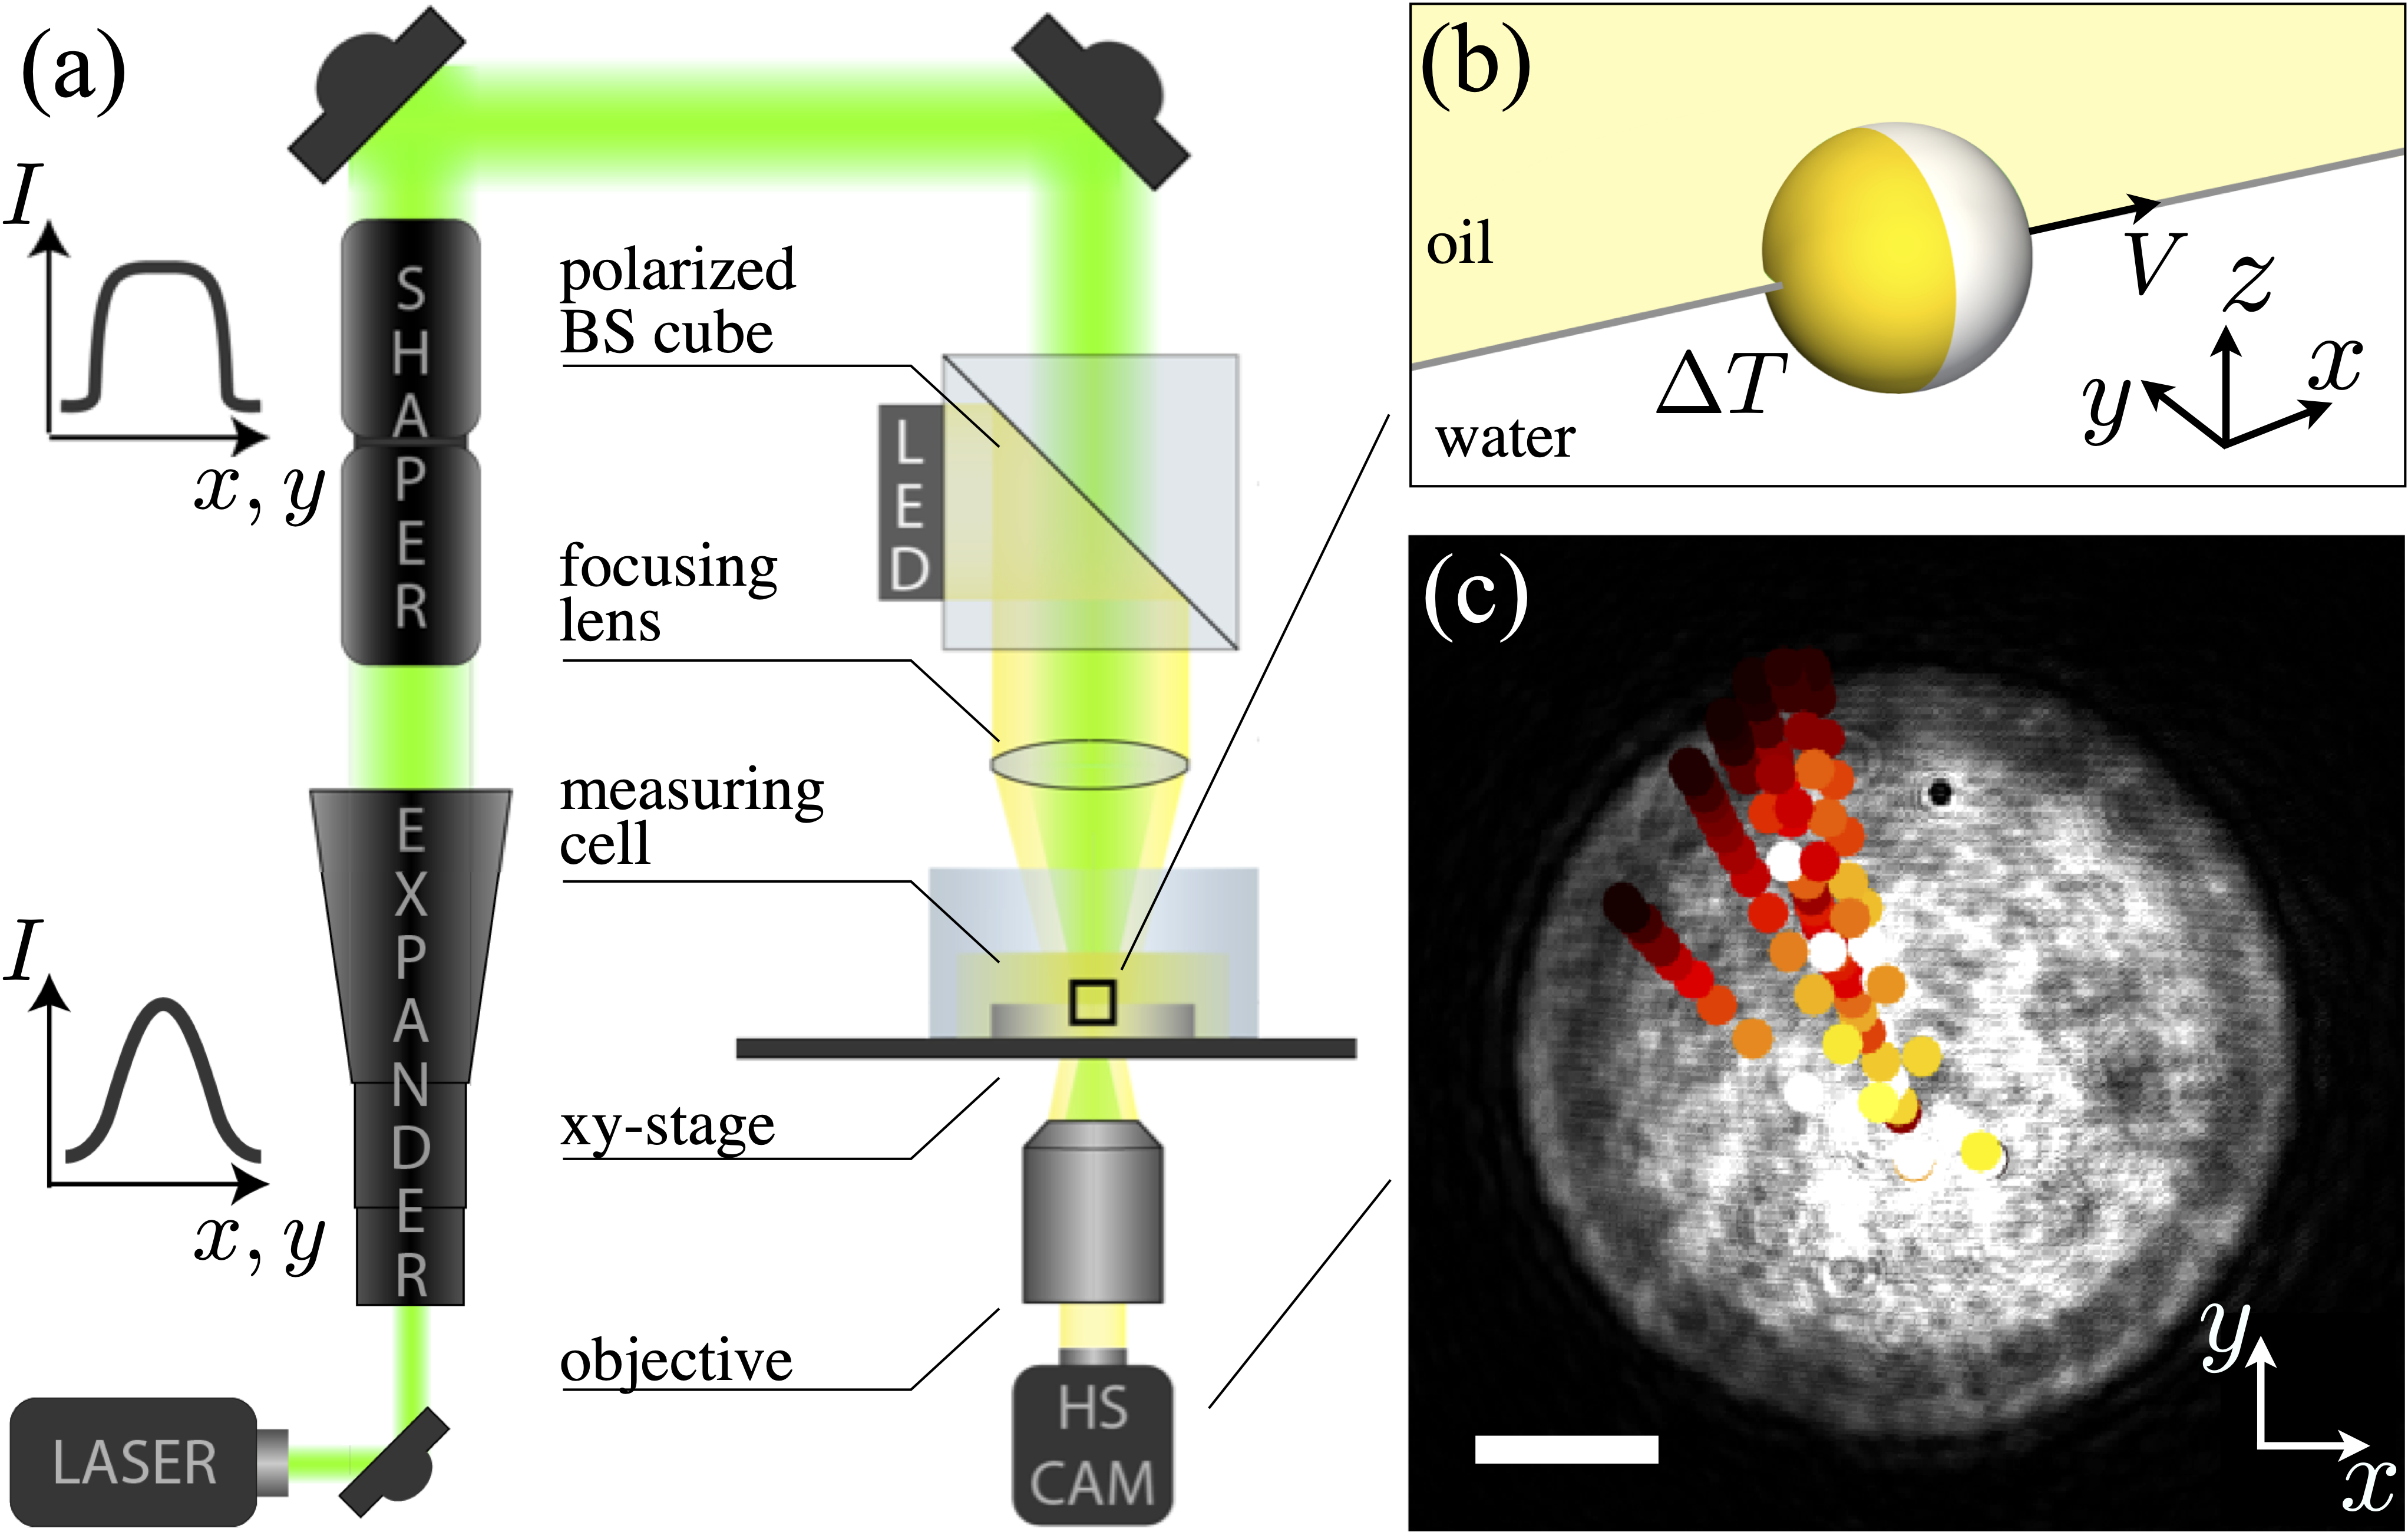
Our interfacial microswimmers, or “Marangoni surfers”, are Janus silica microparticles (radius , Microparticles GmbH) sputter-coated with a -thick hemisphere of gold (CCU-010, safematic) and confined at an interface between MilliQ water and dodecane (Arcos Organics, three-times purified through a basic alumina column). By pinning the lower aqueous phase to the sharp edges of a metal ring before adding a layer of dodecane, we achieve a macroscopically flat interface (area ) to which the particles are added via contacting the interface with a droplet of a diluted aqueous suspension (0.01 % w/v). The surface heterogeneity generated by the thick metallic caps effectively pins the Janus particles in random orientations with respect to the interface Adams et al. (2008); Wang et al. (2016), leading to caps typically crossing the interface (Figure S1 in Sup ). Asymmetric heating of the particles is achieved by illuminating them with green laser light (2W-CW, Coherent Verdi, ). In particular, we use beam-shaping optics to transform a Gaussian laser profile into a top-hat profile (Fig. 1(a)) focused onto the interface plane to provide localized, spatially uniform illumination with a power density up to Sup . Light absorption by the gold cap creates an asymmetric temperature profile around the particles Sup , thus generating Marangoni stresses that propel them with velocity and the Au cap oriented towards the back (Fig. 1(b)) Bickel et al. (2013). Trajectories are collected by positioning a particle in the center of the illuminated circular spot, turning the laser on at a given power density and recording images with a high-speed camera (AX 200 mini, Photron, up to 5000 fps) in a custom-built transmission microscope (Fig. 1(c)). From the high-speed time lapses, we extract particle coordinates and velocities via Matlab particle-tracking algorithms. Particles self-propel from the center towards the periphery of the light spot in random directions, depending on the cap orientation (Movie S1). As soon as the particles leave the laser spot, propulsion stops (Movie S2). Particle speed, as a function of laser illumination, reaches values up to .
In order to rationalize the phenomenology seen in the experiments, we perform systematic numerical simulations of the fluid dynamics of the system coupled to heat and mass transport of surfactants at the interface using an in-house finite element code (full details in Sup ). In particular, as an ansatz to quantify the Marangoni stresses introduced in Eq. (1), we assume that, in first approximation, the surface tension can be described by a linear function of and Homsy and Meiburg (1984):
| (3) |
where is the surface tension of the clean interface at the ambient temperature . and are the previously introduced parameters describing how the surface tension changes with and , respectively identified with and . Simulations were performed for Janus microparticles at a water-dodecane interface, where the model parameters were either known or taken from the literature Sup . The results include the temperature, surface excess concentration and velocity fields as a function of , which is the difference between the temperature of fluids in contact with the cap and , and the equilibrium surfactant concentration .
Starting from the case of a pristine interface (), in Fig. 2 we plot the simulated particle velocities as a function of (purple data). Here, we see that the speed increases roughly linearly with . A dimensional analysis reveals that for fixed material parameters and in the absence of surfactants, the problem can be described by a single dimensionless group, for which we choose the thermal Péclet number, defined by , where are the thermal diffusivities of each liquid. Isosurfaces of the dimensionless temperature fields for the clean interface are shown in Fig. 2 for K (top, left) and 20 K (top, right), respectively corresponding to the case of and . For , the problem is governed by thermal diffusion and the temperature fields can be described as a combination of a monopole and a dipole solution. As the cap heating increases, the particle speed, and thus , increase too, until convection starts affecting the temperature field, resulting in a stretched region of increased behind the particle. A direct comparison with existing theoretical analysis by Würger Würger (2014) shows very good agreement for the particle even in the high regime Sup .
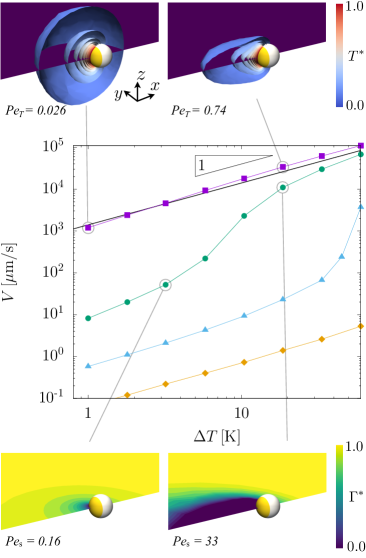
When we include the effect of surface-active species at the interface (green, blue and orange data), we obtain a markedly different behavior, which strongly depends on the value of . We reveal the existence of a regime showing a linear velocity increase for low values of , which expands over to broader ranges of for increasing surfactant surface excess, i.e. from green to orange data. However, the corresponding velocities are several orders of magnitude lower than the ones for the clean interface, even for a surface excess concentration as low as . Interestingly, for this value of (green data), as grows, the particle speed goes through a transition regime and it converges towards the values for the clean interface. By increasing , this transition takes place at correspondingly higher .
In order to understand this behavior, we visualize the surface excess concentration fields around the particles and revert once more to dimensional analysis. As compared to the clean interface, we need to introduce two additional dimensionless groups: a surface Péclet number, defined , where is the surface diffusion coefficient, and the ratio between solutal and thermal Marangoni stresses, Bickel (2019). Since the surface diffusion coefficient can easily be two orders of magnitude lower than the thermal diffusion coefficient Wang et al. (2013), the transition happens at correspondingly lower , for which the surface excess concentration field starts to deviate significantly from the diffusion-dominated regime. The dimensionless surface excess concentration fields shown in Fig. 2 (bottom) reveal that, as the particle moves, a wake depleted of surfactants is created behind it. Therefore, the corresponding surface concentration gradient generates solutal Marangoni stresses that “work against” the thermal Marangoni stresses. The resulting particle velocity is caused by the balance between the two stress components as in Eq. (1), which explains the slowdown. The consequent transition to velocities purely dominated by thermal stresses happens because, at high , the surface excess concentration inside the depleted region becomes approximately zero. At this point, the maximum attainable solutal Marangoni stress, fixed by , is reached and becomes independent of temperature, or particle speed, afterwards. Conversely, the maximum thermal Marangoni stress is set by , which keeps growing as the temperature increases. At a given point, thermal Marangoni stresess dominate, and the presence of the surfactant becomes insignificant, so that the data in Fig. 2 for a clean interface sets an upper limit for the particle velocity at a given .
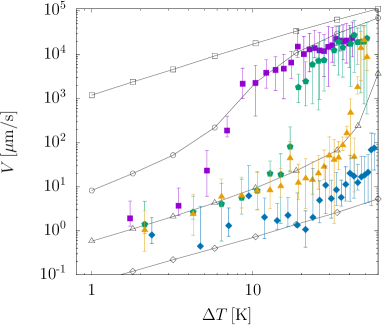
Starting from these numerical predictions, we closely examine the measured experimental particle speeds as a function of incident laser power, which we convert into a , leading to the data reported in Fig. 3. We perform the conversion by carefully calibrating the local heating of the fluids induced by the gold caps relative to the critical temperature of a water-lutidine mixture. We show a linear relation between the induced heating and incident laser power, as supported by theoretical estimates (see Supplemental Material Sup ). We first perform a series of measurements at an allegedly pristine water-dodecane interface. The purple data show a behavior consistent with the scenario reported by the simulations, where, in spite of all efforts for cleanliness, solutal effects are always present. For comparison, the simulation results are also plotted (empty symbols) and the experimental behavior can be reconciled by introducing a surface excess concentration of order . These minute values of correspond to unavoidable environmental trace contaminations Liu et al. (2019); Maali et al. (2017); Manor et al. (2008), which have a hardly measurable effect on the absolute level of the surface tension. However, as low as the absolute levels are, gradients of the surface excess concentration can still significantly alter the hydrodynamics in sensitive experiments, especially at small length scales, where Marangoni stresses become increasingly important Brennen (2014).
To confirm the role played by surface-active species, we purposely add controlled amounts of a water-soluble surfactant (sodium dodecyl sulfate, SDS, Sigma Aldritch, ). The choice of SDS is motivated by the fact that it has a negligible surface viscosity, and thus we do not expect surface rheology to affect particle motion Zell et al. (2014). Consistently with the balance between the different components of Marangoni stresses, we observe that an increased amount of SDS causes a shift of the transition towards higher values of and an overall reduced particle velocity over the same window. To unify the experimental and numerical data, and to unequivocally show that the ratio between the solutal and thermal Marangoni stresses controls the transition between the two regimes, we can rescale the experimental and simulation data on a master curve as a function of the dimensionless number in Fig. 4. Below , the data clearly collapses onto a single curve, with a transition that happens at for all the data shown. We remark that the data only collapses for ; for larger values of the role of the solutal Marangoni stresses becomes insignificant and is rescaled by alone.
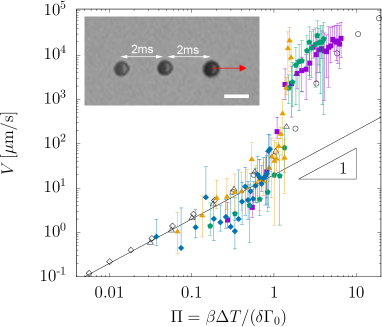
The understanding and rationalization of the experimental data opens up exciting opportunities for the exploitation of Marangoni stresses in self-propelled, active microscale systems. The green and purple data in Figs. 3 and 4 show that the propulsion velocity of a microscale Marangoni surfer can be tuned over four orders of magnitude in a single experiment via the controlled balance between thermal and solutal effects. In particular, the fact that this huge dynamic range can be regulated simply by light enables unprecedented opportunities for the spatial and temporal modulation of self-propulsion. The existence of two distinct linear regimes at low and high allows fine-tuning of propulsion speed within two markedly different velocity ranges. At low velocities are on the order of , as typical for active Brownian particles. The simultaneous illumination of multiple particles with controlled light landscapes offers interesting options to modulate collective active motion. In the high regime, the particles move fully ballistically, with speeds reaching up to (Inset of Figs. 4), which had so far only been reported for bubble propulsion of microscale objects Sanchez et al. (2011). Moreover, the narrow transition region together with the steep velocity variation can give rise to rich dynamical behavior crossing between regions of low and high for active motion, where and are the Brownian translational and rotational diffusivities. Finally, the strong dependence of propulsion speed on interface contamination may be used as a sensitive characterization tool for the presence of surface-active species undetectable by macroscopic tensiometry methods.
In conclusion, from the demonstration of the first catalytically active particle onward Ismagilov et al. (2002), fluid interfaces have been offering a broad range of promising opportunities to realize new active systems Fei et al. (2017), exploiting the unique combination of strong vertical confinement Dietrich et al. (2017); Wang et al. (2015), specific interactions Dietrich et al. (2018) and highly efficient available propulsion sources. We expect that the near future will see further expansion, encompassing both fundamental studies and applications Yao et al. (2020).
Acknowledgements.
The authors thank M.A. Hulsen at the Eindhoven University of Technology (TU/e) for access to the TFEM software libraries, and A. Studart, M. Fiebig and E. Dufresne at ETH Zurich and A. Fink at the Adolphe Merkle Institute for access to instrumentation. J. Vermant at ETH Zurich and R. Piazza at Politecnico di Milano are acknowledged for insightful comments. N.J. acknowledges TOTAL S.A. for financial support. L.I and K.D acknowledge financial support from the ETH Research Grant ETH-16 15-1. L.I. and G.V. acknowledge financial support from the MCSA-ITN-ETN ”ActiveMatter” 812780.References
- Bechinger et al. (2016) C. Bechinger, R. Di Leonardo, H. Löwen, C. Reichhardt, G. Volpe, and G. Volpe, Rev. Mod. Phys. 88, 045006 (2016).
- Buttinoni et al. (2013) I. Buttinoni, J. Bialké, F. Kümmel, H. Löwen, C. Bechinger, and T. Speck, Phys. Rev. Lett. 110, 238301 (2013).
- Palacci et al. (2013) J. Palacci, S. Sacanna, A. P. Steinberg, D. J. Pine, and P. M. Chaikin, Science 339, 936 (2013).
- Yan et al. (2016) J. Yan, M. Han, J. Zhang, C. Xu, E. Luijten, and S. Granick, Nature Materials 15, 1095 (2016).
- Simmchen et al. (2016) J. Simmchen, J. Katuri, W. E. Uspal, M. N. Popescu, M. Tasinkevych, and S. Sánchez, Nature Communications 7 (2016).
- Sanchez et al. (2015) S. Sanchez, L. Soler, and J. Katuri, Angewandte Chemie - International Edition 54, 1414 (2015).
- Wang et al. (2017) R. Wang, W. Guo, X. Li, Z. Liu, H. Liu, and S. Ding, RSC Adv. 7, 42462 (2017).
- Gangwal et al. (2008) S. Gangwal, O. J. Cayre, M. Z. Bazant, and O. D. Velev, Phys. Rev. Lett. 100, 058302 (2008).
- Moran and Posner (2017) J. Moran and J. Posner, Annual Review of Fluid Mechanics 49, 511 (2017).
- Anderson (1989) J. L. Anderson, Annual Review of Fluid Mechanics 21, 61 (1989).
- Jiang et al. (2010) H.-R. Jiang, N. Yoshinaga, and M. Sano, Phys. Rev. Lett. 105, 268302 (2010).
- Zemánek et al. (2019) P. Zemánek, G. Volpe, A. Jonáš, and O. Brzobohatý, Adv. Opt. Photon. 11, 577 (2019).
- Braibanti et al. (2008) M. Braibanti, D. Vigolo, and R. Piazza, Phys. Rev. Lett. 100, 108303 (2008).
- Bregulla and Cichos (2015) A. P. Bregulla and F. Cichos, Faraday Discuss. 184, 381 (2015).
- Ilic et al. (2016) O. Ilic, I. Kaminer, Y. Lahini, H. Buljan, and M. Soljačić, ACS Photonics 3, 197 (2016).
- Qian et al. (2013) B. Qian, D. Montiel, A. Bregulla, F. Cichos, and H. Yang, Chem. Sci. 4, 1420 (2013).
- Bregulla et al. (2014) A. P. Bregulla, H. Yang, and F. Cichos, Acs Nano 8, 6542 (2014).
- Parola and Piazza (2004) A. Parola and R. Piazza, European Physical Journal E 15, 255 (2004).
- Bickel et al. (2013) T. Bickel, A. Majee, and A. Würger, Phys. Rev. E 88, 012301 (2013).
- Buttinoni et al. (2012) I. Buttinoni, G. Volpe, F. Kümmel, G. Volpe, and C. Bechinger, J. Phys.: Condens. Matter 24, 284129 (2012).
- Gomez-Solano et al. (2017) J. R. Gomez-Solano, S. Samin, C. Lozano, P. Ruedas-Batuecas, R. van Roij, and C. Bechinger, Scientific Reports 7 (2017).
- Ha and Lai (2001) V.-M. Ha and C.-L. Lai, Proceedings: Mathematical, Physical and Engineering Sciences 457, 885 (2001).
- (23) See Supplemental Material at [] for full experimental and numerical details. .
- Würger (2014) A. Würger, Journal of Fluid Mechanics 752, 589 (2014).
- Okawa et al. (2009) D. Okawa, S. Pastine, A. Zettl, and Fréchet, Journal of the American Chemical Society 131, 5396 (2009).
- Maggi et al. (2015) C. Maggi, F. Saglimbeni, M. Dipalo, F. De Angelis, and R. Di Leonardo, Nature Communications 6, 7855 (2015).
- Lauga and Davis (2012) E. Lauga and A. Davis, Journal of Fluid Mechanics 705, 120 (2012).
- Masoud and Stone (2014) H. Masoud and H. Stone, Journal of Fluid Mechanics 741, 1 (2014).
- Strutt (1890) R. J. Strutt, Proceedings of the Royal Society of London 47, 364 (1890).
- Sur et al. (2019) S. Sur, H. Masoud, and J. P. Rothstein, Physics of Fluids 31, 102101 (2019).
- Maass et al. (2016) C. Maass, C. Krüger, S. Herminghaus, and C. Bahr, Annual Review of Condensed Matter Physics 7, 171 (2016).
- Adams et al. (2008) D. J. Adams, S. Adams, J. Melrose, and A. C. Weaver, Colloids and Surfaces A: Physicochemical and Engineering Aspects 317, 360 (2008).
- Wang et al. (2016) X. Wang, M. In, C. Blanc, P. Malgaretti, M. Nobili, and A. Stocco, Faraday Discuss. 191, 305 (2016).
- Homsy and Meiburg (1984) G. Homsy and E. Meiburg, Journal of Fluid Mechanics 139, 443 (1984).
- Bickel (2019) T. Bickel, European Physical Journal E 42, 16 (2019).
- Wang et al. (2013) D. Wang, L. Pevzner, C. Li, K. Peneva, C. Y. Li, D. Y. C. Chan, K. Müllen, M. Mezger, K. Koynov, and H.-J. Butt, Phys. Rev. E 87, 012403 (2013).
- Liu et al. (2019) B. Liu, R. Manica, Q. Liu, E. Klaseboer, Z. Xu, and G. Xie, Physical Review Letters 122, 194501 (2019).
- Maali et al. (2017) A. Maali, R. Boisgard, H. Chraibi, Z. Zhang, H. Kellay, and A. Würger, Physical Review Letters 118, 1 (2017).
- Manor et al. (2008) O. Manor, I. Vakarelski, X. Tang, S. O’Shea, G. Stevens, F. Grieser, R. Dagastine, and D. Chan, Physical Review Letters 101, 024501 (2008).
- Brennen (2014) C. Brennen, Cavitation and Bubble Dynamics (Cambridge University Press, 2014).
- Zell et al. (2014) Z. A. Zell, A. Nowbahar, V. Mansard, L. G. Leal, S. S. Deshmukh, J. M. Mecca, C. J. Tucker, and T. M. Squires, Proceedings of the National Academy of Sciences 111, 3677 (2014).
- Sanchez et al. (2011) S. Sanchez, A. N. Ananth, V. M. Fomin, M. Viehrig, and O. G. Schmidt, Journal of the American Chemical Society 133, 14860 (2011).
- Ismagilov et al. (2002) R. Ismagilov, A. Schwartz, N. Bowden, and G. Whitesides, Angewandte Chemie - International Edition 41, 652 (2002).
- Fei et al. (2017) W. Fei, Y. Gu, and K. Bishop, Current Opinion in Colloid and Interface Science 32, 57 (2017).
- Dietrich et al. (2017) K. Dietrich, D. Renggli, M. Zanini, G. Volpe, I. Buttinoni, and L. Isa, New Journal of Physics 19, 065008 (2017).
- Wang et al. (2015) X. Wang, M. In, C. Blanc, M. Nobili, and A. Stocco, Soft Matter 11, 7376 (2015).
- Dietrich et al. (2018) K. Dietrich, G. Volpe, M. N. Sulaiman, D. Renggli, I. Buttinoni, and L. Isa, Phys. Rev. Lett. 120, 268004 (2018).
- Yao et al. (2020) T. Yao, N. G. Chisholm, E. B. Steager, and K. J. Stebe, Applied Physics Letters 116, 043702 (2020).